Financial markets weekly overview for February 5 – 11

We make up a weekly medium-term trade list based on CFTC reports and technical analysis.
The overview provides a description of the technical condition of the market on the most popular financial instruments, as well as information on the large speculators’ actions according to the last COT reports and the previous period.
If you want to use CFTC reports in your trading practice, you should understand that for an objective assessment of the situation it’s not enough to know the data of the last report. The dynamic is more important, in other words, comparing the statistics of large speculators’ actions in the current period with the previous one, so we mention both values.
Key topics
- Trade list for the current week
- E-Mini S&P500 (ESH18)
- Dollar Index (DXY)
- Euro (EURUSD)
- Swiss Franc (USDCHF)
- British Pound (GBPUSD)
- Japanese Yen (USDJPY)
- WTI Crude Oil (CLH18)
- Canadian Dollar (USDCAD)
- Gold (XAUUSD)
- Silver(XAGUSD)
- Australian Dollar (AUDUSD)
- New Zealand Dollar (NZDUSD)
- Russian rouble (USDRUB)
- Conclusions
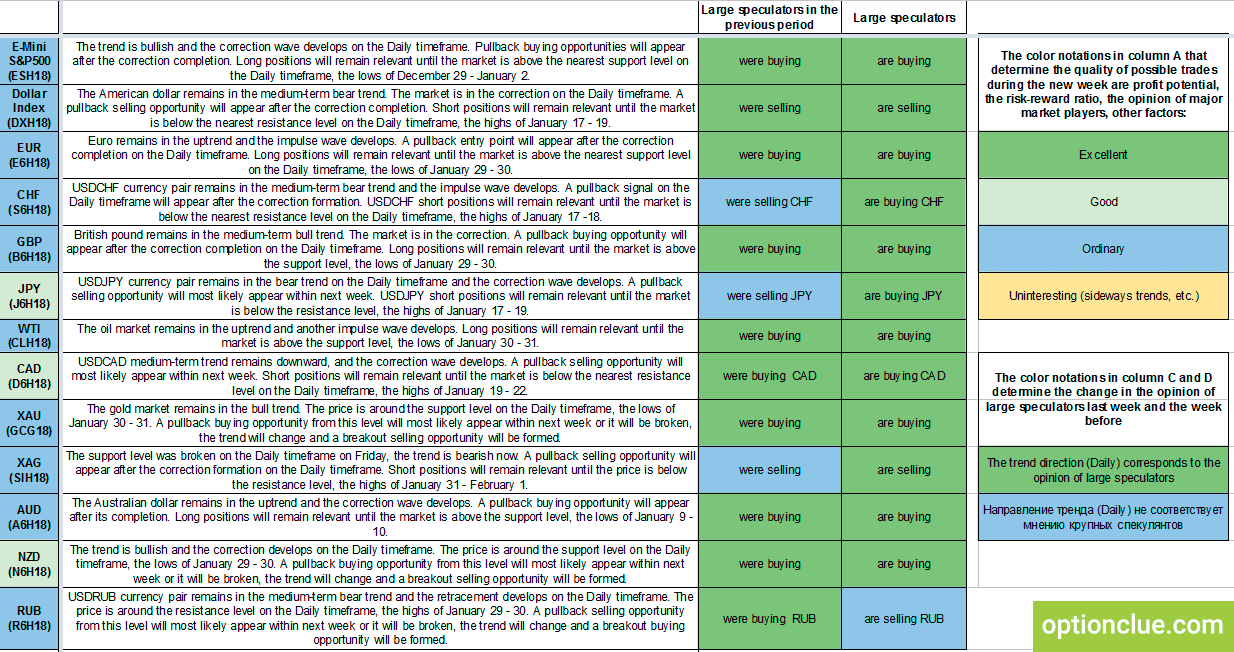
Trade list for the current week
| Asset | Comments | 5. 02 | 11. 02 |
|---|---|---|---|
| **E-Mini S&P500 (ESH18) | The trend is bullish and the correction wave develops on the Daily timeframe. Pullback buying opportunities will appear after the correction completion. Long positions will remain relevant until the market is above the nearest support level on the Daily timeframe, the lows of December 29 - January 2. | ||
| **Dollar Index (DXH18) | The American dollar remains in the medium-term bear trend. The market is in the correction on the Daily timeframe. A pullback selling opportunity will appear after the correction completion. Short positions will remain relevant until the market is below the nearest resistance level on the Daily timeframe, the highs of January 17 - 19. | ||
| **EUR (E6H18) | Euro remains in the uptrend and the impulse wave develops. A pullback entry point will appear after the correction completion on the Daily timeframe. Long positions will remain relevant until the market is above the nearest support level on the Daily timeframe, the lows of January 29 - 30. | ||
| **CHF (S6H18) | USDCHF currency pair remains in the medium-term bear trend and the impulse wave develops. A pullback signal on the Daily timeframe will appear after the correction formation. USDCHF short positions will remain relevant until the market is below the nearest resistance level on the Daily timeframe, the highs of January 17 -18. | ||
| **GBP (B6H18) | British pound remains in the medium-term bull trend. The market is in the correction. A pullback buying opportunity will appear after the correction completion on the Daily timeframe. Long positions will remain relevant until the market is above the support level, the lows of January 29 - 30. | ||
| **JPY (J6H18) | USDJPY currency pair remains in the bear trend on the Daily timeframe and the correction wave develops. A pullback selling opportunity will most likely appear within next week. USDJPY short positions will remain relevant until the market is below the resistance level, the highs of January 17 - 19. | ||
| **WTI (CLH18) | The oil market remains in the uptrend and another impulse wave develops. Long positions will remain relevant until the market is above the support level, the lows of January 30 - 31. | ||
| **CAD (D6H18) | USDCAD medium-term trend remains downward, and the correction wave develops. A pullback selling opportunity will most likely appear within next week. Short positions will remain relevant until the market is below the nearest resistance level on the Daily timeframe, the highs of January 19 - 22. | ||
| ***XAU (GCG18) | The gold market remains in the bull trend. The price is around the support level on the Daily timeframe, the lows of January 30 - 31. A pullback buying opportunity from this level will most likely appear within next week or it will be broken, the trend will change and a breakout selling opportunity will be formed. | ||
| ***XAG (SIH18) | The support level was broken on the Daily timeframe on Friday, the trend is bearish now. A pullback selling opportunity will appear after the correction formation on the Daily timeframe. Short positions will remain relevant until the price is below the resistance level, the highs of January 31 - February 1. | ||
| **AUD (A6H18) | The Australian dollar remains in the uptrend and the correction wave develops. A pullback buying opportunity will appear after its completion. Long positions will remain relevant until the market is above the support level, the lows of January 9 - 10. | ||
| ***NZD (N6H18) | The trend is bullish and the correction develops on the Daily timeframe. The price is around the support level on the Daily timeframe, the lows of January 29 - 30. A pullback buying opportunity from this level will most likely appear within next week or it will be broken, the trend will change and a breakout selling opportunity will be formed. | ||
| **RUB (R6H18) | USDRUB currency pair remains in the medium-term bear trend and the retracement develops on the Daily timeframe. The price is around the resistance level on the Daily timeframe, the highs of January 29 - 30. A pullback selling opportunity from this level will most likely appear within next week or it will be broken, the trend will change and a breakout buying opportunity will be formed. |
| The notation that determines the quality of possible trades during the new week are profit potential, the risk-reward ratio, the opinion of major market players, other factors: | |
| **** | Excellent |
| *** | Good |
| ** | Ordinary |
| * | Uninteresting (sideways trends, etc.) |
| The notation that determines the change in the opinion of large speculators, the direction of COT net position indicator in the reporting and prior periods are: | |
| large speculators are buying the asset specified in the first column | |
| large speculators are selling the asset specified in the first column | |
| the green color of the arrows means that the Daily trend direction corresponds to the opinion of large speculators | |
| the blue color of the arrows means that the Daily trend direction doesn’t correspond to the opinion of large speculators |
Trade list in a graphical format is available here.
If you want to get more information on the pullback trading tactics and other aspects of trading in the market, watch the «Horizontal levels in trading» video course.
E-Mini S&P500 (ESH18)
The trend is bullish and the correction wave develops on the Daily timeframe. Pullback buying opportunities will appear after the correction completion. Long positions will remain relevant until the market is above the nearest support level on the Daily timeframe, the lows of December 29 – January 2.
CFTC reports indicate that large speculators go on buying and the professionals’ opinion corresponds to the medium-term trend direction.
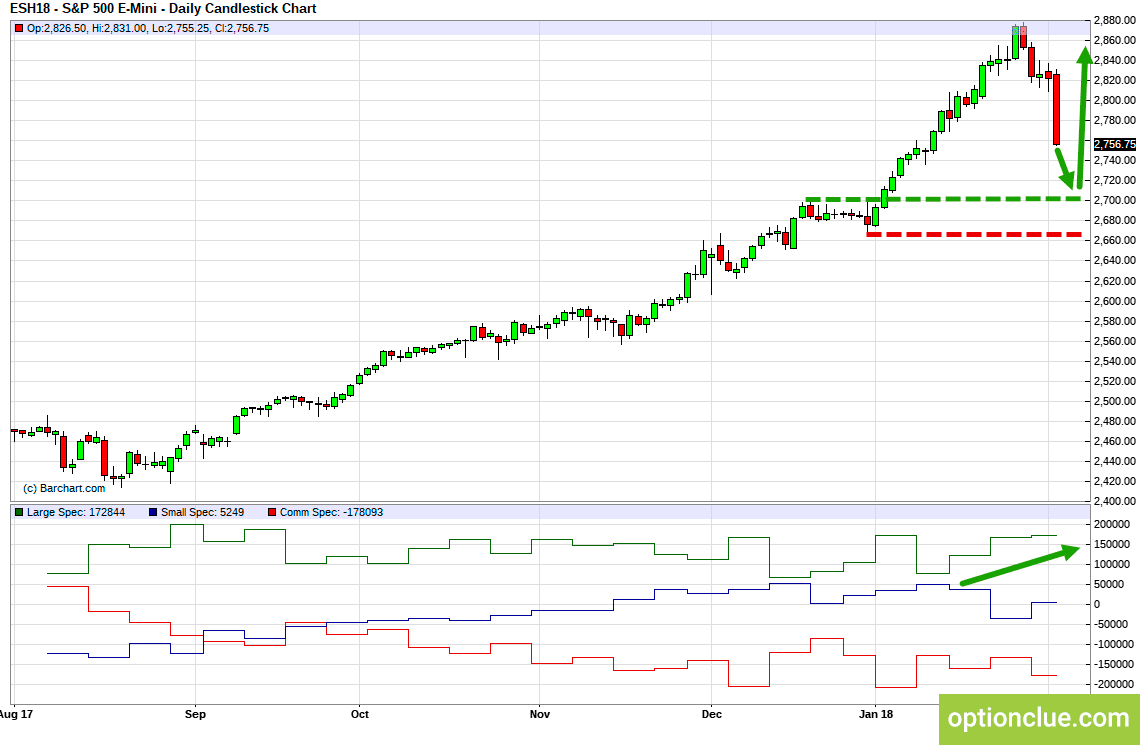
E-Mini S&P500 (ESH18). Technical analysis and COT net position indicator.
Dollar Index (DXY)
The American dollar remains in the medium-term bear trend. The market is in the correction on the Daily timeframe. A pullback selling opportunity will appear after the correction completion. Short positions will remain relevant until the market is below the nearest resistance level on the Daily timeframe, the highs of January 17 – 19.
CFTC reports indicate that large speculators go on selling dollar, hedgers are buying and the professionals’ opinion corresponds to the Daily trend direction.
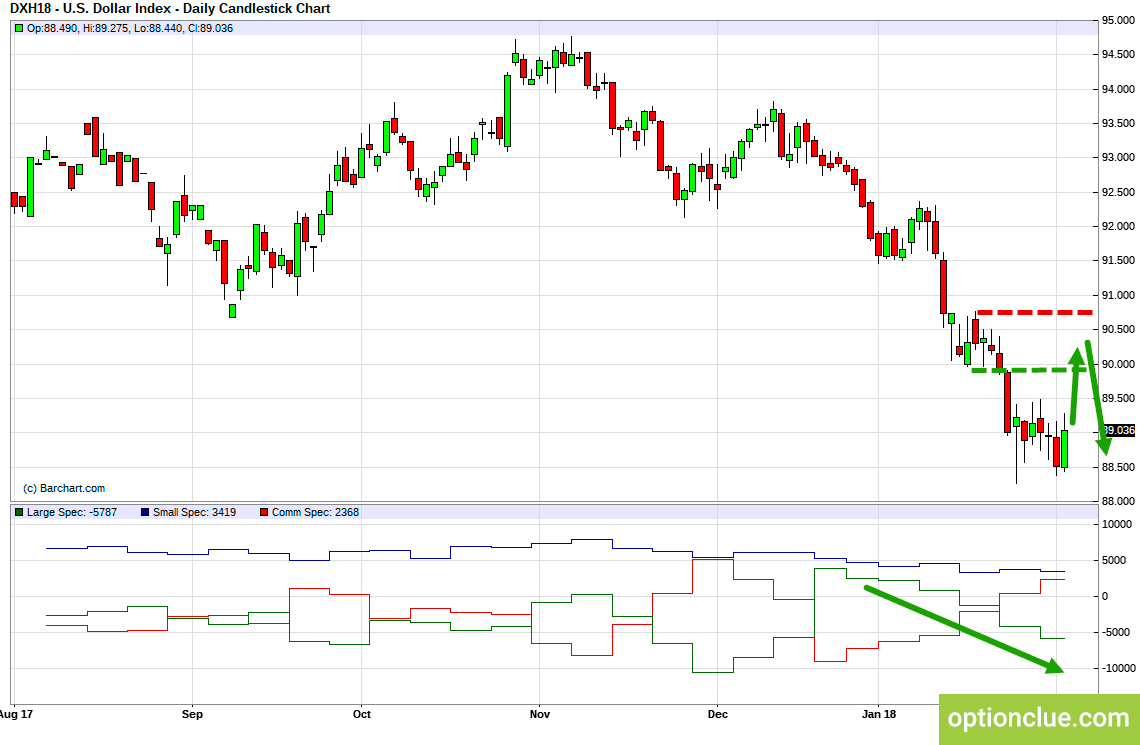
Dollar Index (DXY). Technical analysis and COT net position indicator.
Euro (EURUSD)
Euro remains in the uptrend and the impulse wave develops. A pullback entry point will appear after the correction completion on the Daily timeframe. Long positions will remain relevant until the market is above the nearest support level on the Daily timeframe, the lows of January 29 – 30.
COT indicator increases, large speculators go on buying Euro and the professionals’ opinion corresponds to the market technical picture.
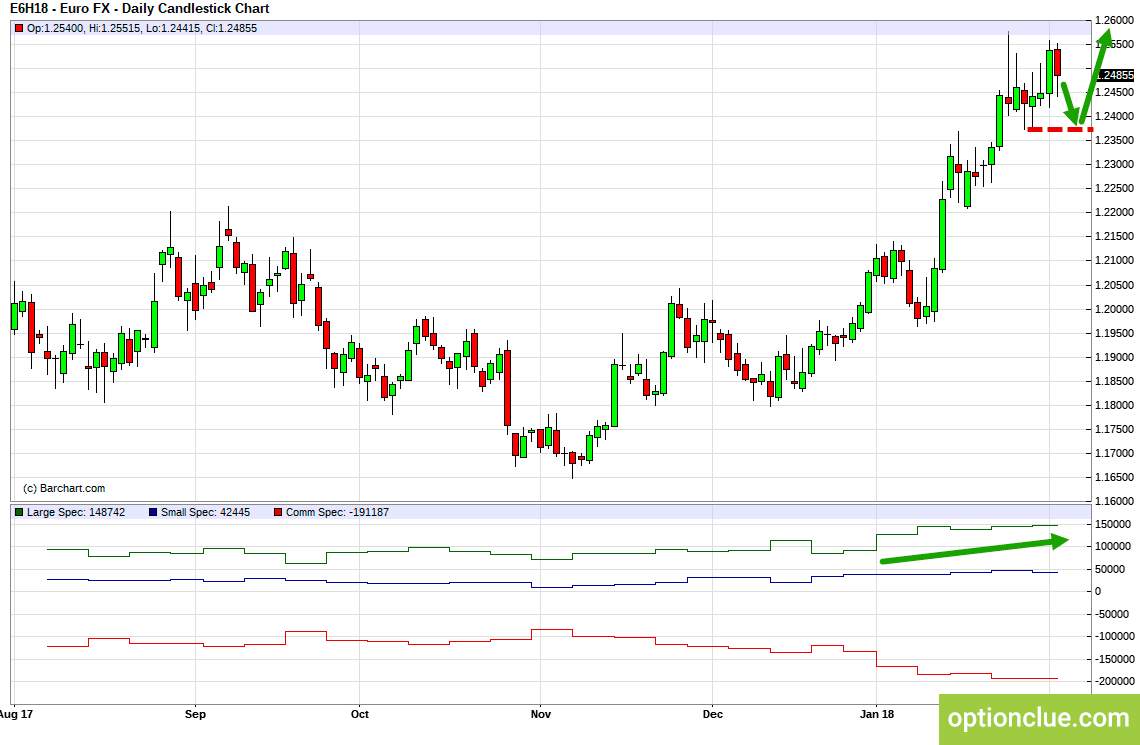
EURUSD. Technical analysis and COT net position indicator.
Swiss Franc (USDCHF)
USDCHF currency pair remains in the medium-term bear trend and the impulse wave develops. A pullback signal on the Daily timeframe will appear after the correction formation. USDCHF short positions will remain relevant until the market is below the nearest resistance level on the Daily timeframe, the highs of January 17 -18.
COT indicator reversed, large speculators began to buy franc and the professionals’ opinion corresponds to the Daily trend direction now.
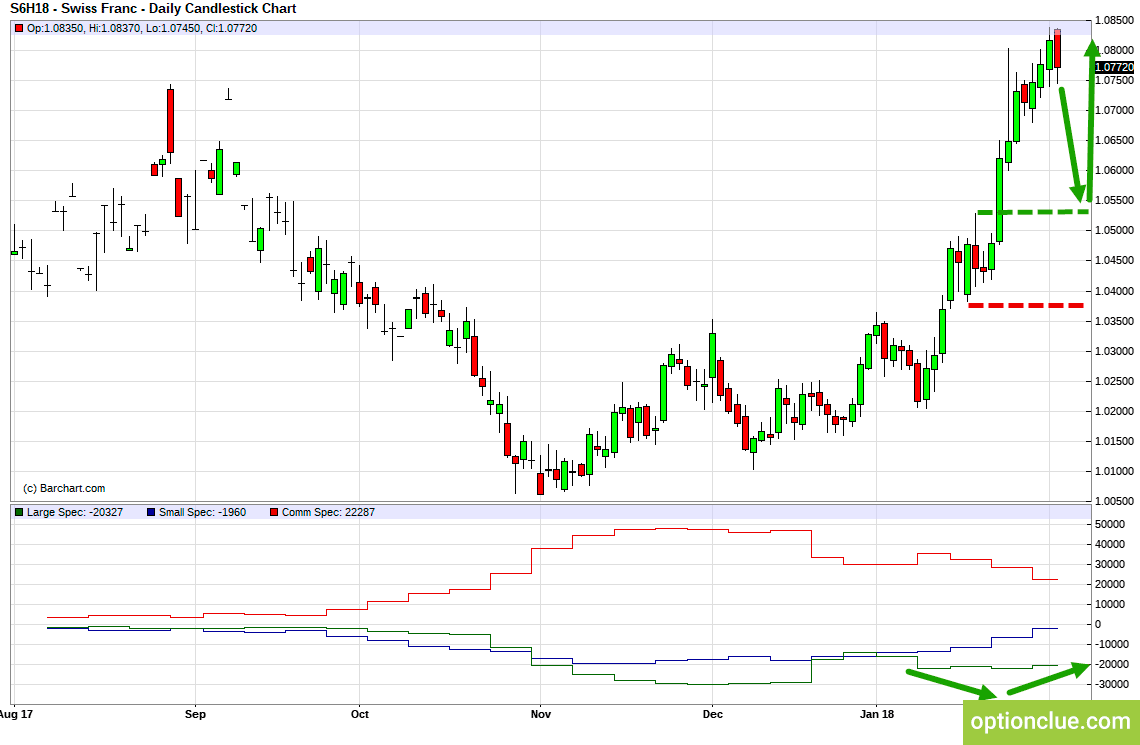
CHFUSD. Technical analysis and COT net position indicator.
British Pound (GBPUSD)
British pound remains in the medium-term bull trend. The market is in the correction. A pullback buying opportunity will appear after the correction completion on the Daily timeframe. Long positions will remain relevant until the market is above the support level, the lows of January 29 – 30.
COT indicator decreased but didn’t reverse. CFTC reports indicate that large speculators go on buying Pound and hedgers are selling and the professionals’ opinion corresponds to the Daily trend direction.
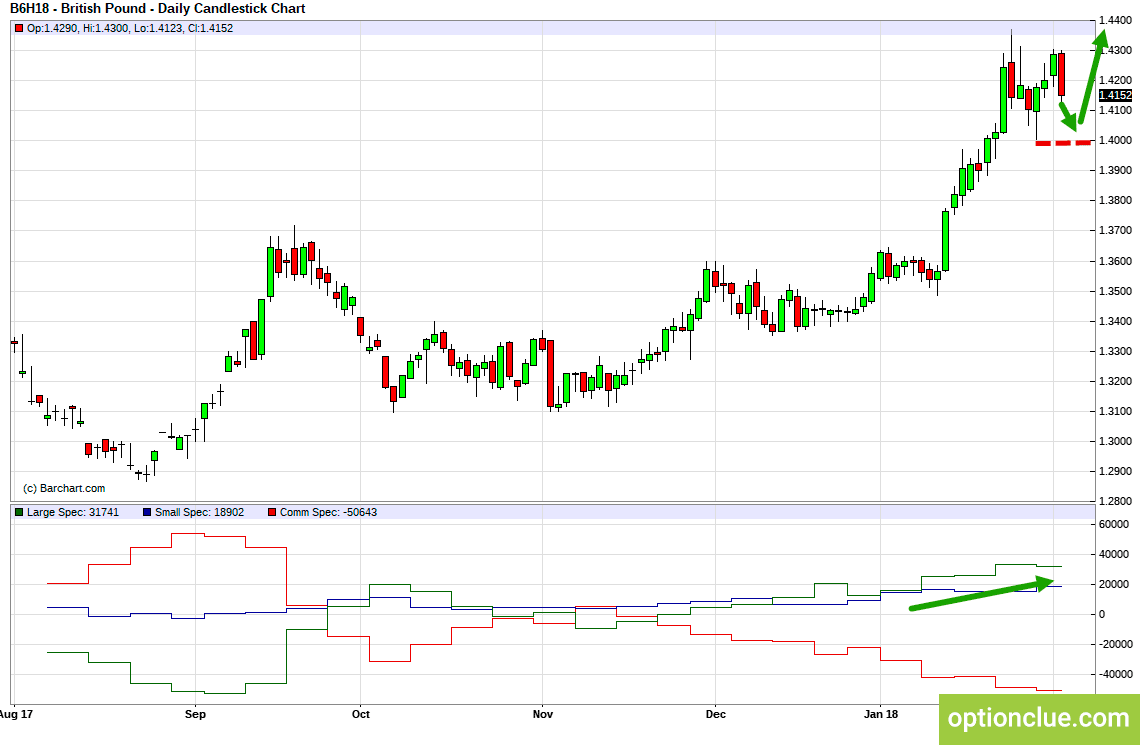
GBPUSD. Technical analysis and COT net position indicator.
Japanese Yen (USDJPY)
USDJPY currency pair remains in the bear trend on the Daily timeframe and the correction wave develops. A pullback selling opportunity will most likely appear within next week. USDJPY short positions will remain relevant until the market is below the resistance level, the highs of January 17 – 19.
COT indicator reversed, large speculators began to buy Yen and the professionals’ opinion corresponds to the Daily trend direction now.
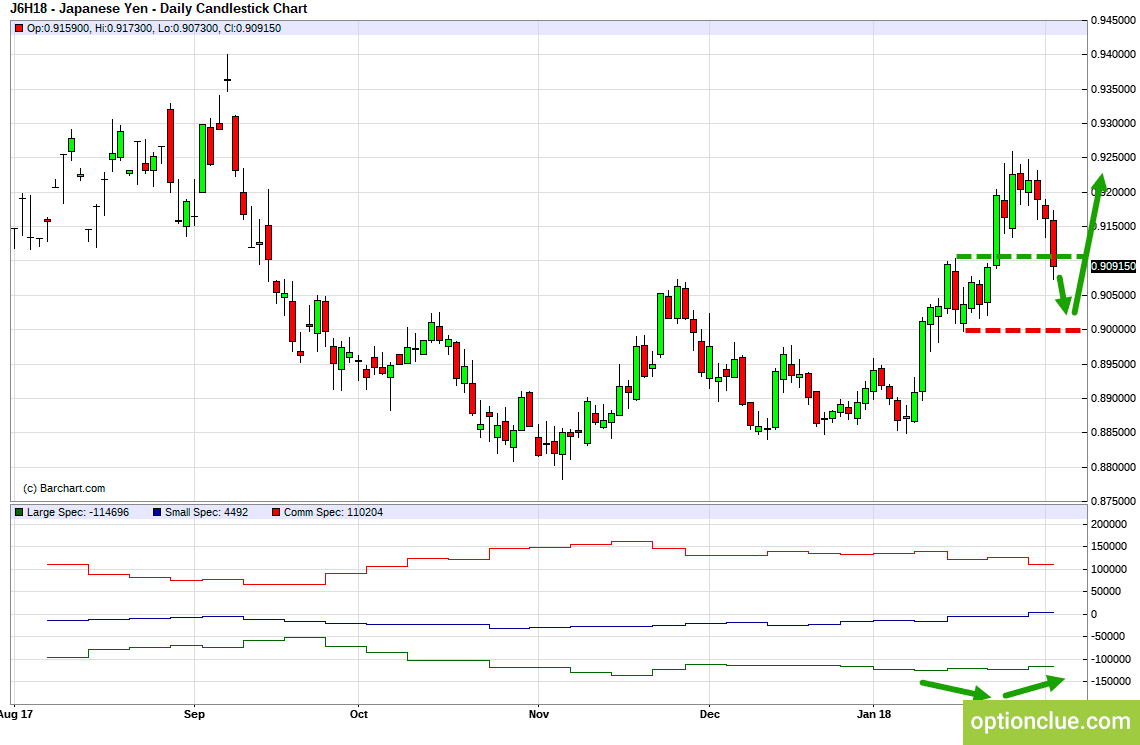
JPYUSD. Technical analysis and COT net position indicator.
WTI Crude Oil (CLH18)
The oil market remains in the uptrend and another impulse wave develops. Long positions will remain relevant until the market is above the support level, the lows of January 30 – 31.
COT net position indicator still increases along with the market. Professionals’ opinion corresponds to the Daily trend direction.
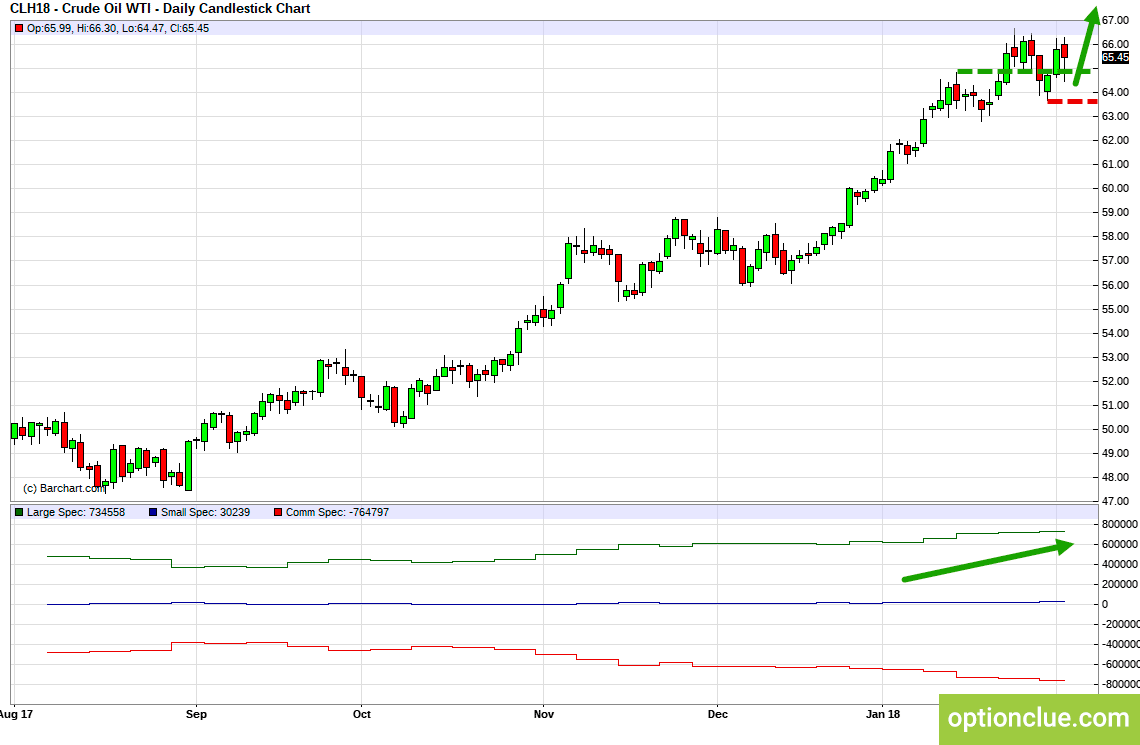
WTI Crude Oil (CLH18). Technical analysis and COT net position indicator.
Canadian Dollar (USDCAD)
USDCAD medium-term trend remains downward, and the correction wave develops. A pullback selling opportunity will most likely appear within next week. Short positions will remain relevant until the market is below the nearest resistance level on the Daily timeframe, the highs of January 19 – 22.
CFTC reports indicate that large speculators go on buying the Canadian dollar and hedgers are selling and the professionals’ opinion corresponds to the market technical picture.
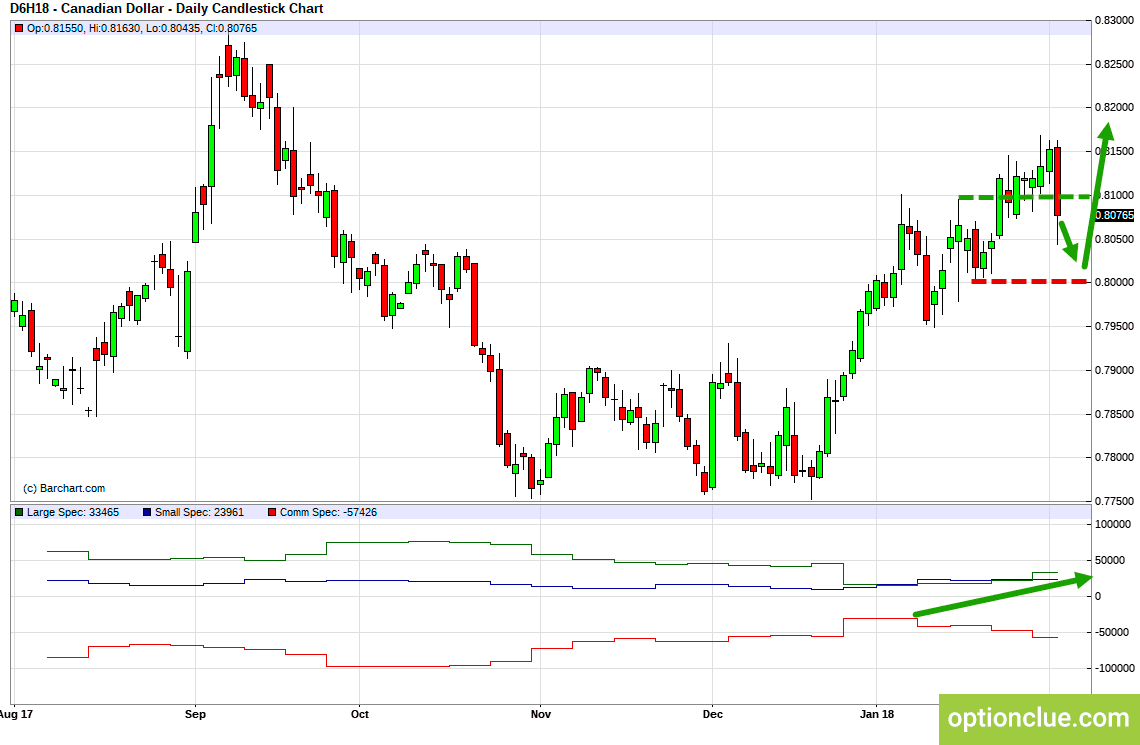
CADUSD. Technical analysis and COT net position indicator.
Gold (XAUUSD)
The gold market remains in the bull trend. The price is around the support level on the Daily timeframe, the lows of January 30 – 31. A pullback buying opportunity from this level will most likely appear within next week or it will be broken, the trend will change and a breakout selling opportunity will be formed.
COT indicator decreased but didn’t reverse and the professionals’ opinion corresponds to the technical picture.
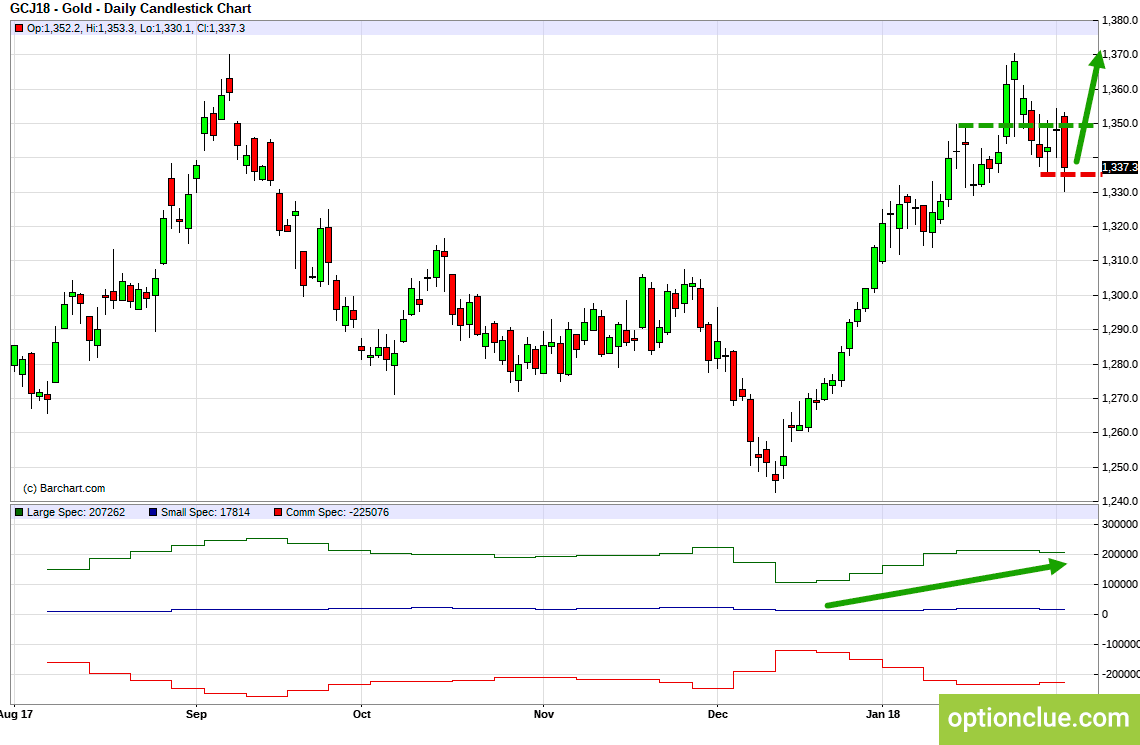
Gold (GCJ18). Technical analysis and COT net position indicator.
Silver (XAGUSD)
The support level was broken on the Daily timeframe on Friday, the trend is bearish now. A pullback selling opportunity will appear after the correction formation on the Daily timeframe. Short positions will remain relevant until the price is below the resistance level, the highs of January 31 – February 1.
At the same time CFTC reports indicate that large speculators go on selling and hedgers are buying. Professionals’ opinion corresponds to the technical picture.
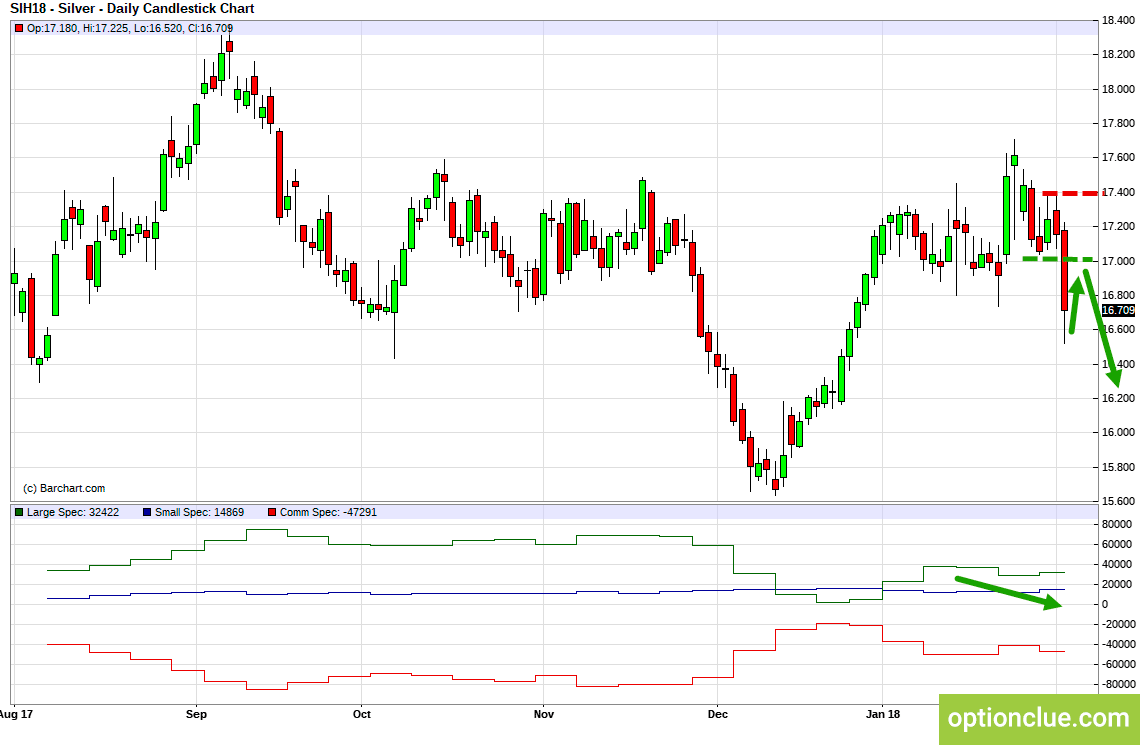
Silver (SIH18). Technical analysis and COT net position indicator.
Australian Dollar (AUDUSD)
The Australian dollar remains in the uptrend and the correction wave develops. A pullback buying opportunity will appear after its completion. Long positions will remain relevant until the market is above the support level, the lows of January 9 – 10.
COT net position indicator decreased but didn’t reverse. Large speculators are buying and hedgers are sel;ing. Professionals’ opinion corresponds to the Daily trend direction.
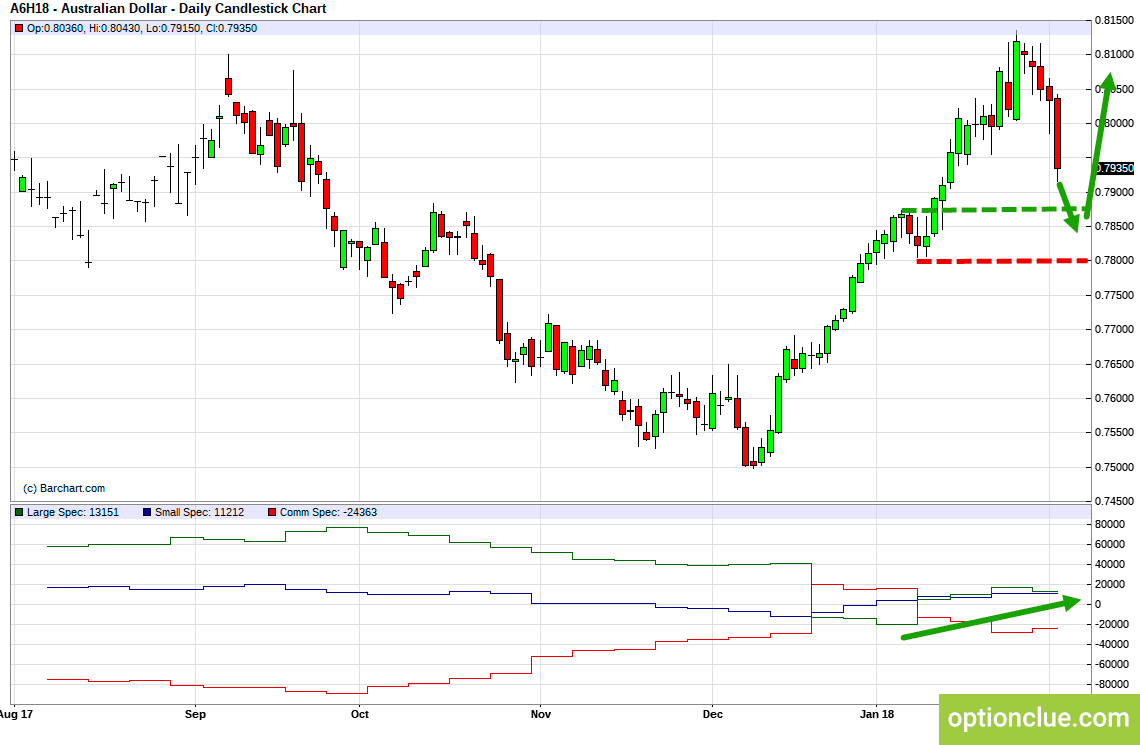
AUDUSD. Technical analysis and COT net position indicator.
New Zealand Dollar (NZDUSD)
The trend is bullish and the correction develops on the Daily timeframe. The price is around the support level on the Daily timeframe, the lows of January 29 – 30. A pullback buying opportunity from this level will most likely appear within next week or it will be broken, the trend will change and a breakout selling opportunity will be formed.
CFTC reports indicate that large speculators go on buying and the professionals’ opinion corresponds to the technical picture.
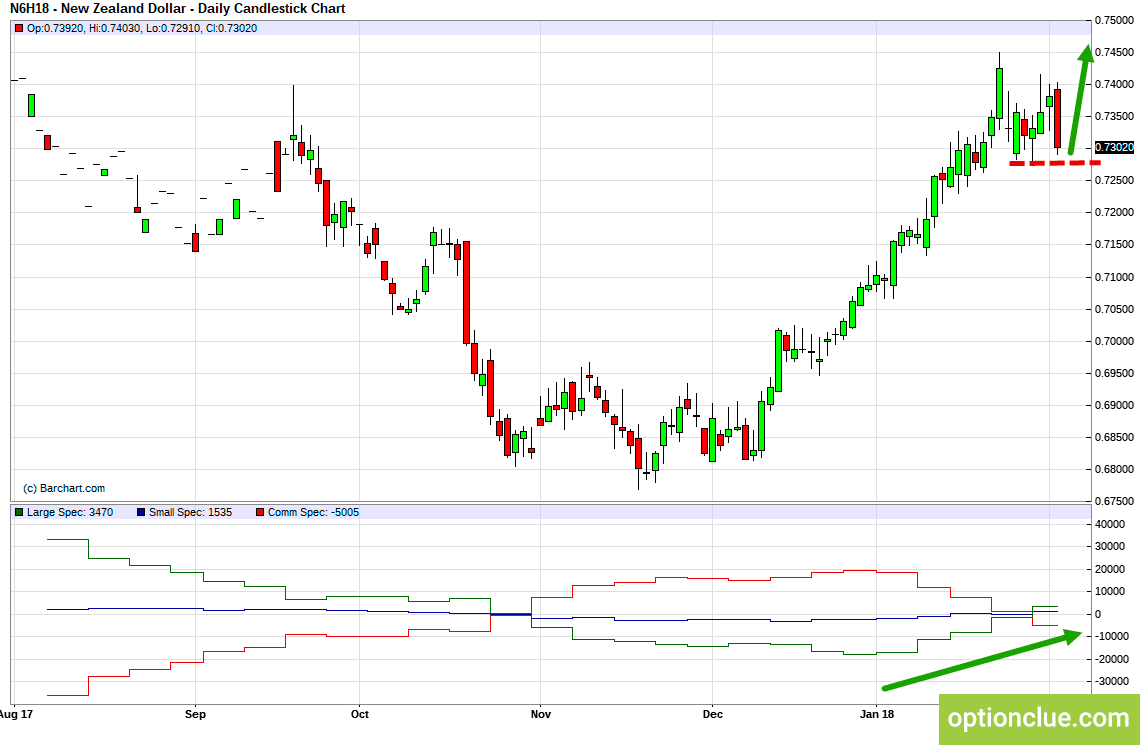
NZDUSD. Technical analysis and COT net position indicator.
Russian rouble (USDRUB)
USDRUB currency pair remains in the medium-term bear trend and the retracement develops on the Daily timeframe. The price is around the resistance level on the Daily timeframe, the highs of January 29 – 30. A pullback selling opportunity from this level will most likely appear within next week or it will be broken, the trend will change and a breakout buying opportunity will be formed.
COT indicator reversed and large speculators began to sell rouble and it makes sense to reduce the position size when an entry point appears in the trend direction.
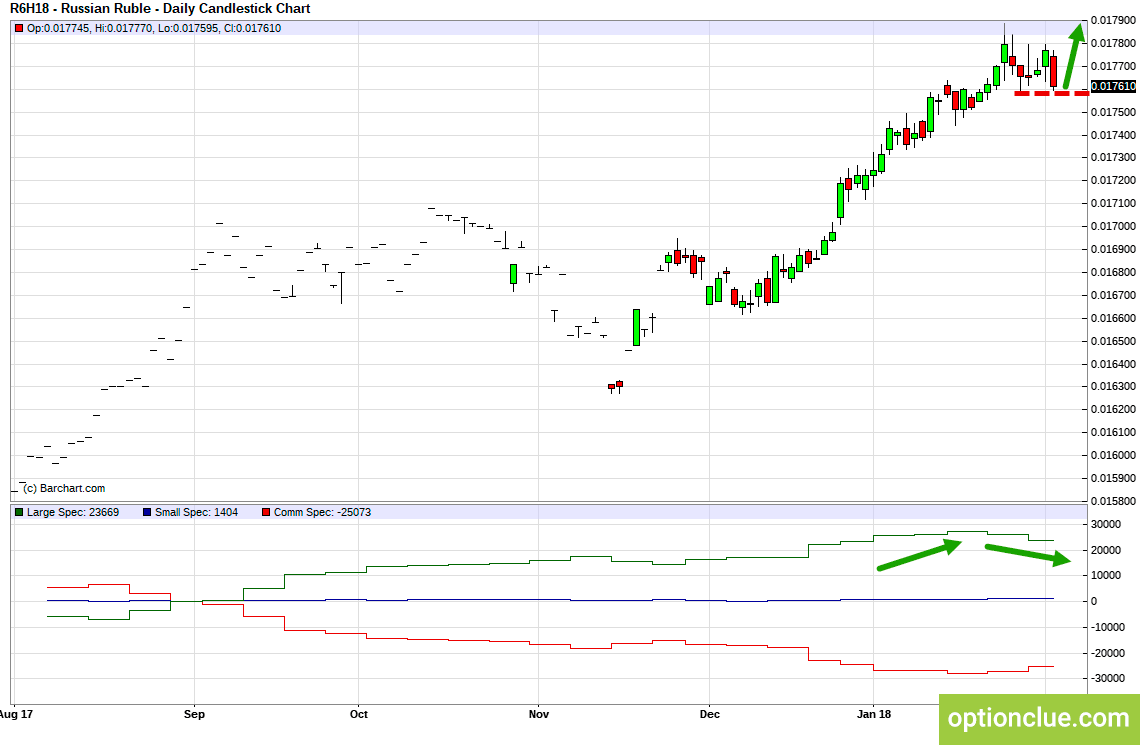
RUBUSD. Technical analysis and COT net position indicator.
Conclusions
In terms of medium-term trading, financial instruments with the correction close to completion on the Daily timeframe and with potentially the most promising risk-reward ratio are USDJPY, USDCAD.
In the near future Dollar Index, E-Mini S&P500, AUDUSD, GBPJPY can become noteworthy depending on the market correction depth.
Other financial instruments in the trade list may be also interesting, but in these markets pullback signals on the Daily timeframe are likely to occur no earlier than a week.
More information on the topic:
- The role of support and resistance levels in the trading plan
- Trading tactics. Breakout trading and pullback trading
- How to use CFTC reports in trading. General concepts
- How to use CFTC reports in trading. The logic of large speculators
Good luck in trading!