Support and resistance trading strategy. Pullback trading examples

In this article we’ll talk about pullback trading. This is my favorite trading tactics. Its idea is to search for the entry point at the time of the market correction completion.
Contents
- The essence of the pullback trading
- The main advantage of a pullback trading strategy
- EURUSD. Retracement trading examples. Advantages
- GBPJPY. Pullback (bounce) trading examples. Disadvantages
- Conclusions on pullbacks
The essence of the pullback trading
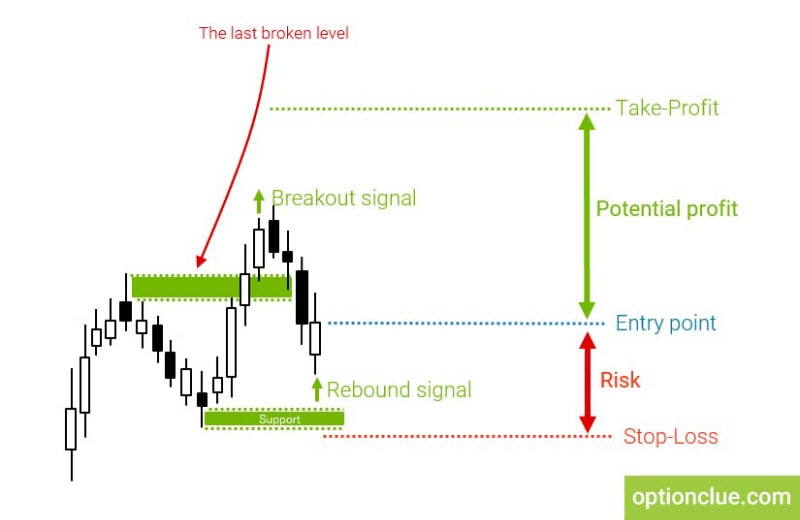
For this purpose we expect the price to come to the nearest support or resistance level and break it through, that is when a breakout signal appears in one of the directions.
We ignore this signal and expect the correction to take place. For the pullback signal appearance the market must correct to the last broken level or further to the opposite one, after which the confirming candle must be closed (Figure 1).
The main advantage of a pullback trading strategy
What is the main advantage of this trading tactics over the breakout trading?
First of all, after the correction and the formation of a rebound candle the entry price will be often much more attractive in comparison with the breakout trading. I mean that the size of stop-loss will tend to be smaller and the size of take-profit, that is, the potential of the profit, will be much higher.
In this case the target for placing take profit will coincide with the level at which we calculated the target for the breakout market entry. Due to the fact that stop loss will be less here, we will get a more favorable risk-reward ratio.
You can get the maximum reward-risk ratio through the pullback trading. I have seen situations where the profit potential was 10, 15 and even 20 times higher than the risk. When breakout trading such risk-reward ratio will not be obtained.
EURUSD. Retracement trading examples. Advantages
Now we will take a few examples and evaluate the main advantages and disadvantages of this trading concept.
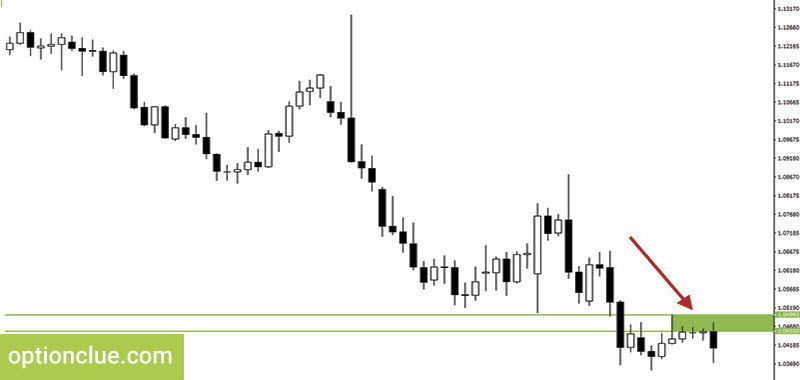
The first financial instrument we’ll examine is the EURUSD currency pair since December. The resistance level is formed in the market. The upper border is 1.0499, the lower border is 1.0455. Let’s paint out this price range in order to visually understand where the level is (Figure 2).
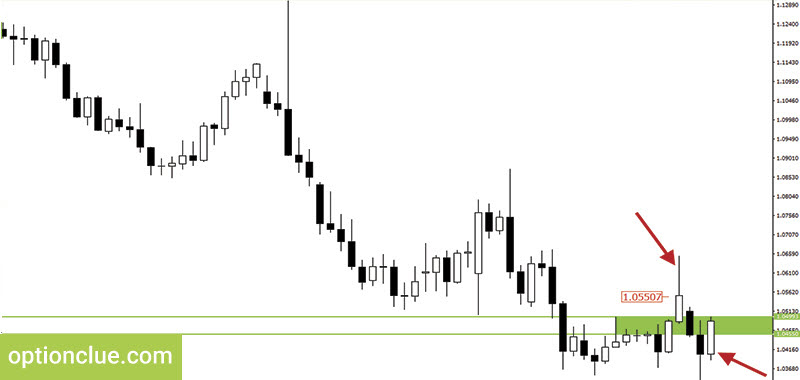
On December the 30th, the price comes to this level and breaks it through. The body of the candle is closed higher. After a while, the correction starts, the market touches the last broken level and then another bull candle is closed. This indicates that the correction has most likely been completed and a pullback signal has been generated.
The possible market entry price to buy is 1.0550. The closing price of the rebound candle is 1.0490. The advantage over the breakout entry price is 60 points (Figure 3). Pullback trading usually provides more attractive entry point, a greater profit potential and a better risk-reward ratio.
GBPJPY. Pullback (bounce) trading examples. Disadvantages
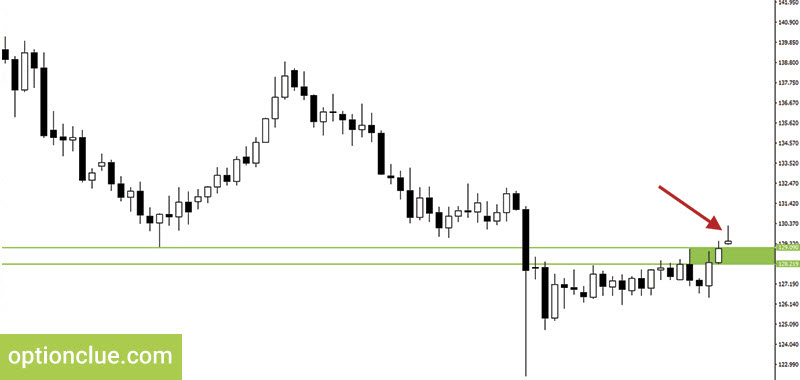
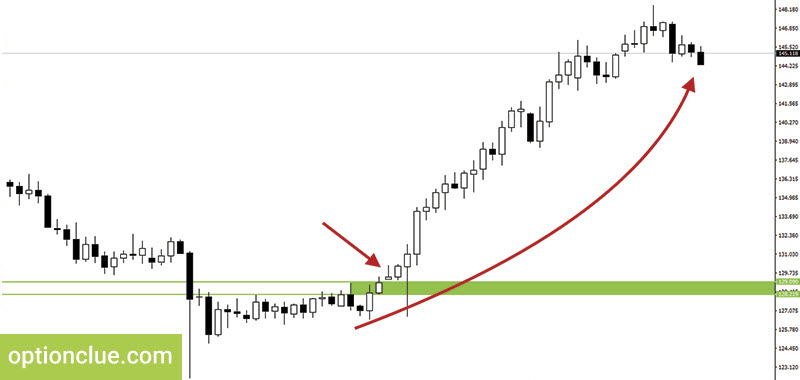
Let’s take one more example. It’s the GBPJPY currency pair. By the example of this financial instrument we will consider the disadvantages of the pullback trading strategy. The resistance level is formed in the market. The upper border is 129.09 and the lower border is 128.21 (Figure 4).
After that the market was fluctuating around the level during two days and was closed higher on the third day. In terms of technical analysis this is a clear bull breakout signal (Figure 5).
The entry point is formed instantly when breakout trading, whereas when pullback trading, it is necessary to expect the market to finish its impulse movement and correct. Only after the correction has been completed, the pullback candle must be closed in the direction of the trend. In our case it’s a bullish candle.
Let’s come back to our example. The market was linearly rising for the next six days. There were no chances to open a pullback position. You could only look at how the price was moving in the direction of the trend (figure 6). Such situations are especially common on active instruments such as gold, silver, GBPUSD and cross-rates, for instance, GBPJPY.
Conclusions on pullbacks
The market not always corrects after the breakout. If major players such as banks, investment funds participate actively in the movement, the price moves linearly and corrections are formed only on smaller timeframes.
As you can see, the pullback trading has its strengths and weaknesses. Let’s note its positive aspects once again. It’s possible to get very attractive risk-reward ratio on small timeframes that is 1:5 and even 1:10. The disadvantages are that sometimes you will observe the market movement without participating in it.
Traders often make the process of plotting horizontal support and resistance levels much more difficult than it needs to be. Some of them tend to complicate this task by plotting unnecessary levels confusing them in determining further price movements in directed trading. After getting the Levels indicator you won’t have any difficulty in this due to the simplicity of its use. It can help not only identify price zones where the market movement can slow down or price reversal is likely to occur but also find entry signals that appear during a deep market correction or calculate stop-loss and take-profit.

