In this article, you will find information on how to learn to trade by levels. You will also find links to additional useful articles that will help you use levels in your trading as effectively as possible. The article will be of interest to both beginners and experienced traders looking to improve their trading tactics.
Horizontal support and resistance levels are a powerful market analysis tool in a trader’s arsenal. They are an excellent alternative to classic indicators. With the help of levels, you will make your trading more understandable and effective.
You can use levels as:
- a primary tool in trading — levels alone are sufficient for making informed decisions about opening and closing trades
- an additional market analysis tool to improve the quality of your trades
The main advantages of levels:
- it is a simple tool that provides clear signals
- can be used in manual trading as well as in writing trading robots
- they are applicable in any liquid markets, including forex, stock, and cryptocurrencies
- levels do not lag, have existed for decades, and do not require adjustment to historical data
Among the drawbacks of levels, it is worth noting that they need to be frequently readjusted in the case of rapid market price changes. However, if you use a tool that automates the construction of levels, you won’t encounter this issue.
To trade using levels, it is necessary to understand the following aspects:
- What horizontal levels are
- How to construct them correctly
- The three properties of levels and how to apply them
- Trading tactics that can be employed when using horizontal levels
In this article, we will briefly cover these questions. If you want to study them in detail, read the additional materials we reference and also check the online course Horizontal Levels in Trading.

What are Horizontal Levels
A horizontal level is a price zone built at reversal points on the chart and where the price has fluctuated for some time. At these points, the forces of bulls and bears were balanced, and the market’s potential for movement decreased to a minimum. In these areas, on smaller timeframes, you may observe a sideways trend or a triangle.
Such price levels often acquire historical significance, and when the price approaches them, the movement may pause for some time and then either change direction or break through this level with even greater potential.
Around these price levels, the highest concentration of orders to open and close trades is observed. These are the price levels you often hear about in analysts’ forecasts. Large players also orient themselves around these levels.
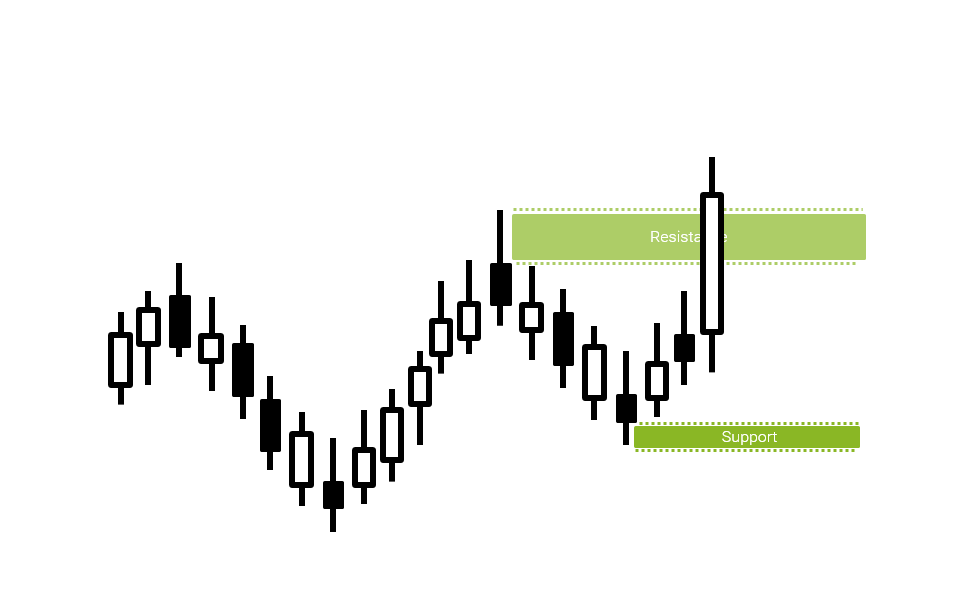
Resistance level is a price level that the price approaches from below and often cannot break through (at least on the first attempt). In other words, bears are clearly strong here, sell limit orders are set, preventing the price from continuing its upward movement. On the chart, these levels are usually built at local highs.
Similarly, a support level arises where buyers are strong enough, preventing the price from moving below that level. On the chart, they are usually built around local lows.
To correctly build a level, we will accordingly focus on the local highs and lows of historical data.
How to Construct Levels Correctly
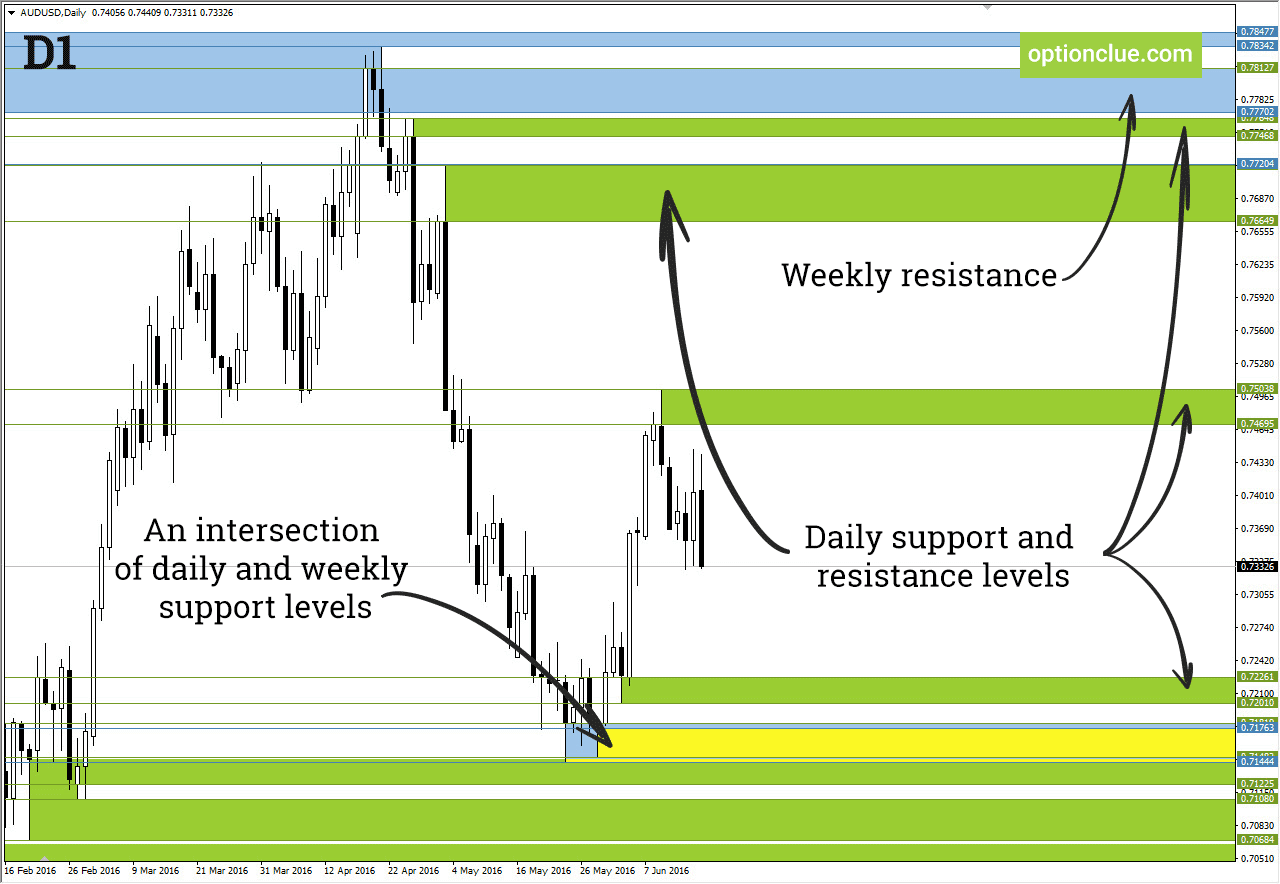
Horizontal support and resistance lines work on all timeframes. Nevertheless, the construction of levels should begin with larger timeframes and gradually move down to the timeframe where you plan to trade.
The most reliable timeframe, used by large market participants, is the daily timeframe. Always consider daily levels, regardless of your trading style.
It is important to understand that a level is not a line with a thickness of one point but a price range. It is constructed from the bodies’ boundaries to the candle wicks where the market direction changes from top to bottom or bottom to top.
The process of constructing levels is not complicated. Adding levels to the chart will help even a beginner trader understand the market situation. We recommend additionally studying the article: How to Plot Horizontal Levels.
Three Properties of Levels
To seamlessly incorporate levels into your trading strategy, it’s essential to understand the three basic properties of levels. These are patterns that arise due to the psychology of market participants. Analysts have repeatedly traced the realization of these properties in historical data.
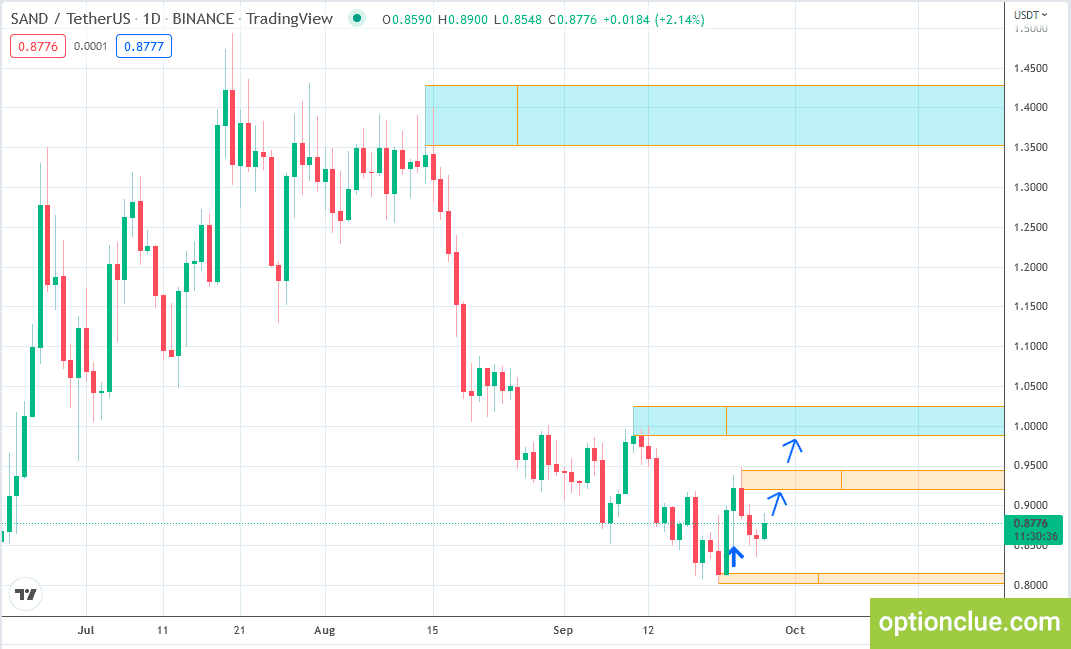
The first property of horizontal support and resistance lines helps you determine the trend direction and visually determine entry points into the market. To do this, you need to plot at least two nearest horizontal levels – a level below the current mark, which is a support level, and a corresponding resistance level above the current price.
The first property states that the direction of the breakout indicates the likely further direction of the asset’s price movement.
The breakout of one of these two levels allows drawing conclusions about the future direction of market movement, indicating the formation of a new trend. When the resistance level is broken, the market trend is bullish, meaning the market can continue to move in that direction. If the support level is breached, it can be inferred that the trend is bearish, and the market may decline in the near future.
For this reason, it is necessary to plot at least two nearest levels — the breakout of one of them allows determining the current trend direction and generates an entry point for the breakout. These price marks are excellent for setting stop orders.
For more details on the first property of levels in theory and in practice, as well as information on “testing the level with price,” “visual breakout of the level,” “false breakout,” read the following articles:
- First Property of Horizontal Support and Resistance Levels
- First Property of Levels. Examples of Construction
The second property of levels states the market is more likely to bounce off a horizontal level than to break through it. It’s important to consider the psychology of market participants in this context. Most traders anticipate that the level will hold, influencing the price direction accordingly.
This is also one of the reasons why the market can stay in a sideways trend for quite a while, trapped between two significant support and resistance levels. To break them, a very strong impulse is needed; it’s “easier” for the price to oscillate in the designated zone until the balance between buyers and sellers is clearly disrupted, and a strong enough impulse arises to break one of the levels. After the breakout, we will again recall the first property to determine the new trend. Additionally, we will be interested in understanding the third property to better navigate the new market situation.

To better understand how these properties work, analyze the history of assets and observe how they are executed. For more details on the second property, read our articles:
The third property of levels, or the mirror property of horizontal levels, is as follows: after a breakout, a support level often becomes resistance, and resistance becomes support.
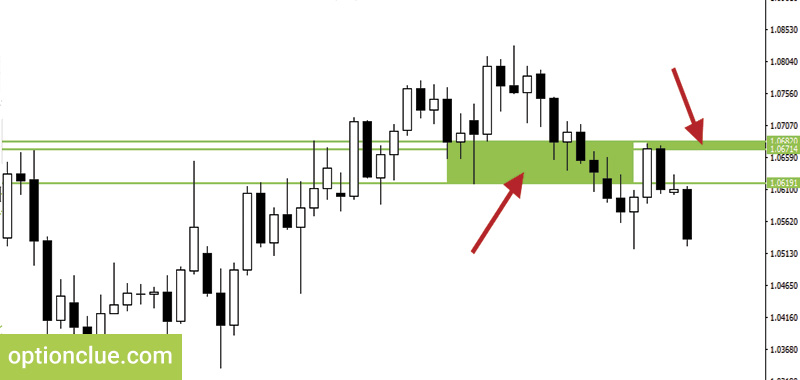
The third property is used to find entry points into the market and allows determining them with maximum accuracy. How does the implementation of this property look on the chart? What scenario do traders follow in the case of a level breakout? Read about it in articles dedicated to the third property:
How to Trade Using Levels
Understanding how levels work allows you to use them in different ways in your trading. There are several key tactics for making trading decisions based on levels – this includes trading tactics on breakouts and trading on bounces.
When trading on a breakout, a trader expects the key level to be broken, intending to open a trend-following trade. When trading on a bounce, a trader expects the price to rebound from the key level. In both cases, it is crucial to accurately determine whether a breakout or bounce occurred at the price level or whether it was a false price oscillation at the support or resistance line.

To gain a thorough understanding of horizontal levels, study the following articles:
- Trading Tactics: Breakout and Pullback
- Signs of a Quality Breakout Level
- Trading Tactics: Pullback Trading Examples
- Trading Tactics: Breakout Trading Examples
- Short-term Trading. Entry Points on Smaller Timeframes
- Gaps in the Formation of Support and Resistance Levels
- Using Pending Stop Orders in Breakout Trading
- The Role of Horizontal Levels in the Trading Plan
Conclusion
Applying levels in trading can be beneficial for day traders, short-term traders, as well as those who trade medium-term and are willing to hold positions for several weeks. They are also suitable for creating algorithms for automated trading.