The third property of horizontal support and resistance levels

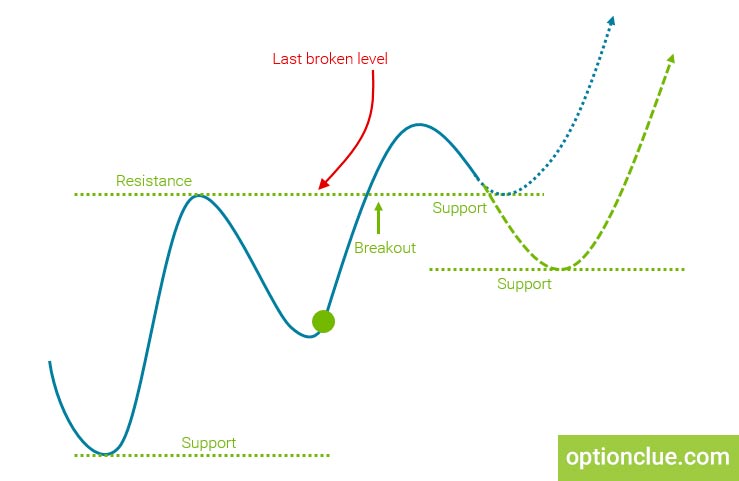
In this article we will analyze the third property of support and resistance levels, which reads as follows: after the breakout, the support sometimes turns into the resistance and the resistance into the support. This property is called as «reflecting». We will discuss the reasons of such market movements and take the examples.
Contents
- Trading. The essence of the third property of levels
- EURUSD. Examples of the third property implementation in the FOREX market
- NZDUSD. Examples of the third property of horizontal levels implementation
Trading. The essence of the third property of levels
Traders who trade in the direction of the trend can be conventionally divided into two groups. The first group is traders who trade level breakouts and the second one is those who trade pullbacks after the end of the market correction.
The first group is waiting for a breakout signal, for example, the candle closing above the upper border of the resistance level. On the other hand, when opening a breakout position, they trade with pending orders using a buy stop order. We examined these options in the previous articles.
The second group of traders does not enter the market immediately during the breakout, but expects the correction formation, waiting for the pullback signal. The reflecting property of the levels is extremely important for these market participants since they can look for entry point if the correction is completed around the last broken level. If this happens, the reflecting property of the levels is performed.
The third property is performed not often, but when it happens attractive market entry points are formed.
EURUSD. Examples of the third property implementation in the FOREX market
Let’s analyze a few examples.
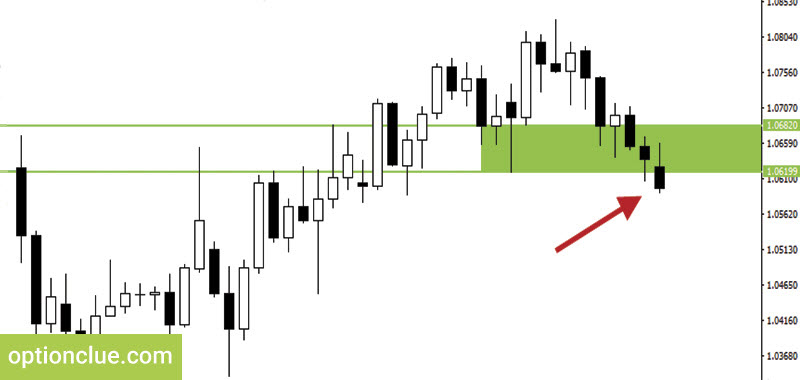
EURUSD since January 2017, the Daily timeframe. The market is rising for a long time, the euro to dollar exchange rate grows and another support level is formed. Let me remind you that the horizontal level is plotted along the bodies and shadows of the candles at the point where the chart shows a price reversal. The lower border of the level is 1.0619, the upper border is 1.0682.
What happens next? The price starts falling and the market is closed below the support level. In the bear candle from February the 13th, the fact of the support level breakout was recorded.
In accordance with the first property of horizontal levels, the breakout direction indicates the direction of the trend and the further possible price movement. Now the trend turns into a bear one.
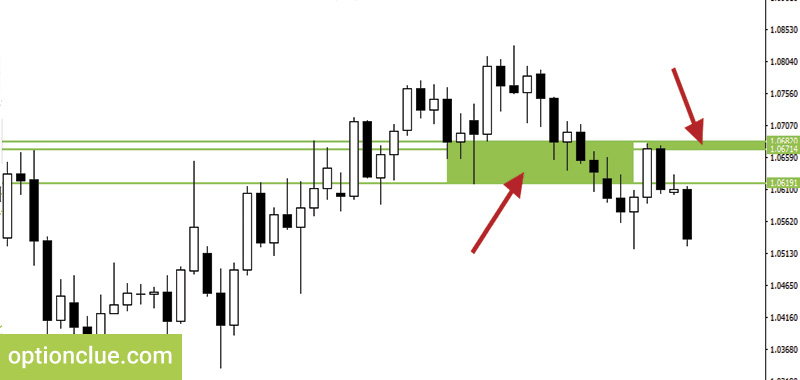
After that the market was falling during one more day and then the correction started. Afterwards the bear candle is formed again and the declining movement continues.
Let’s look in detail at what was happening in the market from the 16th to the 21st of February.
The correction was completed around the support level, which was formed earlier. The price began to rise and after the candle closing from February the 21st, a new resistance level appeared. The upper border of this level practically coincides with the border of the support level that is 1.0681 and the lower border is 1.0671.
The support turned into the resistance. Since the breakout to the implementation of the reflecting property of the levels, only six trading days passed. The resistance level was formed and the support level was no longer relevant.
NZDUSD. Examples of the third property of horizontal levels implementation
Let’s take one more example. Currency chart for NZDUSD since September 2016, the Daily timeframe.
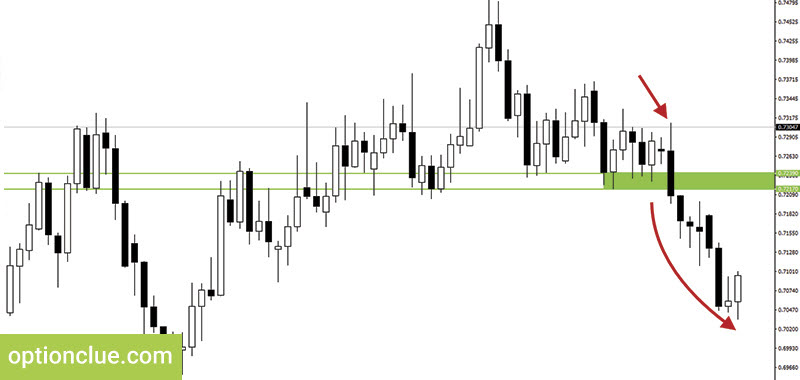
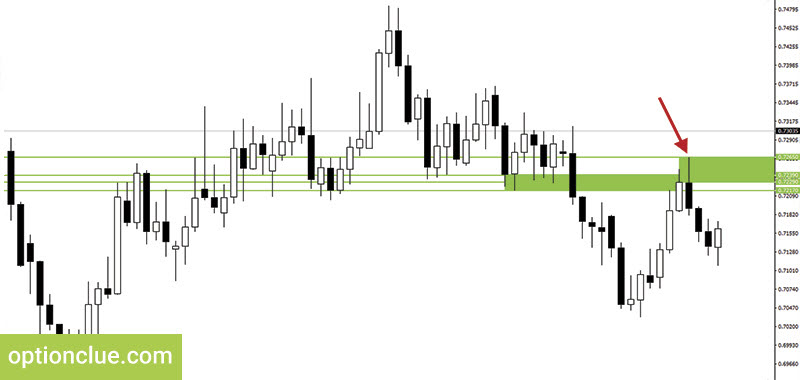
A classic support level is formed that contains two bear and two bull candles in a row. The upper border is 0.7239, the lower border is 0.7217.
After that the market fluctuated for a while around the support. The second property of horizontal levels was performed and the price could not overcome it for several days. Pretty long shadows of both bull and bear candles were formed. However, on October the 4th, the market was closed below the support level.
It indicates that the trend direction has changed and now the trend turns into a bear one. The first property of the levels is carried out. The market is declining for several weeks after which the correction starts.
When reaching the last broken support level a new resistance level is formed during two days that is on the 20th and the 21st of October. Its borders are 0.7229 and 0.7265.
The price, coming to the last broken level, cannot overcome it and the market starts moving down in the direction of the main trend. As a result, a pullback signal has been formed.
It happens due to a change in the balance between buyers and sellers. Traders think the levels should work and the properties of the levels should be carried out. At such points some traders will search for the selling opportunity whereas the others will close the previously open buy positions.
As a result, the correction has been completed and the support level, which was formed on September the 27th, turned into the resistance level.
Summarizing above mentioned, the third property of support and resistance levels is applied to determine the market pullback opportunities at the time when the next market correction is completed around the last broken level. This property is not carried out as often as we’d like, but when this happens, an excellent signal in the direction of the main trend appears.
Traders often make the process of plotting horizontal support and resistance levels much more difficult than it needs to be. Some of them tend to complicate this task by plotting unnecessary levels confusing them in determining further price movements in directed trading. After getting the Levels indicator you won’t have any difficulty in this due to the simplicity of its use. It can help not only identify price zones where the market movement can slow down or price reversal is likely to occur but also find entry signals that appear during a deep market correction or calculate stop-loss and take-profit.
Good luck in trading!

