In this article, step by step we will take an example of examining the principle of opening a medium-term pullback position – ranging from the search for the market entry point to the calculation of the optimal position size.
We will examine the principles of setting stop-loss orders, targets determination, and the size calculation. These methods of determining entry and exit points are universal. In other words, they are applicable to all actively traded markets and timeframes.
To save time we will not analyze all the elements of the trading plan, but start right away with the third point – the market entry point.
Contents
- Determination of market entry point
- Selecting the level for stop loss setting
- Trading. Determination of the risk size in points
- Profit potential determination in trading
- Risk management
- Determination of the optimal position size
- Conclusions on pullback trading system
Determination of market entry point
January and the beginning of September are the periods of forming the most reliable market entry points. After a temporary lull, key players return to the market. They seek to select the most thriving assets of a new trade period. Therefore, there are often strong movements in the market and the most attractive medium-term trends of the trading year are formed.
On January 14, 2016, a pullback signal was formed in the gold market; this signal appears at the time of the most likely the correction completion. The market broke through the resistance level (marked with the dotted line in Figure 1), then came back to its upper border and bounced off it. If the trend continues, then the pullback signal allows entering at the beginning of the next impulsive wave – movement in the direction of the prevailing trend. One of the advantages of the pullback trading strategy is that the result doesn’t make you wait. The market either moves immediately in the direction of the trend or breaks the nearest level that causes the trend reversal.

Figure 1. January 14, 2016. Spot Gold market (Daily). Pullback from the earlier broken level.
The market entry point is $1093 per one troy ounce. This mark is close to the bullish candle closing which was formed on January 13.
Selecting the level for stop loss setting
The point of fixing the loss when opening a buy position with a stop loss order may be around the nearest support level. Such format of risk limitation reduces the expectancy of accidental stop loss triggering in case of a sharp price movement within a day and allows exiting the market at the time of possible trend reversal.
In the current example, the nearest support level of the Daily timeframe was somewhere in the area of the lows, formed at the end of December 2015 (marked with solid lines in Figure 1).
Ideally, you should place a stop order with a small gap to the support level, calculating the optimal value of this gap using the ATR indicator. To simplify the example, suppose stop order is around $1057 per troy ounce – under the lower border of the support zone of the Daily timeframe (Figure 2).
Determination of the risk size in points
The distance from the possible market entry point to stop loss is the risk in points. The entry point is around $1093, stop loss – $1057. Our aim is to determine the distance in points between these two points.

Figure 2. Risk in points is the distance between planned market entry price and placement of stop loss order
The distance between the entry price and stop loss is $1093 – $1057 = $36. In order to convert this value into points, you have to divide it by the point size. In the spot gold market there are 2 decimal places, hence the point is one hundredth.
Let’s calculate the risk in points. To do this you have to divide $36 by 0.01: $36 / 0.01 = 3600 points. This is just the value that has to be inserted into the denominator of the formula for calculating the optimal position size. In addition, this value will be useful for calculating the potential risk-reward ratio.
Profit potential determination in trading
Support and resistance levels work because traders believe that they have to. Therefore, market trends often reverse or slow down around the horizontal levels and a surge in trading volumes is often formed. Some traders close their positions; others, on the contrary, try to enter a countertrend movement.
For this reason, support and resistance levels allow determining the market entry points, the marks for placement reliable stop orders and qualitative and objective targets as well.
As a rule the larger timeframe the more reliable the level is. The nearest targets are determined by that timeframe, in which you search for the market entry point. The optimistic but correct targets may be set according to the higher timeframe. They can be especially relevant if you enter the market at the very beginning of a new trend.
In the current example, the market entry point is determined on the Daily timeframe, the buy signal has appeared after a long consolidation of the market (the market has been in a range since December), and apart from this January is one of the best trade periods of the year. This set of conditions allows us to consider the next level of the Weekly timeframe as objective targets when searching for the market entry point (Figure 3)

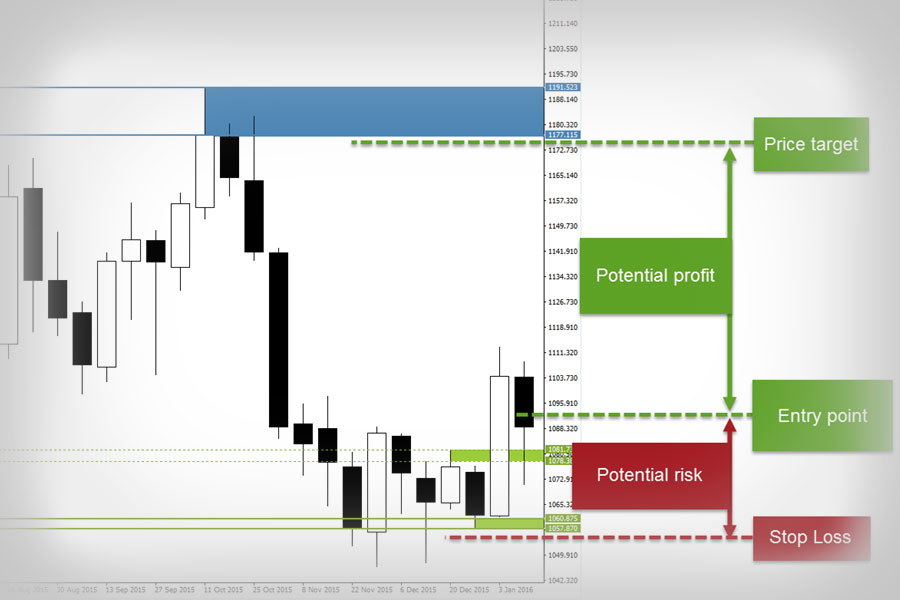
Figure 3. Determination of profit potential and risk based on the nearest support and resistance levels
Take profit order as well as stop loss order is worth placing with a small gap to the nearest level. The target is in the area of $1177 per troy ounce – under the lower border of the resistance zone of the Weekly timeframe. The possible entry price is $1093. Let’s calculate the distance in points between these two points.
The profit potential is $1177 – $1093 = $84. Let’s convert this value into points: $84 / 0.01 = 8400 points.
Risk management
The main rule of risk management is that the potential profit should exceed risks at least twice. It’s the cornerstone of professional trading on the financial markets. If the average profitable trade is at least two times bigger than the average loss-making trade, the capital will increase more quickly, overcoming a drawdown will be easier and the trader will be able to get rid of the responsibility to trade profitably more often than at a loss.
Such a commitment turns trading into a race in which profitable trades must be more than losing ones, otherwise, the trade period will end up with a negative result. The higher risk-reward ratio, the more difficult is to get out of the drawdown, and the more psychological pressure will affect a trader during the series of losing trades.
Let’s come back to the gold market. After calculating the profit and risk potential, now it’s possible to easily determine whether this trade is attractive from the aspect of the key risk management rule.
The potential profit is 8400 points; the potential risk is 3600 points. The reward-risk ratio can be calculated as 8400/3600 = 2.3
The profit potential is more than double the risks, therefore, the risk management rules are followed, you can proceed to the next item of the trading plan – money management rules.
Trading. Determination of the optimal position size
The next step is the calculation of the position size for entering the market. It will vary in every trade along with stop loss size in points
In comparison with the constant position size in each trade, such an approach will allow getting the maximum profit from positive trades and make it pretty impossible to destroy the trading account due to a series of losing trades. To lose money following the rules of money and risk management – is a challenge.
To simplify the example let us say the capital is $5400.
The desired risk as a percentage of capital should be determined independently (2% and less – conservative trading, 3-5% – moderate, 5%+ – aggressive) Let it be equal to 2%, that is in each trade the risk is equal to 2% of the trading capital. We have just calculated the risk in points, it is equal to 3600.
The cost of the point for one contract is $1. This value can be obtained on the broker’s website or in the trading platform or also empirically when trading on a demo account. The cost of the point for 1 contract shows how much you can lose (receive) in case of one point price movement after entering the market with one full contract.
Please note that sometimes on a broker’s website it’s posted not the cost of a point but the cost of the minimum price change. For instance, for EURUSD market spot the point is 0.0001 and the minimum price change (pips) – is 0.00001. The second value (pips) is one tenth of the point. The cost of the point for EURUSD spot will be $10 whereas the cost of the minimum price change is $1. For the correct position size calculation, it’s necessary to use the cost of the point.
Let’s insert the values obtained above into the formula for calculating the optimal position size:
In the numerator – the capital multiplied by the desired risk in percent; in the denominator – the risk in points multiplied by the cost of the point:
The size of the position = (5400 * 2 * 0.01) / (3600 * 1) = 108 / 3600 = 0.03 of the contract.
In the spot gold market you may trade fractional contracts hence we can open a position of this size.
If in this example we got a value less than 0.01 we couldn’t open the position. This can happen when the risk for trade in points is too big or the capital is insufficient to trade with the declared risks on the selected financial instrument. If there is not enough capital to enter the market you can look for a similar financial instrument with a smaller contract size or simply ignore this market entering – it’s impossible to enter with the required risk level for the trade, risk management rules aren’t followed. The alternative solution is entering the market using an option.
Conclusions on pullback trading system
The market in January once again proved that the beginning of a new calendar year is one of the best periods for medium-term trading. The price moved further than targets set, having reversed around the lower border of the monthly resistance level, $1282. I’ll note that instead of buying gold and placing stop loss order you could use the options market, the risk-reward ratio when buying the February GLD call option was 1:4.
The principles of determination of the market entry points, calculating the position size or the risk-reward ratio that were mentioned in the article, are universal and are applicable to different trading styles (short, medium and long-term directed trading) in the market.
The issues of trend direction determination and general market conditions were not discussed in the article, although they are an integral part of the plan for directed trading in the financial markets.
Also read about breakout tactics.