How to use CFTC reports in trading. The role of COT indicator in the trading plan
[article-cftcreports]
CFTC (COT) reports can become a great addition to any medium-term trading system. In this article we will discuss the options for integrating COT net position indicator into the trading plan.
Contents
- COT indicator in the trading plan
- COT net position. Trades filtering (Point 2 of the trading plan)
- Position size adjustment (Point 5 of the trading plan)
- Conclusions on the use of COT report in trading
COT indicator in the trading plan
There should be at least 5 points in a classic trading plan. Each of them can be represented as an answer to the question:
- Is it possible to trade now?
- In what direction to trade?
- How to determine the market entry point?
- How to limit risks and determine targets?
- How to determine the optimal position size?
COT indicator allows you to make trading more conservative and meaningful. When writing the article the most attractive options for its use in trading are the following:
- Trades filtering: some positions are open, others are not
- Position sizing: some trades are open with a standard size, others – with a reduced one
Thus, net position indicator can be integrated into the second or fifth point of the trading plan. Let’s analyze each option in more detail.
COT net position. Trades filtering
COT indicator provides an answer to the question: «What do professionals think about the market?» If the direction of the net position indicator of large speculators does not coincide with the direction of the trend (Daily), then the trade is not open.
This option of using CFTC statistics is appropriate for traders who want to make their trading much more conservative.
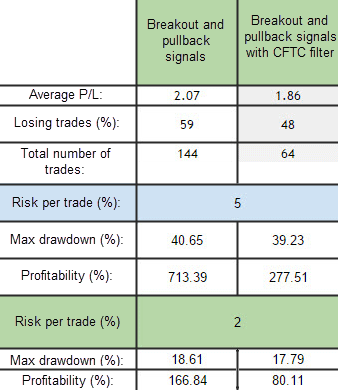
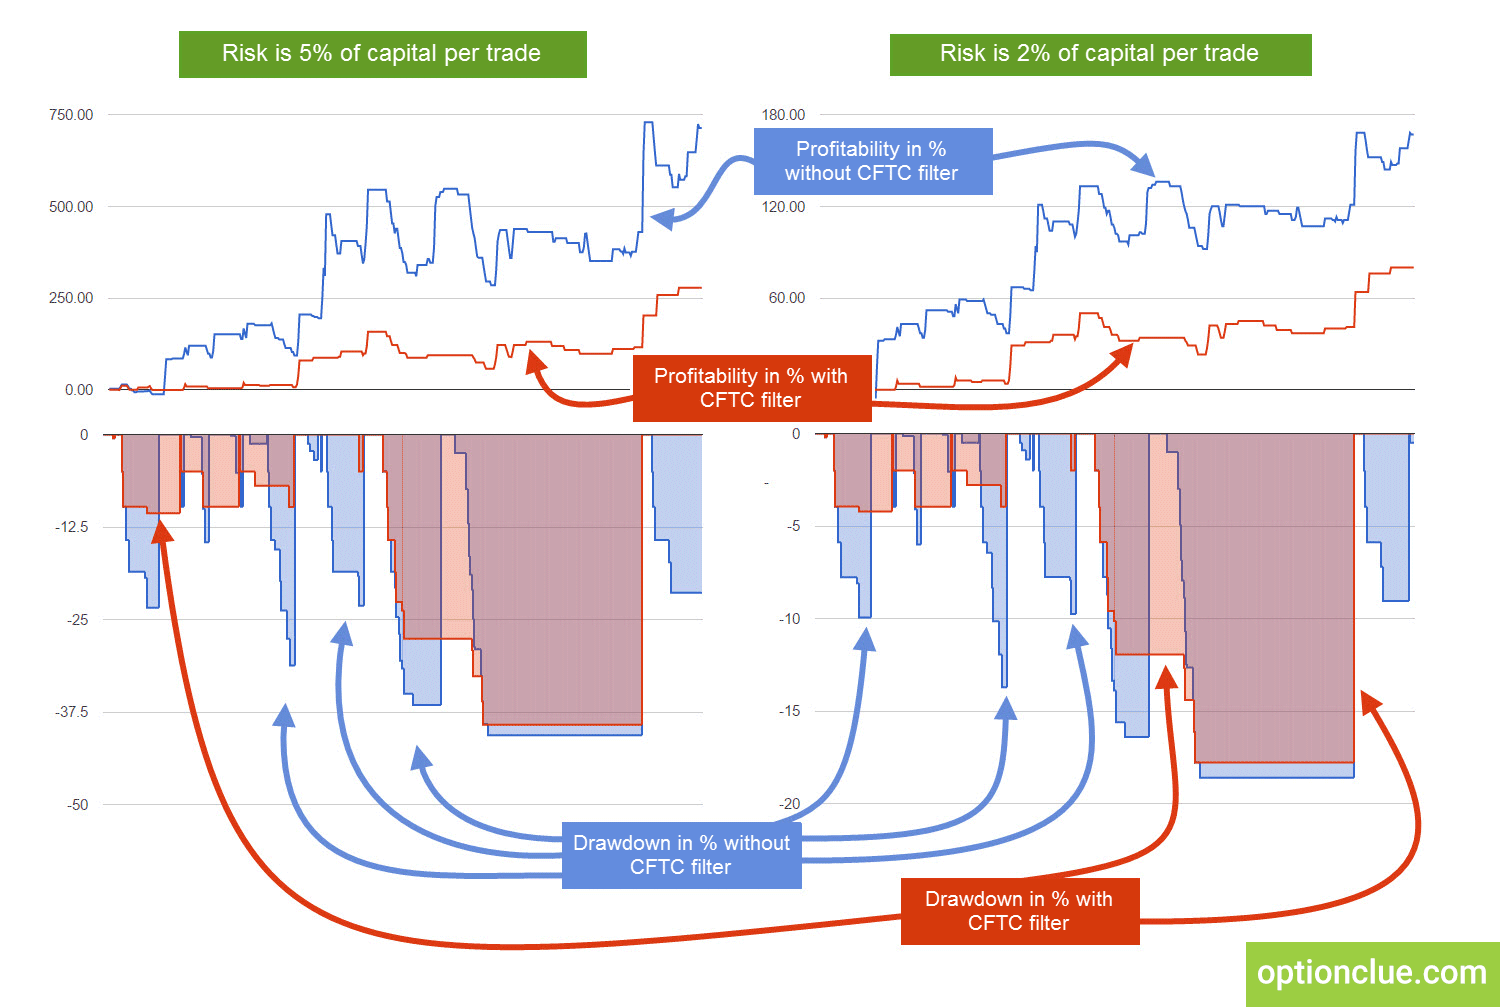
Fig. 1. Statistics of backtesting of medium-term trading strategy using the CFTC filter and without it.
This filter backtest with the breakout and pullback trading strategies on the EURUSD Daily timeframe from 2007 to 2015 clearly demonstrates its key features. Below you can see comparison data of the breakout and pullback trading without the CFTC filter:
- the percentage of losing trades decreased from 59% to 48%
- the number of trades has become 2.25 times less
- profitability decreased from 713% to 277% for risk per trade at 5% and from 166% to 80% for risk per trade at 2%
Fig. 2. Statistics of two trading strategies testing (the first one is the breakout and pullback without filters, the second one is the breakout and pullback with COT filter)
The maximum drawdown as a percentage of capital reduces insignificantly. At the same time, CFTC filter smoothes the profitability curve and during the complete testing period, the trading account begins to drawdown much less often.
Position size adjustment
The second option of integrating COT indicator in the trading plan is the use of its signals to change the position size. It means risk per trade reduction in situations when the major players’ opinions differ from the market trend direction. If the direction of COT indicator does not correspond to the main trend, the position size is reduced by 2 times.
In the graphs presented in Figure 3, this option of using COT indicator is marked in yellow. You can see the yield fluctuates approximately in the middle between the conservative (COT filter) and the aggressive approach (without a COT filter).
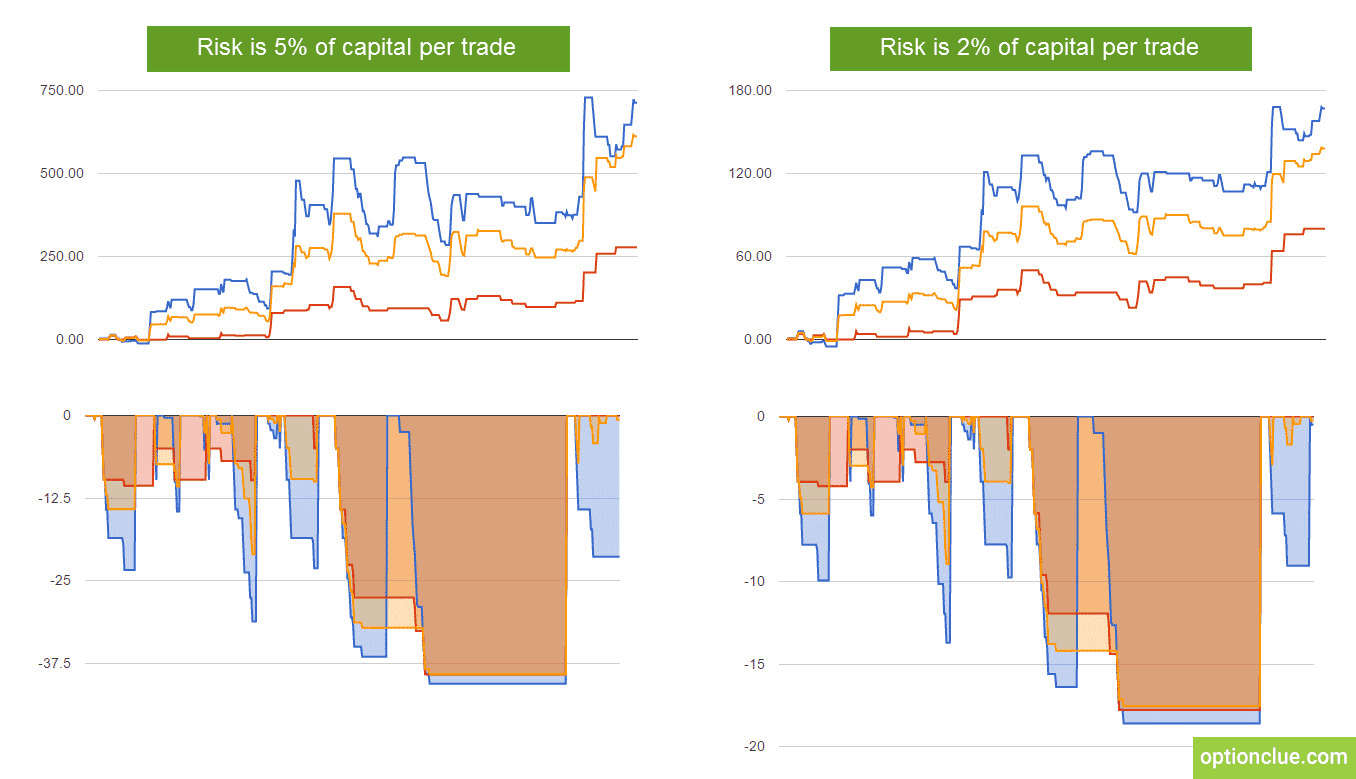
Fig. 3. Statistics of three trading strategies testing (breakout, pullback and two options of filtering signals using COT indicator).
The maximum drawdown is almost the same as the conservative use of CFTC filter. Unprofitable periods are quite common, but in comparison with the aggressive approach, the account drawdowns not so deeply. The number of trades increases since the third approach is hybrid and combines two previous ones.
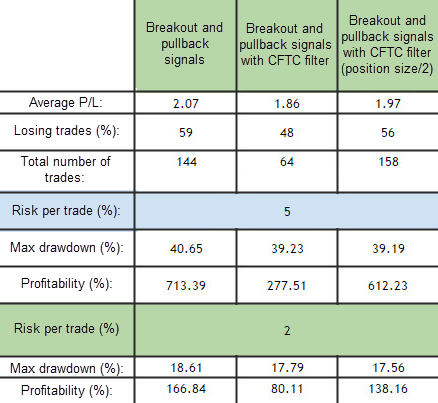
Fig. 4. Statistics of testing of the medium-term trading strategy using two different CFTC filters and without them.
Conclusions on the use of COT report in trading
We have analyzed two options of integrating COT indicator in the trading plan.
The first option (trades filtering) is appropriate for traders who want to make their trading more conservative. It smoothes the yield curve, reduces the number of trades and the share of losing trades in the total mass.
The second option (the position size adjustment) combines the advantages of both extremes – conservative and aggressive approaches. In comparison with trading without CFTC filter it generates less deep drawdowns. At the same time, the yield is about twice the conservative approach with filtering of all trades that contradict CFTC filter.
Net position indicator can be a great addition to the medium-term trading strategy. Both options of using COT indicator in trading are noteworthy and are able to improve the quality of trades. If you want to get more market entries, you can test the second option of using the indicator.
The other aspects of using COT indicator in trading are discussed in the series of articles «How to use COT reports in trading».
Good luck in trading!