[article-cftcreports]
Classic technical analysis indicators (Moving Average, RSI, Stochastic) are built on the grounds of price and with a distortion and delay show the same what a trader can see on the chart. Unlike these market analysis tools, COT indicator is universal since it is built according to the transactions of large market participants and its movements are not averaged or distorted.
Earlier we talked about the fact that COT indicator lets efficiently determine the points of new trends formation and increases the probability of false breakouts identification.
In this article we will talk about an equally important option of using the indicator that is determining the most likely direction of market exit from flats and triangles.
Contents
- Use of net position in sideways trends
- CFTC. Oil. Triangle in the middle of the trend
- CFTC. Gold. Triangle at the beginning of the trend
- CFTC. GBPUSD. Triangle at the end of the trend
- Conclusions on a market direction after sideways trends
Use of net position in sideways trends
CFTC (COT) reports contain information that allows you to efficiently determine the most likely direction of market exit from flats and converging price formations.
Sideways trends are, by nature, the market condition before a jump in the direction of a key trend or a reversal. If a price range or a triangle appears on the price movement chart, traders often try to guess the direction the market will go-up or down, whereas for large participants such market condition is an excellent opportunity to increase the position in one direction or another.

Fig. 1. Large speculators are buying during the triangle formation. The net position is increasing.
Analysis of trades of large traders allows you to understand in what direction the breakout is the most probable, that is up or down direction.
If large speculators sell as the sideways trend evolves, this may indicate that professionals prepare for a bearish movement. The opposite is equally true: if the net position of large speculators grows as the triangle forms, the probability of the breakout up of this price formation increases. If at this moment hedgers act in the opposite way, this strengthens the signal.
Naturally, such conduct of net position indicator does not guarantee that the price will come out of a flat or a triangle in this direction, but the probability of such movement significantly increases (from my experience, the probability of such signals success is about 70-80%).
Let’s examine several examples of applying net position indicator to determine the most likely direction of market exit from sideways trends.
CFTC. Oil. Triangle in the middle of the trend
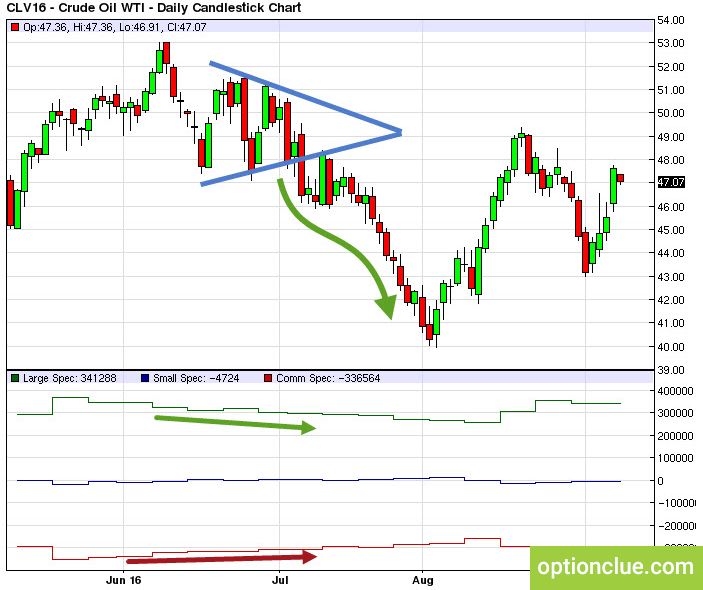
In June 2016 the oil market reversed, net position indicator confirmed the practicability of opening sell position: large speculators were selling and hedgers were buying.
A triangle appeared on the Daily timeframe (highlighted by blue lines on the chart below) after the level breakout. The bearish trend did not reverse, nevertheless, the classic converging price model was formed on the chart from the middle of June to the beginning of July: each new minimum was higher than the previous one and new highs were lower than the previous ones.

Fig. 2. Oil WTI. Large speculators are selling and hedgers are buying. The triangle is broken down.
As the triangle evolves, large speculators continued to sell and hedgers continued to buy (green and red lines on the net position indicator). This indicated that the probability of the bearish trend continuation was higher than the probability of its reversal. The professionals’ actions pointed to the most likely direction of breaking through this formation.
In this example the triangle was a link between two fragments of the bearish trend.
CFTC. Gold. Triangle at the beginning of the trend
A classic example of the sideways trend appearance at the beginning of a new directed trend is the gold market in early 2016. The triangle was formed from the beginning of December. The market was in a bearish trend before its appearance. As the convergent formation evolved, large speculators were selling and hedgers were buying (green and red lines in Figure 3). The breakout in the direction of COT indicator signals occurred on January the 6th, the pullback trading signal appeared on the 14-th.

Fig. 3. Gold. Large speculators are buying during the December lull. Hedgers are selling. The triangle is formed, which then is broken up in the direction of professionals’ trades.
Major players indicated the direction of the most probable price exit from the triangle and it was an excellent entry as:
- The triangle was a link between bearish and bullish trends. Therefore, it was possible to enter the market at the starting point of a new trend.
- January and August-September are the best trading periods of the year when after a temporary lull large players come back to the market. In such moments the market linear movements in the direction of the trend are most often formed. False breakouts and long shadows that collect stop orders take place much less frequent.
- Large players supported this market movement.
CFTC. GBPUSD. Triangle at the end of the trend
After a large sell-off caused by the publication of Brexit voting results, the triangle was formed in the British pound market. From July to early August prices fluctuated around 1.29 – 1.35. All this time large speculators were actively selling and hedgers were buying. The market broke through the triangle in the direction of major market participants’ trades.

Fig. 4. British pound. Hedgers are buying and large speculators are selling within the triangle. The breakout occurs in the direction of major players’ trades.
The signal was successful. In addition, this example is interesting because after the breakout the market reached the nearest support level of the Daily timeframe after which the trend reversed during three weeks.
This clearly illustrates the fact that along with COT net position indicator it always makes sense to be guided by common sense – the longer the trend exists and the more actively the market moves in it, the less interesting the risk-reward ratio in each new trade is and, moreover, in terms of money-management rules, the lower the position size can be in each new trade.
In this example the triangle anticipated the last movement in the direction of the bearish trend.
Conclusions on a market direction after sideways trends
Unlike classic technical analysis indicators, COT indicator signals are universal since they can work without adjusting to history.
Net position indicator allows you to determine the most likely exit direction from a flat or a triangle. Nevertheless, before complete breakouts, false price shocks (long shadows in the direction opposite to the nearby breakout) often occur, so this signal of COT indicator should be considered as the one warning that a market entry point can appear soon.
For instance, if a triangle is formed, large speculators are selling and hedgers are buying, then the probability of a breakout down increases. If this happens, you can look for a breakout or a pullback entry in this direction and consider such trade as a conservative one (the opinion of large speculators is similar to a technical picture).
The market entry before breaking through a flat or a triangle is often associated with inappropriate risks and is often not noteworthy.
Most of the flats and triangles can be seen on the graph after their realization, that is, they are perfectly visible on history, but you can see them on the chart at the moment close to completion. If a triangle consists of five price movements, you can notice it on the market on the 4th or 5th movement. For this reason, young traders should not trade inside flats and triangles as well as try to guess the exit direction from these price movements.
Risk per trade must depend on the trend condition. If you open a short position after a long bearish market, risk per trade must be lower than the standard one. The longer the trend evolves, the lower the profit potential in each trade and the higher the probability of forming large-scale corrections or a trend reversal is.
In the next articles of the «How to use CFTC reports in trading» cycle we will discuss the other COT indicator signals and discuss in detail options of their integration into the medium-term trading system.
Good luck in trading!