How to use CFTC reports. COT indicator in the medium-term trading

In this article we will discuss the basic use of net position indicator as an additional filter for determining market entry points, searching for the moments of new trends emergence and the strongest market movements.
We will also take several detailed examples of the use of the indicator for making medium-term trading decisions and analyzing the market situation.
Contents
- CFTC. Use of COT indicator to confirm market entry points
- COT indicator in the medium-term trading. Silver
- Net position indicator in the medium-term trading. Canadian Dollar
- Conclusions on CFTC or COT
CFTC. Use of COT indicator to confirm market entry points
This option of using the indicator responds to the principle of false breakouts filtering we considered earlier. At the same time, if the previous way of using the indicator points to what extent the breakout is true or false, we will now focus on determining the points at which the new price movement most likely starts.
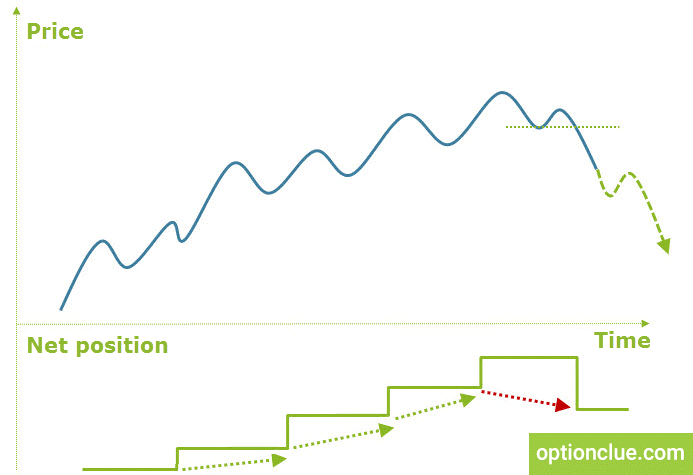
Suppose there is a long uptrend in the market. Then we see a break in trend and a horizontal support level is broken through. After long market movements up false support levels breakouts often occur after which the bearish movement quickly stops and a new downtrend does not start.

Fig. 1. COT net position indicator reverses simultaneously with the market
However, if the breakout is combined with a similar movement of net position indicator, this point most likely can become a platform for a new trend emergence. This is an additional quality criterion of this signal.
I’d like to note that this option of using COT indicator works the best in situations when at first net position reverses and then a technical breakout occurs on Daily timeframe. This allows you to prepare in advance for the possible market movement.
The second option of signal realization is the simultaneous market reversal and net position indicator. It gives less time to think over, but it is also often an excellent filter warning of the formation of a potentially interesting market entry.
COT indicator in the medium-term trading. Silver
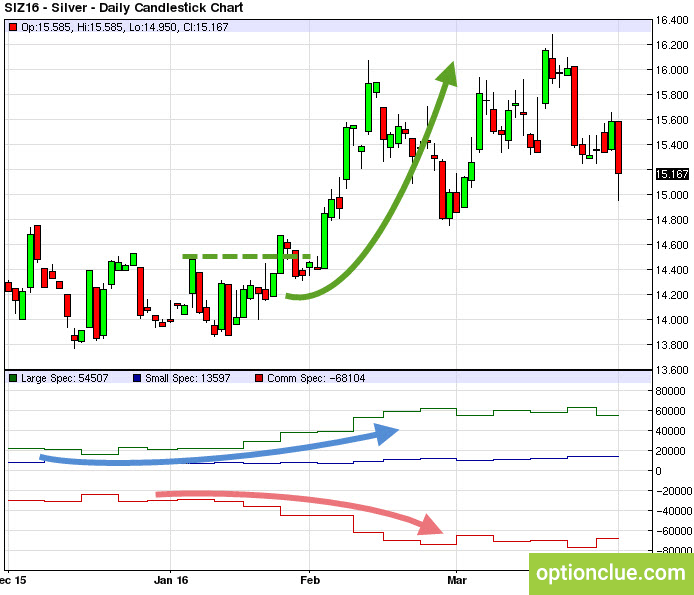
The application of COT report can be demonstrated when analyzing the silver market. From December to January the silver market fluctuated in a sluggish bearish trend between the price range of 13.8 – 14.6. At the end of December net position indicator of large speculators reversed (the signal is marked with a blue arrow): a new maximum on the indicator chart was higher than the previous one, that is, speculators began to buy more actively than to sell.
This signal does not mean you need to buy right now, because according to technical analysis the trend remains bearish. At the same time, it warns that in case of a trend reversal and formation of signals to buy they can be relevant since large players support this market movement direction.

Fig. 2. Silver D1. Large speculators are buying and hedgers are selling in the run-up to a new bullish trend
At the same time, bearish positions become less attractive. Again, this does not mean they need to be closed right here, right now. Sometimes after net position indicator reverses technical trend lasts a month or even more. However, such signal indicates that bearish positions become more risky than earlier and the probability of their success is reduced.
When this happens, you can reduce risks per trade when opening new bearish positions or generally reject them. The latter option is the most conservative and is not appropriate for everyone since the number of trades will be significantly reduced at the same time plenty of attractive signals will be filtered out.
In early January hedgers net position indicator reversed (the signal is marked with a red arrow). This is a confirmation of the above-mentioned signal. Hedgers sell in the run-up to and during the market growth.
Approximately in one week and a half a technical trend reversal took place. The market was surely closed above the resistance level of the Daily timeframe (the upper border of the level is marked with a green dotted line).
Now the technical picture on the key timeframe (Daily) is combined with the professionals’ opinion – both large speculators and hedgers. Therefore, long positions seem to look relevant and you can move to search for the point of market entry.
An aggressive option of the market entry is the breakout trading (after the market is closed above the level). A conservative option with a statistically more significant risk-reward ratio is the pullback trading (on February the 1st).
If the major players’ opinion is combined with a technical picture, the position size can be standard, say 2% of the capital allocated for this market. If such combination was not observed, risks in trading could be reduced by 1.5 – 2 times. This is one of the options for integrating COT indicator as a filter in the trading plan.
Net position indicator in the medium-term trading. Canadian Dollar
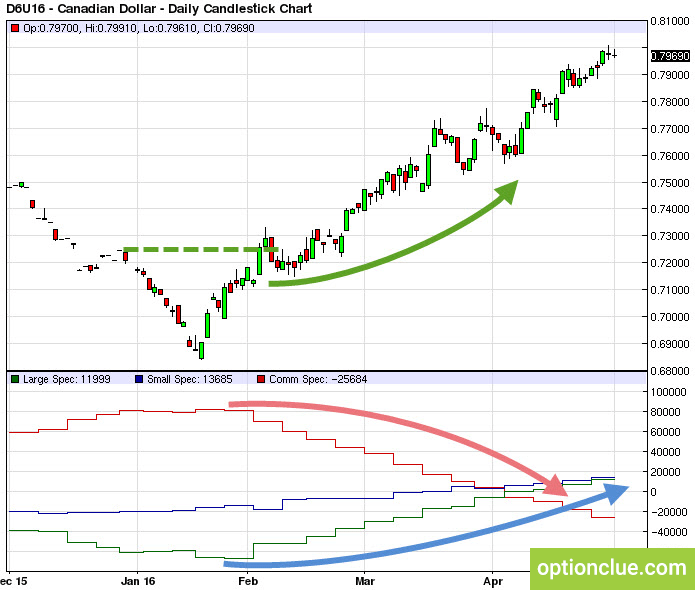
In December 2015 – January 2016 the Canadian dollar was rapidly falling and one could observe an aggressive bearish trend. In the second half of January prices began to strengthen, net position indicator of large speculators was declining during two weeks and it reversed only in early February. This happened simultaneously with the technical resistance level breakout (breakout signal).

Fig. 3. Canadian Dollar, D1. The reversal of the net position indicator coincides with the change in the medium-term trend direction
The medium-term trend in the Canadian dollar market became bullish while large players supported this price movement direction. Bearish positions ceased to be relevant whereas bullish positions became attractive again.
Now the technical picture on the Daily timeframe began to be combined with large speculators’ and hedgers’ opinion. As a result, buy positions became relevant again and position size can be standard.
The aggressive option of market entry is the search for another breakout while the conservative one is the pullback from the level after the correction is completed (on February the 9th or 12th).
Please note how professionally large speculators act. They are able to hold a position as long as there is a trend in the market: net position was growing during several weeks simultaneously with the market from January to May (!).
Look at any similar unidirectional market movement – the longer the trend exists, the more pessimists will be in the news flows arguing in favor of a quick trend reversal, and the more market opinions volatility will be. The ability to distance yourself from this noise is the most valuable skill for a trader and the graph above illustrates that large speculators have extremely mastered it.
Conclusions on CFTC or COT
It is impossible to determine the trend length in advance. The trend can develop during several months or stop after the first impulse wave. At the same time, thanks to COT indicator, you can get ready for the possible market movement and join it at an early stage of its existence.
CFTC statistics allows you to improve your trading plan, reasonably vary risk per trade and change money-management settings depending on whether major players opinion is combined with the technical picture or not. This is a simple and efficient option for integrating COT indicator into any medium-term trading strategy.
In the next articles of «How to use CFTC reports in trading» cycle we will consider the remaining COT indicator signals and discuss in detail the options for their integration into the medium-term trading system.
Good luck in trading!
