Crypto Markets Overview for August 3

We make up a crypto markets overview containing the detailed technical analysis on Bitcoin and top altcoins. The market analysis is performed on the Daily timeframe.
Key topics
- Bitcoin (BTC/USDT)
- Ethereum (ETH/USDT)
- Binance Coin (BNB/USDT)
- Dogecoin (DOGE/USDT)
- Polkadot (DOT/USDT)
- Bottom Line
Bitcoin (BTC/USDT)
The market is in the uptrend on the Daily timeframe starting from July 19, after breaking through the upper border of the resistance level – $21,955.
In spite of the correction, the trend is still bullish on the Daily price chart.
This correction formed another resistance with the borders of $24,810 – $23,900. This price zone will be the target for the bullish movement continuation after the correction is finished. A pullback may be formed even today if the Daily candle is bullish.
In case of successful development of the trend, a more distant target will be on the highs of June 6 – 8, where the next resistance is located with the borders of $31,965 – $31,400.
Signals to buy will be relevant until the market is above the nearest support level on the Daily timeframe, the lows of July 25 – 27. The borders of this support are $20,600 – $21,220.

Bitcoin / U.S. Dollar. Daily price chart. Technical analysis.
Ethereum (ETH/USDT)
The market remains in the uptrend on the Daily timeframe. Another resistance with the borders of $1,603- $1,669 was broken on July 28. In spite of correction, the trend is still bullish on the Daily price chart.
This correction formed another resistance with the borders of $1,736 – $1,804. This price zone will be the target for the bullish movement continuation after the correction is finished. A pullback may be formed even today if the Daily candle is bullish.
In case of successful upward movement, a more distant target will be on the highs of June 4 – 8. This is the price range with the borders of $1,864 – $1,929.
Long positions will remain relevant until the market is above the nearest support level on the Daily timeframe, the lows of July 25 – 27. The borders of this support are $1,358 – $1,438.

Ethereum / U.S. Dollar. Daily price chart. Technical analysis.
Binance Coin (BNB/USDT)
The market is in the uptrend on the Daily timeframe. Another resistance level with the borders of $268.5- $274.5 was broken on July 28. The correction is being formed now.
A pullback buying opportunity will appear after the correction completion on the Daily chart. On July 29 – 31 this correction formed another resistance with the borders of $293 – $301.
When the correction is finished and we see the pullback, this price zone will become the target for the bullish movement. The price chart proves it can happen today. But the movement potential to the nearest resistance is not so big.
If the market is closed above this resistance successfully, the price is likely to move forward to the target #2 – it is the resistance level with the borders of $322 – $325 formed on May 30 – June 1.
Long positions will remain relevant until the market is above the nearest support level on the Daily timeframe, the lows of July 31 – August 2. The borders of this support are $275 – $282.5. This is a major level since it coincides with the last broken resistance.

BNB / U.S. Dollar. Daily price chart. Technical analysis.
Dogecoin (DOGE/USDT)
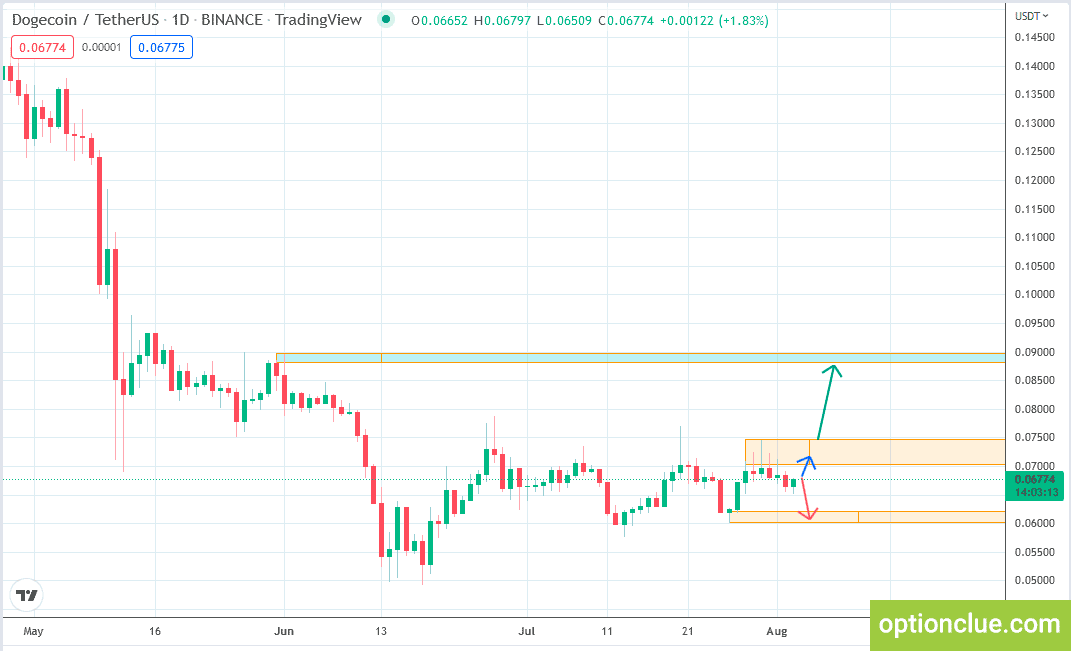
Dogecoin has been in the sideways trend on the Daily price chart since the end of June. The nearest resistance level was formed on July 28 – 31. It is the price zone between $0,070 – $0,074. The nearest support was formed on July 25 – 27. Its price zone is between $0,062 – $0,059.
Now the price is approaching the resistance level and the flat will possibly continue since the price can form a pullback around the resistance.
The second scenario is the resistance level breakout. It opens the way to move towards target #1. It is the next resistance level with the price range of $0,088 – $0,0896.
When breaking through the support, the movement potential is limited since the price will be still inside the support zone of a higher timeframe (Weekly timeframe).

DOGE / U.S. Dollar. Daily price chart. Technical analysis.
Polkadot (DOT/USDT)
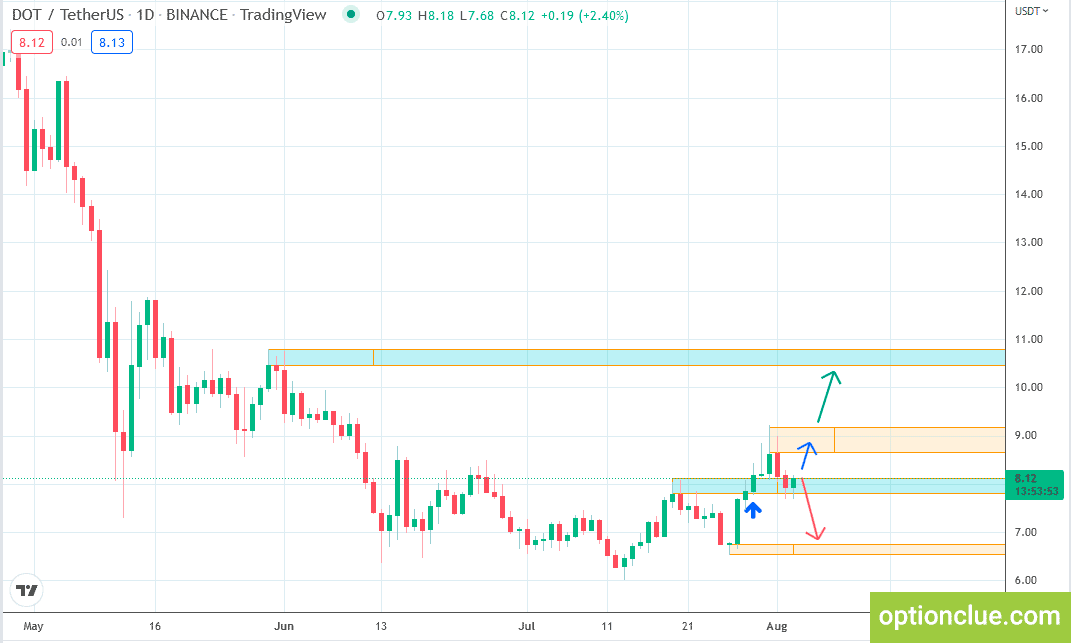
The resistance level with the upper border of $8.12 was broken on the Daily chart on July, 29. Since then, the market has been in a bullish trend on the Daily timeframe, while a correction wave is developing now.
A pullback buying opportunity will appear after the correction is finished and a bullish candle is formed on the Daily timeframe. According to the price chart it may happen even today.
On July 29 – August 2 the current correction formed the resistance level with the borders of $9.18 – $8.64.
This price range will become the first target after the bullish impulse starts.
If the market is above this resistance, then the price can move towards target #2. It is the resistance level formed on May 29 – June 1. This target is around $10.44 – $10.78..
The longs will remain relevant until the market is above the nearest support level on the Daily timeframe, the lows of July 25 – 27.

DOT / U.S. Dollar. Daily price chart. Technical analysis.
Bottom Line
In terms of medium-term trading, tokens with the correction close to completion on the Daily timeframe and with potentially the most promising risk-reward ratio are Ethereum, Bitcoin and Polkadot.
Many tokens have already broken the bearish trend and are moving up. That may indicate the beginning of the of the crypto market recovery.
In the near future, many tokens will provide excellent opportunities to enter the market with a unique reward / risk ratio.
We used support and resistance levels for the analysis in this market overview.
FYI. We are building an indicator that will automatically plot key levels on all timeframes on all popular tokens..
 Subscribe to our Telegram channel, dedicated to cryptocurrencies.
