Option to Purchase. Efficiency of Weekly Options Alert of OptionClue Options Screener.

Contents
- How to choose stocks for options trading
- Building an option portfolio based on the OptionClue screener
- Changes in yields of options by the example of 3-month straddles
- Conclusions on the yields of screener trading signals
How to Choose Stocks for Options Trading
In this article we’ll analyze the statistics on the return of trading signals that were generated by OptionClue options screener according to the option’s attractiveness general index designed in the Fireball Screener (in the former version it’s Alpha index).
The index takes into account conditional «high cost» or «cheapness» of options, as well as the market condition and the movement potential (flats, triangles and strong trends).
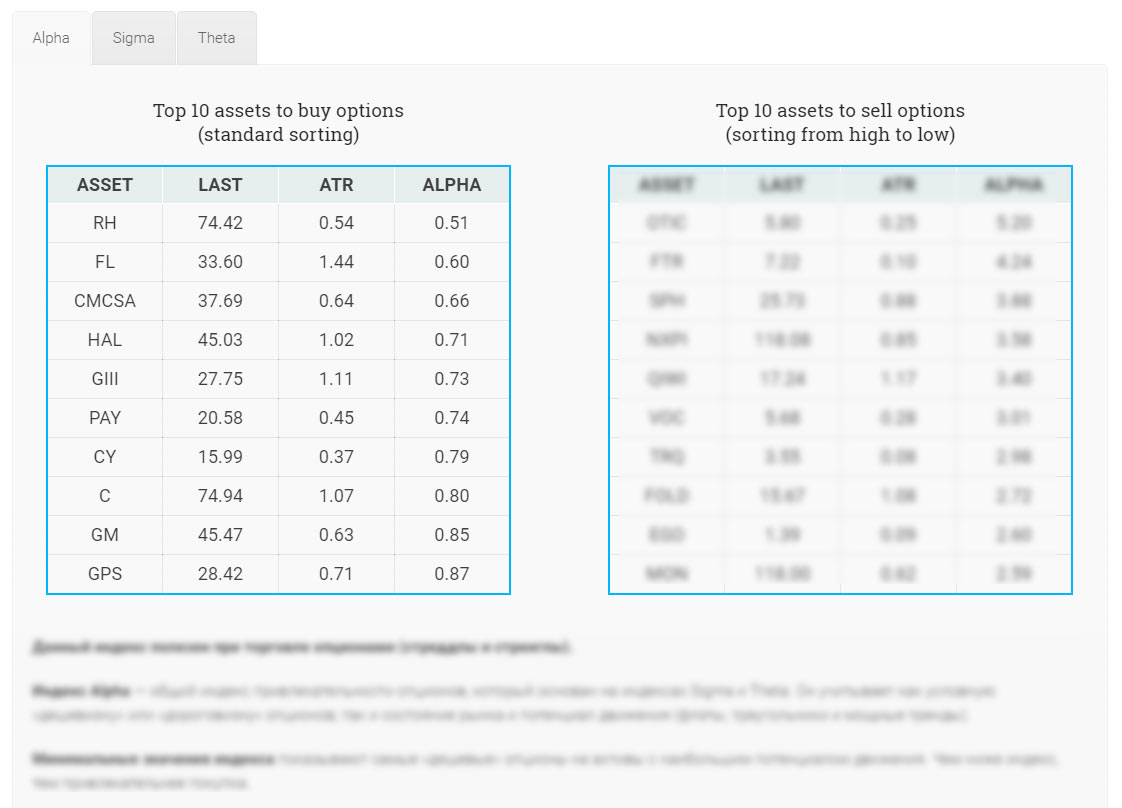
We will focus on minimum index values represented in the straddle and strangle stock option screener table. Alpha index values of 1.0 and lower, indicate the attractiveness of purchases, and you can find very interesting opportunities to enter the market among them. As a rule, stocks with minimal index values are in the top of the real options analysis table.
To start trading options, you should follow 3 simple steps as described below:
- on the site optionclue.com go to the section «Straddles and strangles OptionClue screener»
- open Alpha index and analyze the table «TOP 10 assets to buy options» and select stocks with minimum Alpha values, especially with Alpha of 0.75 and lower
- in the trading platform (for example thinkorswim trading platform) find 3-month options with strike prices closest to the current stock price and buy underlying straddles or strangles taken from the screener
Building an Option Portfolio Based on the OptionClue Screener
Free options screener for searching promising assets was created in early October. The first set of trading signals of the screener is presented below. On 11.10.2017, the option analyzer identified 6 stocks with Alpha index under 0.75. The expiration date of 3-month underlying options is January 19, 2018.
Stocks for building a profitable option portfolio (purchase of straddles) as follows:
- RH (Alpha 0.51, strike 75)
- FL (Alpha 0.6, strike 34)
- CMCSA (Alpha 0.66, strike 37.5)
- HAL (Alpha 0.71, strike 45)
- GIII (Alpha 0.73, strike 30)
- PAY (Alpha 0.74, strike 21)
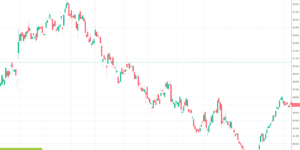
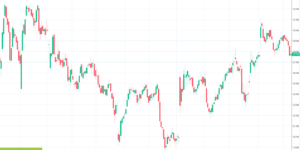
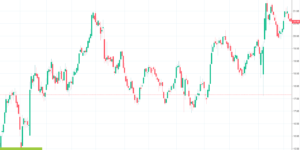
As we can see from the stock price charts, most of the shares at the time of option positions opening are in the flat. This is due to the fact that Alpha index is also based on Sigma index (trend screener) that identifies assets with low and high volatility and it’s included in the full version of the OptionClue options screener software.
So, we buy options with these parameters and in the future we will monitor the change in straddle prices within an interval of 1 or 2 weeks.
Changes in Yields of Options by the Example of 3-month Straddles
Straddle prices at the time of purchasing stock options were:
- RH straddle price – $19.29
- FL straddle price – $5.65
- CMCSA straddle price – $3.21
- HAL straddle price – $4.54
- GIII straddle price – $5.67
- PAY straddle price – $2.69
To make profit in the options market, the straddles prices when buying options need to increase with time. And since the straddle price depends on volatility and the stock price, as well as on the time to expiration, I recommend you to look how the price changes with time:
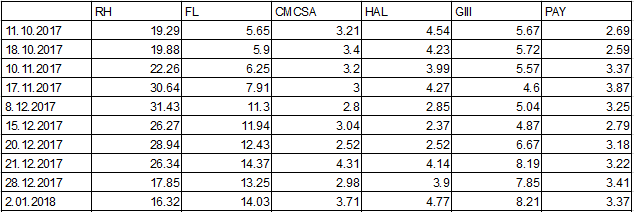
Changes in straddle options prices from October 11, 2017 to January 2, 2018. Data from thinkorswim trading platform.
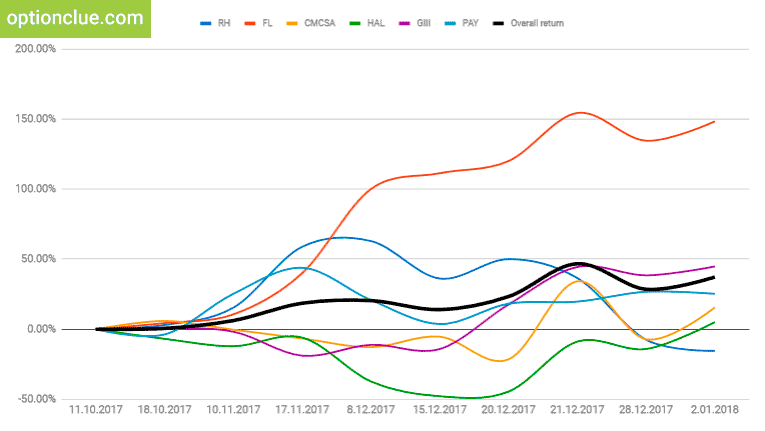
For illustrative purposes, let’s look at the change in straddles prices in percentage terms (Fig. 8). Data for October 11 are taken as a starting point and all further calculations are made regarding this date. We analyze the change in yield as for a single option combination, and for the portfolio as a whole («Overall return» column):
As we can see, during the first week prices had hardly changed, and the aggressive yield growth started about a month after the purchase of straddles, reaching a value of 18% in 5 weeks (November 17, 2017).
The yield of portfolio peaked the rate of 46% since buying options on December 21 (9 weeks later).
It should be noted that on December 28, 2017 the portfolio yield decreased to 28% (for 10 weeks) primarily due to changes in the stock market in the run-up to Christmas holidays, and by January 2, 2018, the overall return of portfolio began to increase again and reached 37% for the reporting period (slightly less than 3 months).
Five of the six stocks included in portfolio have a positive return and only RH was negative on January 2, 2018, although this share yielded about 50% earlier.
Conclusions on the Yields of Screener Trading Signals
The diagram below shows the change in the yield of individual option positions and the portfolio as a whole from October 11, 2017 to January 2, 2018.
In options trading when using all screener option trade alerts based on Alpha index simultaneously, we get the steadier and smoother yield curve (black line).
As we can see from the diagram, the portfolio yielded 18% in about a month, and in a little more than 2 months, the yield reached 46%.
This means that you can take profit or start hedging options positions (when important support and resistance levels are reached, and if a trend reverses) long before the 3-month options expiration date, and also use next screener trading signals when building a new investment portfolio.
The best way for maximizing profits when trading in the options market is to use the OptionClue options screener, which saves a lot of time and generates relevant option alerts to trade straddles and strangles every day. With this tool you’ll have no doubts about what stock options to buy now.

