How to Find Top Stock Options to Buy Now? Free Straddle Screener and Alpha Options Scanner.

Choosing of assets for trading can take a long time, especially when it comes to options trading. Keeping this in mind, we’ve created the options screener that saves your time and helps find new trading ideas based on a simple principle – buying cheap options or selling expensive ones.
There are hundreds of assets in the market that may be interesting for trading. This is a large amount of information that needs to be analyzed every day to get ready for trading. This is especially important when trading options, when it’s necessary to take into account not only the indexes condition and certain stocks charts, but also options prices and volatility.
To speed up this process, we have created a number of indexes that extremely simplify the process of preparation for trading, make required calculations and the primary market analysis and save time. One of such indexes is Alpha, which is included in the full version of the OptionClue options screener.
This indicator is applicable for options trading and it was created for strangle and straddle trading and search for market entry points and further options positions control. As an index of general option attractiveness, Fireball Screener (or Alpha index) is good for trading in various market conditions, ranging from sideways trends and triangles to active directed market movements that are formed on the Daily timeframe. Alpha index lets identify assets that are currently noteworthy and may be interesting for selling and purchasing stock options.
In this article we will analyze the principles of using Alpha index in the medium-term trading and demonstrate what stocks are attractive or, on the contrary, uninteresting for finding an entry point in the options market.
Contents
- How to use Alpha index in the medium-term trading
- How to find real options to buy by the example of Halozyme Therapeutics stock
- The search for expensive options that are worth selling by the example of Monsanto Company share
- Analysis of the stock from the middle of the screener by the example of Sealed Air Corporation
- Conclusions on Alpha option screener for traders
How to Use Alpha index in the Medium-Term Trading
The index of attractiveness Alpha is displayed in the stock option screener (comparative table), which also shows stock tickers, the last asset price at the time of indexes calculation and ATR (Average True Range – average intraday asset volatility).
Low Alpha values show the «cheapest» underlying options (worth buying) with the greatest movement potential. High index values indicate the most «expensive» underlying options (worth selling) with the lowest movement potential.
Alpha index is based on Theta index (or Cheapness Screener index) and Sigma (or Volatility Screener index) index. Theta index allows you to divide options into «cheap» and «expensive» taking into account the option price and recent market volatility. Sigma index lets identify assets with low volatility (for example, flats and triangles) and high volatility (trends – directed price movements).
Alpha index is self-contained and can be used to analyze the general attractiveness of assets to buy and sell options and option combinations (straddles and strangles).
At the same time it’s fair to ask how many stocks from the list are noteworthy and what index values can be considered high or vice versa low. The answers to these questions can be obtained empirically. According to our observations, the first 10 stocks in the top and bottom of the screener are the most interesting. One should pay attention just to them and use that for more detailed analysis (in particular, the analysis of implied volatility, which is not taken into account in the calculation of index).
The index values of these stocks stand out among the rest of the table, that is, the options prices and market movement potential, as a rule, will be more attractive. Therefore, the probability of obtaining a positive result when trading options, including straddles and strangles will be often much higher in comparison with the stocks from the middle of the list.
Let’s take some examples of using the index (we were analyzing the index values during 15 days to form a sample of shares for this article).
How to Find Real Options to Buy by the Example of Halozyme Therapeutics Stock
The first example is Halozyme Therapeutics (HALO). As we can see on the chart below, the price was gradually increasing and the company was the leader in the TOP 10 assets to buy options on October 16, 2017, that is, it made sense to buy a straddle. The Alpha index value was 0.61. The straddle price with a strike price of $18 was $2.55 (the average price between Ask and Bid was used for calculations when writing the article).
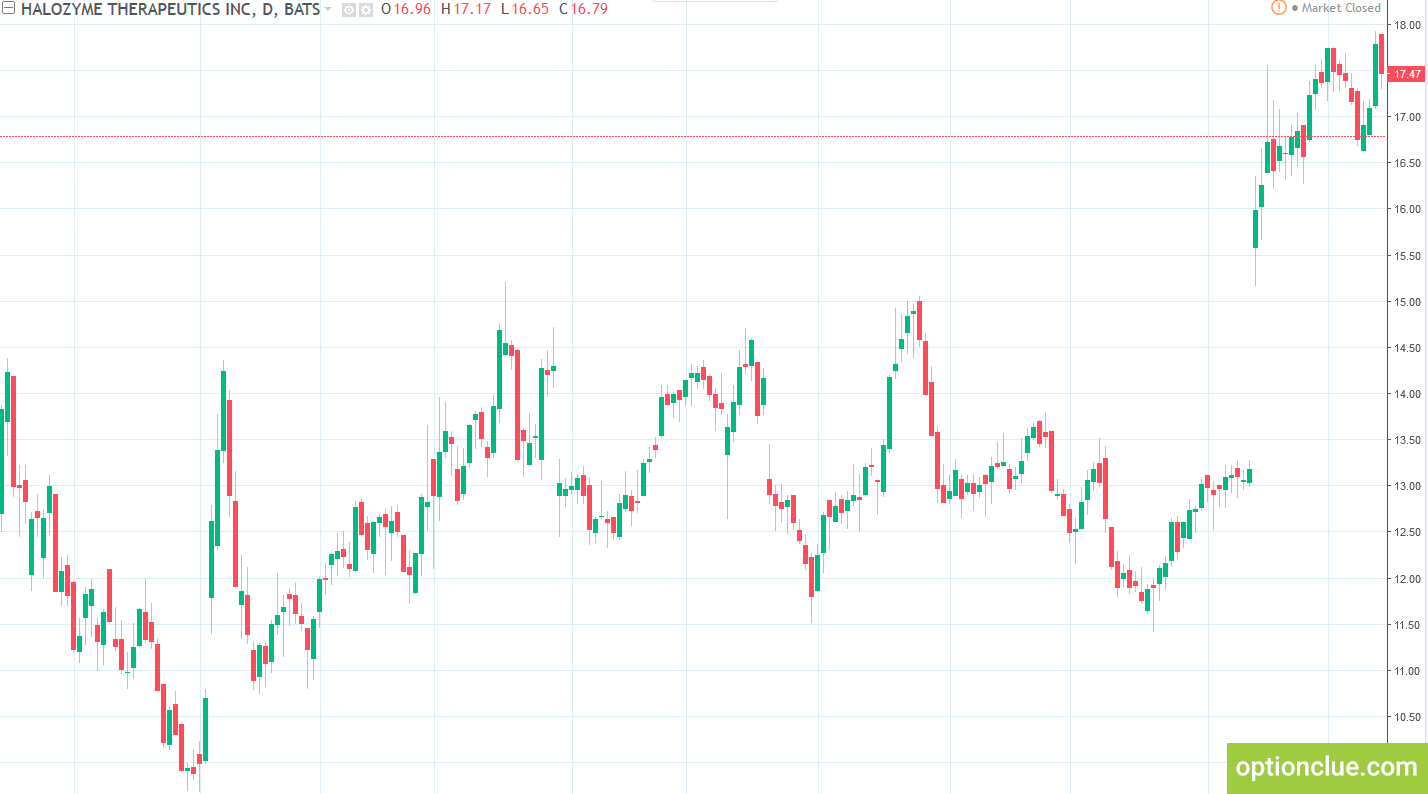
Figure 1. Halozyme Therapeutics (HALO). Alpha index was 0.61 (ranked 1st in the TOP 10 assets to buy options)
In our experience, the most attractive stocks to buy options can be found when the Alpha value is below 1.0 and especially below 0.25.
Let’s see how things were going further. Figure 2 shows the market condition on October 20. A week later, the stock was already $17.77 and the market remained in the upward trend. Alpha index increased to 0.89 and the stock moved down to the 49th place on the list.
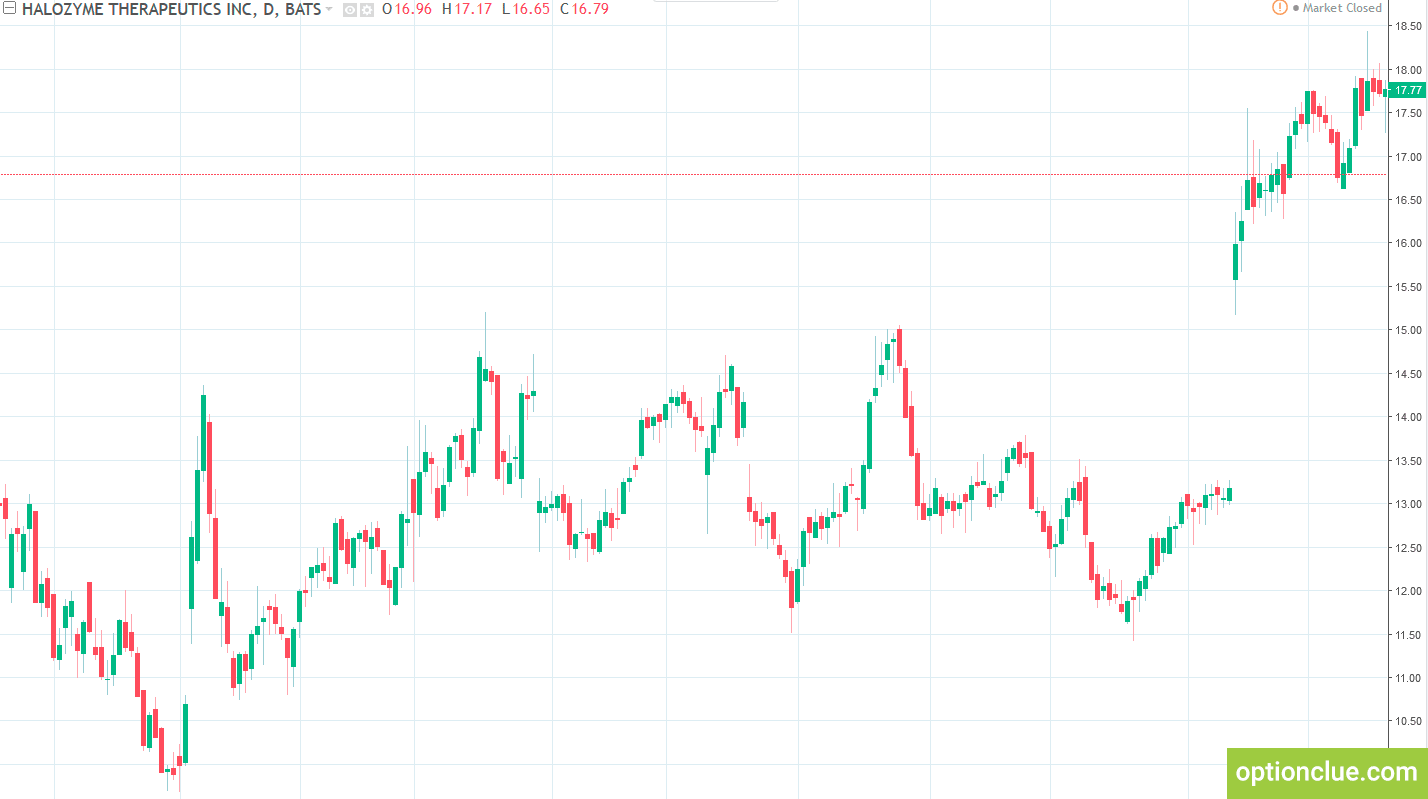
Figure 2. Halozyme Therapeutics (HALO). Alpha index was 0.89 (ranked 49th in the TOP 10 assets to buy options)
At the same time, the straddle price increased by 12% over the last week (data from Thinkorswim trading platform) and was already $2.85.

Figure 3. Halozyme Therapeutics (HALO). Thinkorswim trading platform. The straddle price increased by 12% to $2.85.
This example clearly shows the principle of finding stocks in the option analyzer. The lower the Alpha value, the more profitable its purchase can be.
The Search for Expensive Options that are Worth Selling by the Example of Monsanto Company Share
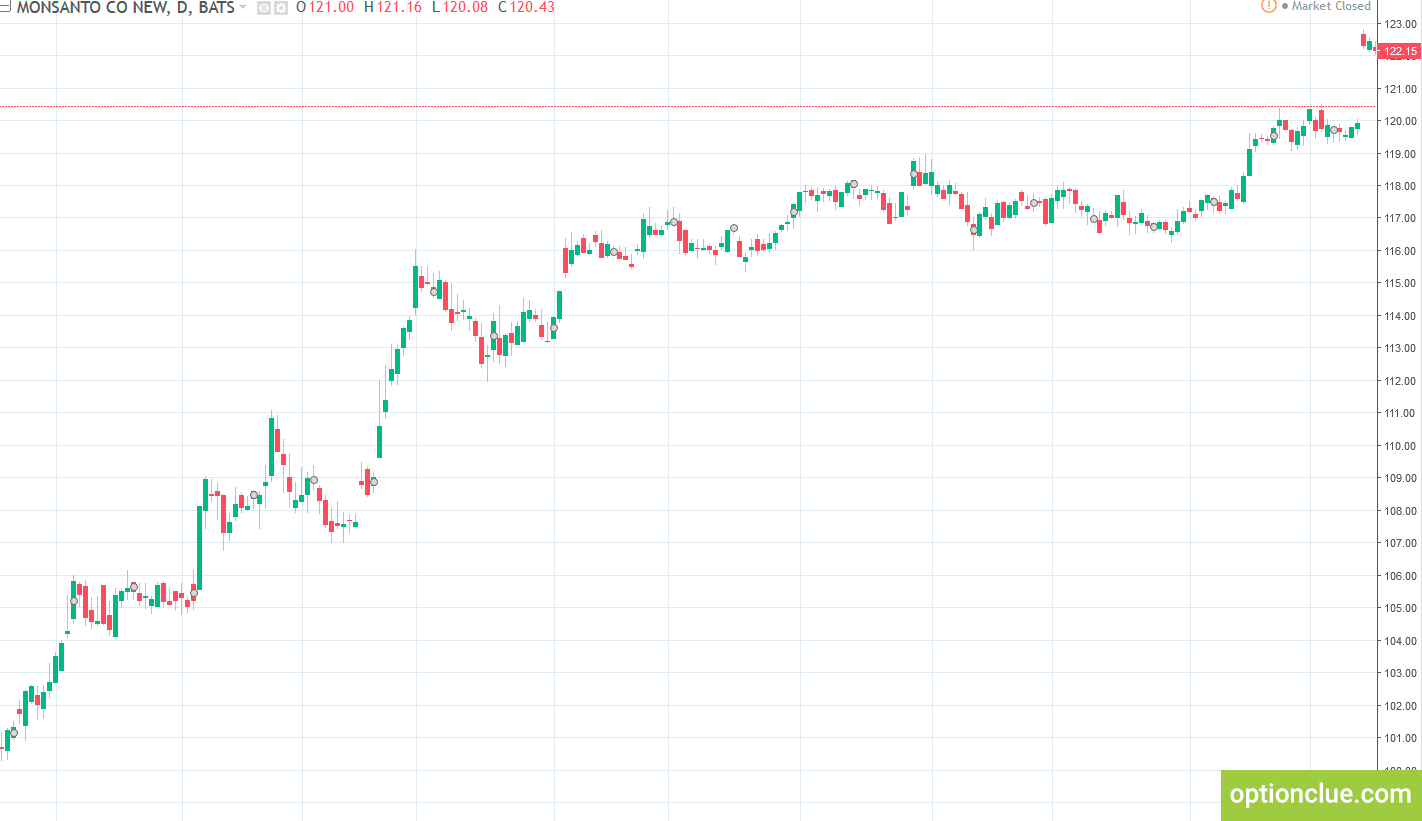
Let’s take the second example – Monsanto Company (MON). Figure 4 demonstrates that the price fluctuated in the narrow price range for several weeks and ranked 8th in the TOP 10 assets to sell options on October 12, 2017. The Alpha index value was 2.57. ATM straddle price was $6.75.
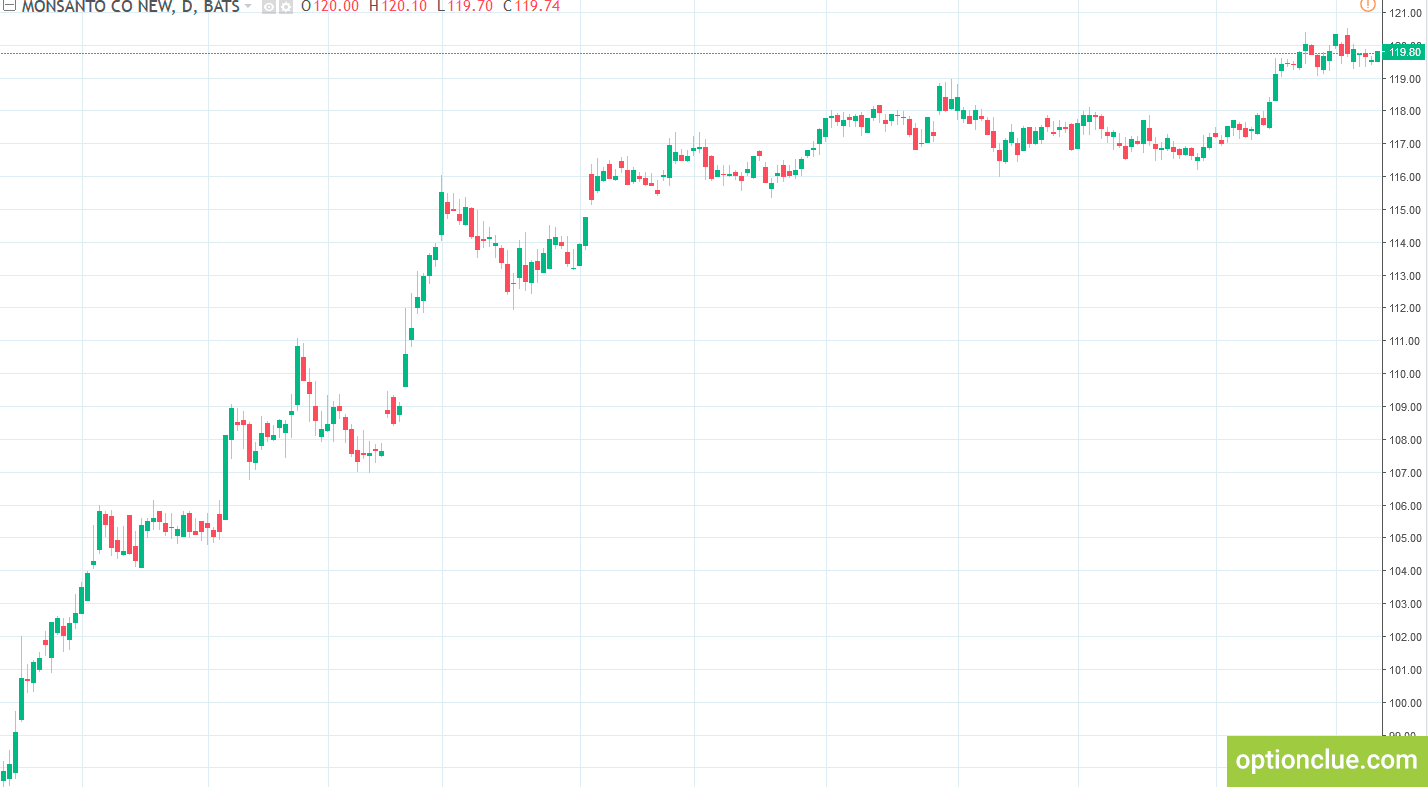
Figure 4. Monsanto Company (MON). Alpha index was 2.57 (ranked 8th in the TOP 10 assets to sell options)
In our experience, the most attractive stocks to sell options can be found in shares with the Alpha value of 1.5 and higher.
Based on the above, we can conclude that the straddle price is high relative to the other stocks and the options selling may be interesting.
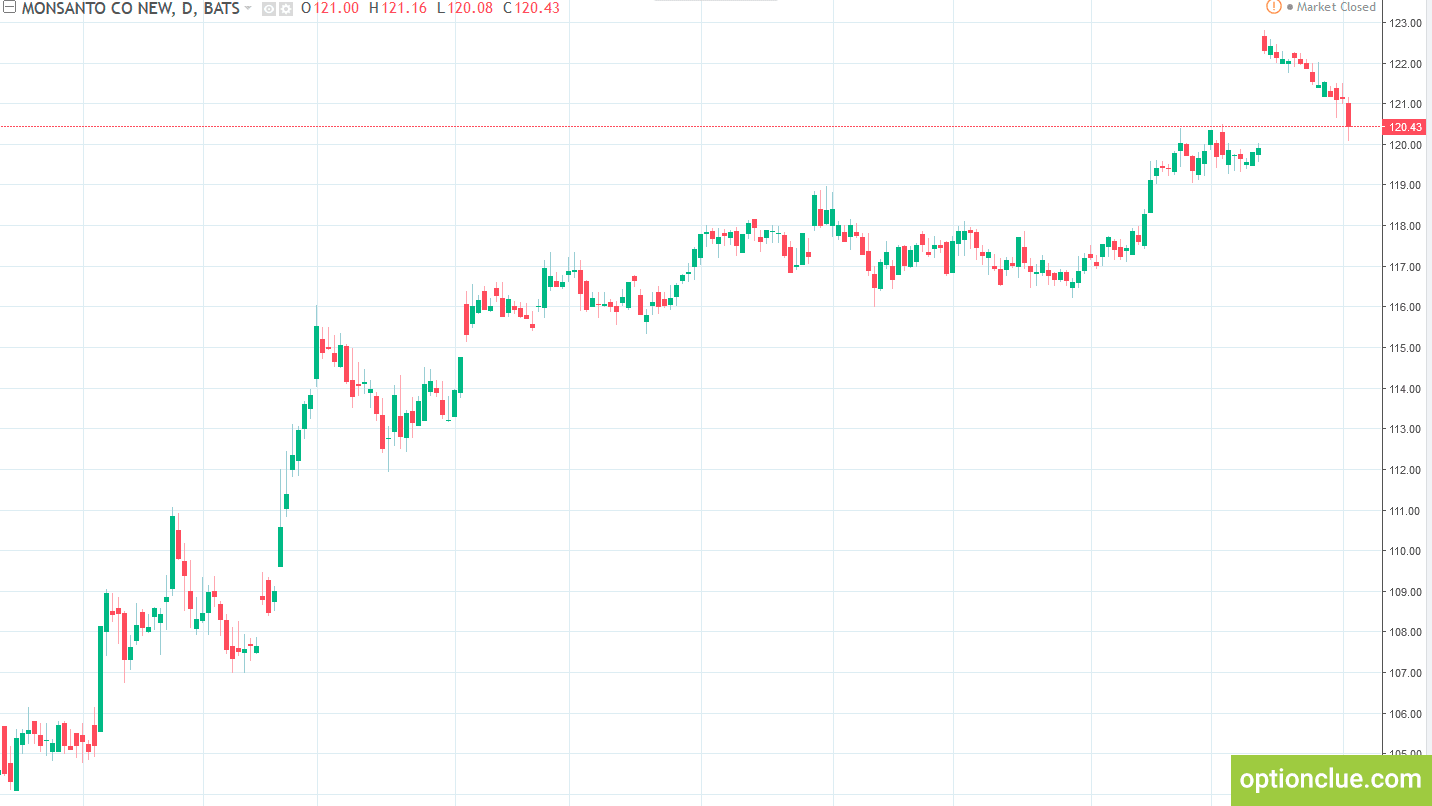
The chart below shows the market condition on October 18, 2017. 6 days later the stock was already $122.15. The market broke through this price range, closing above the resistance level with a gap. Alpha index was 2.79.
Despite the aggressive market movement, the price of 120 straddle decreased by 18% to $5.52 over the past 6 days (data from Thinkorswim trading platform).

Figure 6. Monsanto Company (MON). Thinkorswim trading platform. The straddle price decreased by 18% to $5.52
The stock price was $120.43 on November 3, 2017, the market declined to the previously broken resistance level (Figure 7).
At the same time, the price of 120 straddle decreased by 27% over the past 3 weeks and was already $4.9 (Figure 8)
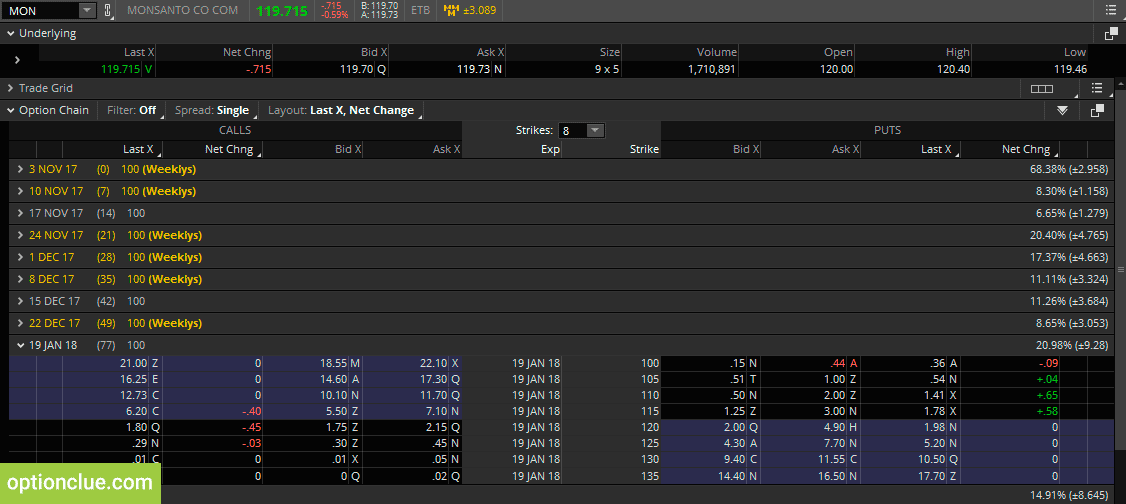
Figure 8. Monsanto Company (MON). Thinkorswim trading platform. The straddle price decreased to $4.9
Analysis of The Stock from the Middle of the Screener by the Example of Sealed Air Corporation
Let’s take the example when the stock is not in the TOP, but in the middle of the list.
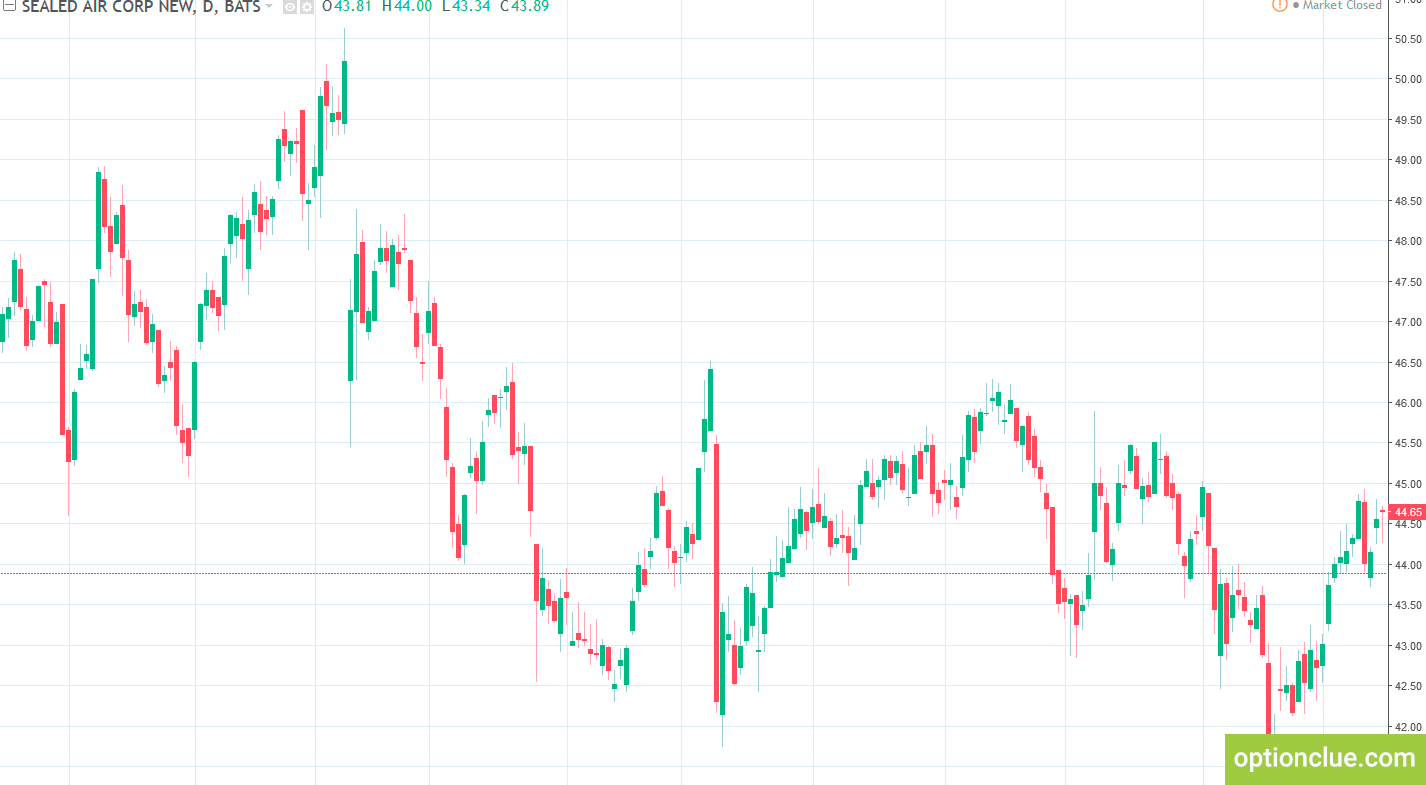
As we can see on the chart below, the market moved quite randomly, the stock price was $44.65 on October 13, 2017 and ranked 120th in the free options screener. The Alpha index value was 1.42. The straddle price was equal to $3.90.
There is no pronounced trend, just as there are no triangles or flats. The index doesn’t give interesting signals regarding this stock. The asset is of little interest in terms of both options buying and options selling.
Conclusions on Alpha Option Screener for Traders
Alpha index is a simple and efficient tool for finding stocks that can be interesting for underlying options trading at the moment.
The index values can be sorted ascending and descending, choosing the highest or lowest values. Minimum Alpha values indicate the «cheapest» options when the related assets have the greatest movement potential. The maximum values indicate the most «expensive» options when the related assets have the lowest movement potential.
To determine the most interesting stocks, one should analyze the screener data beginning from the upper and lower part of the list according to the goals that a trader sets. You can find the most attractive shares from the 1st to the 10th position both in the upper and lower part of the table. Stocks from the middle of the list can become the future participants of the TOP, and you can hardly find something interesting among them now.
Alpha index values below 1.0 and especially below 0.25 indicate the attractiveness of purchases and you can find very interesting opportunities for entering the market. Opposite index values, ranging from 1.5 and higher indicate the attractiveness of short positions.
As an additional filter, it’s recommended to use implied volatility (IV). If Alpha index is low and implied volatility is around 6-12 month lows, it can be an excellent buying opportunity. The best signals for selling options are formed when the stock is in the Alpha Top and the implied volatility is around 6-12 month highs.
The examples above show that when trading stocks from the top and bottom of the list you can get the results within several days, despite the testing process is based on 3-month options. In our experience, this can take 5-10 working days, sometimes longer.
The screener lets you go through hundreds of assets in minutes and identify the most attractive options from a huge stock list and thus it saves your time. You should just analyze the selected financial instruments and wait for the optimal price to enter the market. Our best option trading strategy provides the opportunity to determine which stock options to buy or sell in order to benefit much.

