How to Find Best Stocks and Options to Buy Today? Flats and Trends Stock Screener.

Choosing of assets for trading can take a long time, especially when it comes to options trading. Keeping this in mind, we’ve created the options screener that saves your time and helps find new trading ideas based on a simple principle – buying cheap options or selling expensive ones.
By studying various financial markets for a long time, we agreed on the need for automation of analytics. In order not to go through hundreds of assets every day, we created several indexes that let you get ready for trading efficiently and make decisions with a clear head, since most of the calculations are automatic. According to such indicators, we can assess the market volatility and find assets with a pronounced growth or decline potential as well. One of such indexes is Sigma, which is included in the full version of the OptionClue options screener.
Sigma index lets identify assets with low market volatility (flats and triangles) and high market volatility (trends). It’s applicable for a breakout trading, when the market may soon change its direction from a sideways trend condition to an uptrend or downtrend. This index also lets you find assets quickly that are already in active directed movement on the Daily timeframe. This indicator is useful both in classic trading in the stock market and in options trading.
In this article we will analyze the principles of using Volatility Screener (or Sigma index) in the medium-term trading, assess how many assets in the common list are noteworthy, and we’ll take the examples.
Contents
- How to use Sigma index in the medium-term trading
- The search for flats and triangles in the stock market by the example of Herbalife
- The search for flats and triangles for stock trading by the example of Prospect Capital Corporation
- The search for flats and triangles in the share market by the example of Foot Locker
- The search for stock trends by the examples of International Business Machines, W.W. Grainger, Inc and Glu Mobile
- Conclusions on Sigma stock screener
How to Use Sigma Index in the Medium-Term Trading
Sigma index lets you find assets quickly with the lowest volatility when flats and triangles are formed on the chart, as well as the assets with sweeping price movements, when uptrends or downtrends dominate in the market.
Low index values indicate that the period of low volatility dominate in the market now, a certain converging formation takes place and there is no strong directed market movement. Usually that means that the price can soon go out of the narrow price range, breaking through the nearest support and resistance levels. In such moments the market is often like a compressed spring.
Such assets can become an adequate addition to your trade list – it’s a list of assets that may be interesting for a breakout trading on the Daily timeframe right now or in the near future, or within a day after going out of the sideways trend.
Depending on the options prices, straddles and strangles trading may be relevant (Theta and Alpha indexes complement Sigma index and simplify the process of finding entry points in the options market).
High index values indicate the existence of the directed price movement, when you can see a pronounced trend in the market, when the price is in the impulse or correction waves and the market is in the active phase of the movement.
Assets with a high Sigma index value will be good for a classic breakout and pullback trading on the Daily timeframe, as well as for day traders who trade stocks intraday and these stocks are in a directed trend on the Daily timeframe.
Option traders who trade in the upward and downward trends on the Daily timeframe can also use a sample of high Sigma index values to find the best market entry points. Theta index analysis and implied volatility will provide complete information on the feasibility of such market entry point.
It’s fair to ask now how many stocks from the list are noteworthy and what index values can be considered high or vice versa low. The answers to these questions can be obtained empirically. According to our observations, the first 10 stocks in the top and bottom of the screener are the most interesting.
Let’s take some examples of using the index (we were analyzing the index values during 15 days to form a sample of stocks for this article).
The Search for Flats and Triangles in the Stock Market by the Example of Herbalife
The first example is Herbalife (HLF). As we can see on the chart below, the price was in a very narrow flat ($66 – $68) almost the entire September. The stock price was $67.51 on October 4, 2017 and Sigma index was one of the lowest. The stock was the 5-th in the list of Top 10 least volatile assets. The Sigma index value was 0.7.
In our experience, the most attractive flats and triangles can be found in stocks with the Sigma value of 0.8 and lower.
Low index values often indicate that the probability of breaking through this price range in the near future is high. There is a great opportunity for traders, who are looking for similar market conditions, to find an entry point when the price breaks through the next horizontal levels or look for a market entry before the breakout.
Let’s see how things were going further. Chart 2 shows the market condition on October 10. A week later, the stock was already $76.84 and the price was about $80 at the top. At the same time, Sigma index also changed and rose to 2.39.
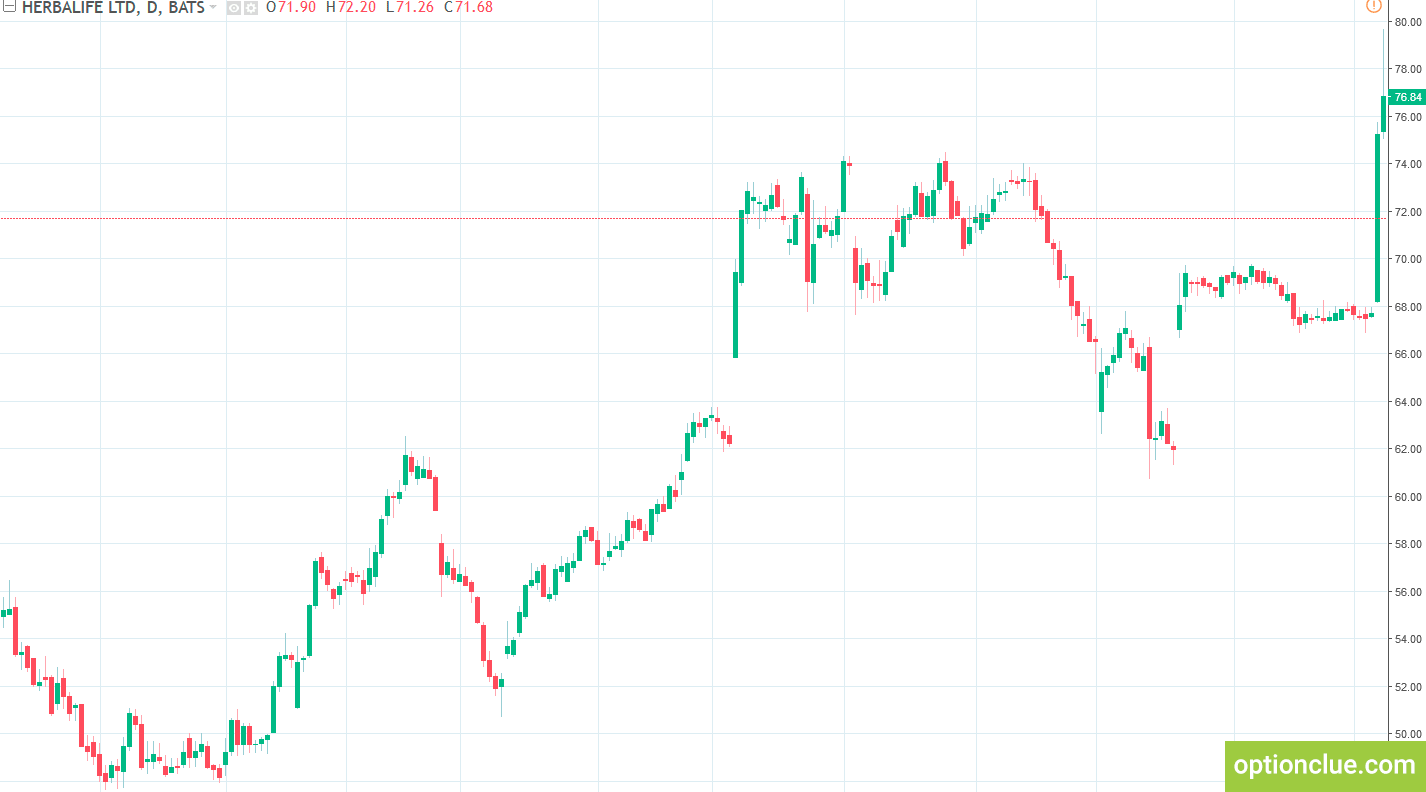
Chart 2. Herbalife (HLF). Sigma index was 2.39, the stock moved to the opposite part of the list (ranked 2nd in the Top 10 most active stocks)
The stock was no longer in the flat, but, on the contrary, there was an active bullish trend in the market and a price increase of more than 13% resulted in a three-fold increase in the index (from 0.7 to 2.39). Herbalife fell into the opposite part of the assets list in the table of the screener and its Sigma index ranked second in the Top 10 most active stocks.
This example clearly shows the main property of Sigma index. Assets with the highest index values are in the active trend, while the lowest index values show assets that are in flats and triangles and they are often ready for active movements after the nearest price levels breakout.
The Search for Flats and Triangles for Stock Trading by the Example of Prospect Capital Corporation
Let’s take the second example. It’s Prospect Capital Corporation (PSEC). The stock fluctuated in the price range of $6.6 – $6.8 during September. The stock price was $6.74 on October 4, 2017. The stock ranked 4th in the top 10 least volatile assets. The Sigma index value was 0.58
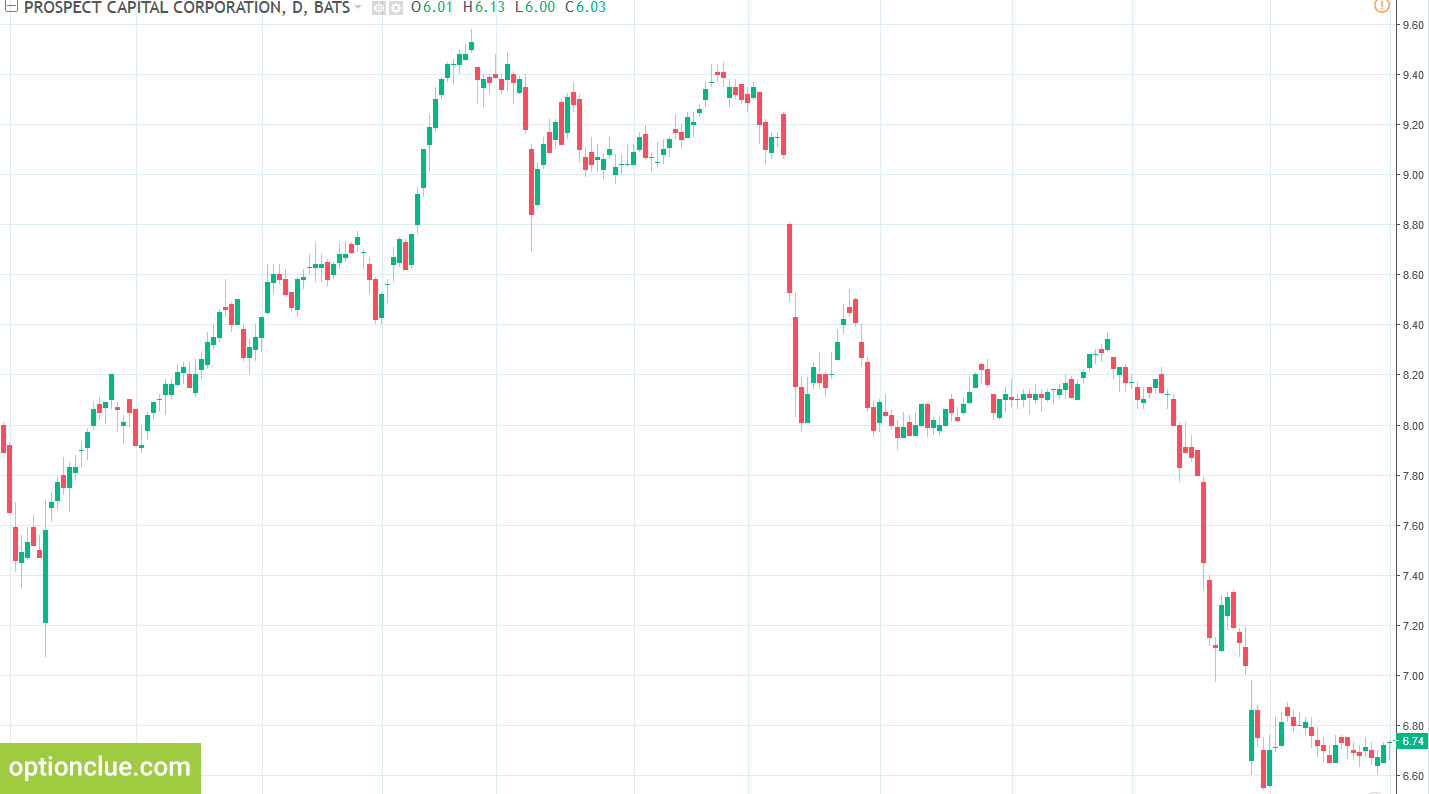
Chart 3. Prospect Capital Corporation (PSEC). Sigma index was 0.58 (ranked 4th in the top 10 least volatile assets)
This stock hit the Top 10 at the time when the flat had already been formed on the price chart. In such moments, the market can rush in any direction within several weeks. You can expect the level breakout and trade after breaking through the range, or analyze Theta index and implied volatility for opening the straddle or strangle combination from the current prices. At times like this, there is often a great opportunity to make profit from the active price movement.
Chart 4 shows the market condition on October 13. The market broke through the support level, went out of the flat down and began to decline actively. The stock price was $6.22, while Sigma index rose to 1.68. The stock decreased by 8% and the market condition changed. The price was in a sideways trend, and the prevailing downtrend continued after the breakout. Sigma index increased 3 times, PSEC moved to the opposite part of the list and ranked 4th in the Top 10 most active stocks.
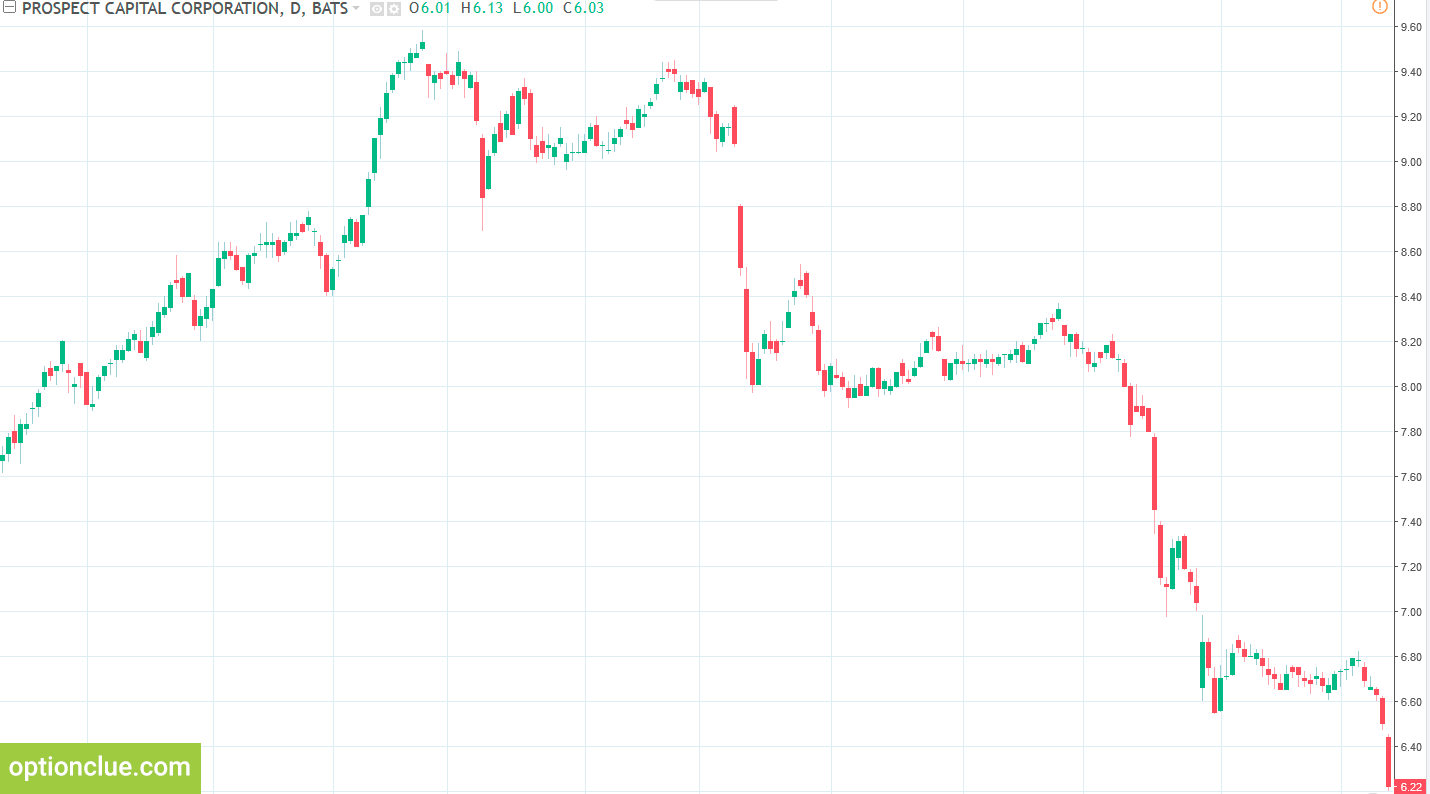
Chart 4. Prospect Capital Corporation (PSEC). Sigma index was 1.68, the stock moved to the opposite part of the list (ranked 2nd in the Top 10 most active stocks)
The Search for Flats and Triangles in the Share Market by the Example of Foot Locker
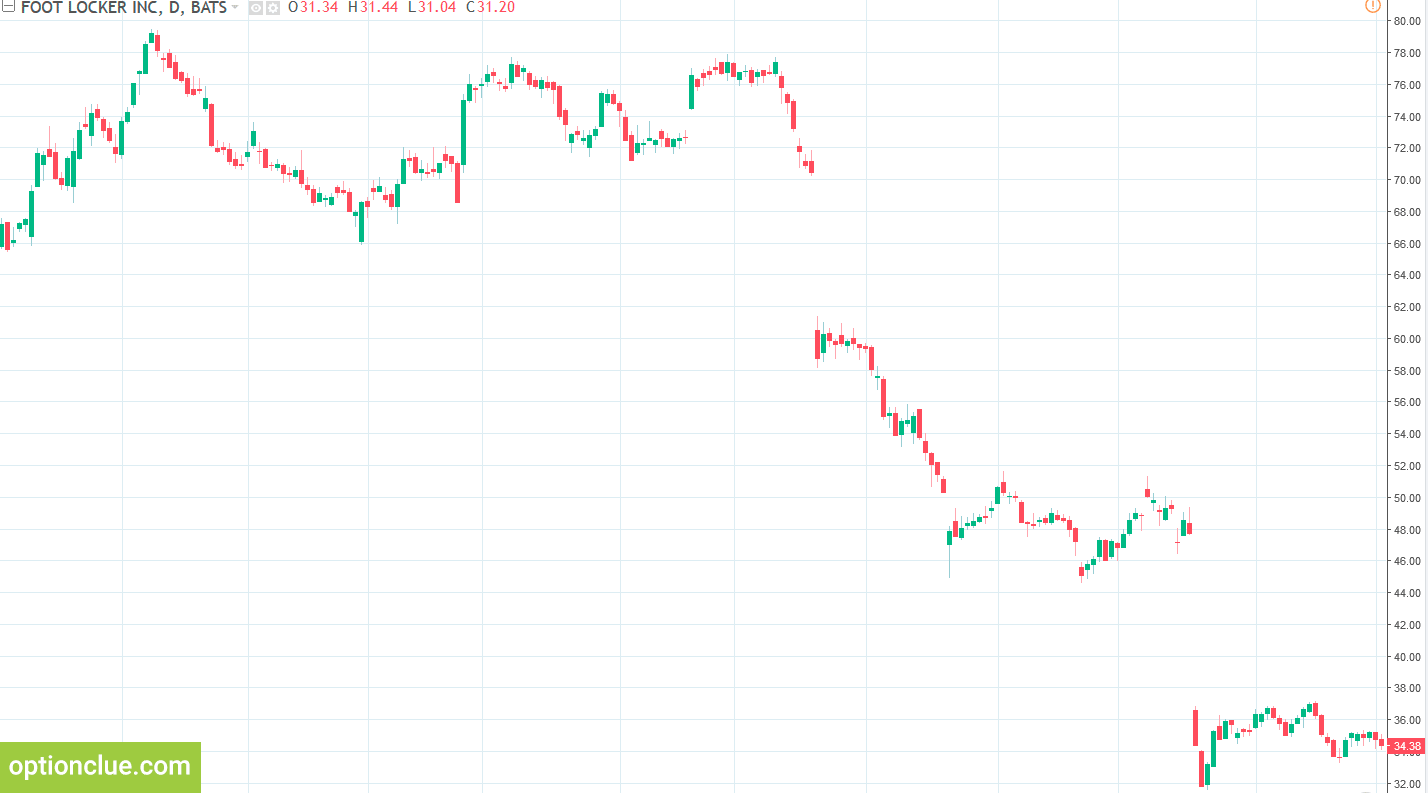
Let’s take one more example of using Sigma index to search for flats and triangles. It’s the stock Foot Locker (FL). The price was in the flat with a price range of $34 – $35 in late September – early October. The stock price was $34.38 on October 4, 2017. Foot Locker was the leader in the Top 10 least volatile assets. The Sigma index value was 0.78
Chart 6 shows the market condition on October 17. The support level was broken and the price fell by 10% to $30.95 within 13 days. Sigma index also changed and rose to 1.23, the stock shifted to the 194th position, indicating the existence of the active trend in the market.
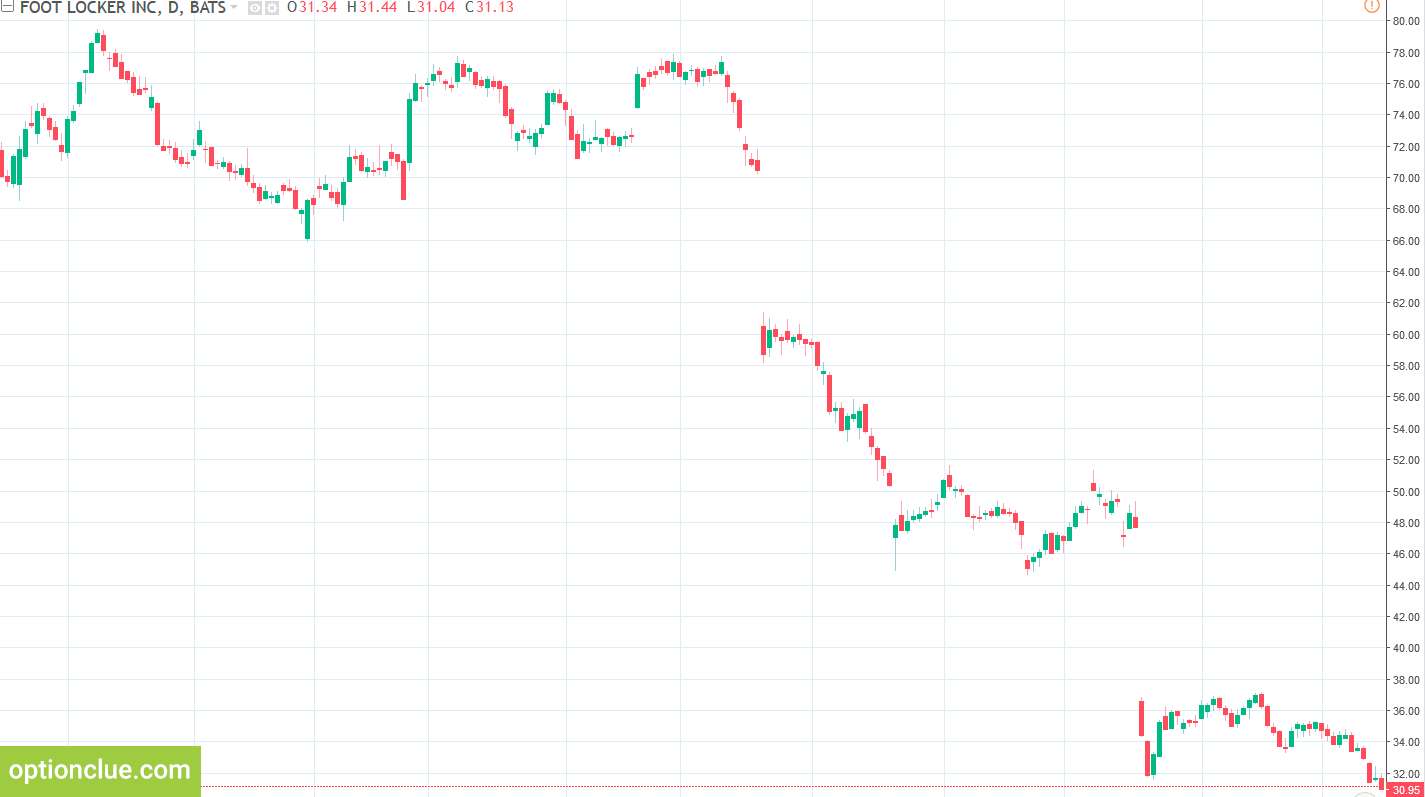
Chart 6. Foot Locker (FL). Sigma index was 1.23, the stock moved from the 1st to 194th position in the ranking
The Search for Stock Trends by the Examples of International Business Machines, W.W. Grainger, Inc and Glu Mobile
Let’s take several examples of searching for stocks that are currently moving actively, are in the trend and may be good for the breakout and pullback trading. To do this, we filter the list and focus on the assets with the highest Sigma indexes (Top 10 most active stocks)
IBM was the stock with the highest Sigma index (index value was 2.41) on October 20, 2017. The stock price was $160.90. The market was moving actively a few days earlier, a huge gap was formed and the price increased by about 10%, breaking through the next resistance levels. The pronounced bullish trend dominated in the market and another impulse wave developed.

Chart 7. International Business Machines Corp. (IBM). Sigma index was 2.41, the stock ranked 1st in the Top 10 most active stocks
W.W. Grainger, Inc. (GWW) ranked 2nd and Sigma index was 1.92. The stock price was $207.81 on October 20. Chart 8 shows that a few days before the price was actively moving and increased by more than 8%. The market was in an active bullish trend and was good for finding pullback entry points on the Daily timeframe or intraday trading.
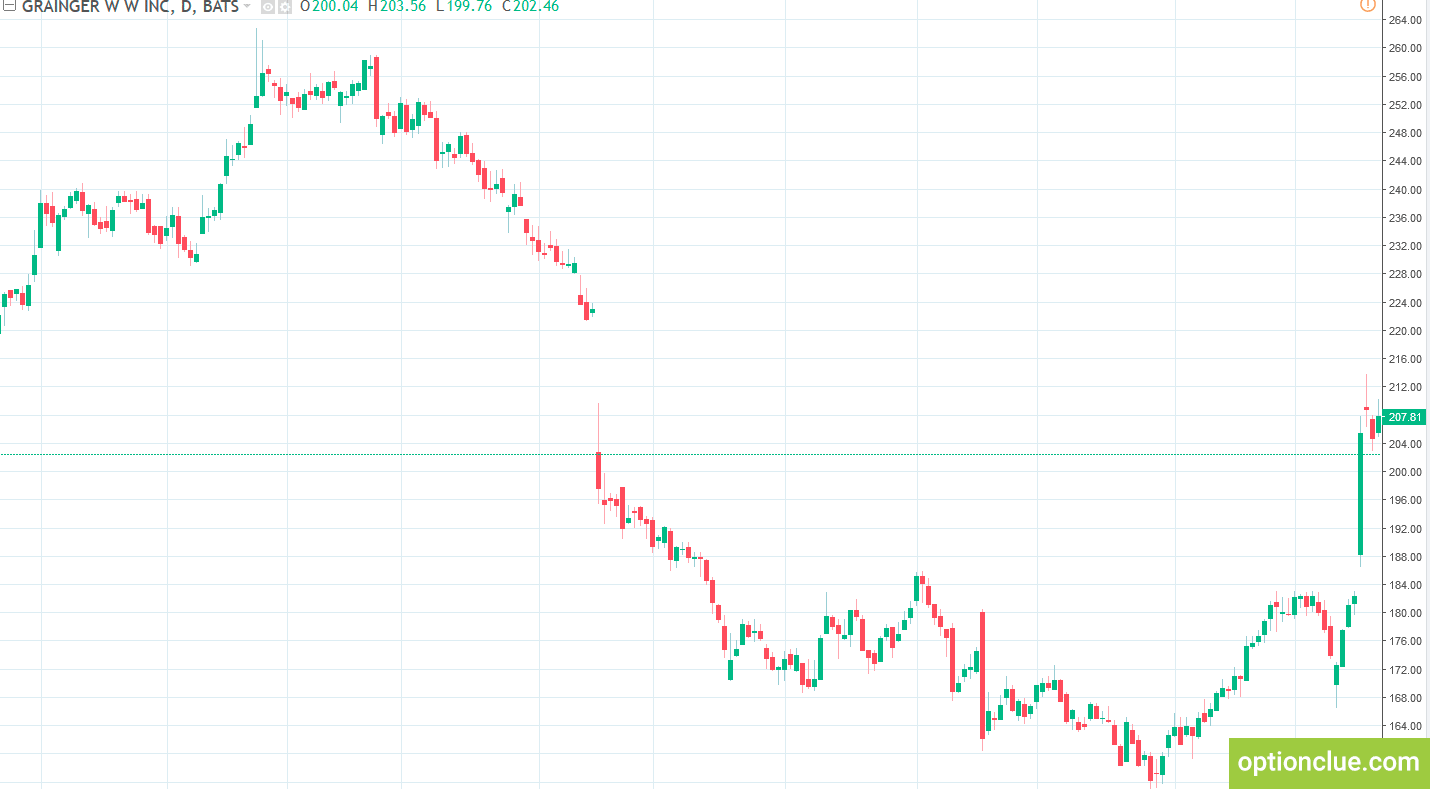
Chart 8. W.W. Grainger, Inc (GWW). Sigma index was 1.92, the stock ranked 2nd in the Top 10 most active stocks
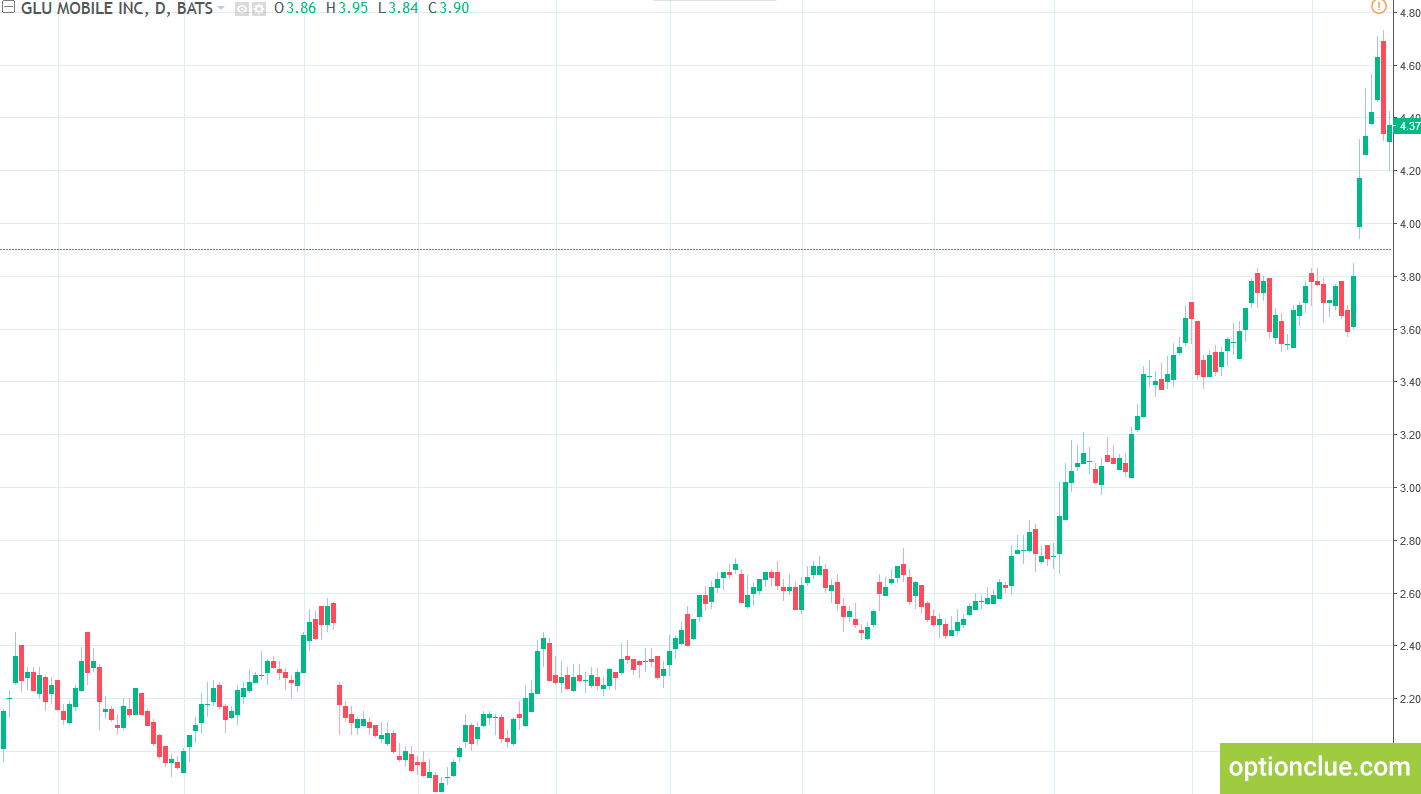
The next stock I’d like to mention is Glu Mobile (GLUU). Its Sigma index was 1.82 (Chart 9). You can see that the market broke through the resistance level last week. The market was in a bullish trend but in the strong correction at that time.
These examples show that the faster and stronger a trend develops, the higher Sigma value is. Traders, who prefer to trade the trend, can use the index, choosing stocks with the highest indicator values. That would enable to search for breakout and pullback entry points on the Daily timeframe, select the stocks that are in the most active trends for intraday trading, or find opportunities for directed trading in the options market (Theta and Alpha indexes complement Sigma index and simplify the process of finding best options to trade).
Conclusions on Sigma Share Screener
Sigma index is a simple and efficient tool for finding assets that are in flats and triangles or, on the contrary, in active trend movements.
Minimum index values in the option screener indicate that the converging formation is in the market now while maximum index values indicate sweeping market movements and another impulse wave development.
To determine the most interesting stocks you should analyze the top or bottom of the list. You can find the most attractive stocks from the 1st to the 10th position both in the upper and lower part of the table. Stocks from the middle of the list can become the future participants of the TOP, and you can hardly find something interesting among them now.
The index values below 0.8 indicate the existence of an extremely narrow flat (you shouldn’t miss such situations), and the opposite values (from 1.5 or more) indicate the trend existence.
The option analyzer lets you go through hundreds of assets in minutes and identify the most attractive options to purchase or sell from a huge stock list and thus it saves your time. You should just analyze the selected financial instruments and wait for the optimal price to enter the market.


