Implied and Historical Volatility when Buying and Selling Stock Options

Choosing of assets for trading can take a long time, especially when it comes to options trading. Keeping this in mind, we’ve created the options screener that saves your time and helps find new trading ideas based on a simple principle – buying cheap options or selling expensive ones.
In this article, we’ll discuss how to analyze volatility to improve options trading results. We’ll examine the difference between implied volatility (IV) and historical volatility (HV) and the factors that influence them and take some examples.
Contents
- Importance of implied and historical volatility in stock options trading
- What affects implied volatility
- Comparison of implied and historical volatility
- How does implied volatility impact the option pricing?
- Best option trading strategies for low and high IV
- Conclusions on the effect of implied volatility
Importance of Implied and Historical Volatility in Stock Options Trading
Volatility has significant effect on prices of options and represents stock price fluctuation:
- Higher volatility infers greater range of stock prices movements
- Lower volatility infers narrower stock price range
As historical stock volatility increases both calls and puts prices (premiums) generally increase. And at the same time as stock volatility decreases options prices often decrease and that’s because historical volatility is the measurement that talks about how much the underlying asset moved in the past.
The main difference between historical and implied volatility is that IV is the market expectation for future stock movement or future stock volatility. Only options have implied volatility.
Historical volatility indicates how much the underlying asset moved in the past, implied volatility indicates how much the market expects that underlying asset to move going forward maybe as much as it has in the past, maybe less and whatever you know the market expects that amount of movement will be implied in the option volatility (Figure 1).
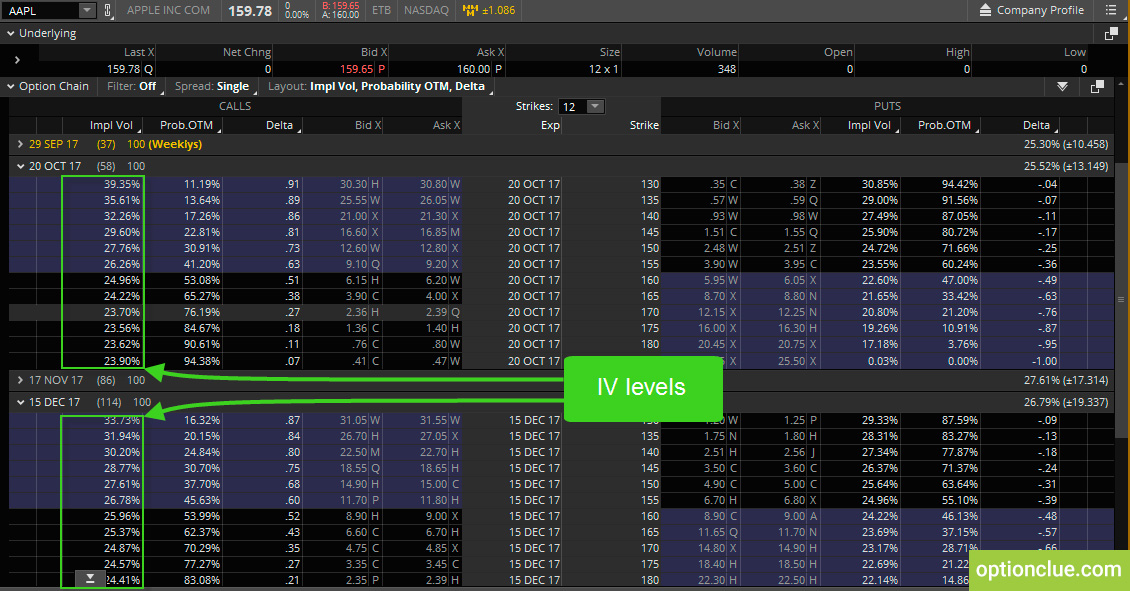
Figure 1. Apple option chain. Implied volatility levels for different options strikes (thinkorswim trading platform)
As you can see, different strikes and expiration cycles give us different implied volatility values. As you move out-of-the-money the option’s implied volatility skews tend to get a little bit less (130-call gives us IV of 39.35%, 185 call gives us IV of 23.90%).
When the IV starts going up, calls and puts are going up, the premiums are expanding. The opposite is true. When implied volatility decreases, your call and put prices will go down.
Depending on what month you are in implied volatilities can be dramatically different. From a common sense point of view earnings month especially for those companies who really tend to surprise with earnings announcements, those premiums will typically be far greater than surrounding months.
What Affects Implied Volatility
There are a lot of factors that can influence implied volatility. Most of them are associated with market dynamics. These factors are:
- Change in the underlying stock volatility
- Supply and demand:
- More option buyers than sellers force the price to go up (and vice versa)
- Change in the underlying stock price
- Uncertainty about underlying stock performance:
- Rumors
- Fundamental factors
- Earnings expectation in comparison with announced ones
- Changing IV in other option classes in the same industry sector
- General stock market psychology:
- Economic data (CPI, unemployment rate, industrial production, etc.)
- FED actions
- Commodity prices (gold, oil, etc.)
- World political events
Let’s discuss whether it’s good or bad thing when we see the changes in implied volatility. It’s going to depend whether you are long options or short options. When we’re looking at long options obviously you’re going to want implied volatility to go up because the premiums are going to go up and that’s the case with calls and puts. If you are short options, you’re looking for IV to come down.
From a common sense point of view the higher fluctuations and volatility the higher premiums that sellers want for the added risk of this stock moving all over the board and conversely then buyers have to turn around and pay more. And the opposite is true. With lower premiums, buyers are going to pay less because there is less fluctuation in the underlying asset and the sellers take less.
Comparison of Implied and Historical Volatility
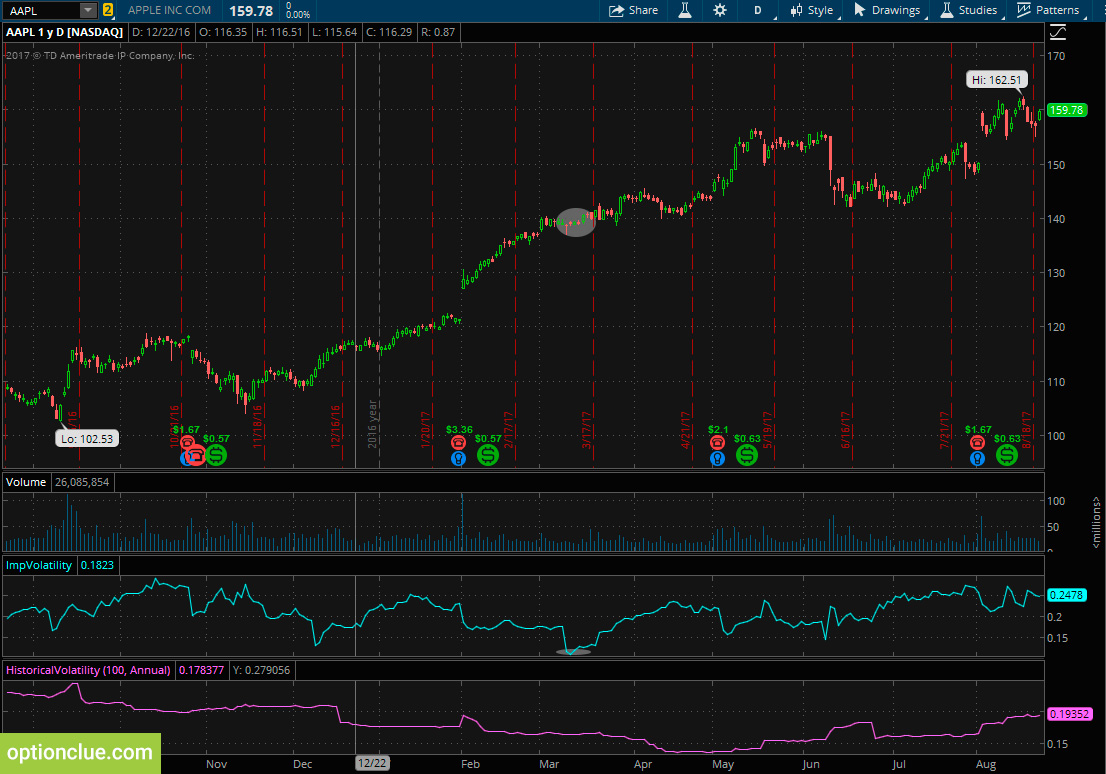
Let’s take a small comparison between IV and HV. When trading options and analyzing IV and HV levels you should not expect an option’s IV to return to its underlying stock’s historical volatility level since it’s not necessary for profiting the trades but it’s important to understand the IV potential in comparison with historical volatility when opening a position (Figure 2).
Besides this, IV directly affects the extrinsic value (time value) of your options. IV is often unpredictable, its change may occur intra-day or over time, may occur abruptly and significantly, it doesn’t require a change in stock prices and in stock’s historical volatility but it can explain option price movement you might not expect or understand. When trading options you should note the points where IV and HV levels have significant variance and apply this knowledge to evaluate the attractiveness of a particular option. That’s why the right implied volatility application can improve your financial results when diving into selling and purchasing stock options.
How Does Implied Volatility Impact the Option Pricing?
Let’s take several examples and look at the options premium changes according to IV shift.
Scenario 1. Suppose Apple stock is at $159.98 and you buy Oct 155 call for $9.20. The option contract has 58 days until expiration. Let’s say the next day the stock fluctuates about the same mark ($159). But Oct 155 call increases in price to $10.41 (Figure 3). Let’s figure out what’s happened.
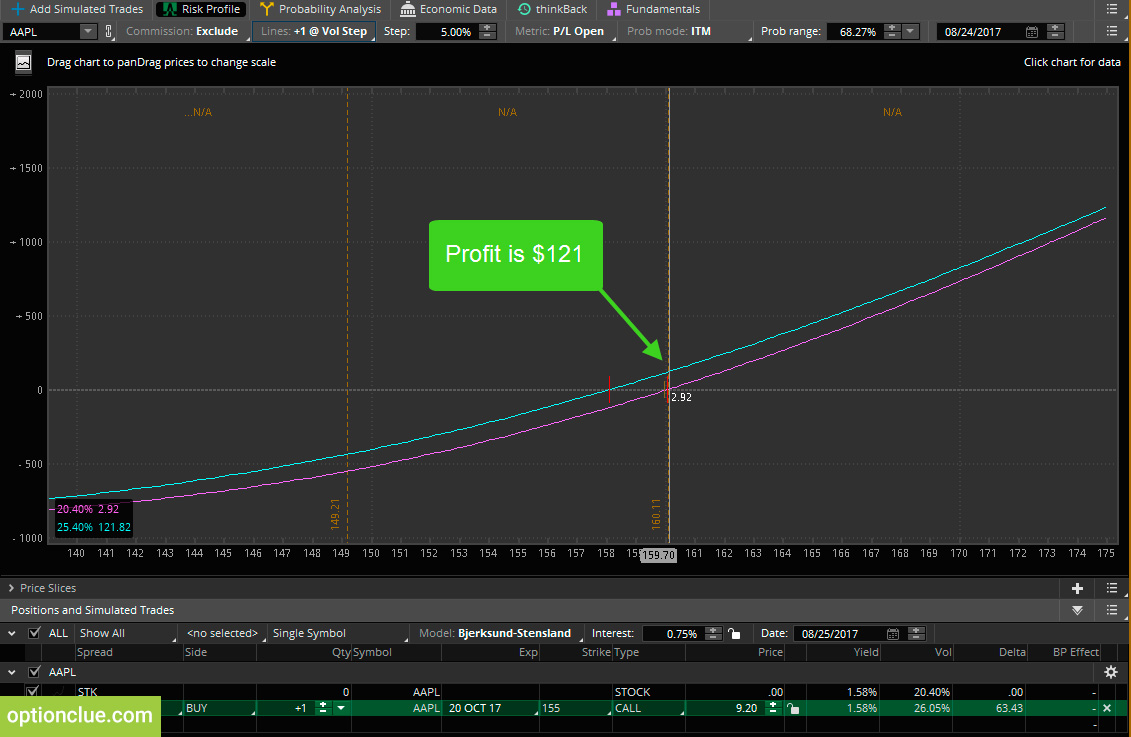
Figure 3. Scenario 1. Profit and loss diagram for different implied volatilities. Magenta line: IV = 20.40%. Cyan line: IV = 25.40% (thinkorswim trading platform)
Since the stock price remains the same, it means that IV level of Oct 155 call has increased the next day by 5%. So we have an unrealized profit ($121 per contract). In reverse, if you had written this call you might not be so happy.
Scenario 2. Suppose Apple stock is at $159.98 and you buy Oct 155 call for $9.20. The option contract has 58 days until expiration. Let’s say the next day the stock rises to $160.96. But Oct 155 call drops in price to $7.53 ($9.20-$1.67). Let’s figure out why this has happened (Figure 4).
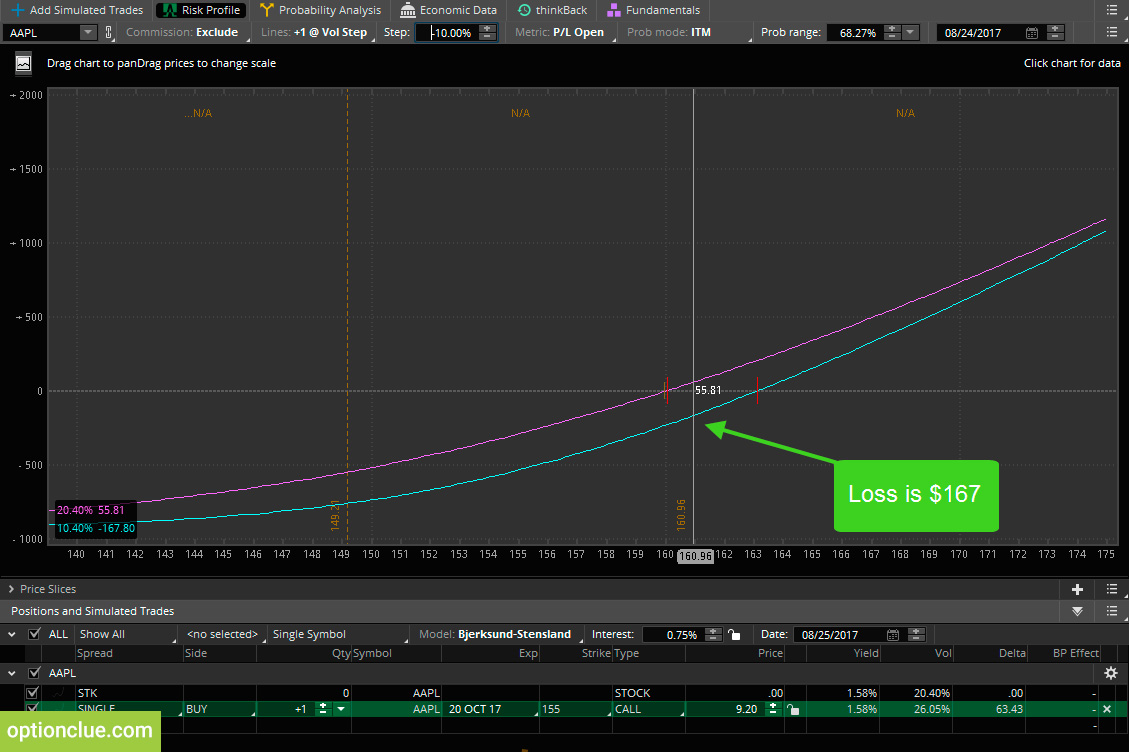
Figure 4. Scenario 2. Profit and loss diagram for different implied volatilities. Cyan line: IV = 10.40%. Magenta line: IV = 20.40% (thinkorswim trading platform)
With this favorable move in stock price, IV level of Oct 155 call has decreased the next day by 10%. And even despite 0.63 delta, in this case, we have an unrealized loss we didn’t expect. If you had written this call you might be much happier.
Scenario 3. Suppose Apple is at $159.98 and you buy stocks at the current price and write Oct 165 covered call for $3.90. The option contract has 58 days until expiration.
Let’s say the next day stock rises to $160.98 and the Oct 165 call drops in price to $3.1. This value has occurred due to 0.38 delta and implied volatility declining by 5% that forced our short call to fall down. All the events (stock up and short call down) are favorable for us so we have an unrealized profit on both legs (Figure 5).
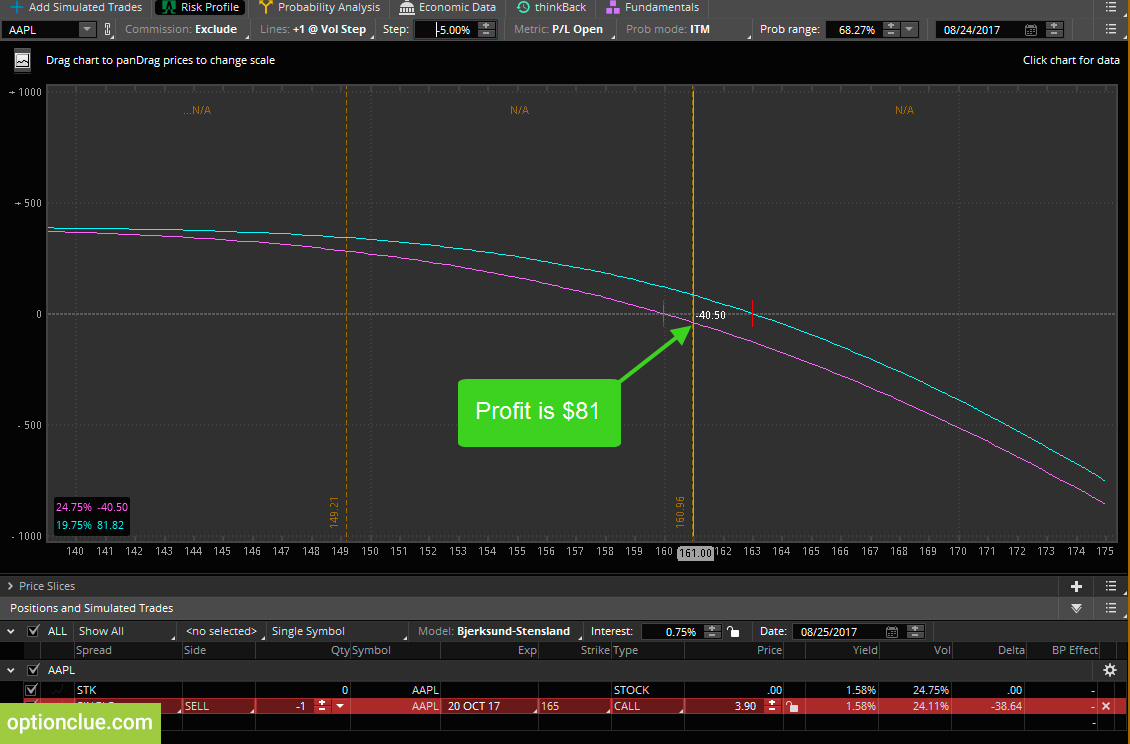
Figure 5. Scenario 3. Profit and loss diagram for different implied volatilities. Cyan line: IV = 19.75%. Magenta line: IV = 24.75% (thinkorswim trading platform)
Best Option Trading Strategy for Low and High IV
Let’s discuss what strategies are good or bad as they relate to IV. As you know, we have the intrinsic value if the option has any in-the-money value. At expiration, an option only has value if it is in-the-money whether it’s a call or a put.
You should be aware of changes in implied volatility in order to exit the market on time. For example, you can take an early profit before the stock has reached the target, or you can cut a loss early without the unfavorable stock movement.
So, long positions (long calls or puts) take advantage of higher implied volatility and they can suffer from the decrease in IV. Talking about short calls and puts we take advantage in case of a decrease in IV, note that uncovered options also cause extremely high levels of risk.
The effect of changing IV varies with complex strategies. The prime example to benefit from the increased IV is long straddles and strangles, (in my opinion it’s the best option trading strategy) and backspreads strategies, the latter involves buying more options than selling and that’s why profit from long options should outpace loss on short.
As you know, long strangle is the option strategy with limited risk based on volatility, which lies in the simultaneous buying calls and puts on one asset with higher/lower strikes respectively. Long straddle is the option strategy based on volatility, which lies in the simultaneous buying call and put options on one asset with the same strikes.
Increased IV volatility and consequently increased option prices in both cases can benefit greater since in this option strategies unlike uncovered options the risk is limited.
Typical strategies that want IV to go down are:
- Short straddles and strangles (can profit from implied and/or stock volatility decrease)
- Ratio spreads (call or put) – involves selling more stock options than buying where profit from short options can outpace loss on the long one
Conclusions on the Effect of Implied Volatility
Implied volatility is the important element of the successful options trading. To choose best options to buy right now you should understand ramifications of IV namely the Option Greek vega and the implication for underlying price variance. It’s important to be familiar with implied volatility behavior and examine the factors which can affect it. For choosing, for example, best call options to buy today when establishing a position it’s necessary to know the current IV level compared to past historical levels and calculate consequences of favorable and unfavorable changes in IV. You should also be aware of possible unexpected IV changes.

