Building an Option Portfolio Based on Options Alerts of the OptionClue Screener

Contents
- The principle of choosing stocks for options trading
- Return analysis of buying 3-month straddles. Option portfolio dated October 11
- Statistics on the return of options. Investment portfolio dated December 6
- Statistics on the return of investment portfolio dated December 13
- Changes in yields of options. Investment portfolio dated December 22
- Return analysis of straddles. Option portfolio dated December 29
- Summary
The Principle of Choosing Stocks for Options Trading
In this article we’ll analyze the statistics on the return of trading signals, generated by OptionClue options screener according to the option’s attractiveness general index Alpha.
Alpha index (or Fireball Screener index) takes into account conditional «high cost» or «cheapness» of options, as well as the market condition and the movement potential (flats, triangles and strong trends).
We’ll focus on minimum index values, represented in the straddle and strangle options screener table. Stocks with Alpha index value of 1.0 and lower can be interesting in terms of purchasing stock options, especially straddles and strangles. We focus on the purchase of straddles, since this option of using the screener is simpler for beginners, whereas the sale requires a more careful approach to trading and frequent monitoring market conditions and straddle prices.
Among these stocks, there may be interesting options for entering the market.
Let’s consider statistics on the return of the last screener signals for several option series (December and January options).
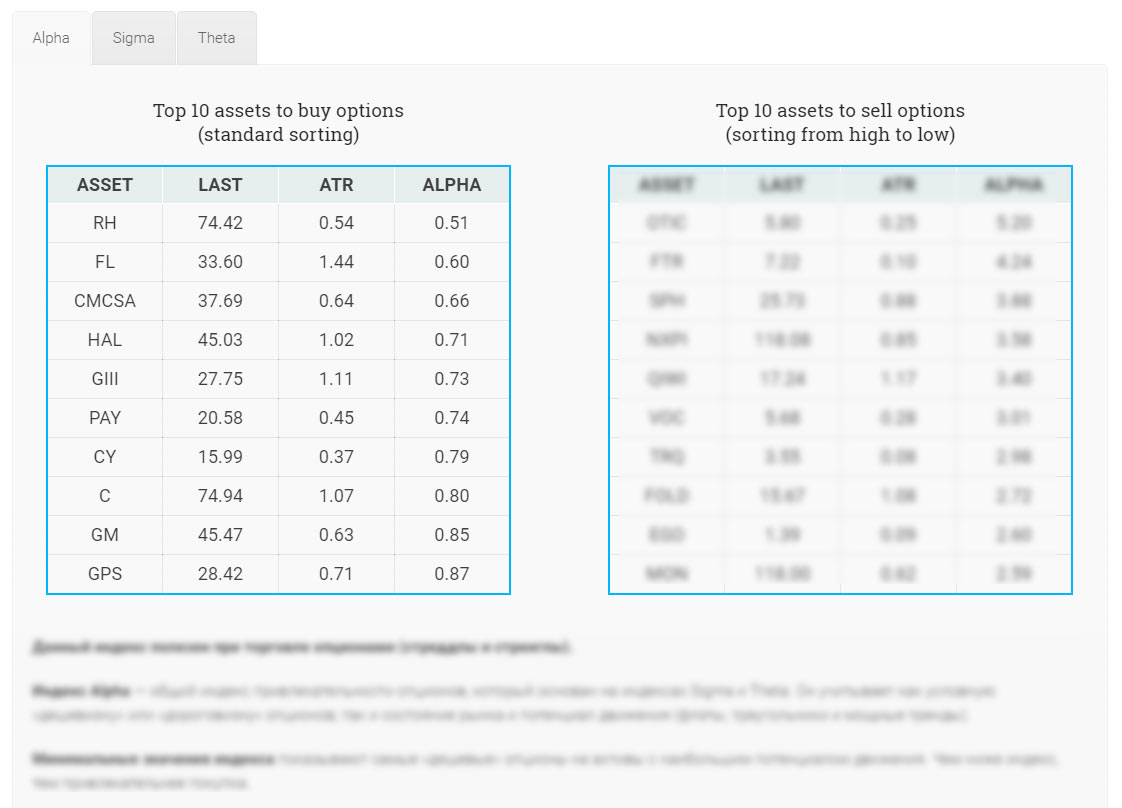
To apply the screener in options trading, you should follow 3 simple steps:
- on the site optionclue.com go to the section «Straddles and strangles OptionClue Screener»
- open Alpha index and analyze the table «TOP 10 assets to buy options»
- select stocks with minimum Alpha values, especially with Alpha of 1.0 and lower
You have just to choose the most appropriate option series for your purposes. To build a portfolio we focus on 3-month straddles.
Return Analysis of Buying 3-month Straddles. Option Portfolio Dated October 11
In our previous overview with the trading signals set on October 11, 2017 we built and examined the option portfolio based on signals of the straddles and strangles screener and analyzed its yield on January 2, 2018.
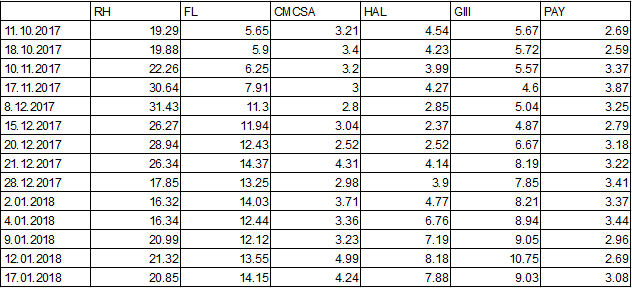
Let me remind you that straddle prices on October, 11 were:
- RH — $19.29
- FL — $5.65
- CMCSA — $3.21
- HAL — $4.54
- GIII — $5.67
- PAY — $2.69
The expiration date of 3-month underlying options is January 19, 2018. Therefore, we could fix profit on our portfolio, which was 37% on January 2, or wait another 2 weeks for a possible maximization of profit.
Let’s look at changes in straddle options prices until January 17:

Changes in straddle options prices from October 11, 2017 to January 17, 2018. Data from thinkorswim trading platform.
The change in straddle prices in percentage terms will provide better understanding the feasibility of the portfolio maintenance. Data for October 11 are taken as a starting point, and all further calculations are made regarding this date. We analyze the change in yield as for a single option combination, and for the portfolio as a whole («Overall return» column):

Changes in the yield of straddles and portfolio in percentage terms from October 11, 2017 to January 17, 2018.
Starting from January 2, the overall yield of portfolio continued to increase and peaked the rate of 62% since buying options on January 12. The portfolio yielded 56% on January 17 (a day before expiration). As we can see, every stock included in portfolio had a positive return at that time.
The diagram below shows the change in the yield of individual option positions and the portfolio as a whole from October 11, 2017 to January 17, 2018.

Diagram of changes in the yield of straddles and portfolio from October 11, 2017 to January 17, 2018.
In options trading when using all screener option alerts based on Alpha index simultaneously, we get the steadier and smoother yield curve (black line). As we can see from the diagram, the portfolio yielded 18% in about a month, the yield reached 46% in 2 months and 56% at expiration. That is, the average yield of portfolio is more than 20% per month.
This means that you can take profit or start hedging options positions (when important support and resistance levels are reached, and if a trend reverses) long before the 3-month options expiration date, and also use next screener trading signals when building a new investment portfolio.
Statistics on the Return of Options. Investment Portfolio Dated December 6
The date of the next trading signals set of the screener is December 6, 2017. In the future, to balance an option portfolio, we will include in it 5 stocks from the top.
The expiration dates of top options to buy, generated by the screener are following:
- NWL, GE, FEYE — March 16, 2018
- S – February 16, 2018
Straddle prices on December 6 were:
- NWL — $4.52
- GE — $2.03
- EGO — $0.4
- FEYE — $2.08
- S — $0.94
To make profit in the options market, the straddles prices in the future when selling stock options need to be higher than when buying them. And since the straddle price depends on volatility and the stock price, as well as on the time to expiration, I recommend you to look how the price changes with time. We’ll monitor the changes in straddle prices every week.

Changes in straddle options prices from December 6, 2017 to January 25, 2018. Data from thinkorswim trading platform.
For illustrative purposes, let’s look at the change in straddle prices in percentage terms represented in the table below. Data for December 6 are taken as a starting point, and all further calculations are made regarding this date. We analyze the change in yield as for a single option combination, and for the portfolio as a whole («Overall return» column):

Changes in the yield of straddles and portfolio in percentage terms from December 6, 2017 to January 25, 2018.
As we can see, in late December and early January the portfolio yield hardly changed or was negative. That was primarily due to changes in the stock market in the run-up to Christmas and New Year holidays, when there is no strong market activity, which negatively affects options prices. We see that by the end of January, the dynamics had changed and active movements started in the stock market. This had a positive impact on straddle prices and the yield of portfolio reached 16% on January 25 (for 7 weeks).
The diagram below shows the change in the yield of individual option positions and the portfolio as a whole from December 6, 2017 to January 25, 2018.

Diagram of changes in the yield of straddles and portfolio from December 6, 2017 to January 25, 2018.
The yield curve of portfolio (black line) clearly demonstrates periods of lull in the market, when the desired yield can be hardly reached. As we can see from the diagram, the portfolio yielded 16% since buying options in a little less than 2 months.
The use of 3-month options in trading gives us a chance and time to wait out a temporary negative development, and the initial relative cheapness of options, identified by the stock option screener, gives us the opportunity to benefit much after the market movement resumption and, accordingly, a sharp rise in the cost of options.
Statistics on the Return of Investment Portfolio Dated December 13
The date of the next trading signals set of the screener is December 13, 2017. The expiration dates of best stock options, generated by the screener are following:
- NWL, GE — March 16, 2018
- GGP, W, JCP – February 16, 2018
As you can see, some stocks are in the TOP assets to buy options again. However, you shouldn’t be surprised, since we deal with other options contracts with other features.
Straddle prices on December 13 were:
- NWL — $4.25
- GGP — $2.21
- GE — $1.81
- W — $12.15
- JCP — $0.79
Let’s look at the changes in straddle prices from December 13, 2017 to January 25, 2018:

Changes in straddle options prices from December 13, 2017 to January 25, 2018. Data from thinkorswim trading platform.
For illustrative purposes, let’s look at the change in straddle prices in percentage terms represented in the table below. Data for December 13 are taken as a starting point, and all further calculations are made regarding this date. We analyze the change in yield as for a single option combination, and for the portfolio as a whole («Overall return» column):

Changes in the yield of straddles and portfolio in percentage terms from December 13, 2017 to January 25, 2018.
As we can see, in late December and early January, the desired yield of portfolio also can’t be reached. The reasons are the same – the end of the year, closing previously opened positions and the lack of aggressive trends in the markets (here’s information about trend screener). The situation drastically changed after the New Year holidays. Starting from January 12, we can see an increase in the portfolio yield, which reached 16% on January 25 (6 weeks later).
The diagram below shows the change in the yield of individual option positions and the portfolio as a whole from December 13, 2017 to January 25, 2018.

Diagram of changes in the yield of straddles and portfolio from December 13, 2017 to January 25, 2018.
In options trading when using all screener option trade alerts based on Alpha index simultaneously, we get the steadier and smoother yield curve (black line). From the middle of January, we see encouraging changes in the yield of portfolio.
Changes in Yields of Options. Investment Portfolio Dated December 22
The date of the next trading signals set of the screener is December 22, 2017. The expiration dates of best options to buy, generated by the screener are following:
- NWL, GE — March 16, 2018
- HAIN, FL, MRVL – February 16, 2018
Straddle prices on December 22 were:
- GE — $1.68
- HAIN — $5.13
- NWL — $4.12
- FL — $5.26
- MRVL — $1.85
To make profit in the options market, the straddles prices when buying options need to increase with time. And since the straddle price depends on volatility and the stock price, as well as on the time to expiration, I recommend you to look how the price changes with time:

Changes in straddle options prices from December 22, 2017 to January 25, 2018. Data from thinkorswim trading platform.
Let’s look at the change in straddle prices in percentage terms represented in the table below. Data for December 22 are taken as a starting point, and all further calculations are made regarding this date. We analyze the change in yield as for a single option combination, and for the portfolio as a whole («Overall return» column):

Changes in the yield of straddles and portfolio in percentage terms from December 22, 2017 to January 25, 2018.
I’d like to note that this option portfolio was built a few days before Christmas, and therefore there is no surprise that its return was negative during the holidays. On January 2, all options were loss making. In mid-January, the portfolio yield began to increase rapidly, and it reached 14% on January 25.
The diagram below shows the change in the yield of individual option positions and the portfolio as a whole from December 22, 2017 to January 25, 2018.

Diagram of changes in the yield of straddles and portfolio from December 22, 2017 to January 25, 2018.
As we can see, the portfolio peaked the rate of 14% since buying options (about one month). Taking into account that there’s much time until expiration of options, we can expect the yield growth of certain options (that are currently unprofitable) and the overall return of portfolio.
Return Analysis of Straddles. Option Portfolio Dated December 29
The date of the next trading signals set of the screener is December 29, 2017. The expiration dates of options to purchase, generated by the screener are following:
- NWL, VZ — March 16, 2018
- HAIN, HPE, CVS – February 16, 2018
Straddle prices on December 29 were:
- NWL — $3.94
- HPE — $1.05
- NAIN — $4.75
- VZ — $3.57
- CVS — $5.21
To have the positive yield of an option portfolio, the straddle prices when buying options need to increase with time. To analyze this, I recommend you to look at the table below:

Changes in straddle options prices from December 29, 2017 to January 25, 2018. Data from thinkorswim trading platform.
For illustrative purposes, let’s look at the change in straddle prices in percentage terms represented in the table below. Data for December 29 are taken as a starting point, and all further calculations are made regarding this date. We analyze the change in yield as for a single option combination, and for the portfolio as a whole («Overall return» column):

Changes in the yield of straddles and portfolio in percentage terms from December 29, 2017 to January 25, 2018.
As we can see, during the first week prices slightly decreased, but 2 weeks later after purchasing stock options, the yield of portfolio was already 7%. Starting from the middle of January, one can observe the rapid yield growth reaching a value of 36% on January 25.
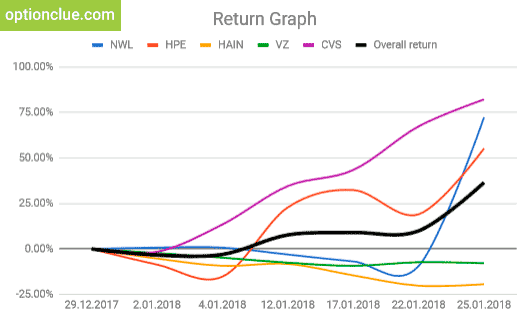
The diagram below shows the change in the yield of individual option positions and the portfolio as a whole from December 29, 2017 to January 25, 2018.

Diagram of changes in the yield of straddles and portfolio from December 29, 2017 to January 25, 2018.
Although 2 options are currently unprofitable, the yield curve of portfolio (black line) demonstrates the positive dynamics and smooths temporary losses of certain options. This option portfolio, that was built less than a month ago, already yields 36%, and it’s the maximum in comparison with all other portfolios.
With this yield in such a short time, you can take profit or start hedging option positions (when important support and resistance levels are reached, and if a trend reverses) long before the 3-month options expiration date, and also use next screener trading signals when building a new investment portfolio.
Summary
This article describes the option trading strategy based on the OptionClue option analyzer. We’ve considered the options for building an option portfolio according to options screener and also analyzed the yields of trading signals generated by this screener. For clarity we used several option series (December and January options) when buying 3-month straddles.
As you can see, we have excellent results from all investment portfolios created during December and January. I’d like to note we considered the purchase of options once a week as an example. The paid version of the screener generates relevant trading ideas 4 times a day, that lets you more carefully build an option portfolio with better signals (with a lower Alpha value) than in the examples above. Such option portfolios can benefit more.
The options screener software is designed for trading in the options market. It helps understand what stock options to buy today since it generates relevant signals every day to trade straddles and strangles and saves you time when searching for promising assets.
New trade ideas and good luck in trading!

