How to use CFTC reports in trading. False breakouts and COT indicator signals
COT net position indicator can be an excellent addition to any trading strategy. Comparing your actions with the opinion of large speculators you can make more informed decisions.
In this article we will discuss «false» breakouts and we will also analyze the efficient method of their determination using COT indicator. Studying these methods will help you understand how CFTC (COT) reports can improve your trading decisions.
Contents
- False breakouts and trading volume
- Why does the volume increase when the level is broken?
- CFTC. False breakouts filtering using COT net position indicator
- Conclusions on identifying false breakouts using signals of CFTC COT indicator
False breakouts and trading volume
When the market reverses and breaks through the next resistance or support level the following question arises. Is it the beginning of a new full-fledged trend or a «false» breakout – a movement without future that will not develop? It is especially important to get the most definite answer to this question in case of level breakouts on large timeframes, for example, on the Daily timeframe.
When entering the market at the very beginning of the trend you can get the best risk-reward ratio and any signals that can help determine the «truth» of a breakout are noteworthy.

Fig. 1. Tick volumes. MetaTrader 4
Often to determine false breakouts it is recommended to use vertical volumes, particularly the volume traded in the candle which broke through the key support and resistance level. At the same time, if you consider these volumes in the spot markets (the best example is Forex), you need to understand that most often they have nothing to do with the real information about the contracts traded in this candle. These are tick volumes – the number of trades inside the candle. Obviously, the position volume can be equal to one or one thousand contracts. For this reason, tick volumes are often not applicable in real trading.

Fig. 2. Real volumes. Euro FX Futures, D1. Tradingview
Real volumes are visible in futures markets and traders often use them to assess the probability that a level breakout is false. As a rule, this happens quite straightforward. For example, if the actual traded volume during the level breakout increases, there is the decision that this breakout is true (by the way, there is no consensus on this question. I came across diametrically opposite interpretations in which the growth in volume signals that the breakout is false).
Why does the volume increase when the level is broken?
Stop orders are consolidated around support and resistance lines. These are stop loss and buy stop (or sell stop) orders. The better the level is visible and the more often the timeframe (on which it is plotted) is used, the more stop orders will be placed around this level.
Traders often place stop-loss orders, enter or exit the market focusing on horizontal levels. For this reason, classic support/resistance levels breakouts on the Daily timeframe will be often accompanied by increase in trading volumes regardless of whether it is true or false. Stop loss orders will trigger anyway.
If the support level is broken through, the volume will grow due to the triggering of stop-loss orders of buyers and sell stop orders of traders who trade the level breakout (market execution order to sell will take place). Market orders are the fuel that will move the price down, even if the market is slightly pushed below the support level just to have these stop orders triggered. For the same reason, horizontal volumes grow around support and resistance levels. They reflect the massive triggering of stop orders in a narrow price range.

Fig. 3. EURUSD H4 (on the left) and the distribution history of traders’ orders from September the 5th and the 6th from Oanda Lab (on the right). Support and resistance levels are plotted by the Levels indicator
The more «obvious» the level is, the more traders will place stop orders around this level and the higher will be the volume inside the candle that breaks through this level. A high volume at the time of a breakout may indicate that there were a lot of stop orders around the level and they triggered. This is general information that is brief information on trades.
Horizontal and vertical volumes provide interesting information and perfectly complement the price, but for the reasons described above, further interpretation of the breakout both true or false one becomes extremely subjective and depends on the opinion of each trader. It is quite obvious that this topic deserves separate research.
CFTC. False breakouts filtering using COT net position indicator
A significant contribution to the true and false breakouts determination on the Daily timeframe can be made by the major players’ trades statistics. The first option of COT net position indicator use in trading practice is the signals filtering for increasing the probability of false breakouts detecting.
Unlike the volumes inside one candle, the indicator demonstrates the dynamic pattern of the net position of major players every week, as well as the general trend, the professionals’ opinion, which often does not change during several months in a row.
Large speculators trade a trend. If the market is in an uptrend, professional speculators usually buy more actively than they sell and COT indicator moves in the same direction. In this case, before the breakout each new minimum on the indicator chart will be higher than the previous one.

Fig. 4. Change in the net position of large speculators in a bullish trend
If the trend reverses, cot net position indicator also changes its direction. If the opinion of large speculators on an uptrend changes, a new minimum on the net-position indicator is formed below the previous one.
The situation when the breakout (the point of the medium-term trend change) exactly coincides with COT indicator reversal takes place infrequently. The indicator often reverses first and the market follows it in a week or two. Otherwise, the trend changes and after that the next Commodity Futures Trading Comission report demonstrates the change of the opinion of major players.
It is logical, as in comparison with private speculators, large players own more valuable information and often get out of the movement which no longer has an attractive risk-reward ratio until its real completion.
If it is sensible, professionals have the opportunity to wait for a while to make sure that the technical trend reversal is really noteworthy.

Fig. 5. The change of the trend is combined with COT net-position indicator reversal
The duration of holding positions by large players will vary in each market. The less often the trend direction changes on the Daily timeframe and the more justified this vector of the market movement is, the less the indicator will change its direction as large speculators really know how to hold the position.
Therefore, if the Daily trend and net-position indicator reverse, it increases the probability that the market will continue to move in the direction of the last breakout. Market reversals confirmed by COT indicator are more often true than false.
Moreover, this does not mean that the market can move only in the breakout direction. Linear movements are not typical for any market and are the exception rather than a standard norm
Suppose that after a long bullish trend the price breaks through the support level on the Daily timeframe. After a breakout (impulse wave) a large-scale correction may start when the price can strengthen during a week or even more. But if the given market movement does not contradict the characteristics of a bearish trend (which lies in the fact that each new minimum on the chart is lower than the previous one and each new maximum is lower or equal to the previous one), there is no reason to worry about.

Fig. 6. The change of the trend is not combined with COT net-position indicator reversal
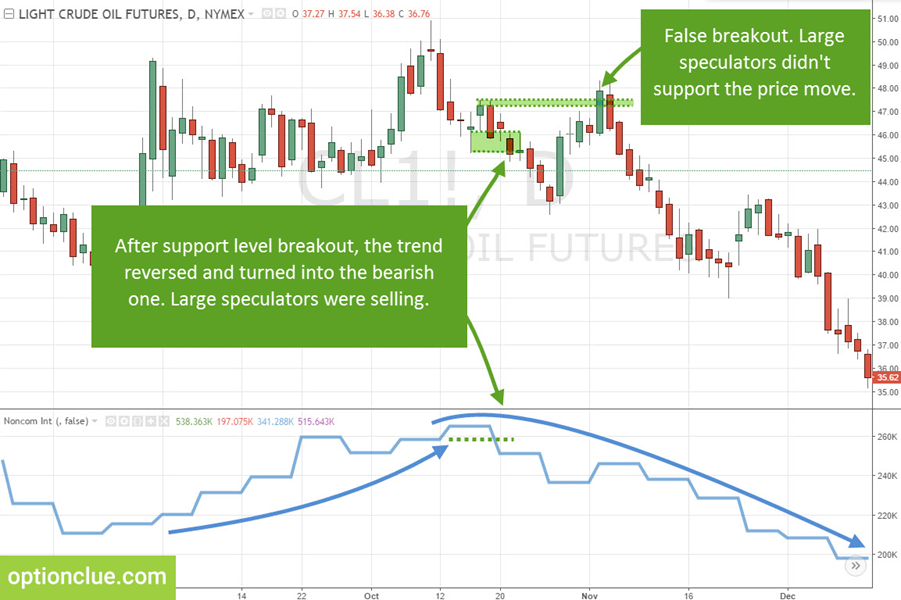
Sometimes a bullish trend reverses, a support level breakout takes place, but the movement doesn’t develop, the market rises and after a while the upward trend continues. False breakouts often occur in powerful trends and more often in such situations net position indicator will not reverse simultaneously with the market.
This gives an excellent opportunity to wait and open a pullback position, making sure that the decision is correct. After a while, net position indicator will reverse after the market or the breakout signal will turn out to be false.

Fig. 7. Large speculators do not support a false breakout (COT indicator did not reverse)
Nothing is perfect and as it has been mentioned before there are situations when the reversal of COT net position indicator is slightly delayed and takes place one to two weeks later after the breakout. The indicator is updated once a week and shows the most powerful market reversals. Just for this reason, it is good for determining the degree of reliability of a market entry in a new trend.
The expectation of the market situation clarification will be the right decision in each of these scenarios. In the first one, it will be possible to enter the market after the correction completion, when the reward-risk ratio is statistically higher in comparison with the breakout trading. In the second one, it will let not lose money.
Conclusions on identifying false breakouts using signals of CFTC COT indicator
The first option of the use of COT net position indicator is the determination of one or another level breakout «quality». If a trend reversal is supported by large players, it is more likely to be the beginning of a new medium-term trend than the movement which major players ignore. Most often professionals do not support «false» breakouts.
Being aware of this COT indicator property, you can change the trading activity depending on the large players’ actions, that is to trade the standard size if the trend reversal is supported by large speculators and hedgers. You can also reduce risk per trade by one and a half or two times if professionals are reluctant to increase their positions in this direction. The most conservative option is to take a wait-and-see approach till the new combination of the trend direction and the opinion of major players takes place.
In the next articles of the «How to use CFTC reports in trading» cycle, we will consider the other COT indicator signals and discuss in detail the options for their integration into the medium-term trading system.
Good luck in trading!