
A trade list is a powerful tool for simplifying the process of finding market entry points. It saves you time and lets you focus on those assets that most likely will be interesting next week.
Contents
What is a trade list?
In order not to go through dozens of charts again and again, you need to get ready for a trading week, choose the most promising assets and monitor them. A trade list complements a trading plan (it’s designed to determine a clear consistency when entering and exiting the market) and a trade diary (an effective tool to fix mistakes).
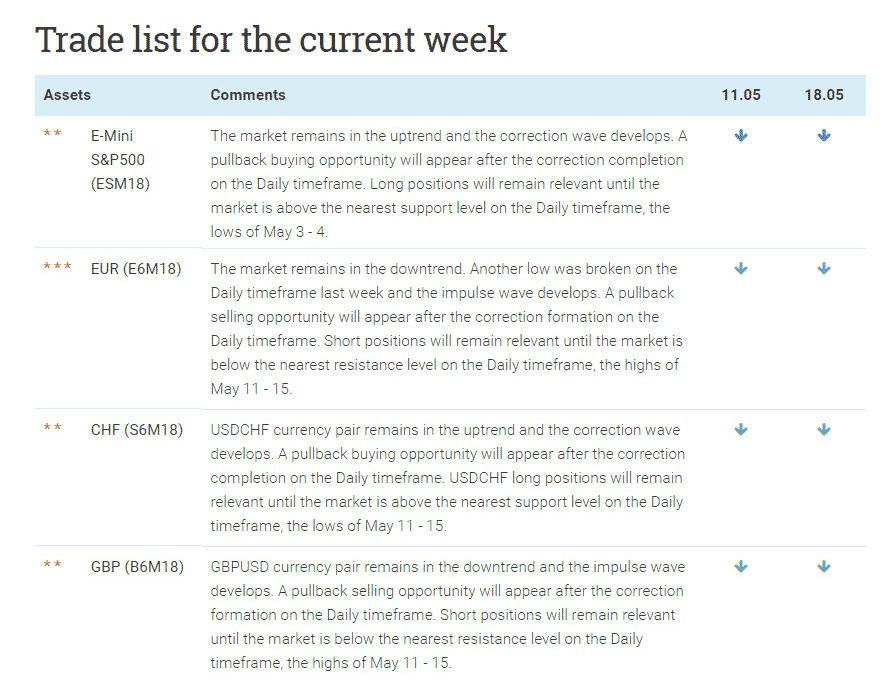
An example of the trade list
Relevant trade lists are regularly published in the section «Market Overviews». We make up them according to the medium-term technical analysis and CFTC reports that help determine the opinion of major market participants on current trends.
Related content
Key elements of a trade list
The notations that determine the quality of possible trades during the new week are profit potential, the risk-reward ratio, the opinion of major market players, other factors:
**** Excellent
We identify financial instruments that can be the most promising in terms of finding entry points this week. That may be the highest profit potential and low risks, a combination of several signals or other equally important reasons. The medium-term trend direction (Daily) in this case often corresponds to the large speculators’ opinion.
*** Good
We identify financial instruments that look interesting but not as much as «excellent» ones. The risk-reward ratio is not so significant; the opinion of large speculators contradicts the market technical picture, or for example, the market is in the correction on the Daily timeframe and the signal will appear only after the correction is completed.
** Ordinary
We identify financial instruments, where the medium-term trend (Daily) doesn’t correspond to the professionals’ opinion and / or risk-reward ratio is insufficient.
* Uninteresting (sideways trends, etc.)
The market is in a flat or triangle and hence it isn’t noteworthy, and it makes sense to wait for a breakout from the converging formation.
Comments column provides a short description of each financial instrument and just a little bit to the right you can see arrows that reflect large speculators’ actions in the current period and the previous one (during last 2 weeks). These two values explain whether the large speculators’ opinion on the market has changed.
If large speculators buy, and the trend on the Daily timeframe is bearish, then it reduces the likelihood that medium-term selling opportunities will be successful. On the other hand, if professionals buy in the rising market, a bullish trade can be even more attractive. COT reports can be an excellent addition to any medium-term trading strategy.
Additional materials
- How to add COT net position indicator to the chart
- How to use CFTC reports in trading. General concepts
- Support and Resistance Indicator for MetaTrader 4
- Pullback trading strategy from A to Z. Prime example