How to add COT net position indicator to the chart

COT reports allow you to determine the opinion of professional market participants about the trends dominating the most important timeframes. There are many ways to add net position indicator (COT) to the price movement chart. In this article, we will discuss the simplest and the most illustrative ones.
Contents
- Barchart and CFTC report
- How to add COT indicator to barchart.com?
- Tradingview
- How to add COT indicator to tradingview.com?
- Conclusions on COT reports display on the chart
Barchart and CFTC report
I found out about this source about four years ago, and having looked through a lot of sites, indicators and scripts, every time I came back to Barchart.
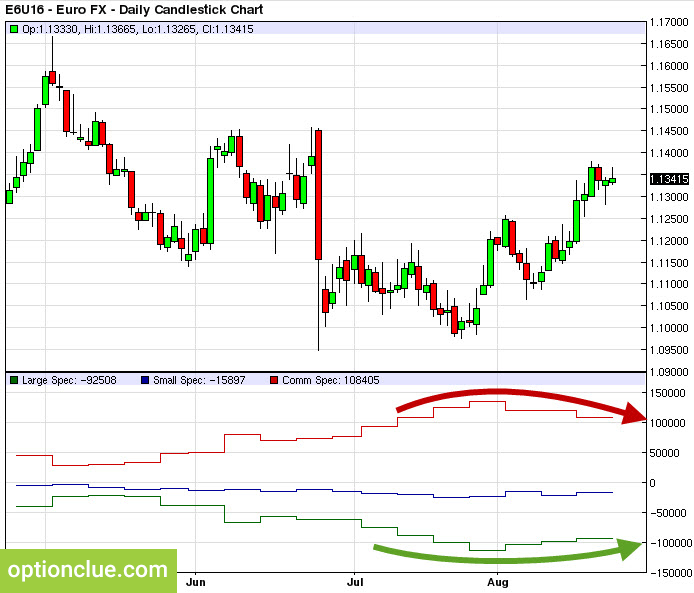
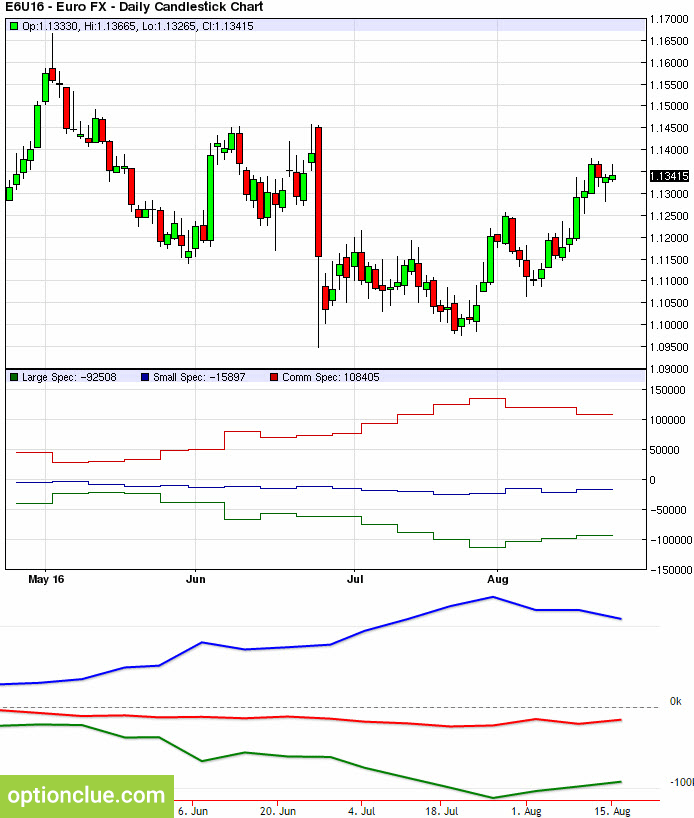
The COT indicator on barchart. Large speculators buy euro (highlighted with a green arrow), hedgers sell (red arrow).
The net position indicator is plotted at the bottom of the screen. At the same time, this site presents one of the most visible options of displaying statistics on major players’ transactions that enables to have cftc report explained. Please note that on the Daily timeframe the net position chart is stepped, but not a linear one. This format allows you to determine immediately whether a new high or a low on the indicator has been updated or not. To do this, you do not have to gaze into the screen or try to «stretch» the indicator window (by the way, it will not be possible to do this on barchart).
The illustration above shows a comparison of the stepped and linear option of the display of the net position indicator. The stepped chart has a better visibility, it is convenient and saves a lot of time if you have a lot of financial instruments in your trading list.
How to add COT indicator to barchart.com?
The link to the euro chart with added COT indicator looks like this:
https://www.barchart.com/futures/quotes/E6Z17/technical-chart?plot=CANDLE&volume=0&data=DO&density=O&pricesOn=0&asPctChange=0&logscale=0&indicators=COTLC&sym=E6Z17&grid=1&height=500&studyheight=200Suppose we are interested in British pound. To display COT indicator on the chart you have to:
- Choose a financial instrument in the selector:
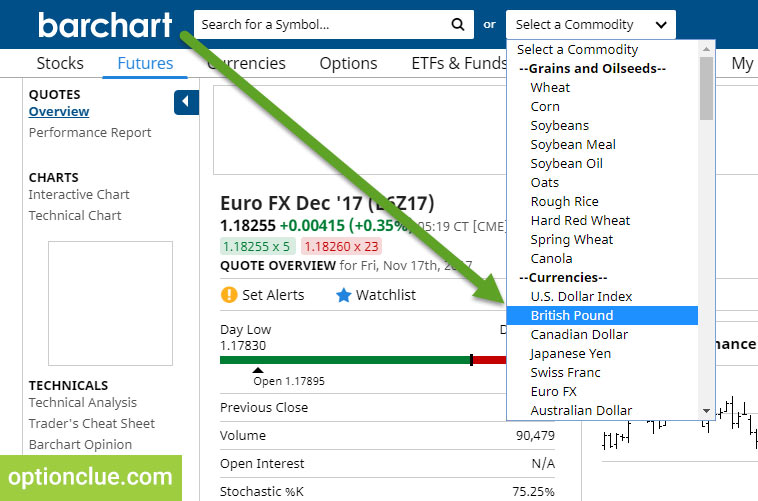
- On the opened page select the futures contract that is traded the most actively (the largest Volume), for example, B6Z17 (this is the British currency code, the December 2017 contract):
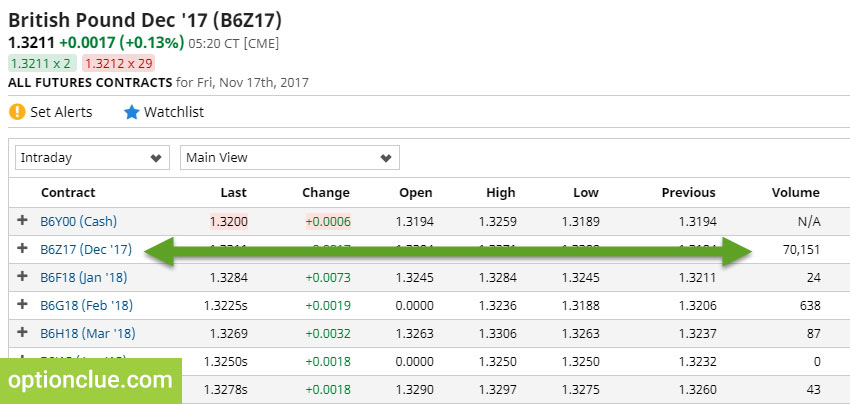
- In the huge link, which is presented above, change the instrument code to the actual one (E6Z17 to B6Z17). Only the code changes (for example, for Mini S&P500 it is ESU17, for gold it is GCU17, for ruble it is R6Z17, etc.):

- We get the final link, by clicking on which the price chart and COT indicator open:
https://www.barchart.com/futures/quotes/B6Z17/technical-chart?plot=CANDLE&volume=0&data=DO&density=O&pricesOn=0&asPctChange=0&logscale=0&indicators=COTLC&sym=E6Z17&grid=1&height=500&studyheight=200This is not the simplest, but the most efficient way to add COT indicator to the chart. The codes of contracts are easy to remember and after a while a new financial instrument will be opened in a few seconds.
An alternative option is to bookmark the given link and access barchart as required. In this case, it is necessary to remember that approximately once a month the code of the current contract will change and the link will have to be updated periodically.
barchart advantages:
- one of the most visual options of displaying CFTC statistics
- COT indicator is updated automatically
barchart disadvantages:
- you cannot «flip through» the chart back, for this you need to choose another trading period or contract
- an intricate way of adding the indicator to the chart
- there is no LONG and SHORT separation for each group of participants, only net position
Tradingview
Tradingview is the source I use every day.
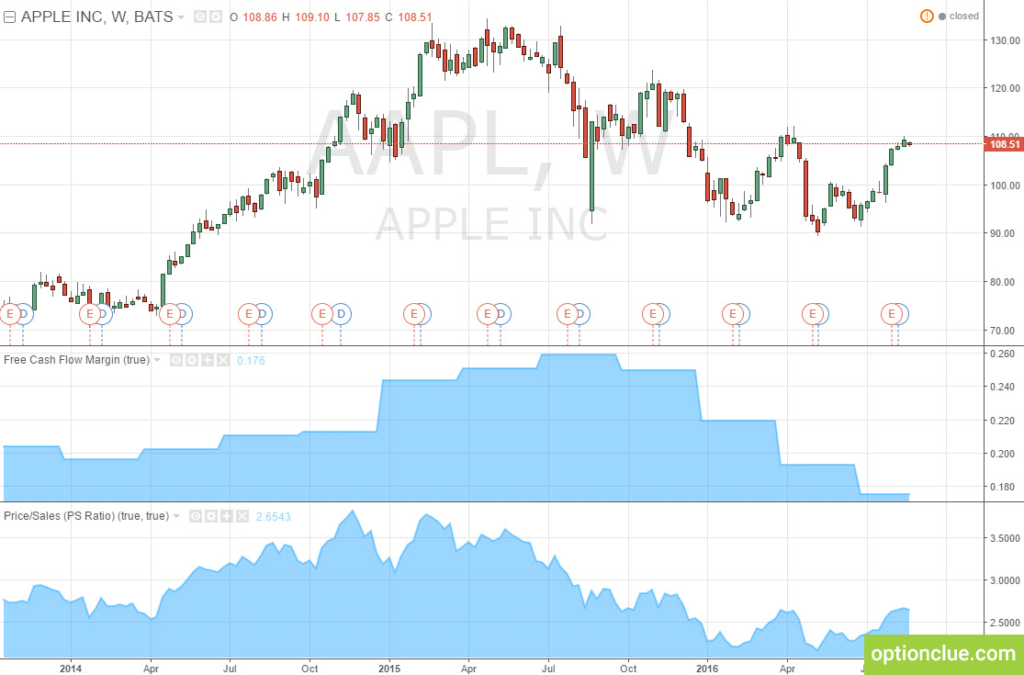
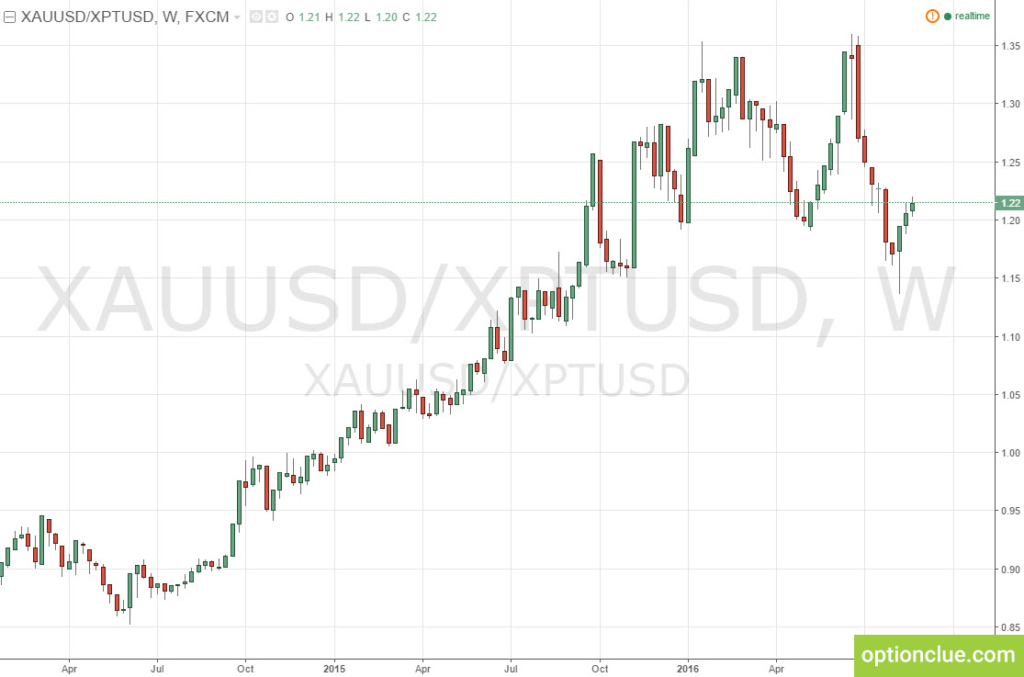
Reasons: convenient interface, plenty of financial instruments, the ability to create hybrid charts and add fundamental indicators to the chart (P/L, FCF, etc.). The latter is a great advantage in the stocks analysis.
I do not know any free solutions with such functionality and the options described above significantly complement and simplify the process of analyzing financial markets.
How to add COT indicator to tradingview.com?
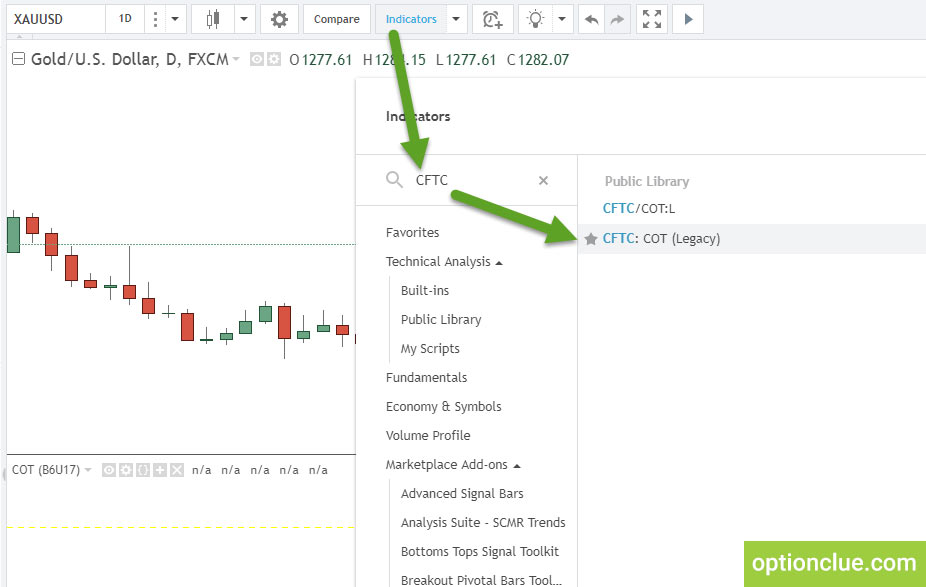
Among the indicators available in the platform there is also the net position of large speculators. The full name is CFTC: COT (Legacy). The indicator is displayed as steps on the daily timeframe while unlike barchart, the chart and the indicator window can be stretched, moved and transformed.
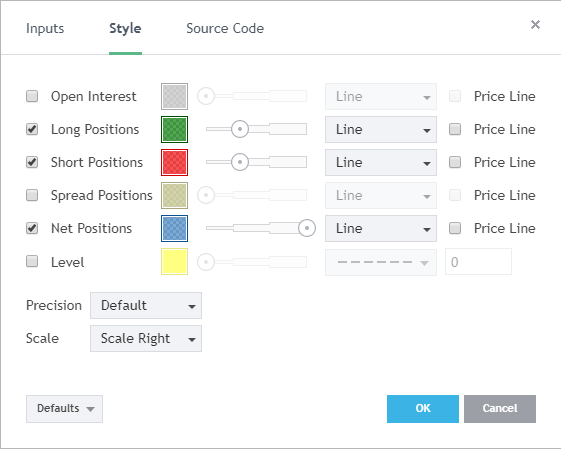
Initially, the indicator is displayed in an extremely difficult form for perception. There are settings below that I use: the net position of large speculators is highlighted in blue, the long position (positions to buy) is green and the short position (positions to sell) is red.
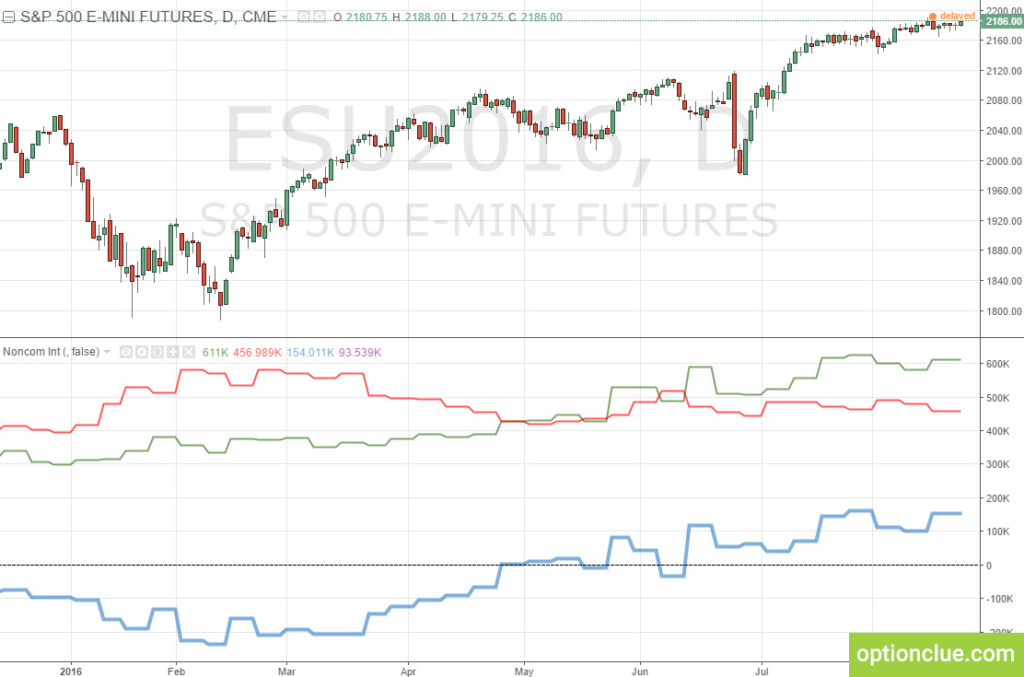
Statistics on long and short positions is an important difference from barchart. You can see not only the change in the net position, but also the reasons of this indicator movement. For example, the reduction of previously open short positions and/or long positions increase may cause the net position growth.
For example, the E-mini S&P500 futures chart is shown below. Let’s analyze the right side of the illustration: the net position indicator of large speculators is rising (blue line) due to the increase in number of bull positions (green line) and reduction of bear ones (red line).
Tradingview advantages:
- net position separation into LONG and SHORT
- COT indicator is updated automatically
- there is a lot of useful settings, charts, indicators
- you can «flip through» the chart back
- COT indicator is added to the chart by a few clicks
Tradingview disadvantages:
- not detected
Conclusions on COT reports display on the chart
Today Tradingview is the most convenient and visual option for displaying statistics of large players’ actions. The line is stepped, and at the same time, unlike barchart, you can observe both the net position and its components – long and short positions. The tradingview functionality makes COT indicator even more powerful market analysis tool.
Even without taking into account other particularities of the platform, it is the absolute winner of today’s micro rating.
Barchart is less convenient, but it is also visual. It’s a classic, old school. Financial market weekly overview use charts built using barchart.
P.S. I have not considered platforms or indicators where you need to update CFTC statistics every week or COT indicator is built as a line, rather than steps. The first way is inefficient. The second one is inconvenient.
Good luck in trading!

