How to use CFTC reports in trading. The logic of large speculators

This material is the second in the series of articles «How to use CFTC reports in trading». General information about CFTC and reports published by this organization was discussed last time. Now we will talk about large speculators.
Contents
- What is COT net position?
- CFTC. The logic of large speculators
- Professionals’ actions in the run-up to the market reversal
- Profit taking by large speculators
- Conclusions on large speculators’ actions
What is COT net position?
One of the key definitions in the process of analyzing the COT report is net position. Net position is the difference between open long and short positions for each group of market participants. If traders bought 150 contracts and sold short 20, net position will be equal to 130 contracts. If 100 short and 50 long contracts are open, net position will be minus 50.
If net position grows, then the number of buy positions increases faster than the number of short positions. This happens when new bullish positions are actively open and/or bear ones are closed. Detailed information about long and short positions of large traders is published in CFTC reports, and net position indicator reflects it as clearly as possible.
To apply CFTC reports in trading strategy not the last net position value is important, but its dynamic pattern.
CFTC. The logic of large speculators
Very often, when people say «trader» they mean «speculator». The speculator’s goal is simple – making profit from price fluctuations in financial markets. In this sense, both private speculators and hedge funds are traders.
Speculators buy goods expecting price increase and sell in the run-up to a possible decline. They trade the market trend, move together with the market and can make profit both in the bull and bear market. Basically, these traders do not care about the direction the price will move. The main thing is to have an active and predictable price movement.
Large speculators, Non-commercial group in CFTC report are investment funds, speculative bank divisions and other participants that are commonly called professional traders. They operate according to the logic understandable by every private trader: they buy when they think that the market can grow further and sell if they believe that prices will decline.
Suppose that net position of large speculators has grown from 125 to 150 thousand contracts over the past week. If large players believe that the market can continue to strengthen, they buy more actively than they sell and net position is growing (Figure 2). In this case, each new minimum that will be formed on net position indicator will be higher or equal to the previous one. This responds to the definition of an uptrend – if each minimum on the price movement chart is higher or equal to the previous one, the market is in a bullish trend.
Unlike private traders, large speculators do not change their trading strategy after several unprofitable trades and are little affected by emotions. Apart from this, large players do not try to guess each market movement direction, but they tend to hold the position until there is a trend in the market. As a result, they can continue to buy during the market correction on the Daily timeframe, although it can last during one or two weeks. Logic does not change – buy cheap and sell high.
Professionals’ actions in the run-up to the market reversal
If large players suppose that the bullish trend may change, they close previously open long positions and often increase short positions. As a result net position reduces. At such moments net position indicator reverses. A new minimum on the indicator chart will be lower than the previous one. If the trend becomes bearish and large speculators support this movement, each new maximum of net position indicator will be lower than the previous one.
For example, the net position was 175 thousand contracts, then it was 200 thousand, and in the last report, it was 160 thousand (Figure 4). The new minimum on the net position indicator chart will be lower than the previous one. Often this suggests that large participants no longer support this market movement since they believe that the market can move into a sideways trend condition or even reverse.
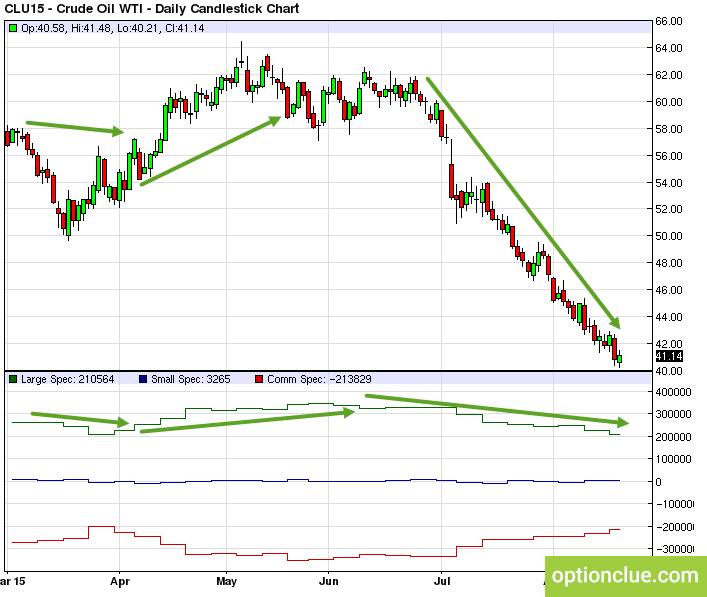
Often a market reversal occurs immediately after this (within one to two weeks) or coincides with the CFTC statistics publication. If net position indicator reverses first and then the key trend does, then large traders show through their actions that they no longer believe in the movement continuation and the trend begins to slow down and changes to the opposite one (for example, the beginning of June in Figure 6).
Sometimes net position indicator confirms the market reversal but does not anticipate it. In this case, the market reverses, after that major players change their attitude to the key trend (for example, the beginning of April in Figure 6).
However, if net position indicator reverses, the market does not always follow it right here, right now. Sometimes this indicates that market participants are gradually liquidating previously open positions, the number of new buyers becomes less. Buyers who pushed the price higher and higher gradually leave the market. As a consequence, the movement may continue for a while, but if the balance between buyers and sellers shifts, the probability of a trend reversal or a flat formation increases many times over.
Profit taking by large speculators
There are situations when large speculators fix a part of profit on the previously open positions. This often occurs around key support and resistance levels (weekly or monthly timeframes) or after a rapid market movement when it is logical to close at least part of the positions due to the possible formation of no less strong correction.
For example, the net position was 160 thousand contracts, then it was 140 thousand contracts and in the new reporting period it was 155 thousand (Figure 7). It will look like the next maximum formation on the net position indicator chart. It’s the «step» which is nevertheless below the previous high.
This is often associated with fixing the profit – large traders opened sell positions and after a strong market movement in the trend direction preferred to fix the profit on some previously open positions.
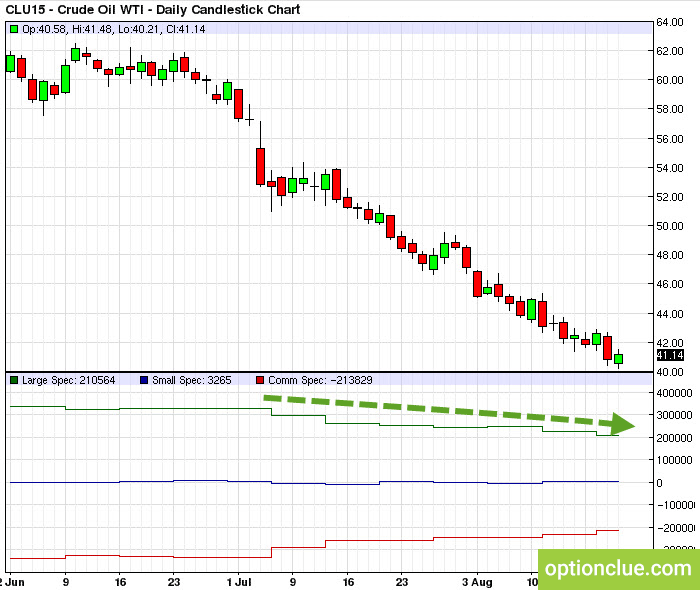
Such change in the net position is not the indicator reversal. Most often, after such events, the indicator continues to move in the same direction since after the formation of new signals in the trend direction large traders prefer again to open sell positions and, as a result, the net position continues to decline (Figure 8).
Conclusions on large speculators’ actions
Large speculators are professional market participants who expose investors’ funds to the negative influence of their own emotions much less often than private traders do. They consider trading as a business and trade a trend – they buy if they believe that the market can rise and sell during the bear market.
If large speculators buy more actively than they sell, net position is rising. Each new minimum on the indicator chart will be higher than the previous one. The indicator reverses since large participants start selling actively and/or closing previously open buy positions.
If the trend then begins to move in the direction of large speculators’ actions, they can continue to increase positions in this direction. In this case, each new maximum formed on the net position indicator chart will be lower than the previous one.


