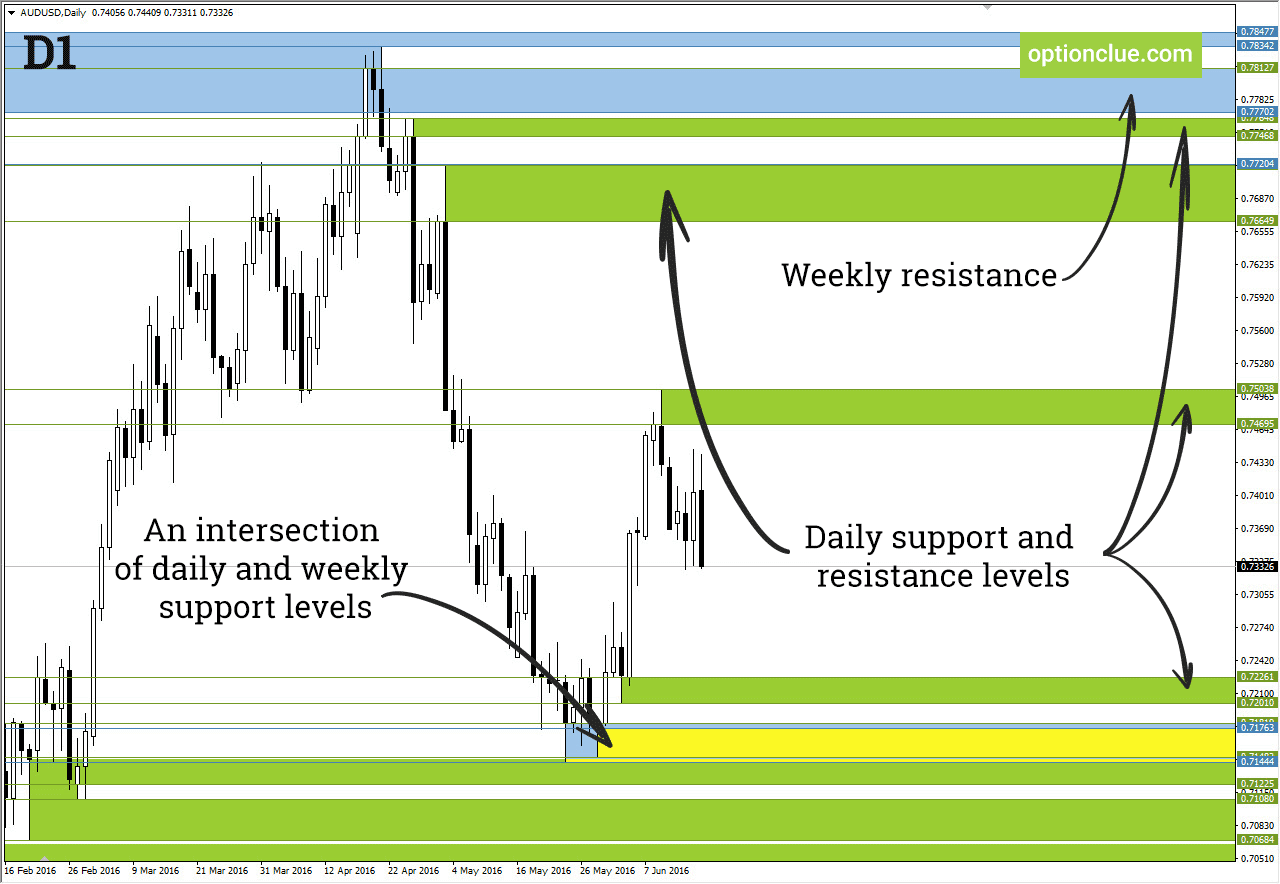
Horizontal support and resistance levels are the simple and universal method for market analysis. It lets you form a simple and effective trading strategy on any timeframe. It has been said that all ingenious is simple. The levels alone are enough to open a trade and determine market exit points.
It’s easy to know how to trade levels and understand how to plot horizontal support and resistance levels. To do this you should just watch a free video course focused on horizontal levels. In the course, you will find instructions on how to properly draw levels in the trading platform. And, of course, you should practice much. Observe, explore the market conduct at the intersection of the chart and these levels, especially with those that have existed for several months or more. As a result you’ll directly figure out what role this market analysis tool can play in your trading system.
If drawing support and resistance levels is easy for you, but being a part of a daily routine, you can easily automate this process. To do this, please setup Levels indicator in the platform. You can get a demo version on our website.
Levels indicator automatically plots levels on any timeframes, which saves your time and is especially useful for trading on small timeframes, when the price rapidly changes and the next levels are often quickly broken. To know how to draw support and resistance levels using an indicator, read the indicator overview.


