Support and resistance levels are known as a universal instrument of market analysis. In this article we’ll discuss our indicator which is called Levels, that automatically plots the most important levels on crucial timeframes.
The purpose of OptionClue Levels indicator
The main purpose of the indicator is to simplify the process of plotting horizontal support and resistance levels and zones, it will be useful in the following cases:
- You’ve already started studying technical analysis and horizontal support and resistance levels, but the principle of their plotting is not familiar yet, and you can’t plot all the levels you need as simply as desired.
- You know enough about support and resistance levels but the process of manual plotting takes a lot of time.
- You do a lot of intraday trades on timeframes below Daily, whereupon you are forced to replot support and resistance levels all the time. And the lower the timeframe the more often you should actualize the nearest price levels.
The support and resistance levels indicator has been created to solve the problems stated above.
How does support and resistance levels indicator work?
Levels indicator has been created for Metatrader 4. It is a multi-timeframe indicator that plots the most important horizontal support and resistance levels. It can be either levels of a single or multiple timeframes. One can choose exact timeframes in the indicator’s settings (from M5 to MN).

Daily support and resistance levels and zones have been plotted on Daily (left chart)
and Hourly (right chart) timeframes.
Support and resistance levels are not one point thick lines, so one can see that Levels indicator plots price zones where the market move can slow down or price reversals are likely to occur.

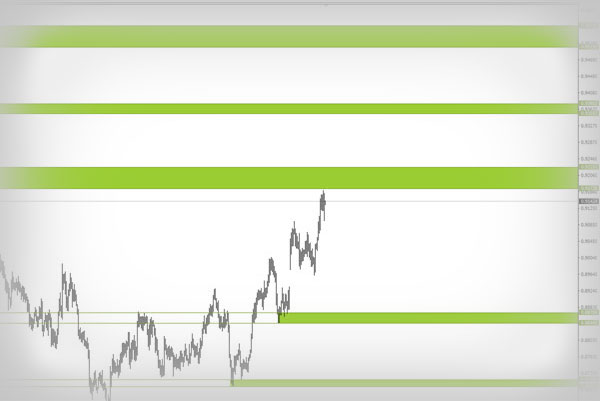
Weekly supports and resistances have been plotted as horizontal levels and rectangular price zones.
This indicator plots support and resistance levels on the selected and lower timeframes. For example, Daily levels are shown on D1, H4, H1, M30, M15 and M5, but they are not visible on Weekly and Monthly timeframes.
It’s a very handy feature, that lets you keep charts as clear as possible while switching between different timeframes.
Moreover it helps save time which you would spend in case you decide to plot and set each price zone by hand.

Weekly and Daily supports and resistances have been plotted on D1 chart.
Short-term trading can also take much energy and time because a situation at lesser timeframes tends to change very quickly. So one should act urgently and exactly. For example, it takes 10 – 25 minutes to form a new support or resistance in order to seek for entry points on M5 timeframe.
Support and resistance levels indicator can simplify this task significantly and it can also provide you with the opportunity to focus on market analysis instead of constant replotting of major price levels.

Daily (green), Hourly (red), M15 (blue) and M5 (gray) support and resistance levels have been plotted on the chart. One can see only Daily levels on the Daily timeframe (left chart) and the whole set of levels on the M5 timeframe.
How can the support and resistance levels indicator be used?
Horizontal support and resistance levels have been used in trading since the beginning of the 20th century. They are universal and can be used without fitting to historical data. Levels indicator plots a set of support and resistance levels that help identify the direction of the trend, calculate stop-loss and take-profit and find entry signals that appear during a deep market correction.
It lets easily take into account price movements on all required timeframes.
According to one of the characteristics of support and resistance levels, if price comes closely to an important price level, the market move may slow down and correction or even trend reversal may occur. It’s extremely important when one analyses price levels of a larger timeframe.
For example, if one looks for entry points on H1 timeframe, it would be wise to take into account at least Daily (D1) and Hourly (H1) levels. If the price comes closely to Daily level, the trend on H1 timeframe may slow down or even reverse. Obviously, one should know how to plot such price levels before starting live trading.

The downward market move on H1 timeframe suspends, when price comes closely to the major support level (Daily).
If price moves into a support or resistance zone of the major timeframe, the price may pull back, the trend may reverse or transform into range (flat). This occurs as a result of profit taking and active counter-trend trading which are common near significant support and resistance levels. In this case, the balance between buyers and sellers shifts and the market tendency slows down or reverses.
Therefore, support and resistance levels on large timeframes may be considered as primary targets, whereas levels of current timeframe may be used to calculate reliable stop-loss exit point.
The properties of support and resistance levels are applicable to any timeframe. And the less the timeframe the more levels one should take into consideration and replot. As the result, the process of market analysis on less timeframes is more complex and labour-intensive.
For example, in the case of mid-term trading on Daily timeframe, one should consider levels on Daily, Weekly and Monthly timeframes. In contrast, if one searches for entry points on M5, the minimal set of levels to analyse consists of M5, H1 and Daily. There are more levels and they should be updated more often.
Levels indicator’s plotting principles
Levels indicator plots support and resistance levels are based on price patterns appearance of which suggests that there is a local price reversal on the chart. Such points are considered as base of horizontal levels.
At first it’s simple, but Fractals, ZigZag or other classic pivot points indicators, in our opinion, are unsuitable for plotting the most important horizontal levels. Every important horizontal level is superposed with Bill William’s fractal, but not every fractal may be considered as an important support or resistance.
Therefore, Levels indicator includes 28 price patterns that complement each other. If a pattern allows to plot support and resistance levels with not more than 1-2% error rate on different timeframes and assets, we include it to the indicator. Such levels are plotted successively one by one.
We continue to seek and test new price patterns that fit criteria described above. At the same time we adjust the existing price patterns to be more accurate in conformity with principles of support and resistance levels determination.
Conclusions on review
Horizontal support and resistance levels are one of the few universal instruments of market analysis, which can be used on any liquid market and timeframe. They are based on price itself and don’t require fitting to historical data or parameters optimising.
Levels indicator plots the major supports and resistances and helps save a lot of time. It’s not the one and only ideal way of building horizontal levels and it doesn’t provide 100% percent accuracy in this process, but it may provide a great help in the analysis of financial markets.
Please, do not hesitate to contact us if you need further information or if you have proposals for the improvement of the indicator.