How to Find Options to Trade. Selling and Purchasing Stock Options. Theta option scanner software.

Choosing of assets for trading can take a long time, especially when it comes to options trading. Keeping this in mind, we’ve created the options screener that saves your time and helps find new trading ideas based on a simple principle – buying cheap options or selling expensive ones.
By trading in the financial markets, everyone concludes someday that it’s necessary to automate the process of market analysis, determine the relative high cost or cheapness of assets, as well as assess the market movement potential. To introduce this idea, we have created several indexes that help get ready for trading efficiently and quickly. In fulfilling routine mechanical calculations, they will save tons of time. Unlike humans, indexes are not susceptible to mechanical errors and omissions in the process of options analysis, therefore they are a simple and reliable tool to get ready for trading.
One of such indexes is Theta, which is included in the full version of the OptionClue options screener.
In this article we will analyze the principles of using Theta index in the medium-term trading and consider how to apply all the indexes (Theta, Sigma and Alpha) with the maximum benefit when trading options and option combinations.
Contents
- How to use screener (Theta index) in the medium-term trading
- The search for «cheap» real options by the example of Rockwell Collins
- The search for «expensive» stock options by the example of Calpine Corporation
- Simultaneous application of Theta, Sigma and Alpha indexes by the example of AVEO Pharmaceuticals
- Conclusions on option screener
How to Use Screener in the Medium-Term Trading. Options Analysis by Theta Index
Theta index (or Cheapness Screener index) is displayed in the stock option screener option screener, which also shows stock tickers, the last asset price at the time of the index calculation and ATR (average intraday asset volatility).
How to use the options screener software? Theta index allows you to divide options into «cheap» and «expensive» taking into account the option price and recent market volatility. Low index values suggest that options have a lower price relative to statistical market movements in recent times (in comparison with other assets). In this case, it’s often interesting to buy underlying options.
Maximum index values correspond to assets, whose underlying options have the highest price relative to market movements in recent times. The higher the index, the more attractive the sale of straddles and strangles is.
At the same time it’s fair to ask how many stocks from the list are noteworthy and what index values can be considered high or vice versa low. According to our observations, the first 10 stocks in the top and bottom of the screener are the most interesting.
Let’s take some examples of using the index (we were analyzing the index values during 15 days to form a sample of shares for this article).
The Search for «Cheap» Real Options by the Example of Rockwell Collins
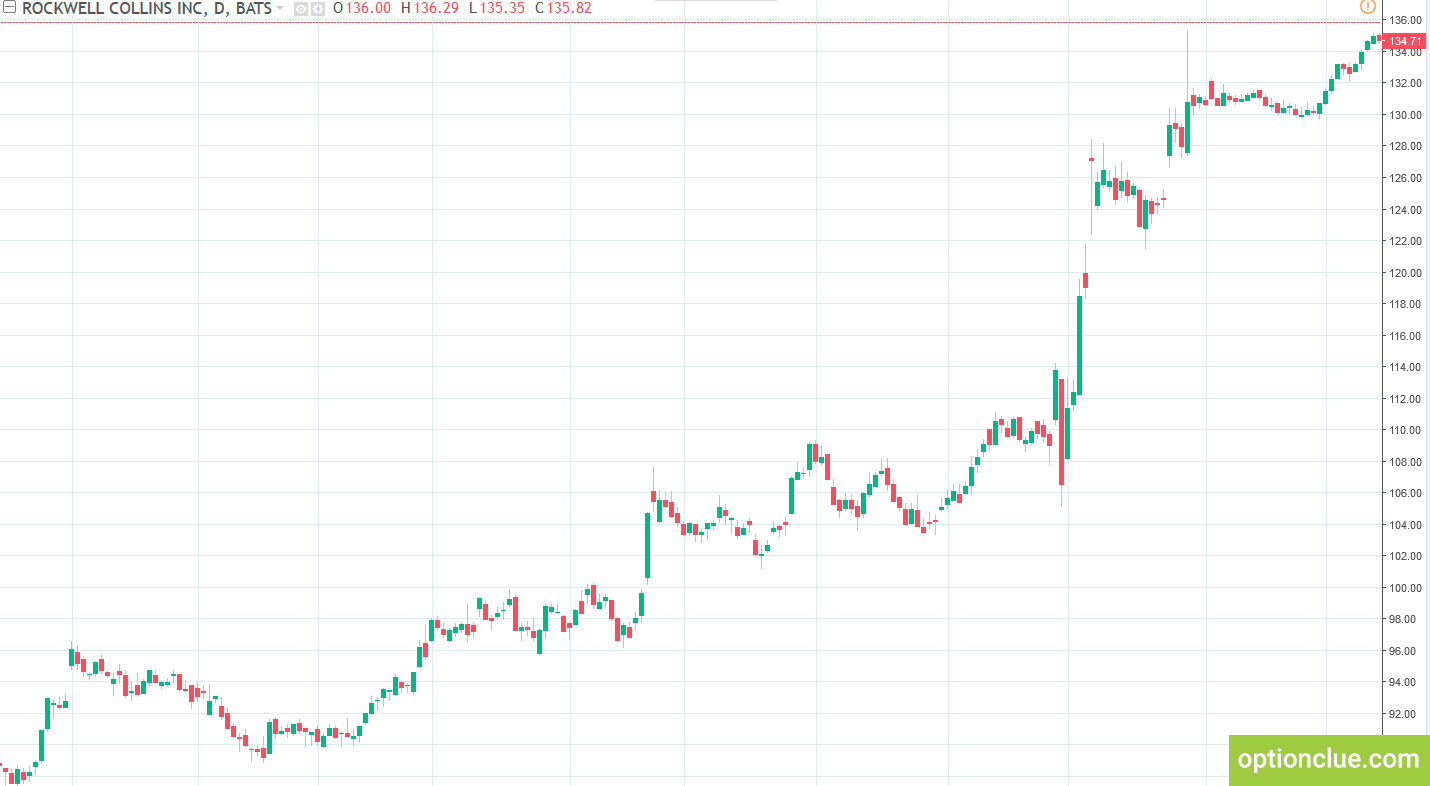
The first example is Rockwell Collins (COL). The stock price was $134.71 on October 13, 2017. It was in the TOP 10 «cheap» options and had one of the lowest Theta index value of 0.71. In terms of Theta, the purchase of options can be relevant since the stock is in the TOP 10 «cheap» assets.
In our experience, the most attractive stocks to buy options can be found when the Theta value is 1.0 or lower.
However, it’s worth noting that the use of just one Theta index does not build a complete picture since the index does not take into account the current market condition (trend, flat). With this in mind, one should turn to additional criterions for assessing if the market situation is favorable or not – it’s Sigma index – flats, triangles and trend screener, which we will consider a little later.
The Search for «Expensive» Stock Options by the Example of Calpine Corporation
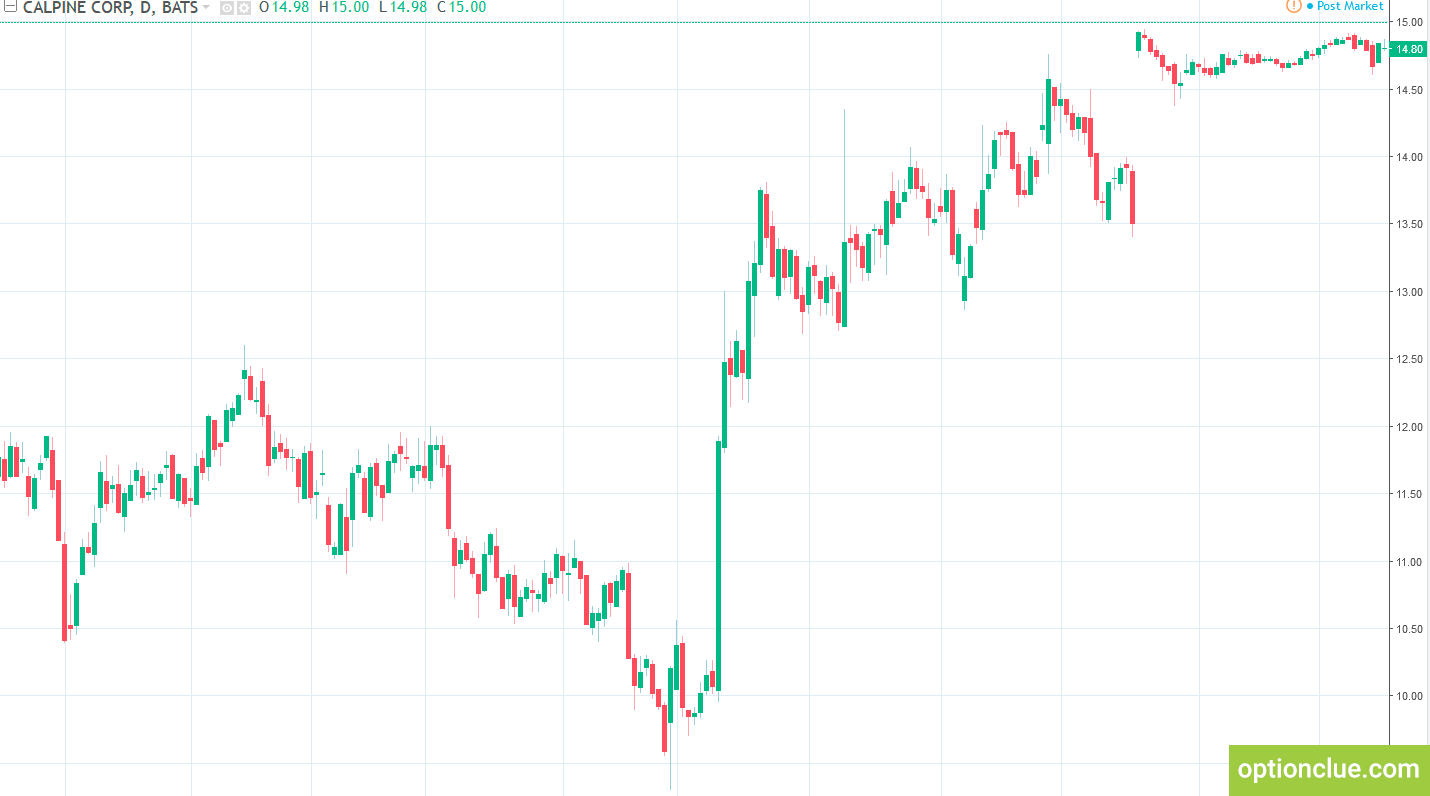
Let’s take the following example – it’s Calpine Corporation (CPN). The share price was $14.80 on October 10, 2017. The company ranked 5th in the TOP 10 «expensive» options. Its Theta index was 2.65.
As we can see, the Theta index value, in this case, is higher than the previous one by more than 3 times (0.71 for COL and 2.65 for CPN). In terms of Theta index, the sale of CPN stock options was relevant, since this asset was in the TOP 10 «expensive» assets and had a high Theta.
In our experience, the most attractive stocks to sell options can be found when the Theta value is 1.5 or higher.
The use of Sigma and Alpha as additional market analysis tools can confirm this statement or force to wait with the sale of options.

Figure 2. Calpine Corporation (CPN). Theta index was 2.65 (ranked 5th in the TOP 10 «expensive» options).
Simultaneous Application of Theta, Sigma and Alpha Indexes by the Example of AVEO Pharmaceuticals
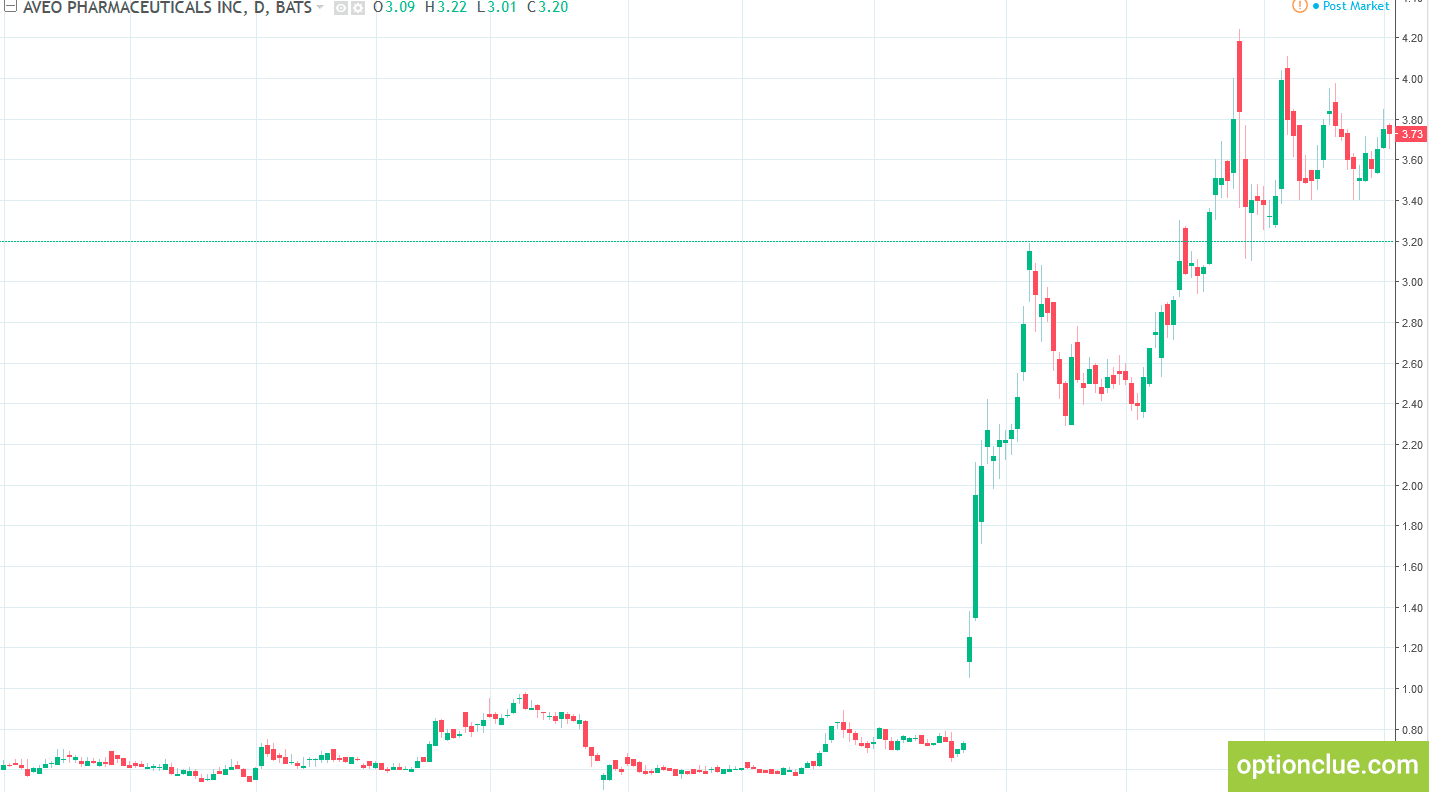
Let’s take another example – it’s AVEO Pharmaceuticals (AVEO). The stock price was $3.73 on October 4, 2017 and the stock was the leader in the TOP 10 assets to sell options (Alpha index). The stock had the following indices: Theta 3.3, Sigma 0.76, Alpha 2.51.

Figure 3. AVEO Pharmaceuticals (AVEO). Alpha index was 2.51 (ranked 1st in the TOP 10 assets to sell options).
How to interpret these values? Let’s start with Theta index. In our experience, options with the Theta value of 1.0 and lower are «cheap», while Theta value of 1.5 and higher indicate «expensive» options. In our case, the stock hit the TOP 10 «expensive» options and Theta was equal to 3.3.
Let’s continue with Sigma index (or Volatility Screener index). As we know, it lets identify assets with low and high market volatility. The index values of 0.8 and lower indicate the existence of a flat or triangle in the market and the index values of 1.5 and higher suggest an active trend development. Chart above shows the market is in the triangle as confirmed by Sigma index of 0.76.
To be sure, if we should deal with this share or not, let’s analyze Alpha index which is based on Theta and Sigma indexes. Alpha index corresponds to Fireball Screener alerts. It shows general attractiveness of assets to buy or sell options.
Stocks with Alpha index values below 1.0 and especially below 0.25 and lower are on the list of potentially attractive shares to buy options, these are the cheapest options with the greatest movement potential. Shares with Alpha values of 1.5 and higher are the most «expensive» and are in the Top assets to sell options. Alpha index was 2.51 on October 4, 2017.
Based on the foregoing, we can conclude that options are «expensive» relative to the market on October 4, 2017, it is profitable to sell the AVEO stock straddle or look for other options for profit-making from their high cost (selling put, strangle, short spread, etc.). To understand the historical maximums and minimums of options price, it is also necessary to analyze Implied Volatility (IV).
19 Jan. straddle (107 days till expiration) with a strike price of $4 was about $1.7.
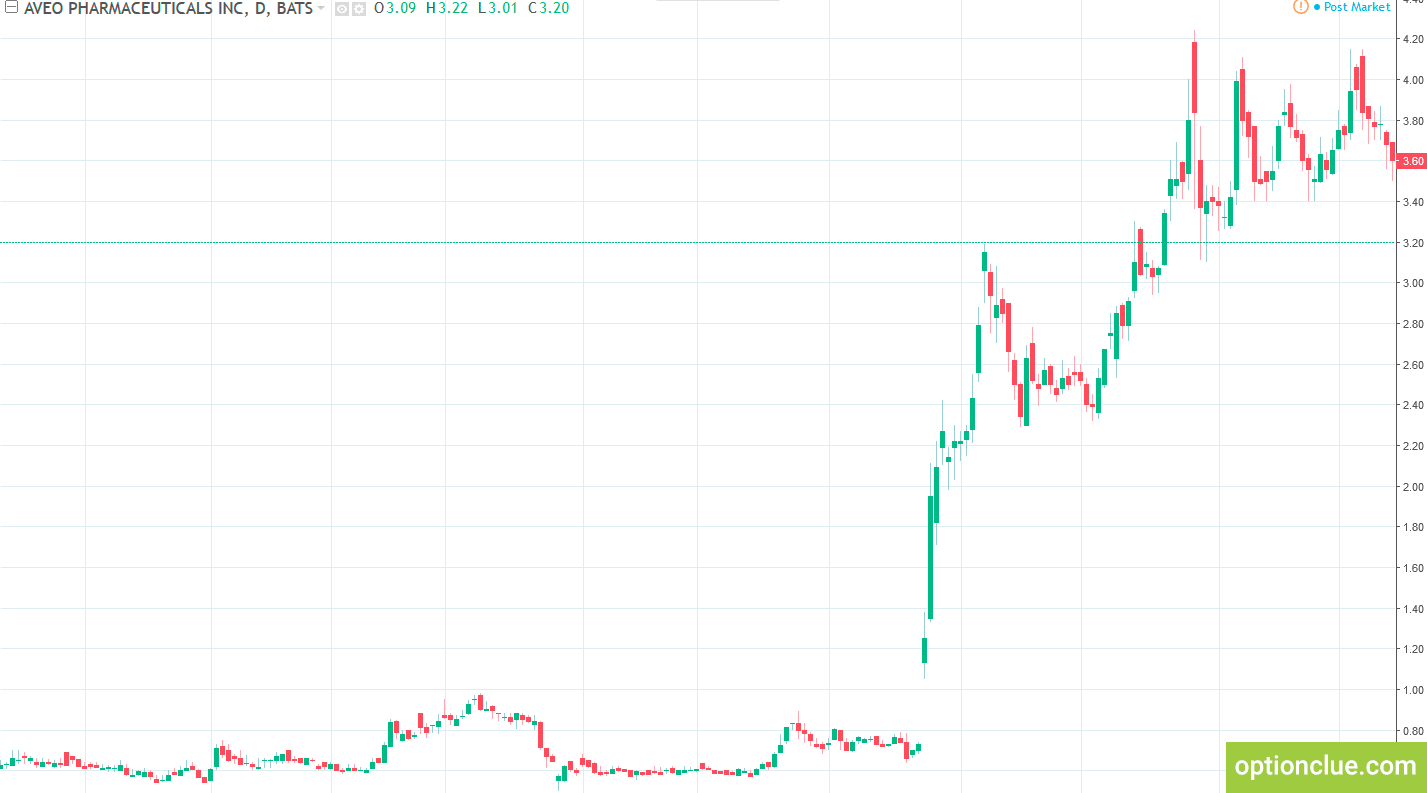
Let’s see how indexes changed as time passed. The chart below shows the market condition on October 16, 2017. The market is currently at the price mark of $3.60
So, Theta index decreased to 1.49.
Sigma index slightly increased and now it’s equal to 0.88. A slight change in the index value can be explained by the fact that after breaking through the triangle, the trend didn’t have time to develop rapidly.
A week later Alpha index fell significantly and now it’s equal to 1.32 (This value is typical for the middle of the table). That is, in terms of this index, one should keep an eye on the option position now.
Finally, 19 Jan. straddle with the strike price of $4 was $1.43, so it fell by about 16%.

Figure 5. AVEO Pharmaceuticals (AVEO). Thinkorswim trading platform. The straddle price decreased by 16% to $1.43.
The change in the straddle price provides guidance for determining the position profitability, but everything is logical: Theta index decreases and yields on previously opened short positions increase.
One could simply close the position on October 16 and fix about 16% of the profit, or further develop an option combination.
Conclusions on Option Screener
Theta index allows you to divide options into «cheap» and «expensive» taking into account the option price and recent market volatility. «Cheap» options can be considered those with a Theta 1.0 and lower, and «expensive» ones with Theta from 1.5 and higher.
Alpha index, which includes Theta and Sigma indexes, is a simple and universal tool for finding best options to buy or sell today.
To determine the most interesting stocks, one should analyze the options screener data beginning from the upper and lower part of the list according to the goals that a trader sets. You can find the most attractive shares from the 1st to the 10th position both in the upper and lower part of the table. Stocks from the middle of the list can become the future participants of the TOP, and you can hardly find something interesting among them.
Alpha index values of 1.0 and lower indicate the «cheapness» of options and attractiveness of their purchases (it’s recommended not to miss such opportunity) and the opposite index values, ranging from 1.5 and higher indicate their high cost and the ability to sell straddles.
To determine historical maximums and minimums, it’s necessary to analyze implied volatility (IV). If Alpha index is low and implied volatility is around 6-12 month lows, it can be an excellent market entry. The best signals to sell options are formed when the stock is in the Alpha Top and the implied volatility is around 6-12 month highs.
The screener helps in options analysis and lets you go through hundreds of assets in minutes and identify the most attractive options from a huge stock list and thus it saves your time. You should just analyze the selected financial instruments and wait for the optimal price to enter the market. You’ll have clear understanding what options to buy or sell.


