Pending stop orders in the breakout trading

We’ve discussed earlier the principles of plotting the horizontal levels, as well as their properties. In this article we will consider the use of pending stop orders when trading a breakout. These are such orders as buy stop and sell stop. Now by several examples, I will demonstrate the advantages and disadvantages of their use.
Contents
- Trading. What are pending stop orders?
- EURUSD. Disadvantages of pending stop orders application. Example 1
- EURUSD. Disadvantages of pending stop orders application. Example 2
- Trading tactics. Gold. Advantages of pending stop orders application. Example 3
- GBPJPY. Advantages of pending stop orders application. Example 4
- Conclusions on pending orders in the breakout trading strategy
Trading. What are pending stop orders?
First of all, let’s examine what is a pending stop order. Buy stop order allows you to buy an asset at a price higher than the current one if the market is rising (Figure 1).
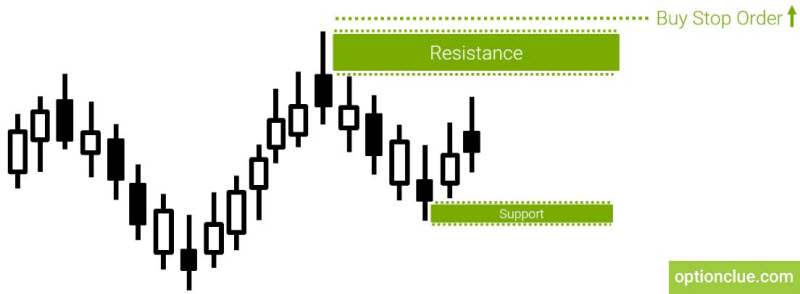
Figure 1. Buy stop order
Sell stop order – is to sell a financial instrument below the current price, if the market is falling (Figure 2).
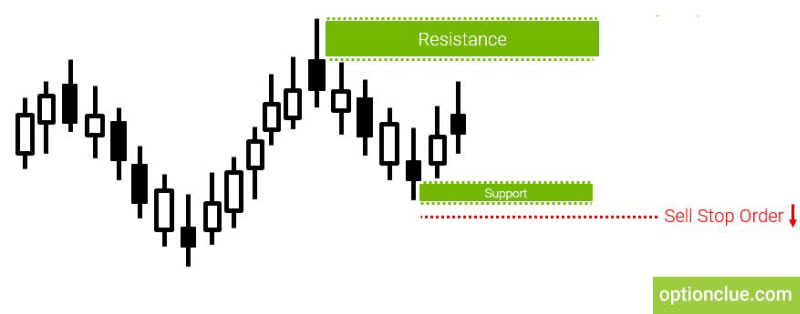
Figure 2. Sell stop order
Many traders, understanding the main properties of the levels, try to enter the market without waiting for the candle closing in case of the level breakout and open a buy position if the price has been during some time above the upper border of the resistance level or below the lower border of the support level.
EURUSD. Disadvantages of pending stop orders application. Example 1
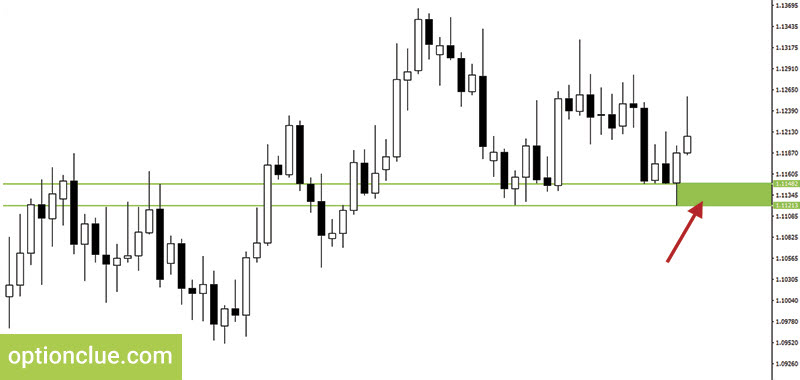
Let’s examine several examples and start with the EURUSD currency pair. In September 2016 the support level was formed after the bullish candle closing on September the 22nd. The lower border of the level is plotted according to the shadow of a bullish candle, the upper border is plotted on its body. The prices are 1.1122 and 1.1148. Let’s paint out the level borders with the rectangle (Figure 3).
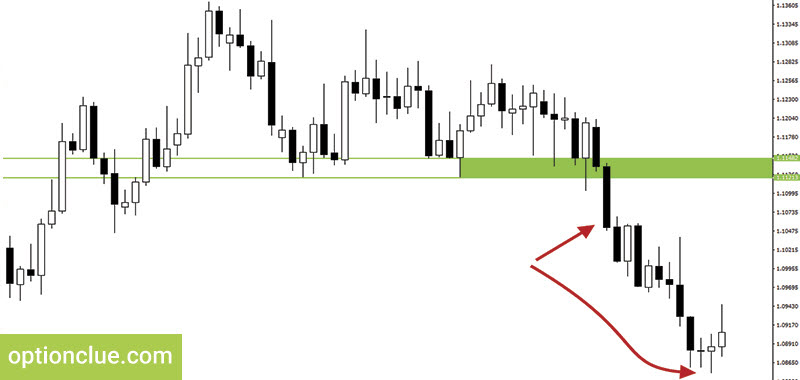
The market breaks through this support level closing much lower. This is the obvious level breakout after which the price continues to decline. In this case we can see a breakout signal success (Figure 4).
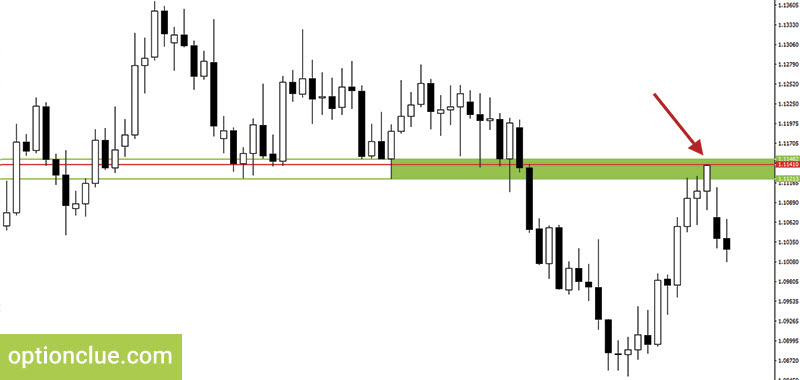
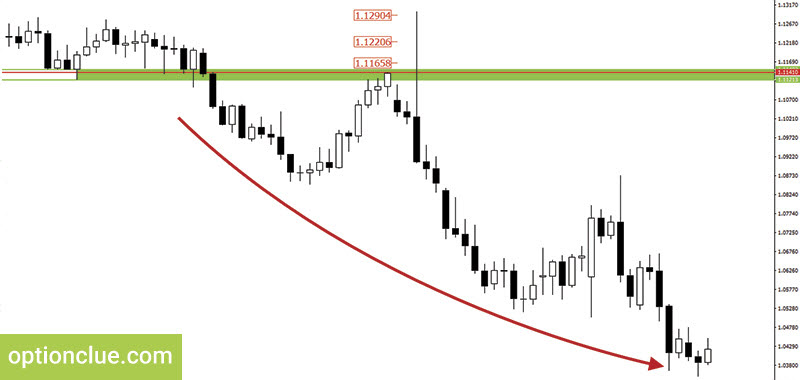
After an active decline, an aggressive and deep correction starts which is 60-70% of the impulse length. The level that is a support level turns into the resistance level now. For the convenience of perception, I will underline the upper border of the level (the price is 1.1141), because there is practically no shadow. After 2 bearish candles closing the resistance level has been formed (Figure 5).
Now I suggest looking at how the price was moving during the next day. The market was close enough to the resistance level. The price movement up and close above the level will give us the buying opportunity (to enter long) on the Daily timeframe or on smaller timeframes. If the price is above the level, some traders tend to open positions at this moment using pending stop orders.
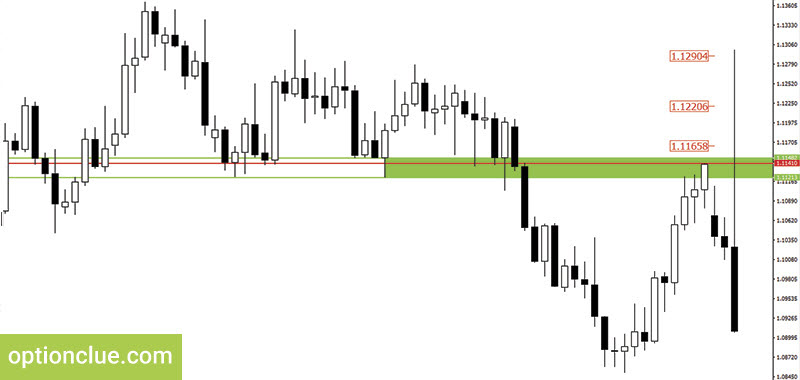
This is quite an aggressive approach, but if the trend continues right after the breakout, they get a favorable entry price. Since the upper border of the level is 1.1141, we can assume that a significant number of orders have been opened at prices of 1.1165, 1.1220 and so on up to 1.1290 (Figure 6). There were both stop loss defense orders and pending buy stop orders.
If you open a position above the upper border of the resistance you should understand it is a risky idea, since there has not been a fact of the candle closing above the level yet.
We can see that by the end of the day the market closed much lower those marks where it was before. The candle size is about 400 points. Traders, who have opened buy positions above the level by means of pending stop orders, turn out to be in a delicate situation since it’s impossible to place a reliable stop loss order as it turns out to be too big.
In order to consider such position to be justified stop loss should be small. Novice traders in such situations often try to «sit out» the drawdown, hoping that the market will go in the right direction. You need to understand that this behavior has nothing to do with trading.
Let’s come back to the example. The market dropped down, the price was declining until the end of December (Figure 7). This is an example of how dangerous it can be to enter the market before the fact of the level breakout, that is, before the obvious close of a breakout candle. The example we have examined is not a breakout, but only testing the level, which we’ve talked about in previous articles for traders.
EURUSD. Disadvantages of pending stop orders application. Example 2
There is another prime example on this currency pair (events since December).
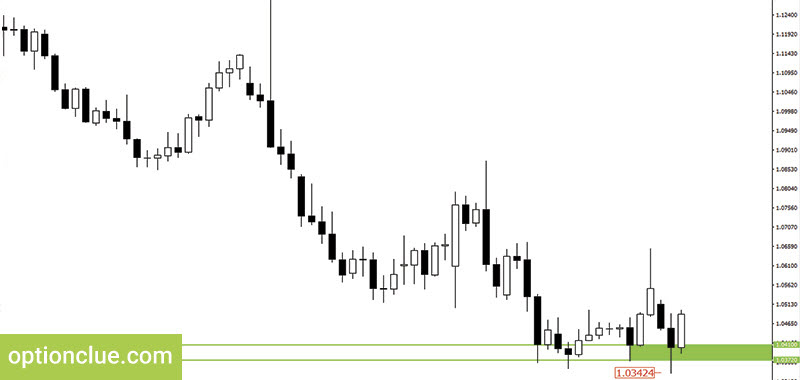
After the upward movement a bearish candle is formed, which has overlapped several bullish candles. And the resistance level has been formed. After that it becomes also possible to plot the support level at such points. The upper border is 1.0410, the lower border is 1.0372.
After that the price was falling during 2 days and as we can see the market was below the support level about 30-35 points on the bearish candle (Figure 8). And again, traders who believed that there would be a breakout in the market and opened short positions without waiting for the candle closing got the bearish positions opened below the support level.
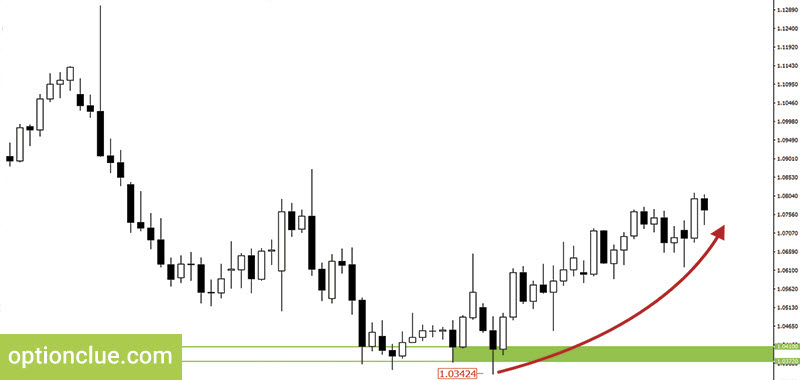
After the price moved up, by analogy with the first example, many traders found themselves either in a situation where the position needs to be closed or «sit it out» (Figure 9). There is no fact of the level breakout, but there is the position opened below this level. The entry price is the worst possible. We’ve examined the way of trading before the fact of the level breakout by the example of the EURUSD currency pair.
Trading tactics. Gold. Advantages of pending stop orders application. Example 3
Lets analyze more actively traded financial instruments such as the GBPJPY currency pair and gold, where such approach can have its advantages.
In September 2016 the gold market was in the flat for a long time, there were occasional false breakouts.
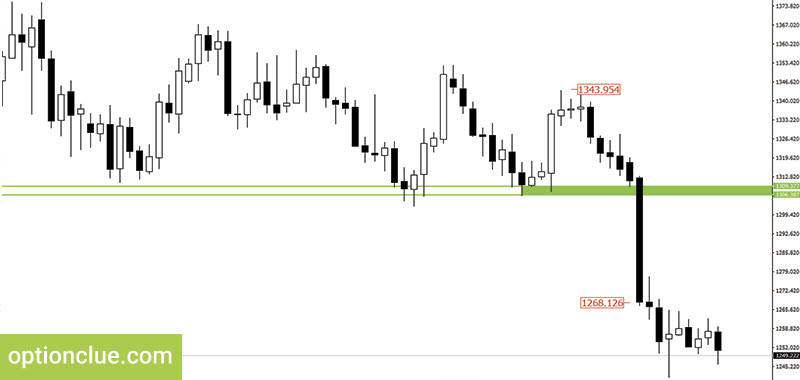
Then the support level is formed with the borders of $1306-1309. I will underline this level (Figure 10).
Afterwards, the price comes to the level and in the huge candle breaks it through and is closed at $1267 per troy ounce. The size of this day candle is about 45-50 dollars. If we waited for the market to close below the level, we would get a signal with a huge stop loss of about $80. (Figure 10). This is an unjustifiably big stop loss even for gold and the Daily time frame because risk management rules will not be met. To get a risk-reward ratio at least one to two will be very difficult.
Therefore, in this example there is no entry point at the close.
However, if you look for a breakout trading possibility around the Daily level with the help of a pending sell stop order or you can determine the entry point on a smaller timeframe, you could enter the market at a mark, say $1302 or $1298. In this case it is possible to obtain a worthy risk-reward ratio, which would allow you to trade on this financial instrument. In active markets it can be justified since a trader can make good profits by entering the market at attractive prices with small stop orders.
GBPJPY. Advantages of pending stop orders application. Example 4
Let’s examine one more example. The currency pair is GBPJPY. The situation in October 2016 is similar. The market has been in the flat for a long time, the lower border of the support level is 130.06, the upper border is 130.45 (Figure 12).
After a while, the market comes to the support level and a bearish candle is formed. If you wait for the candle to close in this situation, stop loss will be approximately 470 points (Figure 12). This is a very big stop loss even for Daily. At the same time when using pending stop orders or searching for entry points on smaller timeframes around such key levels, you can get an attractive entry price and a small stop loss.

Figure 13. GBPJPY. Support level breakout. Entry point can be only on smaller timeframes or using pending stop orders.
Conclusions on pending orders in the breakout trading strategy
The use of breakout pending orders in trading has its pros and cons. You need to understand where they should be applied and where not. If you trade assets that often move linearly after the level breakout, the use of such trading concept is justified.
If you prefer «quieter» financial instruments, for example, the EURUSD currency pair, then you had better wait for the candle to close and only after that make conclusions about the reasonability of entering the market.
Traders often make the process of plotting horizontal support and resistance levels much more difficult than it needs to be. Some of them tend to complicate this task by plotting unnecessary levels confusing them in determining further price movements in directed trading. After getting the Levels indicator you won’t have any difficulty in this due to the simplicity of its use. It can help not only identify price zones where the market movement can slow down or price reversal is likely to occur but also find entry signals that appear during a deep market correction or calculate stop-loss and take-profit.

