Trading tactics. Breakout trading examples

In this article we’ll discuss several examples of using one of the key trading tactics which is applicable in any markets and timeframes that is a breakout trading .
Contents
- What does a breakout trading mean?
- GBPUSD. Advantages of a breakout trading tactics
- Silver. Advantages of a breakout trading system
- EURAUD. Disdvantages of breakout trading
- Conclusions on a breakout strategy
What does a breakout trading mean?
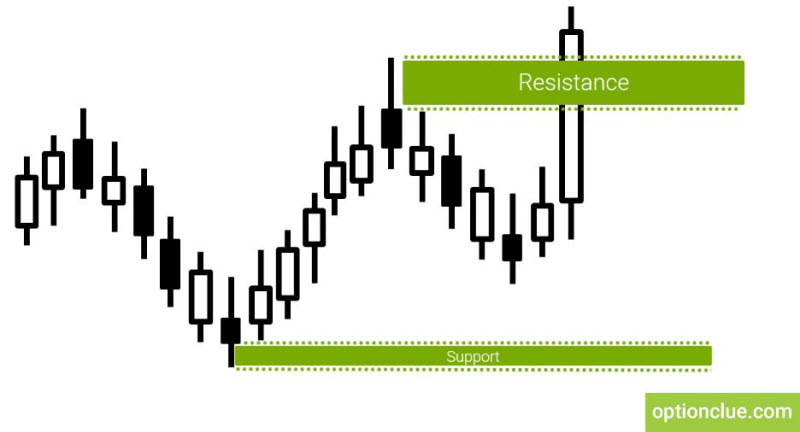
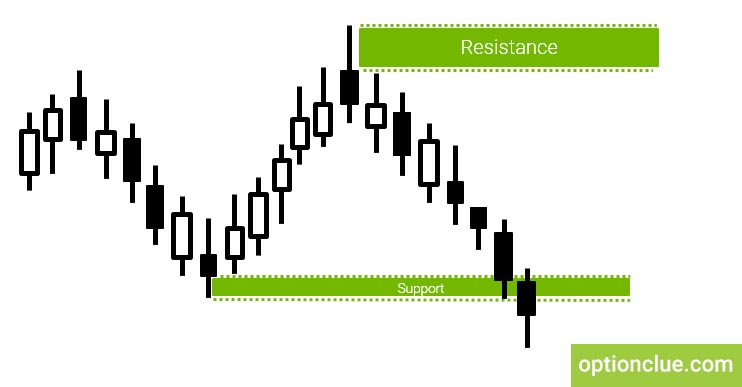
In order to determine the direction for trading, it is necessary to plot the next support and resistance levels and expect the market to overcome one or another level.
The price must be closed above the upper border of the resistance level to cause a buy signal appearance (Figure 1).
If the price breaks through the support level, this means that it’s possible now to open a bearish position (Figure 2).
GBPUSD. Advantages of a breakout trading tactics
Now we will take a few examples that show the advantages and disadvantages of the breakout trading.
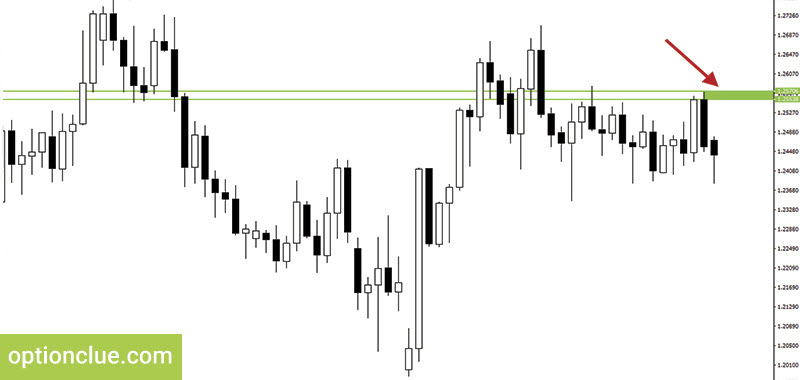
The first financial instrument is the GBPUSD currency pair. The market has been in a flat for a long time. The price has been in this price range beginning approximately from the twenties of January until the end of February. In such moments it is impossible to trade.
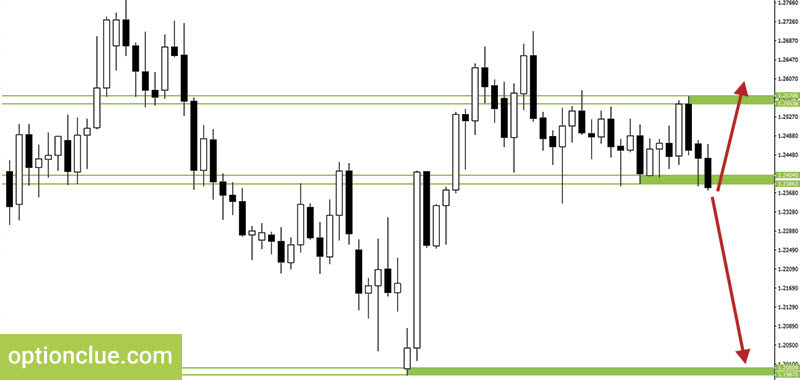
After that the horizontal resistance level has been formed. As you know, the most reliable levels are formed in case there is a clear market reversal. The upper border is determined along the shadow of the candle which is involved in this price reversal. This is the price 1.2570. The lower border is plotted along the bodies of the candles, that is 1.2553 (Figure 3).
After the upward movement, the rate of the pound begins to fall rapidly against the dollar. At this point a new level has appeared.
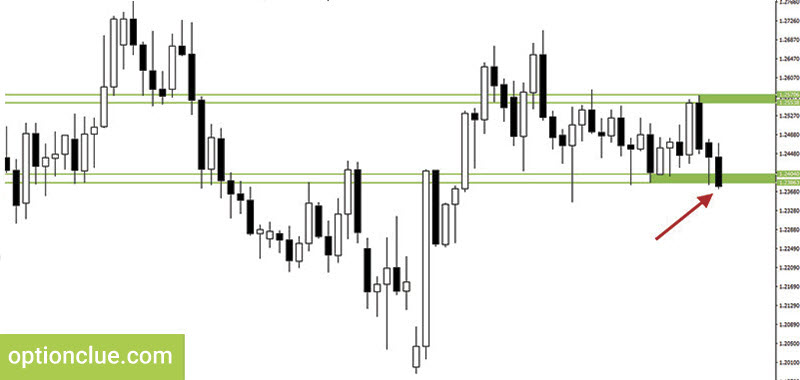
Just a few days before a support level was formed in the candles from February the 20th and 21st. The lower border of the level is 1.2386. As you know it’s plotted on the lowest shadow of the candle. The upper border is 1.2404, it’s plotted along the bodies.
Just a few days later the market broke through the support level (Figure 4). After this bear candle closing, we could say that a bear trend emerged in the market. Buy positions were no longer relevant after the candle closing. It was necessary to consider only opportunities to sell.
After the market was closed below the level, traders who prefer a breakout trading are ready to enter the market. There is still another aspect that is to calculate the potential of possible profit and risk.
To do this you have to size the distance to the stop loss order, which I recommend to place above the upper border of the resistance level when opening a sell position. In our case the stop loss size was about 200 points. In order to be able to open a position, it is necessary that the price movement potential, that is, the distance to take profit, be at least double the stop loss.
In our example the profit potential is about 370 points. The target is determined by the nearest support level which is in the range of 1.1987 to 1.2000 (Figure 5). This is a classic level which is determined by the aggressive bull impulse after a long-term decline in prices.
Has a fact of the level breakout taken place? Yes, it has. The question arises if it is possible to open a position? The stop loss is approximately 200 points, the price movement potential is about 370 points, the risk-reward ratio one to two is almost met. Therefore, we can open a sell position. The only thing left to do is to calculate the position size. I recommend to start risking not more than 2% of the capital per trade.
Silver. Advantages of a breakout trading system
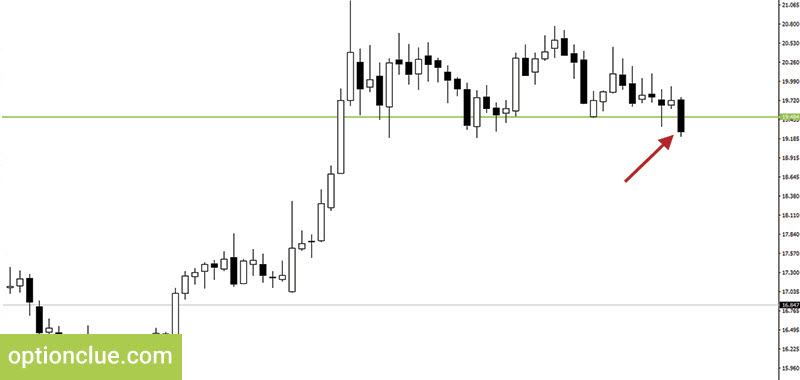
Let’s take one more example when the breakout trading tactics does justify itself. We have the silver market, the Daily timeframe. After the candle closing on August the 9th a support level has been formed. I will underline the lower border of this level (the price is 19.48), because the candle, being its base, is almost closed without a shadow. This is a classic level, plotted on 2 bear and 2 bull candles.
Later, the price was moving up for a while and then it was at one point. Afterwards a bear candle was closed on August the 19th. After the candle closing the market reversed and a sell breakout signal was formed (Figure 6).
Before opening a sell position you have to determine where the potential target is and at what point to liquidate the position if the market moves in the unfavorable direction.
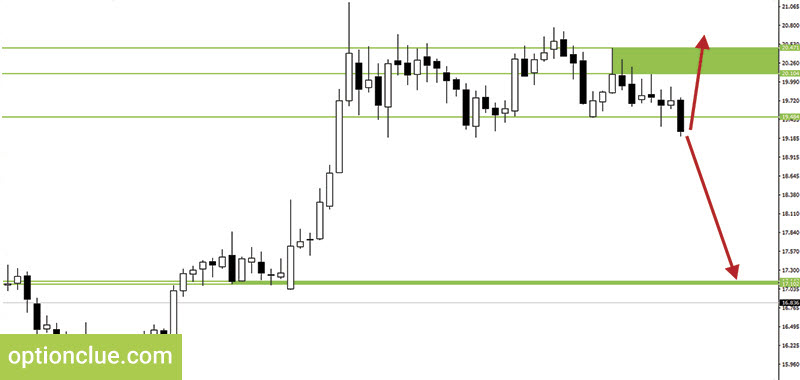
The primary target is the next support level which has been formed on the 17th-20th of June. The lower border of this level is 17.10, the upper border is just a few points higher that is 17.14. The resistance level is close to the point of the breakout. Its upper border is 20.47. The lower border is 20.10. Stop loss is always placed above the upper border of the resistance level. Its size is about 120 points (Figure 7).
Take profit is 220 points. But again, when breakout trading on the Daily timeframe, it’s difficult to get a risk-reward ratio at least 1 to 2 since the size of stop loss does not often allow it.
In my opinion, when breakout trading on the Daily timeframe it’s quite possible to trade when the reward-risk ratio is slightly less 2, for example, 1.8:1 or 1.9:1. Therefore, after position sizing, you can enter the market.
The price is falling for some time, and then a deep correction starts. This happens and experienced traders know there is no need to panic in such situations as the correction is a normal process. You can always get out of the position if the market reverses, in other words, breaks through the opposite level. Until this moment, the trend remains unchanged.
It is necessary to be able to hold a position to the established targets or liquidate it if the trend direction changes.
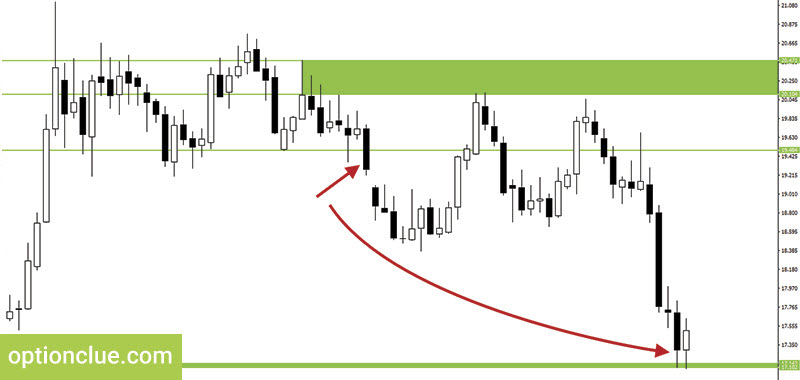
The next impulse wave is formed in the market. Afterwards the correction starts and then the market drops down and touches the support level. Take profit in this price movement could be reached in the candles that have been closed on the 6th and the 7th, the breakout position could be closed (Figure 8).
In this example, the distinctive feature of a breakout trading is clearly shown, that is there are a large stop loss and frequent corrections that appear directly after entering the market.
The breakout trading justifies itself, but you should be able to hold a position and it is desirable to search for a forex entry point at the beginning of a trend in order to get the lowest possible risk-reward ratio.
EURAUD. Breakout trading examples. Disdvantages
Let’s analyze the disadvantages of the breakout trading tactics as the example of the Daily timeframe currency chart for EURAUD.
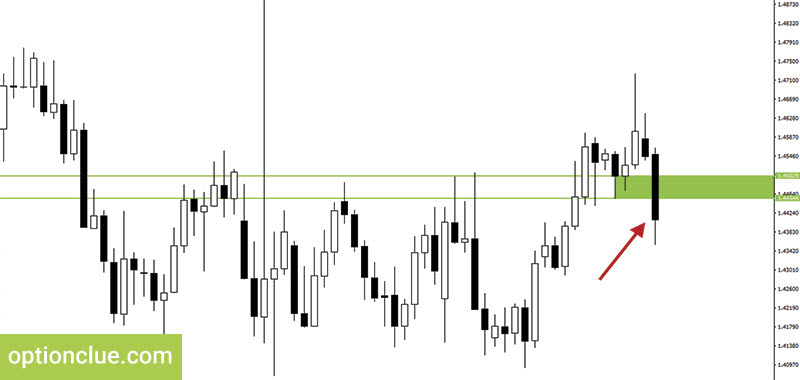
The support level has been formed, the lower border of which is 1.4454 and the upper border is 1.4502. The level breakout has occurred on January the 3d after the bear candle closing. The trend changes and sell positions become relevant and a breakout signal is formed (Figure 9).
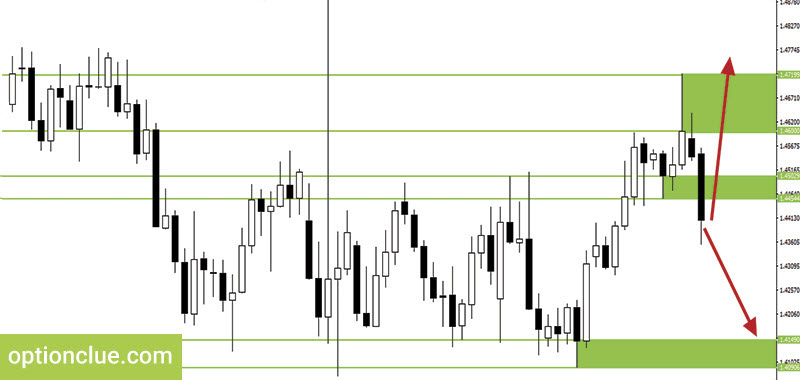
We will determine the point of the nearest target in accordance with the nearest support level. The upper border of the support level is 1.4149 and the lower border is 1.4090. This is the closest target for sell positions. The next targets can be set according to the levels of the larger timeframes.
As in the previous examples, we’ll calculate the risk size as to the upper border of the nearest resistance level. The upper border of this level is 1.4719, the lower border is 1.4600.
The distance to take profit or, in other words, the price movement potential is about 250 points.
The upper border of the resistance level is 1.4719. The stop loss order must be placed with a small gap to this border. Therefore, the distance to stop loss is 320-330 points. The potential for price movement turned out to be less than the risk size (Figure 10).
In this case you cannot enter the market as the minimum risk-reward ratio is not met. The basic principles of risk management are not met as well.
In such situations you can search for entry points on smaller timeframes or wait for a pullback trading signal. We’ll talk about this in the next articles.
Conclusions on a breakout strategy
Let’s summarize. The advantage of the breakout trading is that you can participate in the market movement making profit if the price moves actively in the direction of the trend instantly after the breakout. The disadvantages of this approach lie in the low reward-risk ratio in comparison with the pullback trading tactics. In addition, inexperienced traders are not often psychologically ready for market corrections which sometimes start immediately after the level breakout.
Traders often make the process of plotting horizontal support and resistance levels much more difficult than it needs to be. Some of them tend to complicate this task by plotting unnecessary levels confusing them in determining further price movements in directed trading. After getting the Levels indicator you won’t have any difficulty in this due to the simplicity of its use. It can help not only identify price zones where the market movement can slow down or price reversal is likely to occur but also find entry signals that appear during a deep market correction or calculate stop-loss and take-profit.
Also read about pullback trading system.

