The first property of horizontal levels. Examples in trading

In this article we’ll discuss the first property of horizontal support and resistance levels and analyze examples of their practical application.
Contents
- Trading. The essence of the first property of support and resistance levels
- Example of using horizontal levels in the Forex market. USDJPY
- USDCHF. Example of using support and resistance lines
Trading. The essence of the first property of support and resistance levels
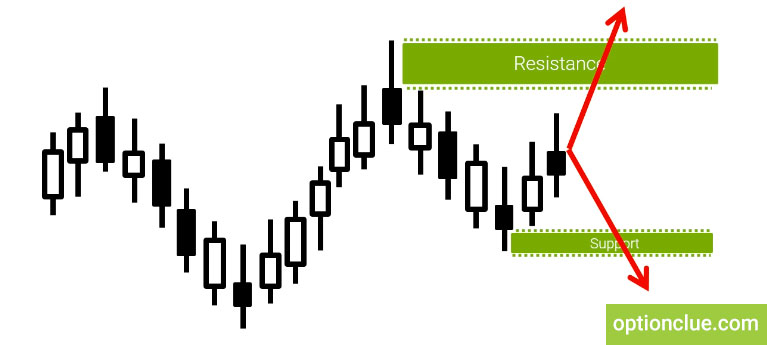
The first property of support and resistance levels allows us to determine the trend direction, which is the direction of the market at the moment when one can trade in case entry signals appear on the current or lower timeframes.
This requires the understanding of at least 2 nearest horizontal levels location – resistance and support. Breaking through one of these levels leads to the conclusion about further price movement.
If the market breaks through the resistance level, in other words, is set to close above the nearest resistance level, one can conclude that the tendency is bullish and the probability of market movement in this direction is high.
The same applies to the support level breakout. If the price is set to close below the level, opportunities to sell become relevant. (Figure 1).
Let’s take some examples in which a level breakout occurs or the price comes to the level and tests it.
Example of using horizontal levels in the Forex market. USDJPY
The USDJPY currency pair, the Daily timeframe. The current price when writing this article is 112.88. Suppose that the rightmost candle on the chart was formed on March the 2nd. Let’s plot the nearest support and resistance levels. How they are plotted we’ve considered in the previous article, so now we will not dwell on this.
So, the nearest resistance level around these price marks was formed on the 15th-16th of February.
There was a bullish movement, after that – bearish, 2 bull and 2 bear candles formed the resistance level of the first type. Let’s paint out the borders of this level with a colored rectangle (Figure 2).
A few days later we can see the new support level formation. The lower border of this level is 111.670. Let me remind you that the level is plotted from the borders of bodies to the borders of shadows of the candles where we visually see the market reversal.
Here this is the level of the first type since two bullish candles immediately follow two bearish ones. Let’s paint out this level, the price zone, with a rectangle of the yellow color (Figure 3).
The price moves up, comes to the resistance level and starts testing it. It goes into the price zone between the upper and lower borders of the level and starts to bounce off it, that is, it touches it by shadows, tests it, but can not break it through.
After that the market moves sideways for a while and then starts to strengthen again, during the next candle formation the market was above the resistance level for some time.
This suggests that the buy/sell trades were carried out even at a price of 115.492. The shadow of the candle is more than 50 points above the upper border of the level, so active trading was carried out on small timeframes.
Let’s look at the candle closing on Daily. The price did not break through the level, tested it actively, was higher for some time, but could not anchor on these marks and set to close between the upper and lower borders of the resistance level (Figure 4).
Thus, there is no fact of the level breakout in this candle, it occurs only if the market is closed above the resistance level and the breakout occurs by the body of a candle. If this does not happen, then we cannot talk about a breakout. It’s just testing the level by the price.
USDCHF. Example of using support and resistance lines
Let’s consider the following example. The USDCHF currency pair. We analyze the market condition at the beginning of March. The price has been strengthening for a long time, each new minimum on the chart was higher than the previous one. This is a classic uptrend. However, on the 3rd of March the resistance level was formed as the aggressive bear candle completely overlapped the previous bull one. It means that we can confidently talk about the new resistance level formation.
We underline the upper and lower borders. The lower border is 1.0131 and it is plotted according to the bodies of the candles, the upper one is 1.0146 according to the shadow of the candle. We paint out this level (Figure 5).
After the bear candle closing the market continues to rise, i.e the trend doesn’t change its direction, the price is strengthening and just after a day the price tries to overcome the mark 1.0146 again. During the day the market was above this zone.
On smaller timeframes, such as fifteen minutes timeframe (M15), one-hour timeframe (H1), there were certainly strong trends that made it possible to earn, but there wasn’t the market closing above the resistance level on the Daily timeframe, neither in this candle, nor in the next one. The level was tested by the price, but there was no breakout.
In the next candle (a bear candle) there were also attempts to break through the level, but it did not happen again (Figure 6).
Such situations are very common. I recommend you to wait always for the candle to close, making conclusions whether the level has been broken or not and what to do next. This is very, very important.
Traders often make the process of plotting horizontal support and resistance levels much more difficult than it needs to be. Some of them tend to complicate this task by plotting unnecessary levels confusing them in determining further price movements in directed trading. After getting the Levels indicator you won’t have any difficulty in this due to the simplicity of its use. It can help not only identify price zones where the market movement can slow down or price reversal is likely to occur but also find entry signals that appear during a deep market correction or calculate stop-loss and take-profit.
Good luck in trading!


