Levels trading. The first property of horizontal price levels
To determine the most effective way of support and resistance levels usage in your trading strategy, you should clearly understand their key properties.
How do support and resistance levels allow us to determine the trend direction? What role do they play when opening and closing a position? The answer to all these questions must be definite.
In this article we’ll discuss the first property of horizontal price levels.
Contents
- What does the level breakout indicate?
- Testing the level by the price
- How important is the visual price level breakout?
- May the closing price within the price level be considered as a breakout?
- Conclusions on trading levels
What does the level breakout indicate?
The first property of horizontal support and resistance levels allows us to determine the trend direction, which is the direction of the market at the moment and one can trade in case entry signals appear. Also this feature allows to define entry points.
This requires the understanding of at least 2 nearest horizontal levels location – resistance and support. Why two? Breaking through one of these levels leads to the conclusion about further price movement.
The first property of horizontal price levels: the breakout direction points to further possible price movement.
If the market breaks the resistance level, in other words, it is moving from the bottom up and is set to close above the nearest resistance level, the tendency is bullish and the market can continue to move in this direction.

As the market moves it’s necessary to actualize the nearest support and resistance levels.
If the price starts moving down and is set to close below the support level, we can conclude that there is downtrend at the moment and the market in the short term may fall. When trading a trend, searching for decline entry points is relevant.
Just for that reason, it’s necessary to plot at least 2 nearest levels – the breakout of one of them determines the current trend direction and generates a breakout entry point.
Testing the level by the price
Suppose, the market starts moving up, comes to the resistance level and touches or breaks it with a candle shadow. When something like this happens such price movement can’t be considered as a breakout.
Testing the level – is a situation when the market comes to the support or resistance level, breaks it through with a candle shadow or touches with shadows for a few candles and at the same time, none of the candles breaks it by its body.
If the market doesn’t break the level but only tests it, such price movement shouldn’t be considered as a completed level breakout. I recommend that you rely on closing price – above the resistance or below the support levels.

The price is testing the nearest resistance level. There is no breakout.
If the market still continues to rise as in the example below and is closed above the resistance level, then level breakout occurs.
In this case, according to the first property of levels, we can conclude that the market tendency observed at present – is rising.

The resistance level is broken.
A bullish movement doesn’t necessarily continue directly after the breakout candle closing. After that, the correction can often start. When the trend evolves, the balance between buyers and sellers is shifting that makes prices in developed markets move non-linearly.
Even if the global trend direction is bullish and the market is rising, the price growth in each period will correspond to the recession when prices are declining for some time and market is moving in the opposite direction to the main trend.
Sooner or later support and resistance levels will be updated and the traders’ aim is to focus on the breakout of a particular level and reach conclusions based on price movements rather than trying to predict them.
For instance, if the market continues moving up and breaks the next resistance level, a new bullish signal is formed; it indicates that the trend remains upward and the market may keep on moving in this direction.
How important is the visual price level breakout?
Often the market forms signals when at first sight it’s difficult to determine if the level has been broken or not. Most often this happens when the market is set to close just a few pips above the resistance level (or below the support level).
How to interpret such a movement? Should it be considered as a complete breakout?

The market is set to close around the upper border of the resistance level. There is no fact of a breakout.
Support and resistance levels, as well as other technical analysis tools, work for the reason that traders believe these market analysis tools have to work.
This is the only reason why the horizontal levels are noteworthy. In case you can hardly visually determine if the breakout has occurred or not, I recommend that you don’t consider this close as a completed breakout and wait for at least one more candle.
In this case, you’ll see to what extent the close above this level was true or false. If the market keeps on moving in this direction, is set to close above this level, we can conclude that it’s indeed the resistance level breakout and therefore long positions remain relevant.

The market is set to close around the upper border of the resistance level. The next candle is obviously closed higher, that’s why the level is broken.
You had better always stick to the signal clarity. To what extent is the breakout of the level you see on the market obvious? If you have to zoom in a chart and look closely to figure out if a breakout has occurred in this point, I recommend ignoring such price movements. In this case, other traders as well as you will zoom in a chart and think: «Has the breakout been here or not?». There will be no consensus on it. Therefore an expectancy of signal success in the given point will be lower.
In such situations, one should wait for confirmation or denial of the signal.
You should stop wondering about the future level breakout. In my experience, traders guessing what level is about to be broken, lose money on the market more often than those who focuses solely on the fact of breakout or rebound.
May closing price within the price level be considered as a breakout?
Suppose the market is moving to the resistance level but can’t break it. The next candle opening above the resistance level is closed below its upper border. Such situations are rare but cause confusion among traders who begin to study the horizontal levels.

The market is set to close between the upper and lower borders of the resistance level. The next candle is also closed within this zone. There is no fact of a breakout.
In this situation, there is no fact of a breakout and it’s impossible to say the level has been broken. If after that the market is still moving up and is set to close above the resistance level, the obvious fact of the level breakout occurs, then it can be argued that trend is bullish and it often makes sense to search for additional buy signals.
Let us examine another similar example; the market is moving down and reaches the support level, next market movements occur within the price zone, which is tested by shadows and bodies of candles.

The market fluctuates between the upper and lower borders of the support level. There is no fact of a breakout, the tendency remains bullish.
Until the level is broken we can’t conclude that there is a downtrend on the market and we should search for decline entry points. Until the market closes below the lower border of the support level, there should be no place for reaching such conclusions.
Conclusions on trading levels
Summarizing all abovementioned I’d like to reiterate that the trader’s main mission is to know the key properties of support and resistance levels and apply these properties in their practice.
If a trader has no clear trading principles, he’ll have doubts about attempts to guess the direction of price movement instead of moving with the market and focus on the trend direction, and key support and resistance levels breakouts.
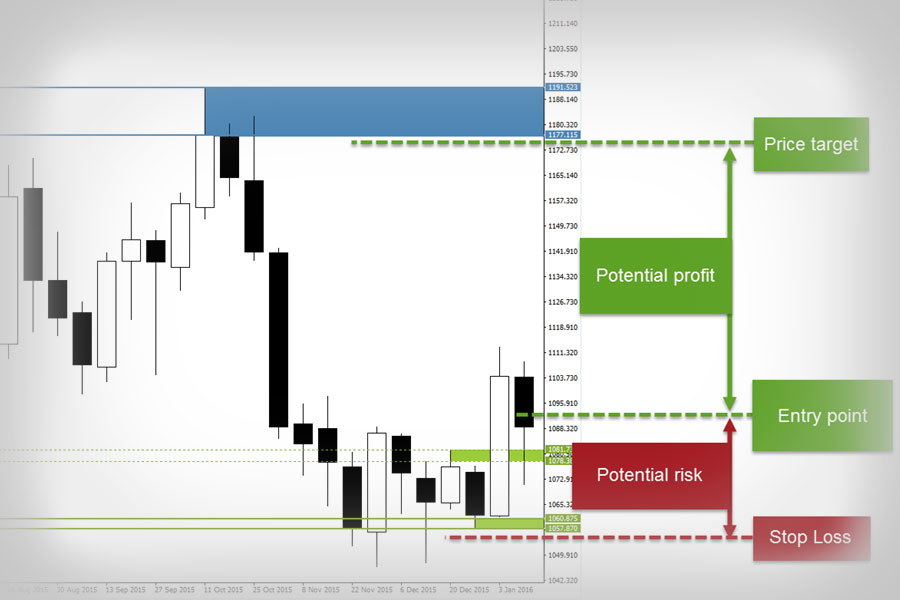
Traders often make the process of plotting horizontal support and resistance levels much more difficult than it needs to be. Some of them tend to complicate this task by plotting unnecessary levels confusing them in determining further price movements in directed trading. After getting the Levels indicator you won’t have any difficulty in this due to the simplicity of its use. It can help not only identify price zones where the market movement can slow down or price reversal is likely to occur but also find entry signals that appear during a deep market correction or calculate stop-loss and take-profit.
Good luck in trading!