Trading tactics. The breakout visibility characteristics

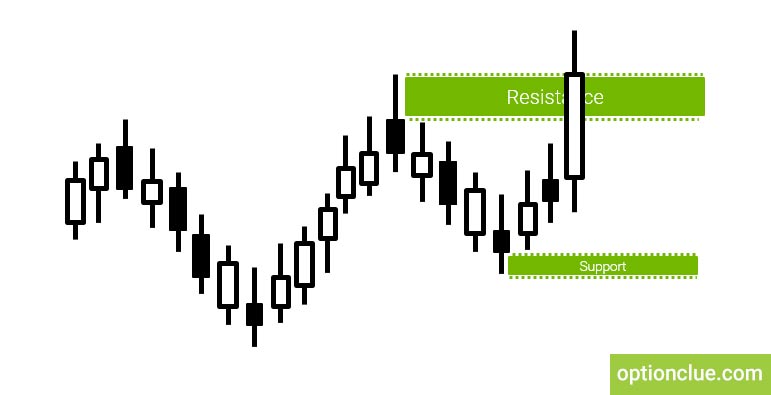
There are situations in the market when at first sight it’s difficult to determine if the resistance or support level has been broken or not. This happens when the price is closed several points above the resistance level (Figure 1) in case we are looking for a buying opportunity or slightly below the support level when opening a sell position.
In this article we will discuss how to interpret such situations and whether they are worth considering as a level breakout.
Contents
- Consequences of low breakout visibility in trading
- Trading. Signal failures reasons
- Conclusions on filtering trade alerts
Consequences of low breakout visibility in trading
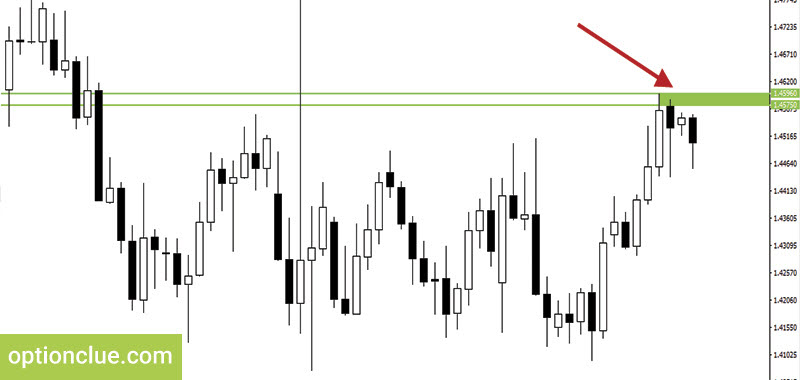
Let’s consider the Daily timeframe of the EURAUD currency pair. The level I want to show is formed on December the 28th, 2016. It consists of five candles, at the same time at first the bullish movement was formed. After that a short-term bear correction took place after which the resistance level was formed. Two bear and two bull candles were involved in the reversal.
The upper border of the level can be determined along the shadows of the candles, that is 1.4596, the lower border is plotted along the bodies. This price is 1.4575. The resistance level is on these marks (Figure 2).
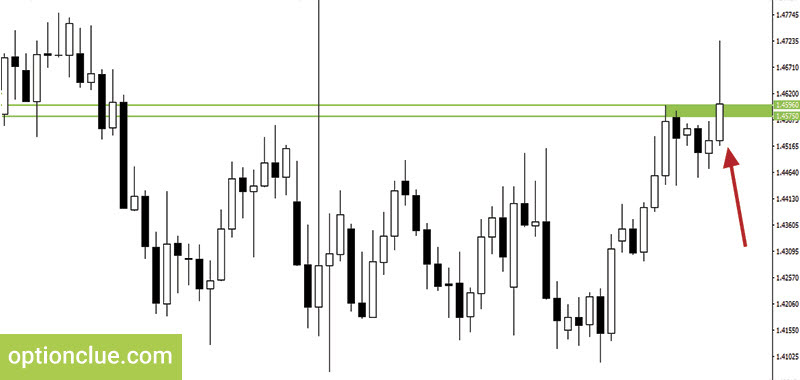
After the resistance level formation the market started moving up again. In addition, after a bull candle with a long shadow closing, the level breakout took place (Figure 3).
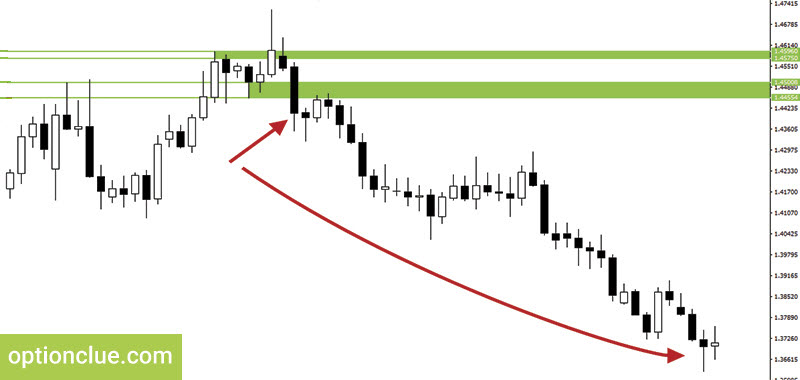
This candle was closed slightly above the level. However, you can see the signal failure as the price began to decline. Moreover, a few days later, having broken through the nearest support level the market reversed and after a short correction dropped down (Figure 4).
Trading. Signal failures reasons
Why did this happen? Let’s analyze it in a detail. All the levels work only for the reason that most traders who use them believe that they have to work. They know all their properties and consider the breakouts based on what they see on the chart.
For example, if you have to zoom in a chart and look closely to figure out if a breakout has occurred, there is a high probability that other traders will not do the same. As a result, the total number of traders who consider such breakout to be true decreases, along with this, the probability of such signals success reduces.
Conclusions on filtering trade alerts
In case you can hardly determine if the breakout has occurred on the chart or not, I recommend not to consider this close as a completed breakout. You had better wait for confirmation or denial of such signal in the next candle and only after that make trading decisions. Such situations are rare but can cause confusion among traders. Therefore, it is preferable to play it safe once again and as in our example wait for the next candle closing.
Traders often make the process of plotting horizontal support and resistance levels much more difficult than it needs to be. Some of them tend to complicate this task by plotting unnecessary levels confusing them in determining further price movements in directed trading. After getting the Levels indicator you won’t have any difficulty in this due to the simplicity of its use. It can help not only identify price zones where the market movement can slow down or price reversal is likely to occur but also find entry signals that appear during a deep market correction or calculate stop-loss and take-profit.
Good luck in trading!


