
We make up a weekly medium-term trade list based on CFTC reports and technical analysis.
The table below provides a description of the technical condition of the market on the most popular financial instruments, as well as information on the large speculators’ actions according to the last COT reports and the previous period.
If you want to use CFTC reports in your trading practice, you should understand that for an objective assessment of the situation it’s not enough to know the data of the last report. The dynamic is more important, in other words, comparing the statistics of large speculators’ actions in the current period with the previous one, so we publish both values in the table.
Note that the arrow direction gives us information about the large speculators’ actions (buying or selling) relative to the asset specified in the first column. For example, for CHF, the up arrow () indicates that COT net position indicator is rising, namely CHF is being bought, but not USDCHF.
Trade list for the current week
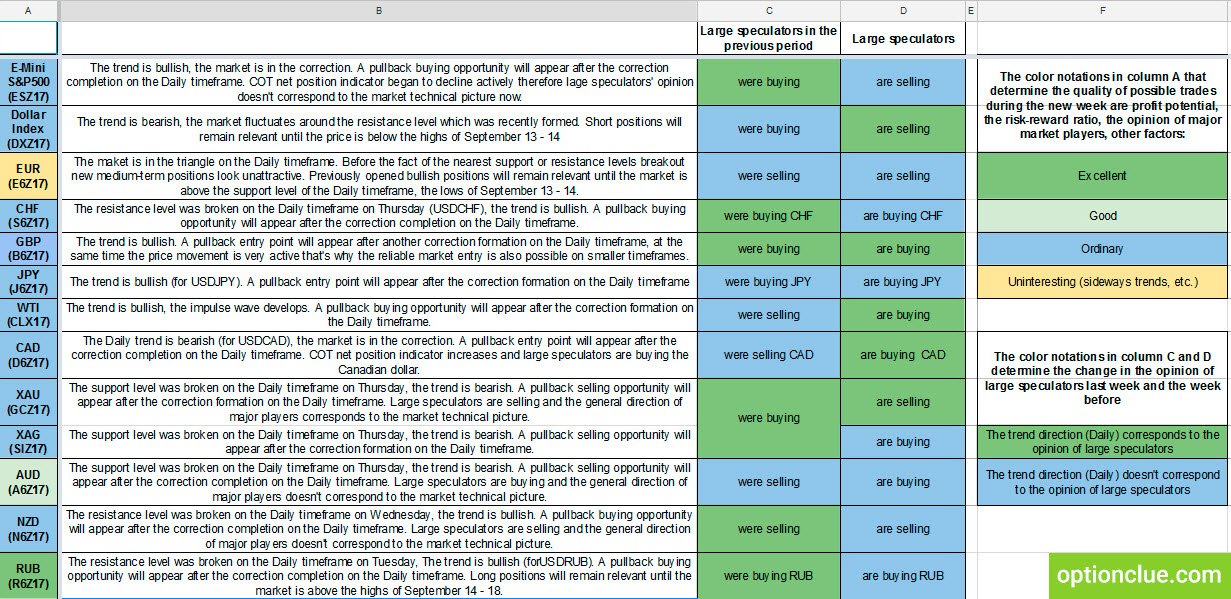
| Asset | Comment | 15. 09 | 22. 09 |
|---|---|---|---|
| **E-Mini S&P500 (ESZ17) | The trend is bullish, the market is in the correction. A pullback buying opportunity will appear after the correction completion on the Daily timeframe. COT net position indicator began to decline actively therefore lage speculators' opinion doesn't correspond to the market technical picture now. | ||
| **Dollar Index (DXZ17) | The trend is bearish, the market fluctuates around the resistance level which was recently formed. Short positions will remain relevant until the price is below the highs of September 13 - 14 | ||
| *EUR (E6Z17) | The maket is in the triangle on the Daily timeframe. Before the fact of the nearest support or resistance levels breakout new medium-term positions look unattractive. Previously opened bullish positions will remain relevant until the market is above the support level of the Daily timeframe, the lows of September 13 - 14. | ||
| **CHF (S6Z17) | The resistance level was broken on the Daily timeframe on Thursday (USDCHF), the trend is bullish. A pullback buying opportunity will appear after the correction completion on the Daily timeframe. | ||
| **GBP (B6Z17) | The trend is bullish. A pullback entry point will appear after another correction formation on the Daily timeframe, at the same time the price movement is very active that's why the reliable market entry is also possible on smaller timeframes. | ||
| **JPY (J6Z17) | The trend is bullish (for USDJPY). A pullback entry point will appear after the correction formation on the Daily timeframe. | ||
| **WTI (CLX17) | The trend is bullish, the impulse wave develops. A pullback buying opportunity will appear after the correction formation on the Daily timeframe. | ||
| **CAD (D6Z17) | The Daily trend is bearish (for USDCAD), the market is in the correction. A pullback entry point will appear after the correction completion on the Daily timeframe. COT net position indicator increases and large speculators are buying the Canadian dollar. | ||
| **XAU (GCZ17) | The support level was broken on the Daily timeframe on Thursday, the trend is bearish. A pullback selling opportunity will appear after the correction formation on the Daily timeframe. Large speculators are selling and the general direction of major players corresponds to the market technical picture. | ||
| **XAG (SIZ17) | The support level was broken on the Daily timeframe on Thursday, the trend is bearish. A pullback selling opportunity will appear after the correction formation on the Daily timeframe. | ||
| ***AUD (A6Z17) | The support level was broken on the Daily timeframe on Thursday, the trend is bearish. A pullback selling opportunity will appear after the correction completion on the Daily timeframe. Large speculators are buying and the general direction of major players doesn't correspond to the market technical picture. | ||
| **NZD (N6Z17) | The resistance level was broken on the Daily timeframe on Wednesday, the trend is bullish. A pullback buying opportunity will appear after the correction completion on the Daily timeframe. Large speculators are selling and the general direction of major players doesn't correspond to the market technical picture. | ||
| ****RUB (R6Z17) | The resistance level was broken on the Daily timeframe on Tuesday, The trend is bullish (forUSDRUB). A pullback buying opportunity will appear after the correction completion on the Daily timeframe. Long positions will remain relevant until the market is above the highs of September 14 - 18. |
| The notation that determines the quality of possible trades during the new week are profit potential, the risk-reward ratio, the opinion of major market players, other factors: | |
| **** | Excellent |
| *** | Good |
| ** | Ordinary |
| * | Uninteresting (sideways trends, etc.) |
| The notation that determines the change in the opinion of large speculators, the direction of COT net position indicator in the reporting and prior periods are: | |
| large speculators are buying the asset specified in the first column | |
| large speculators are selling the asset specified in the first column | |
| the green color of the arrows means that the Daily trend direction corresponds to the opinion of large speculators | |
| the blue color of the arrows means that the Daily trend direction doesn’t correspond to the opinion of large speculators |
Trade list in a graphical format is available here.
If you want to get more information on the pullback trading tactics and other aspects of trading in the market, watch the «Horizontal levels in trading» video course.
Conclusions
September is one of the most active trading periods of the year when strong price movements take place. For this reason, almost all assets can be interesting on timeframes under Daily. In terms of medium-term trading, financial instruments with the correction close to completion on the Daily timeframe and with potentially the most promising risk-reward ratio are USDRUB, GBPAUD and AUDCHF.
AUDUSD, CHFJPY and EURAUD. are less interesting, but in the near future they can also become noteworthy depending on the depth of the market correction.
After breaking through the triangle, EURUSD may become interesting (the market is likely to break this converging formation down due to large speculators’ active sales).
Other financial instruments in the trade list may be also interesting, but in these markets pullback signals on the Daily timeframe are likely to occur no earlier than a week.
More information on the topic:
- The role of support and resistance levels in the trading plan
- Trading tactics. Breakout trading and pullback trading
- How to use CFTC reports in trading. General concepts
- How to use CFTC reports in trading. The logic of large speculators
Good luck in trading!