We are reviewing the most important levels for key financial instruments and likely scenarios for future developments.
Key Topics
- Euro (EURUSD)
- British Pound (GBPUSD)
- Swiss Franc (USDCHF)
- Japanese Yen (USDJPY)
- Canadian Dollar (USDCAD)
- Australian Dollar (AUDUSD)
- Bitcoin (BTC)
- Ether (ETH)
- Apple Inc (AAPL)
- NVIDIA Corp (NVDA)
- Tesla Inc (TSLA)
- Summary
Euro (EURUSD)
The bearish trend continues; the correction ended 4 candles ago, and an impulse wave is currently developing. The last broken level was support (1.1677 — 1.1692). The breakout occurred 7 candles ago.
The intermediate target for the downward movement is the support level with boundaries 1.1471 — 1.1521.
The potential reward/risk ratio from current prices when setting targets and fixing risks based on daily timeframe levels may be small (about 0.7:1).
Short positions will remain relevant as long as the market stays below the nearest resistance level with boundaries 1.1628 — 1.1644. If the market successfully consolidates above this nearest resistance, the trend will reverse to bullish.
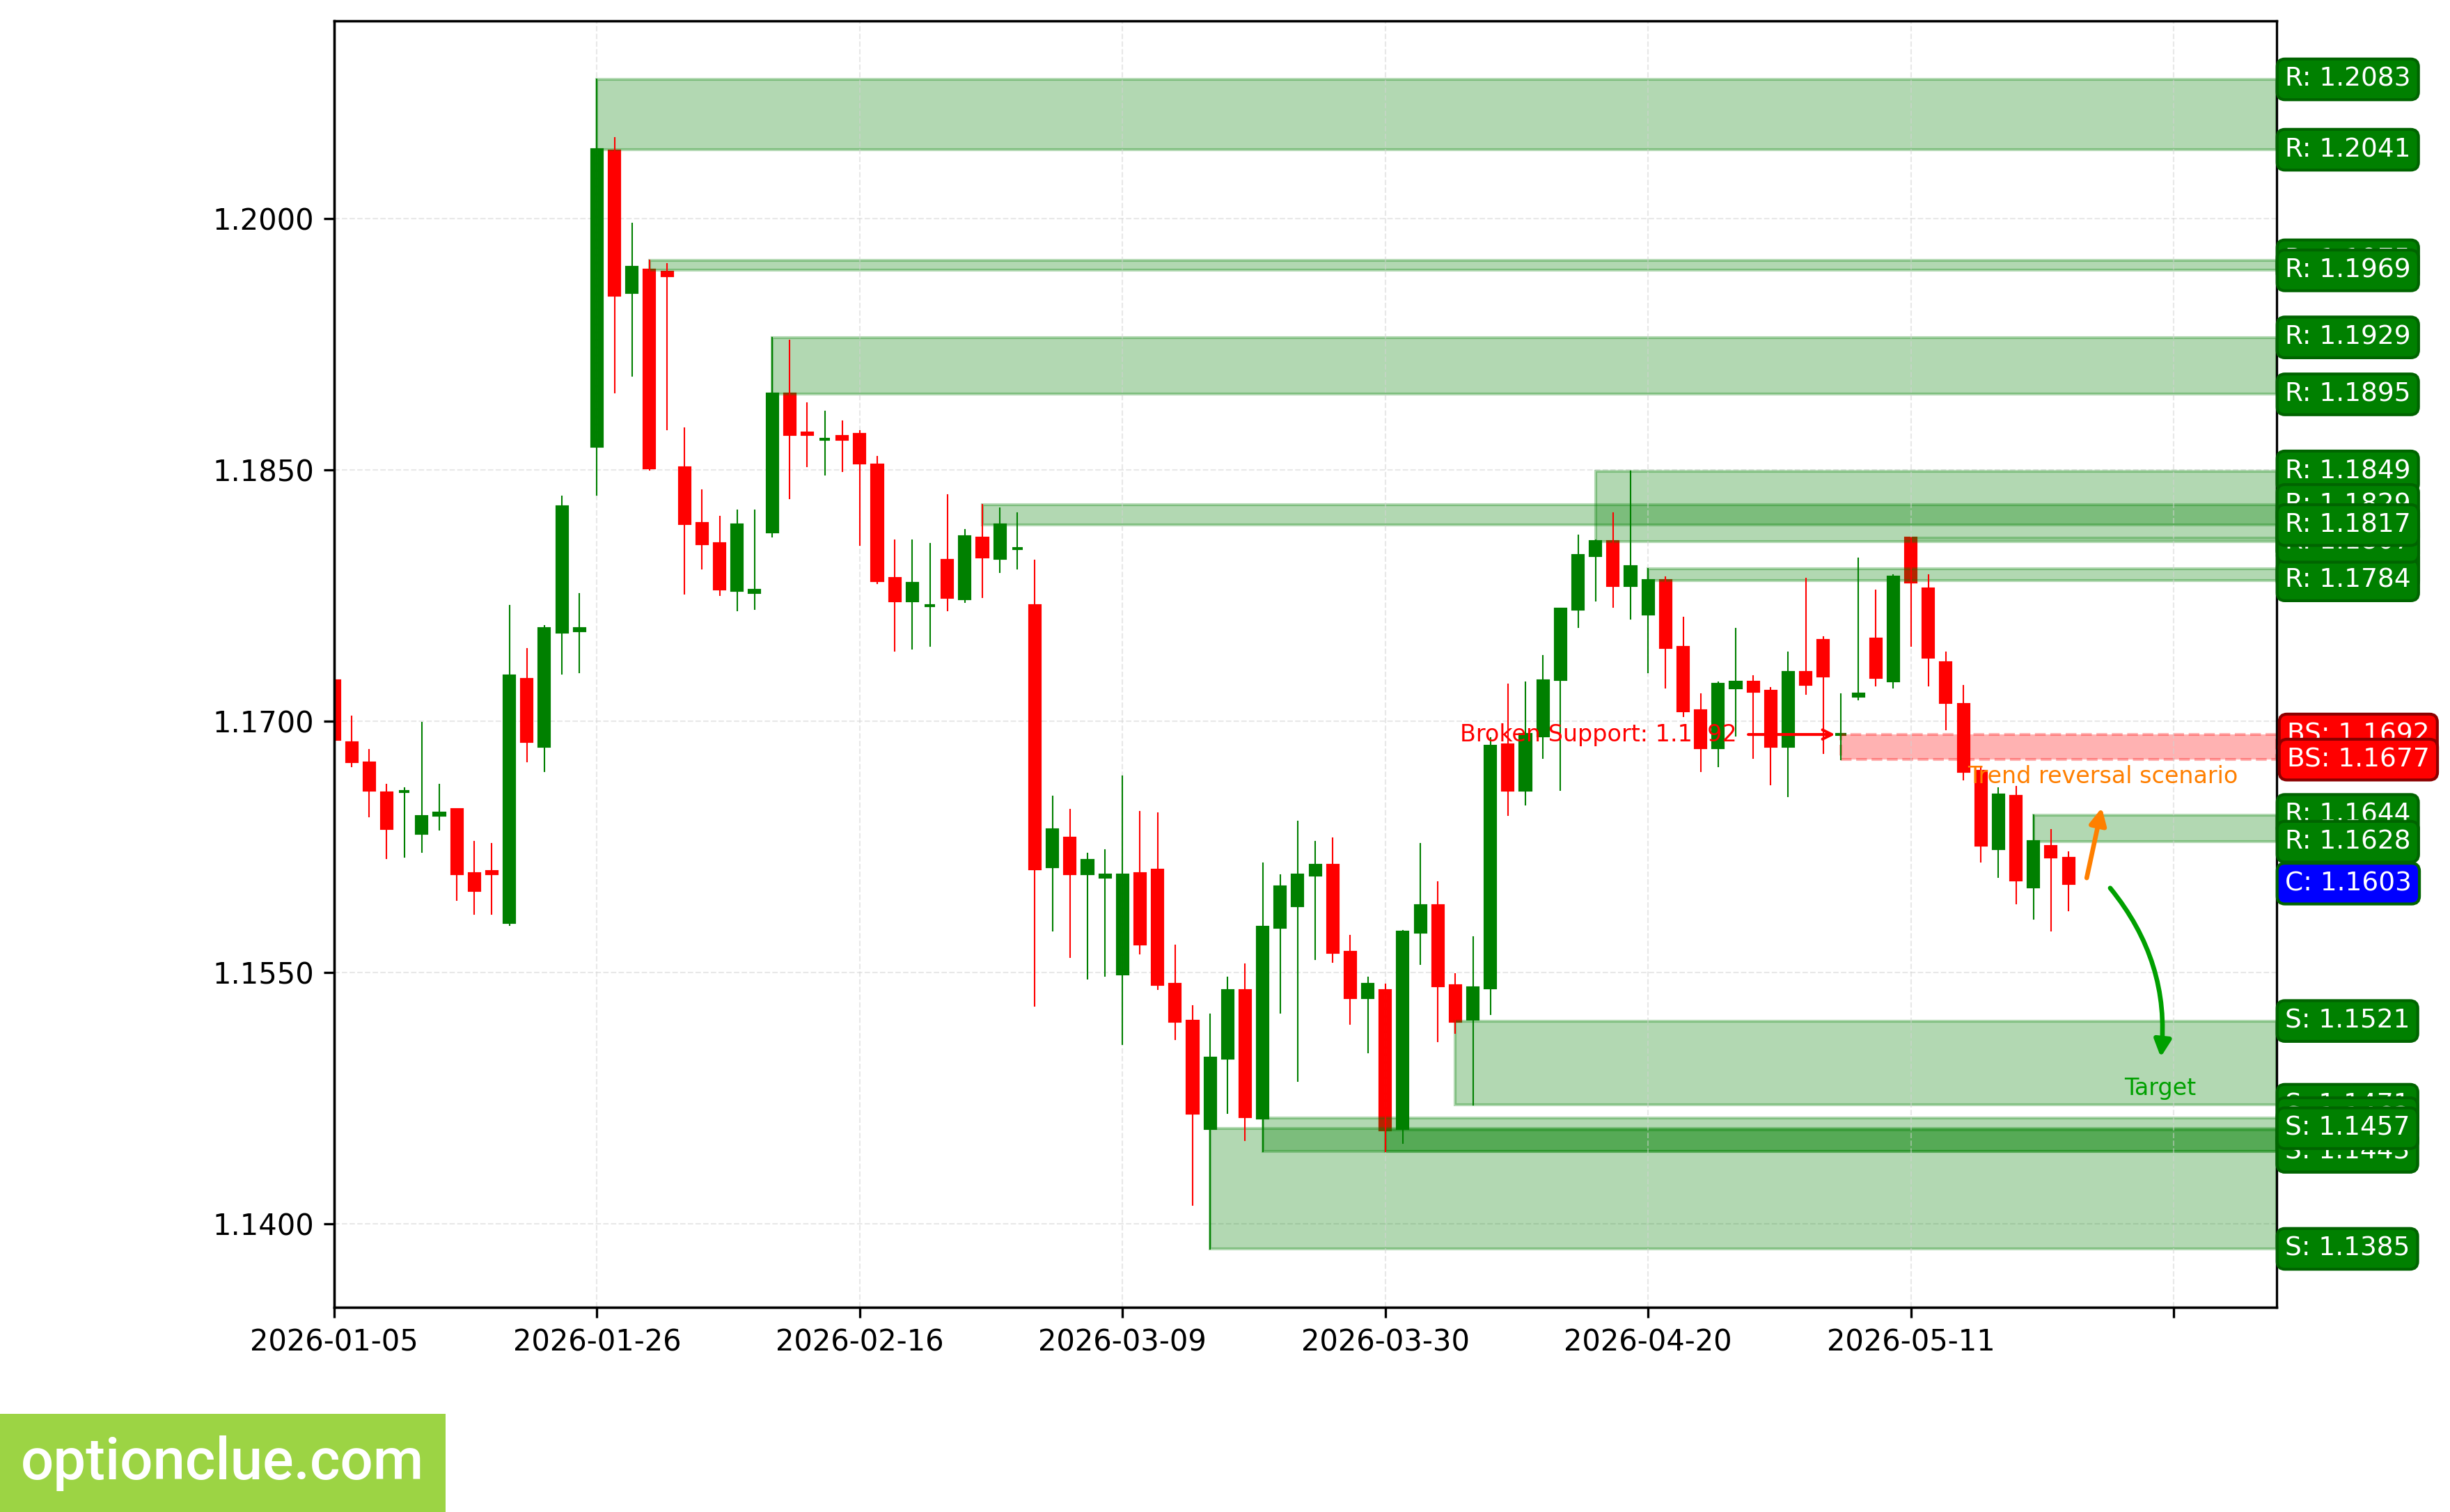
EURUSD. Technical analysis. D1.
British Pound (GBPUSD)
The bearish trend continues; the correction likely ended 2 candles ago, and an impulse wave is currently developing. The last broken level was support (1.3453 — 1.3475). The breakout occurred 7 candles ago.
The intermediate target for the downward movement is the support level with boundaries 1.3302 — 1.3325.
From current prices, the reward/risk ratio when setting targets and fixing risks based on daily timeframe levels may be small (about 0.7:1).
Short positions will remain relevant as long as the market stays below the nearest resistance level with boundaries 1.3436 — 1.3465. If the market successfully consolidates above this nearest resistance, the trend will reverse to bullish.
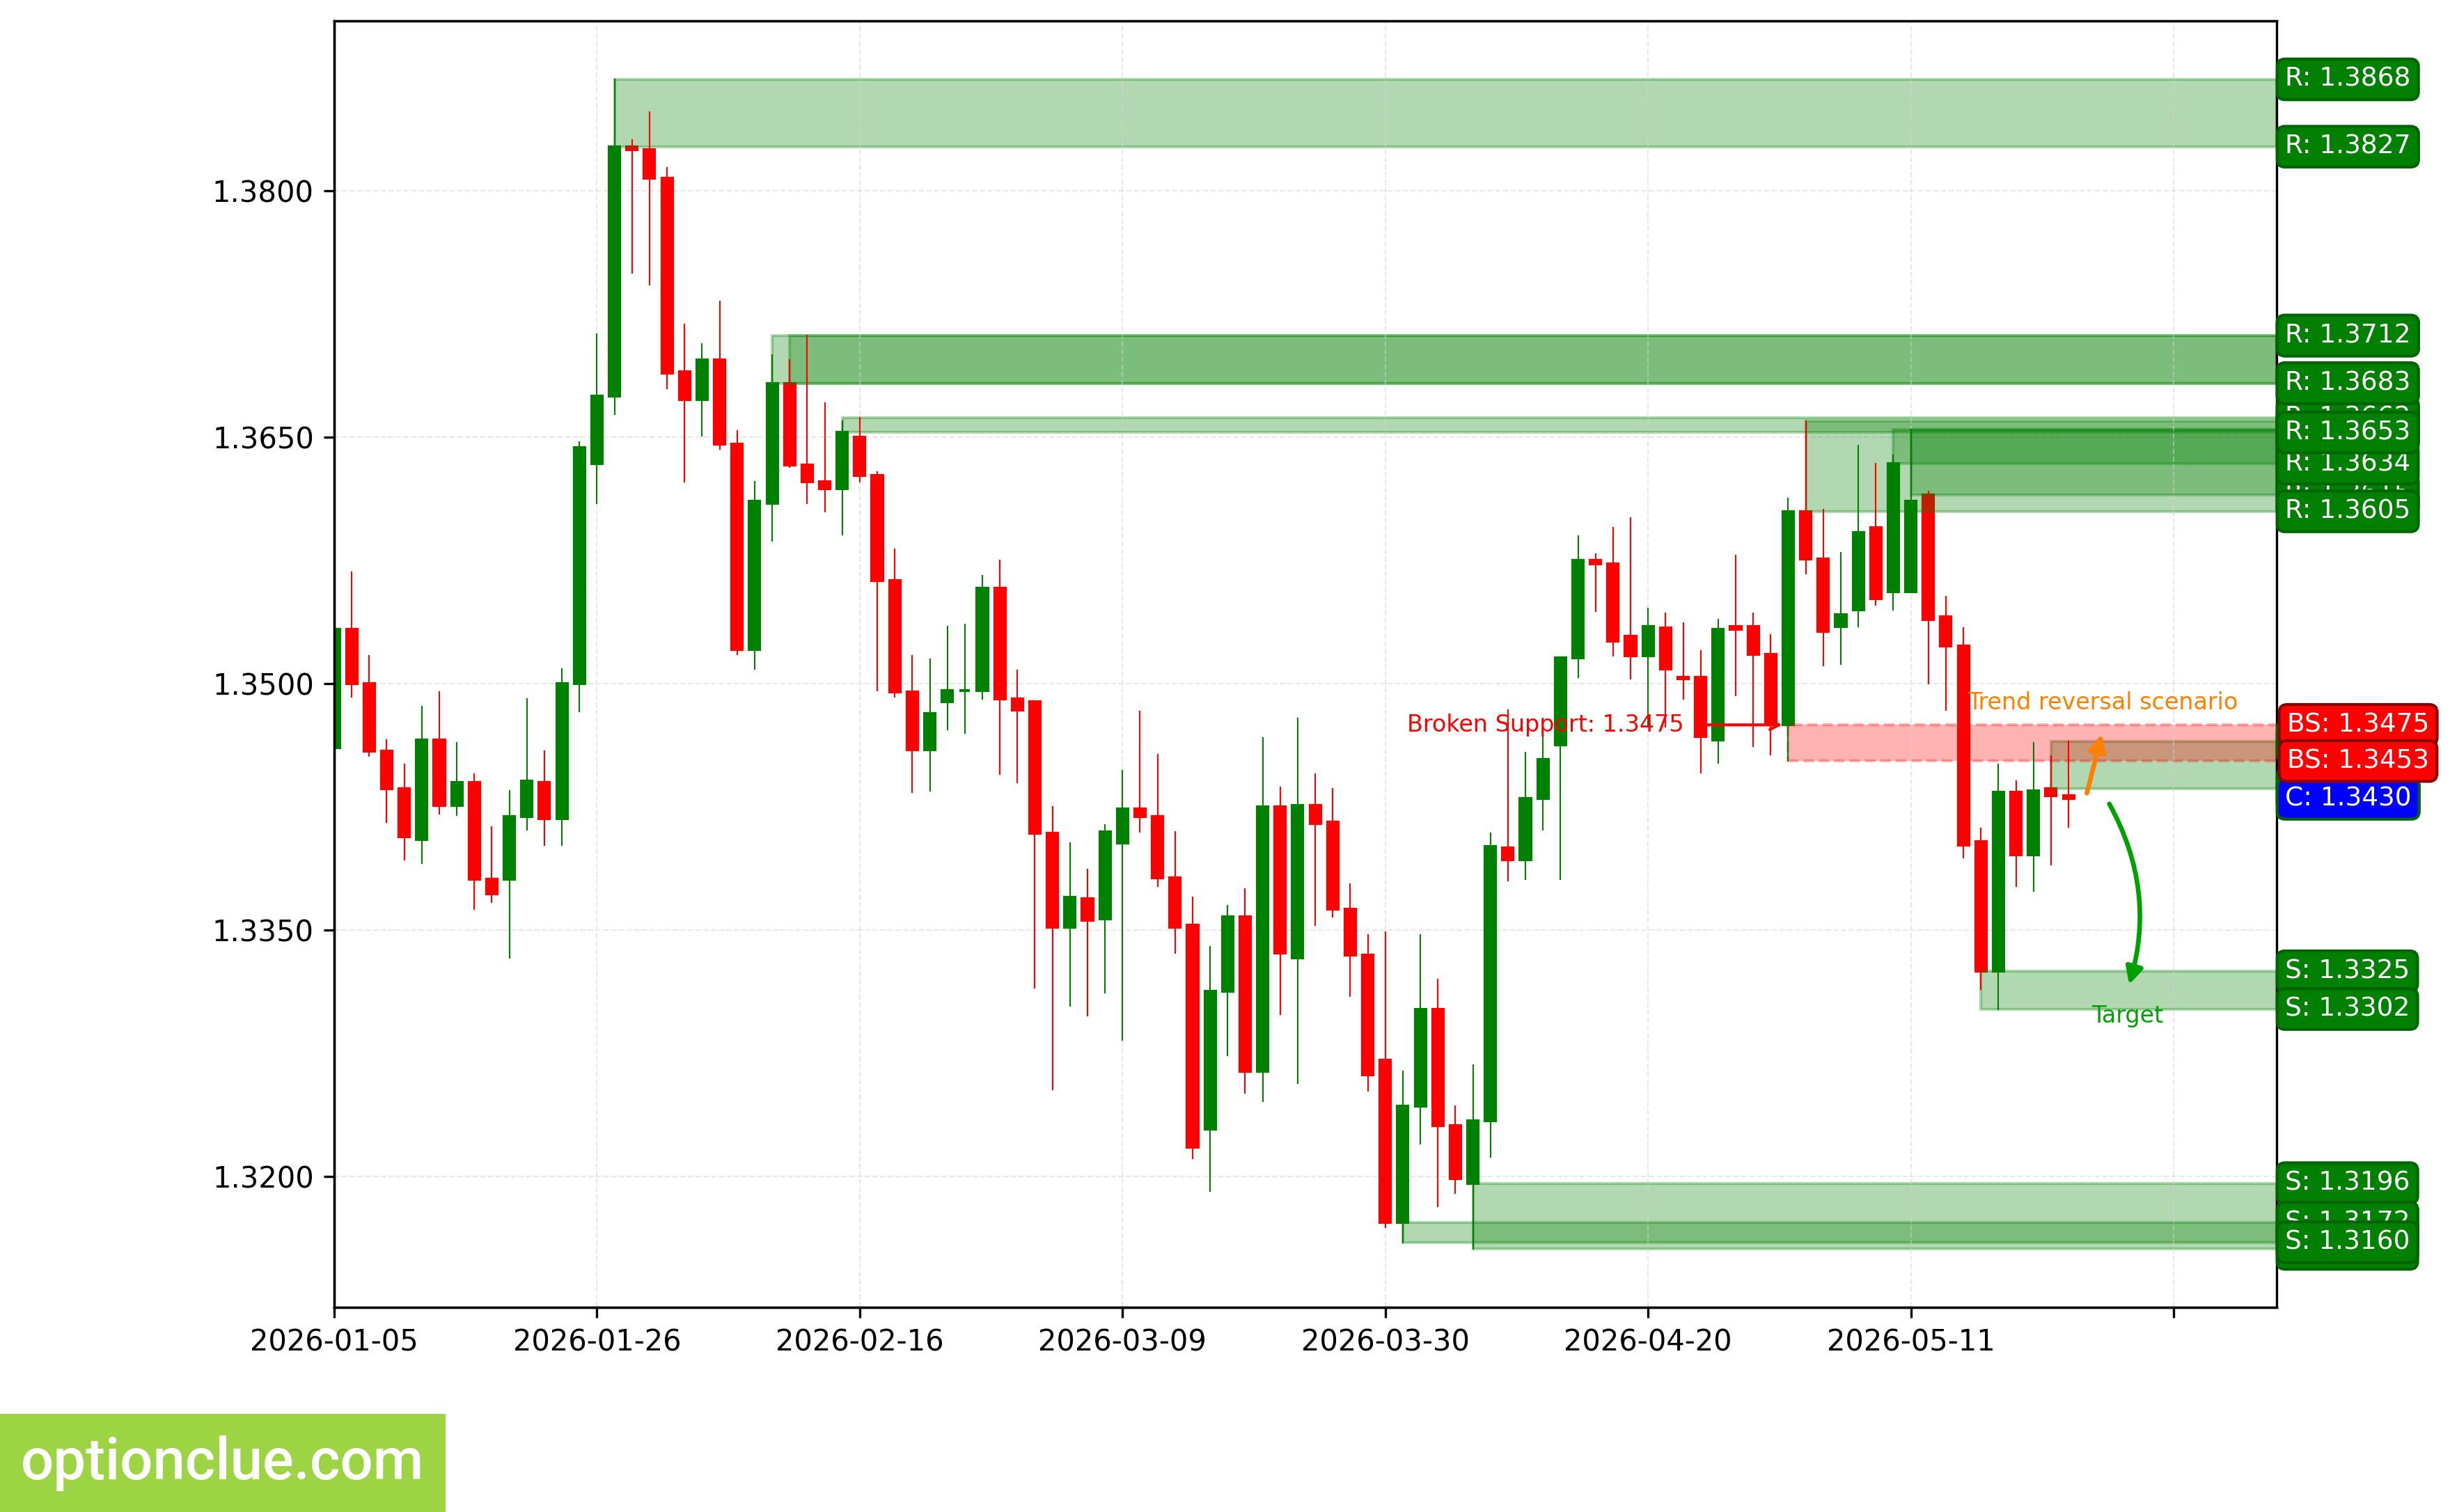
GBPUSD. Technical analysis. D1.
Swiss Franc (USDCHF)
The bullish trend continues; a correction wave is developing. A buy entry point on a rebound may form after the current correction is completed. The last broken level was resistance (0.7839 — 0.7848). The breakout occurred 6 candles ago.
When the upward movement resumes, the first target will be the resistance level with boundaries 0.7892 — 0.7906. In case of a successful trend development, a further target will be at the resistance level with boundaries 0.8010 — 0.8018.
If the correction ends in the area of the support level (0.7760 — 0.7765), then the potential reward/risk ratio may be approximately 2:1. If the further target is chosen, it is about 4:1.
Long positions will remain relevant as long as the market stays above the nearest daily timeframe support level with boundaries 0.7760 — 0.7765. If the market successfully consolidates below this support, the trend will reverse to bearish.
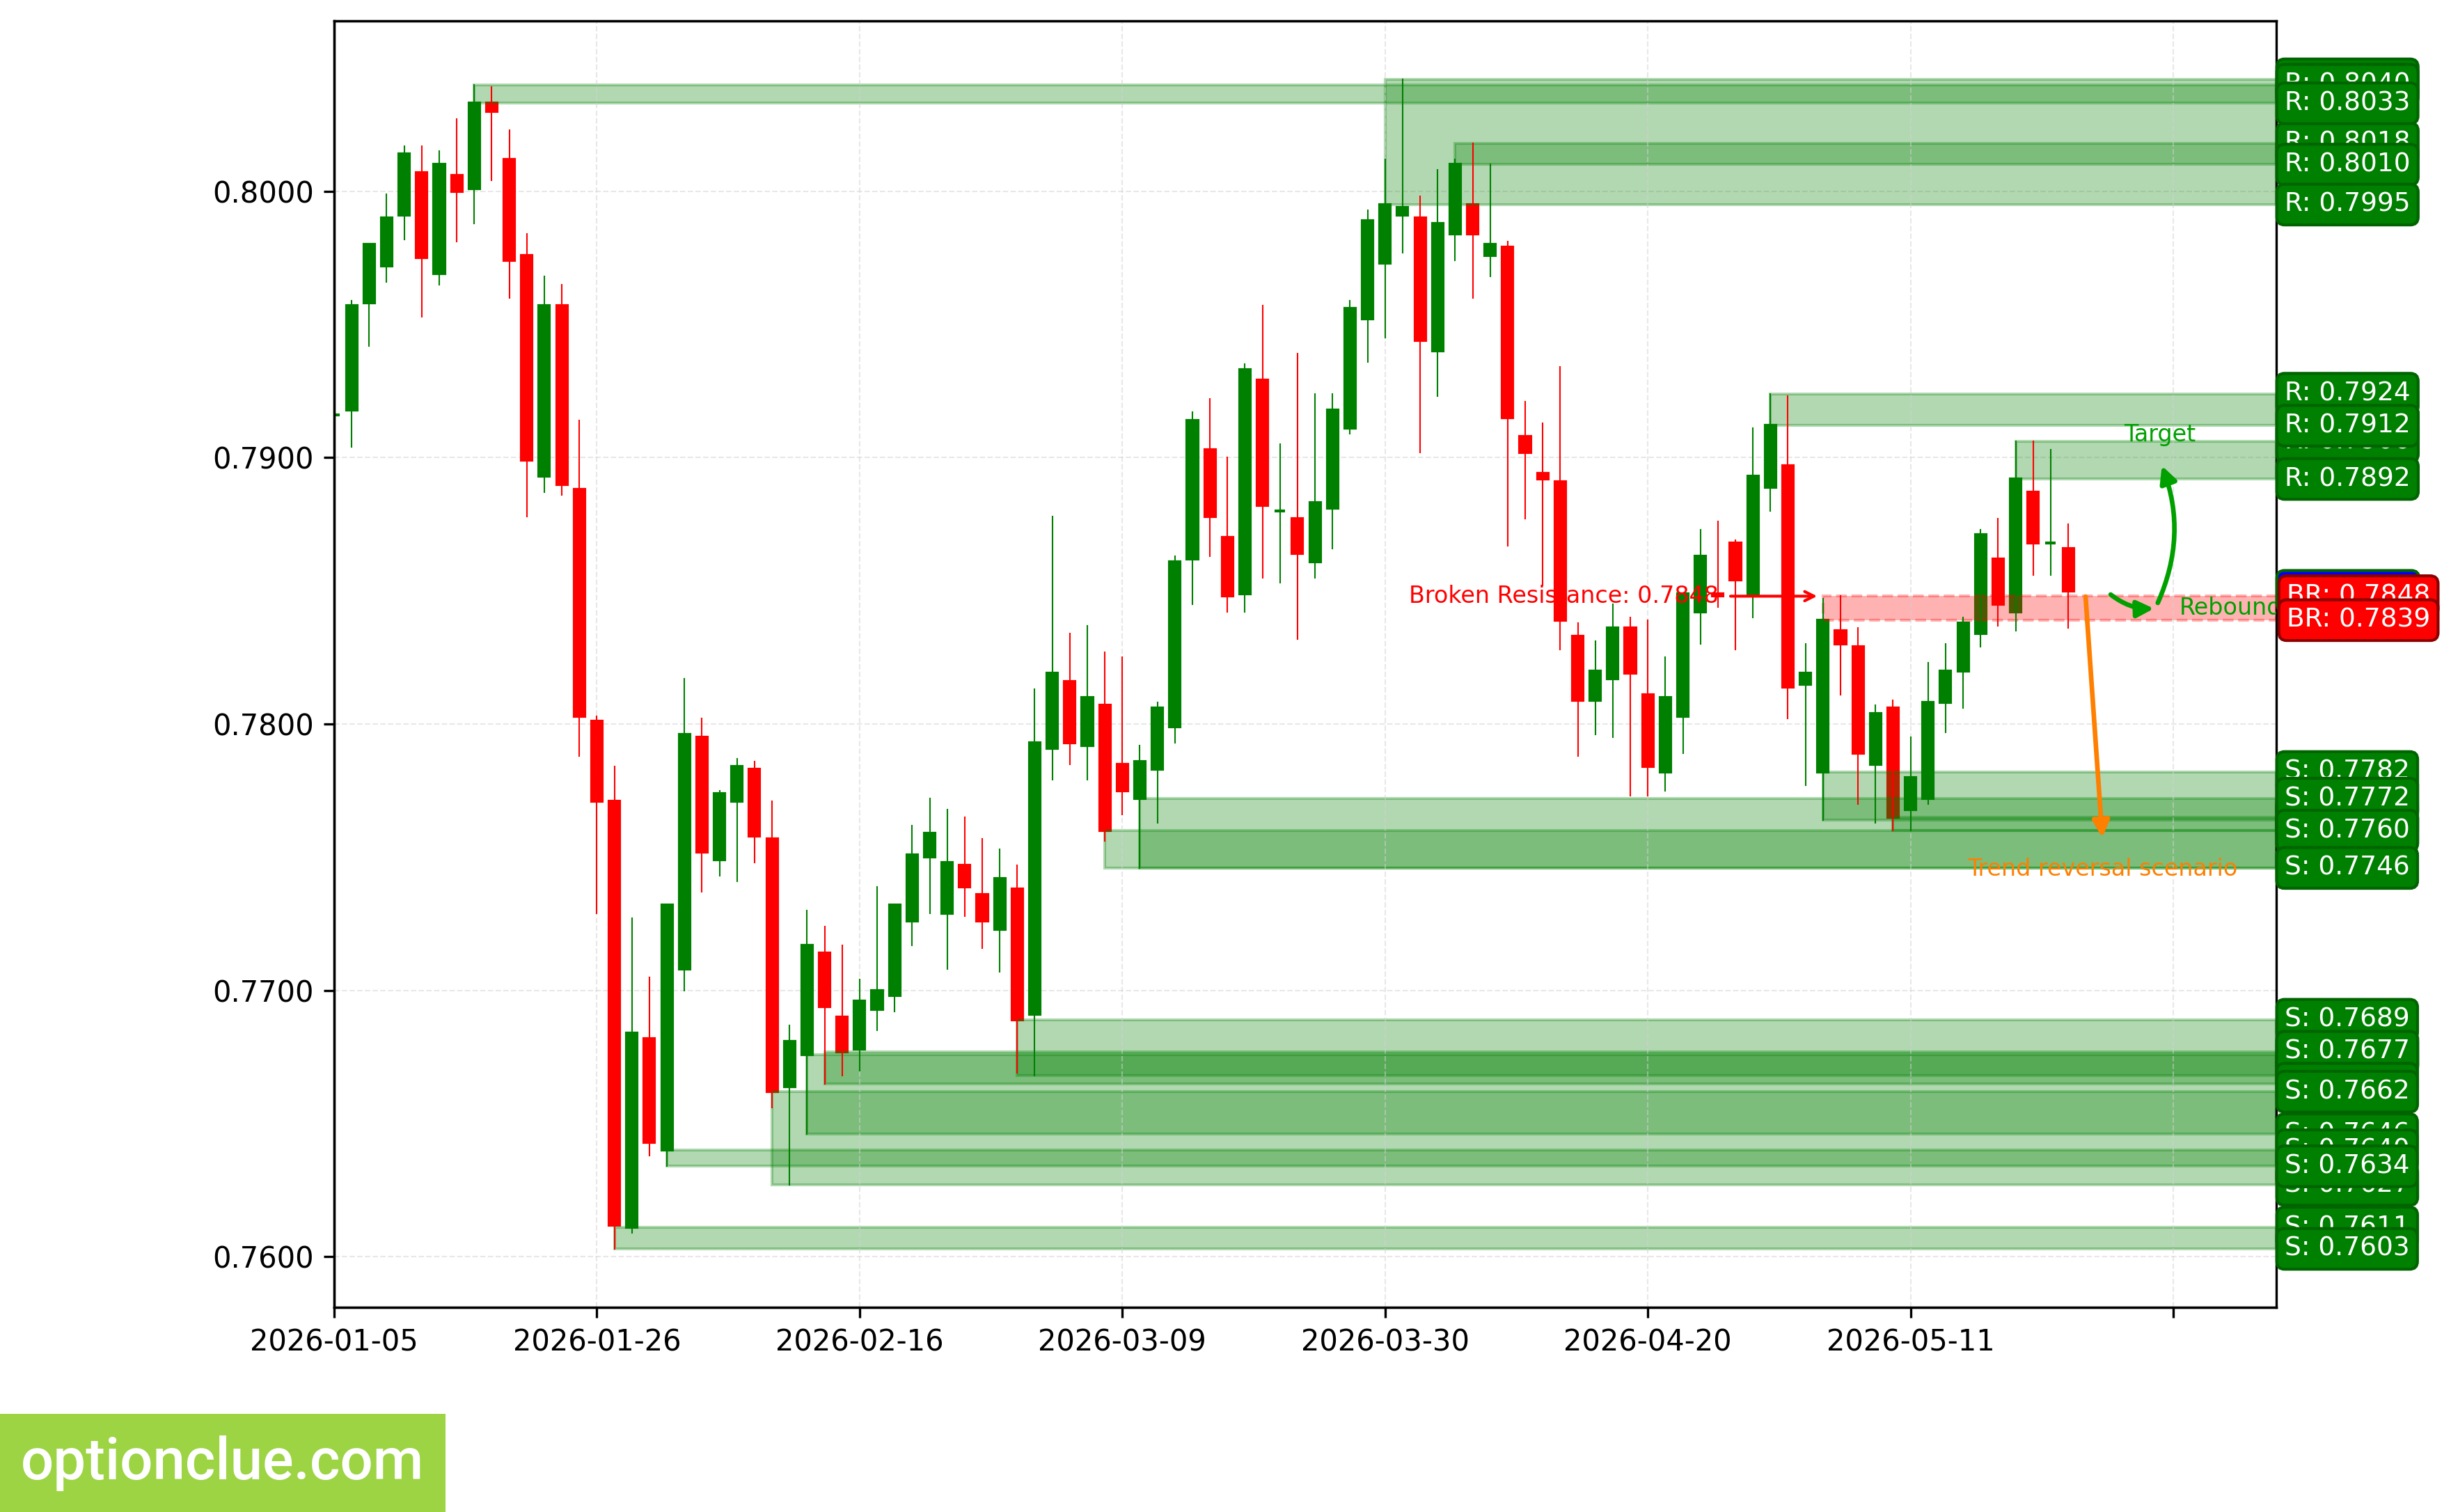
USDCHF. Technical analysis. D1.
Japanese Yen (USDJPY)
The bullish trend continues; an impulse wave is developing. The last broken level was resistance (157.68 — 157.89). The breakout occurred 7 candles ago. New buy entry points on a rebound may appear after a correction forms.
The intermediate target for the upward movement is the resistance level with boundaries 160.20 — 160.72.
The potential reward/risk ratio from current prices when setting targets and fixing risks based on daily timeframe levels may be small (about 0.2:1). If a new correction ends in the area of the support level (156.00 — 156.38), then the potential reward/risk ratio may be about 3:1. If the next correction ends in the area of the last broken level (157.68 — 157.89), then the potential reward/risk ratio may be small (approximately 0.9:1).
Long positions will remain relevant as long as the market stays above the nearest daily timeframe support level with boundaries 156.00 — 156.38. If the market successfully consolidates below this support, the trend will reverse to bearish.
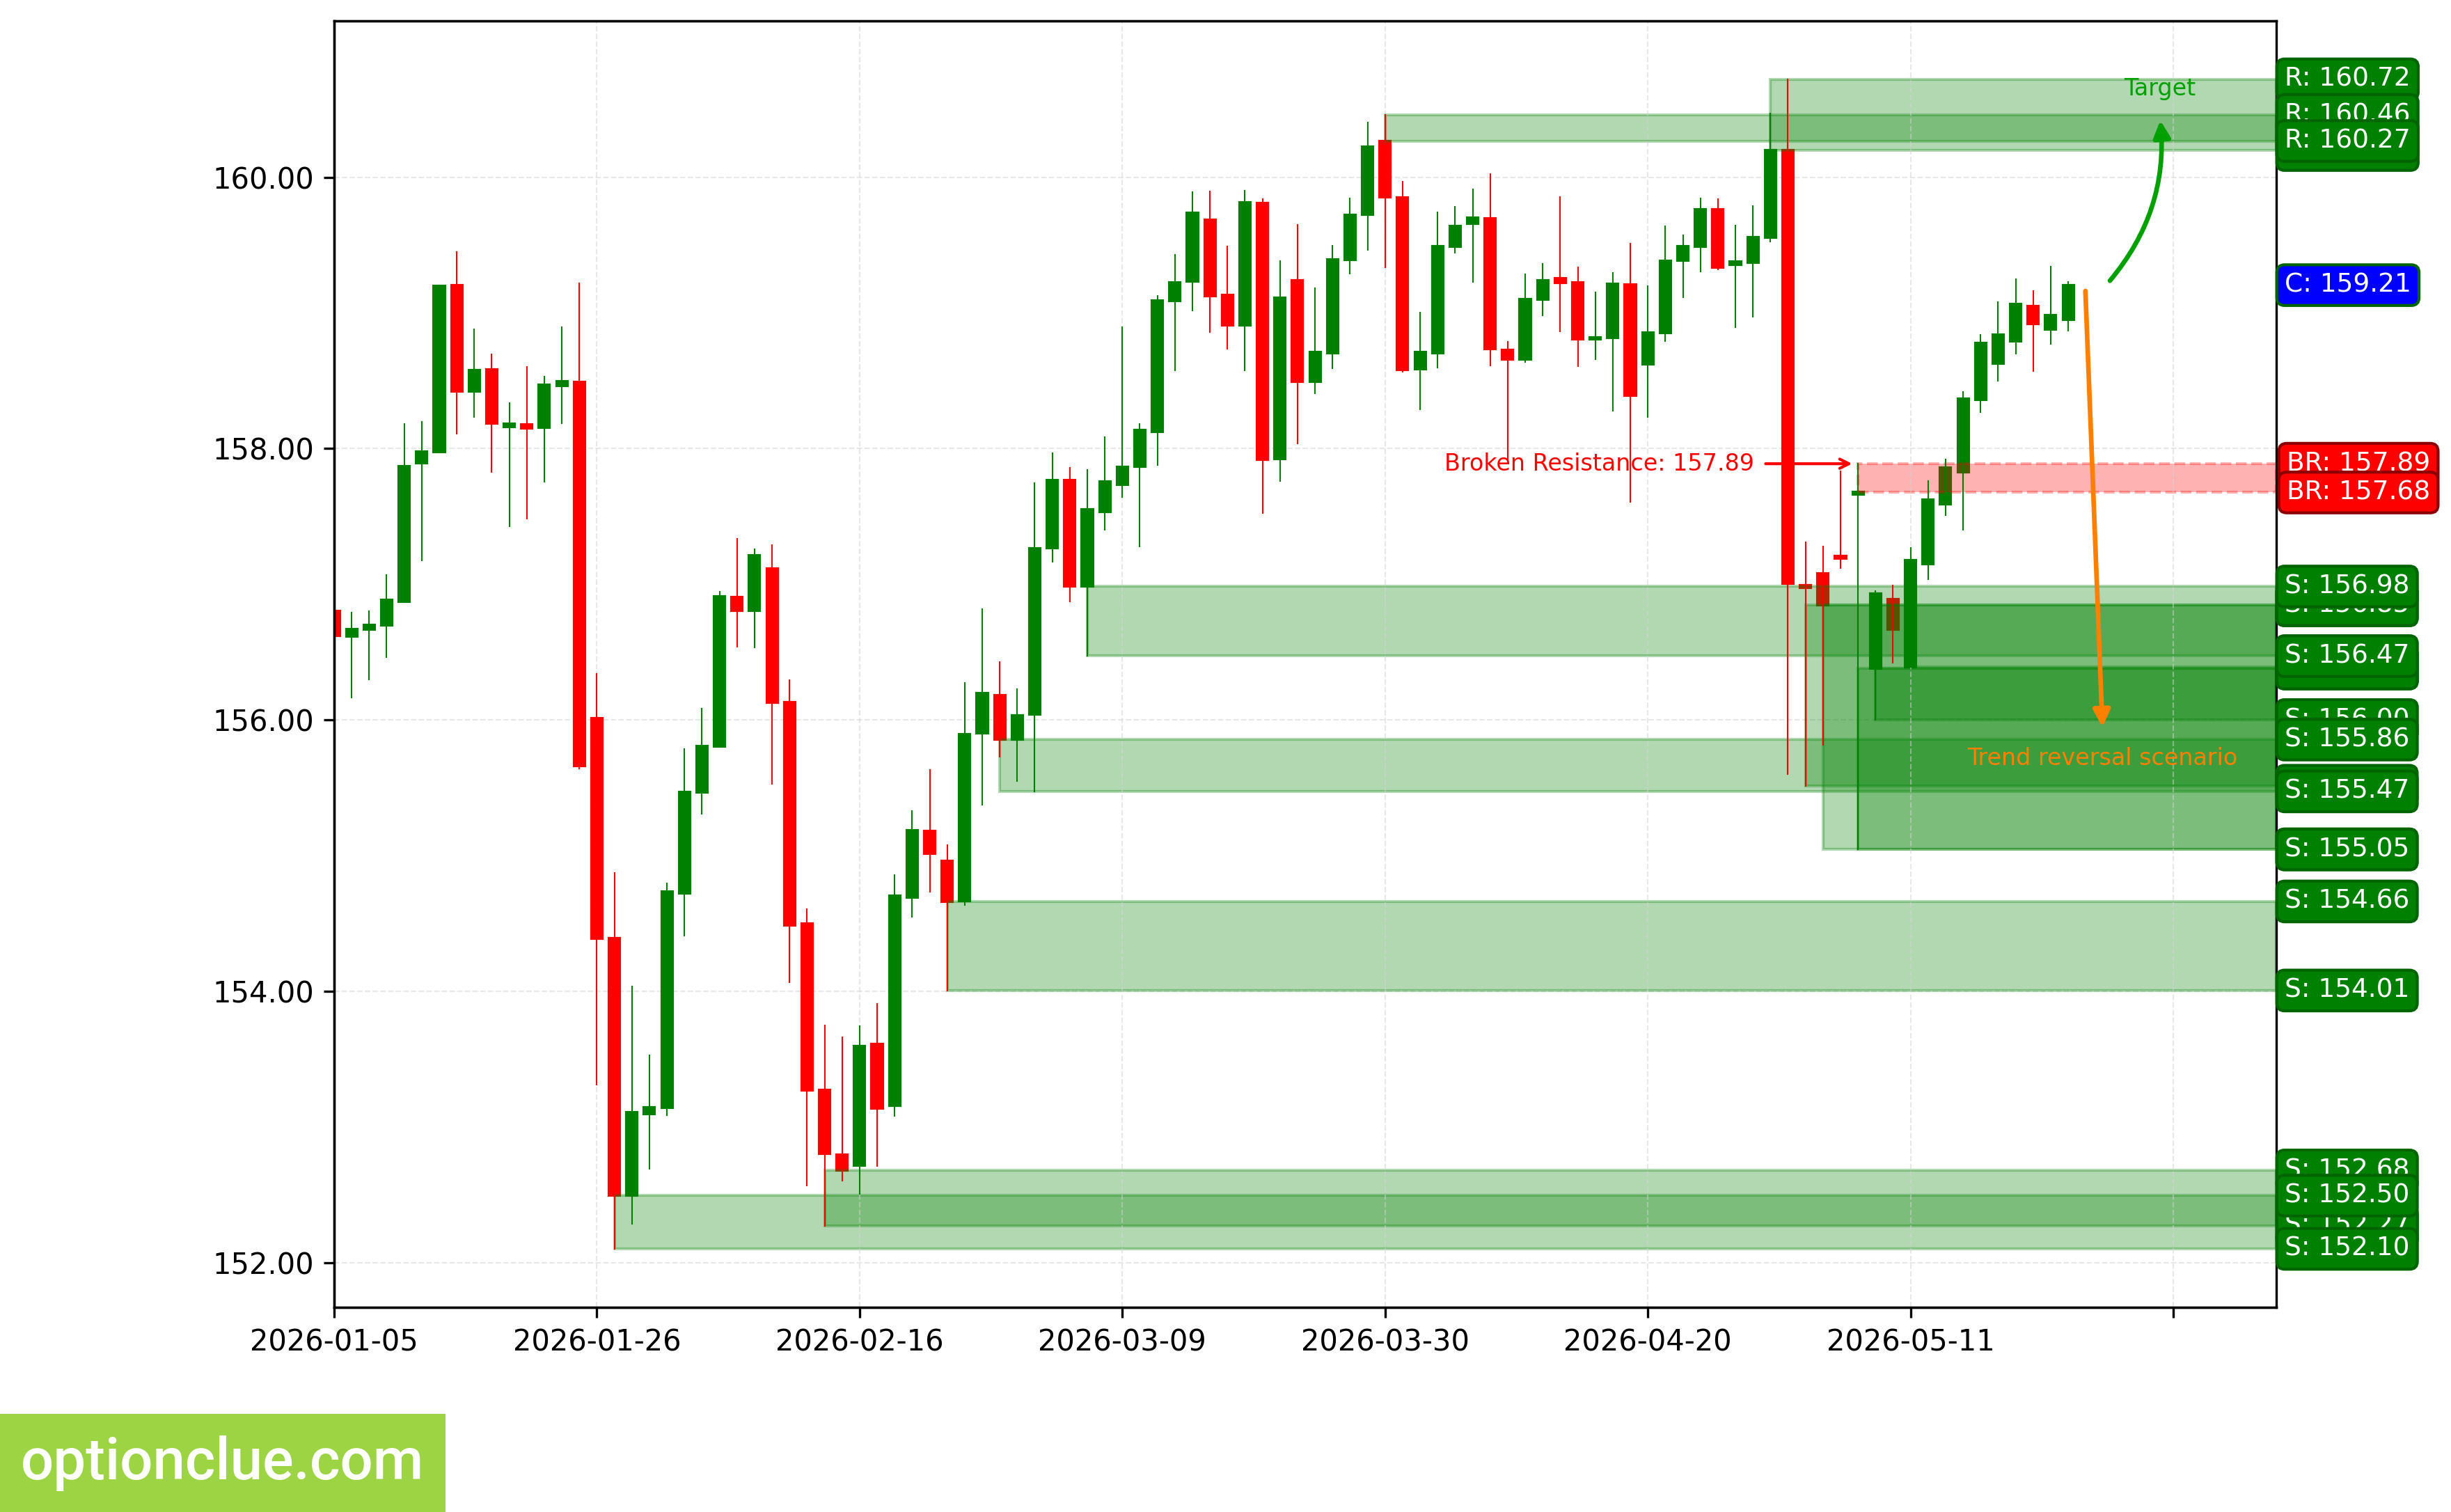
USDJPY. Technical analysis. D1.
Canadian Dollar (USDCAD)
The bullish trend continues; the correction ended 4 candles ago, and an impulse wave is developing. The last broken level was resistance (1.3700 — 1.3714). The breakout occurred 7 candles ago.
The intermediate target for the upward movement is the resistance level with boundaries 1.3849 — 1.3877. In case of a successful trend development, a further target will be at the resistance level with boundaries 1.3947 — 1.3949.
The potential reward/risk ratio from current prices when setting targets and fixing risks based on daily timeframe levels may be small (about 0.1:1). When using the further target, it is also small (approximately 0.4:1).
Long positions will remain relevant as long as the market stays above the nearest support level with boundaries 1.3548 — 1.3580. If the market successfully consolidates below this nearest support, the trend will reverse to bearish.
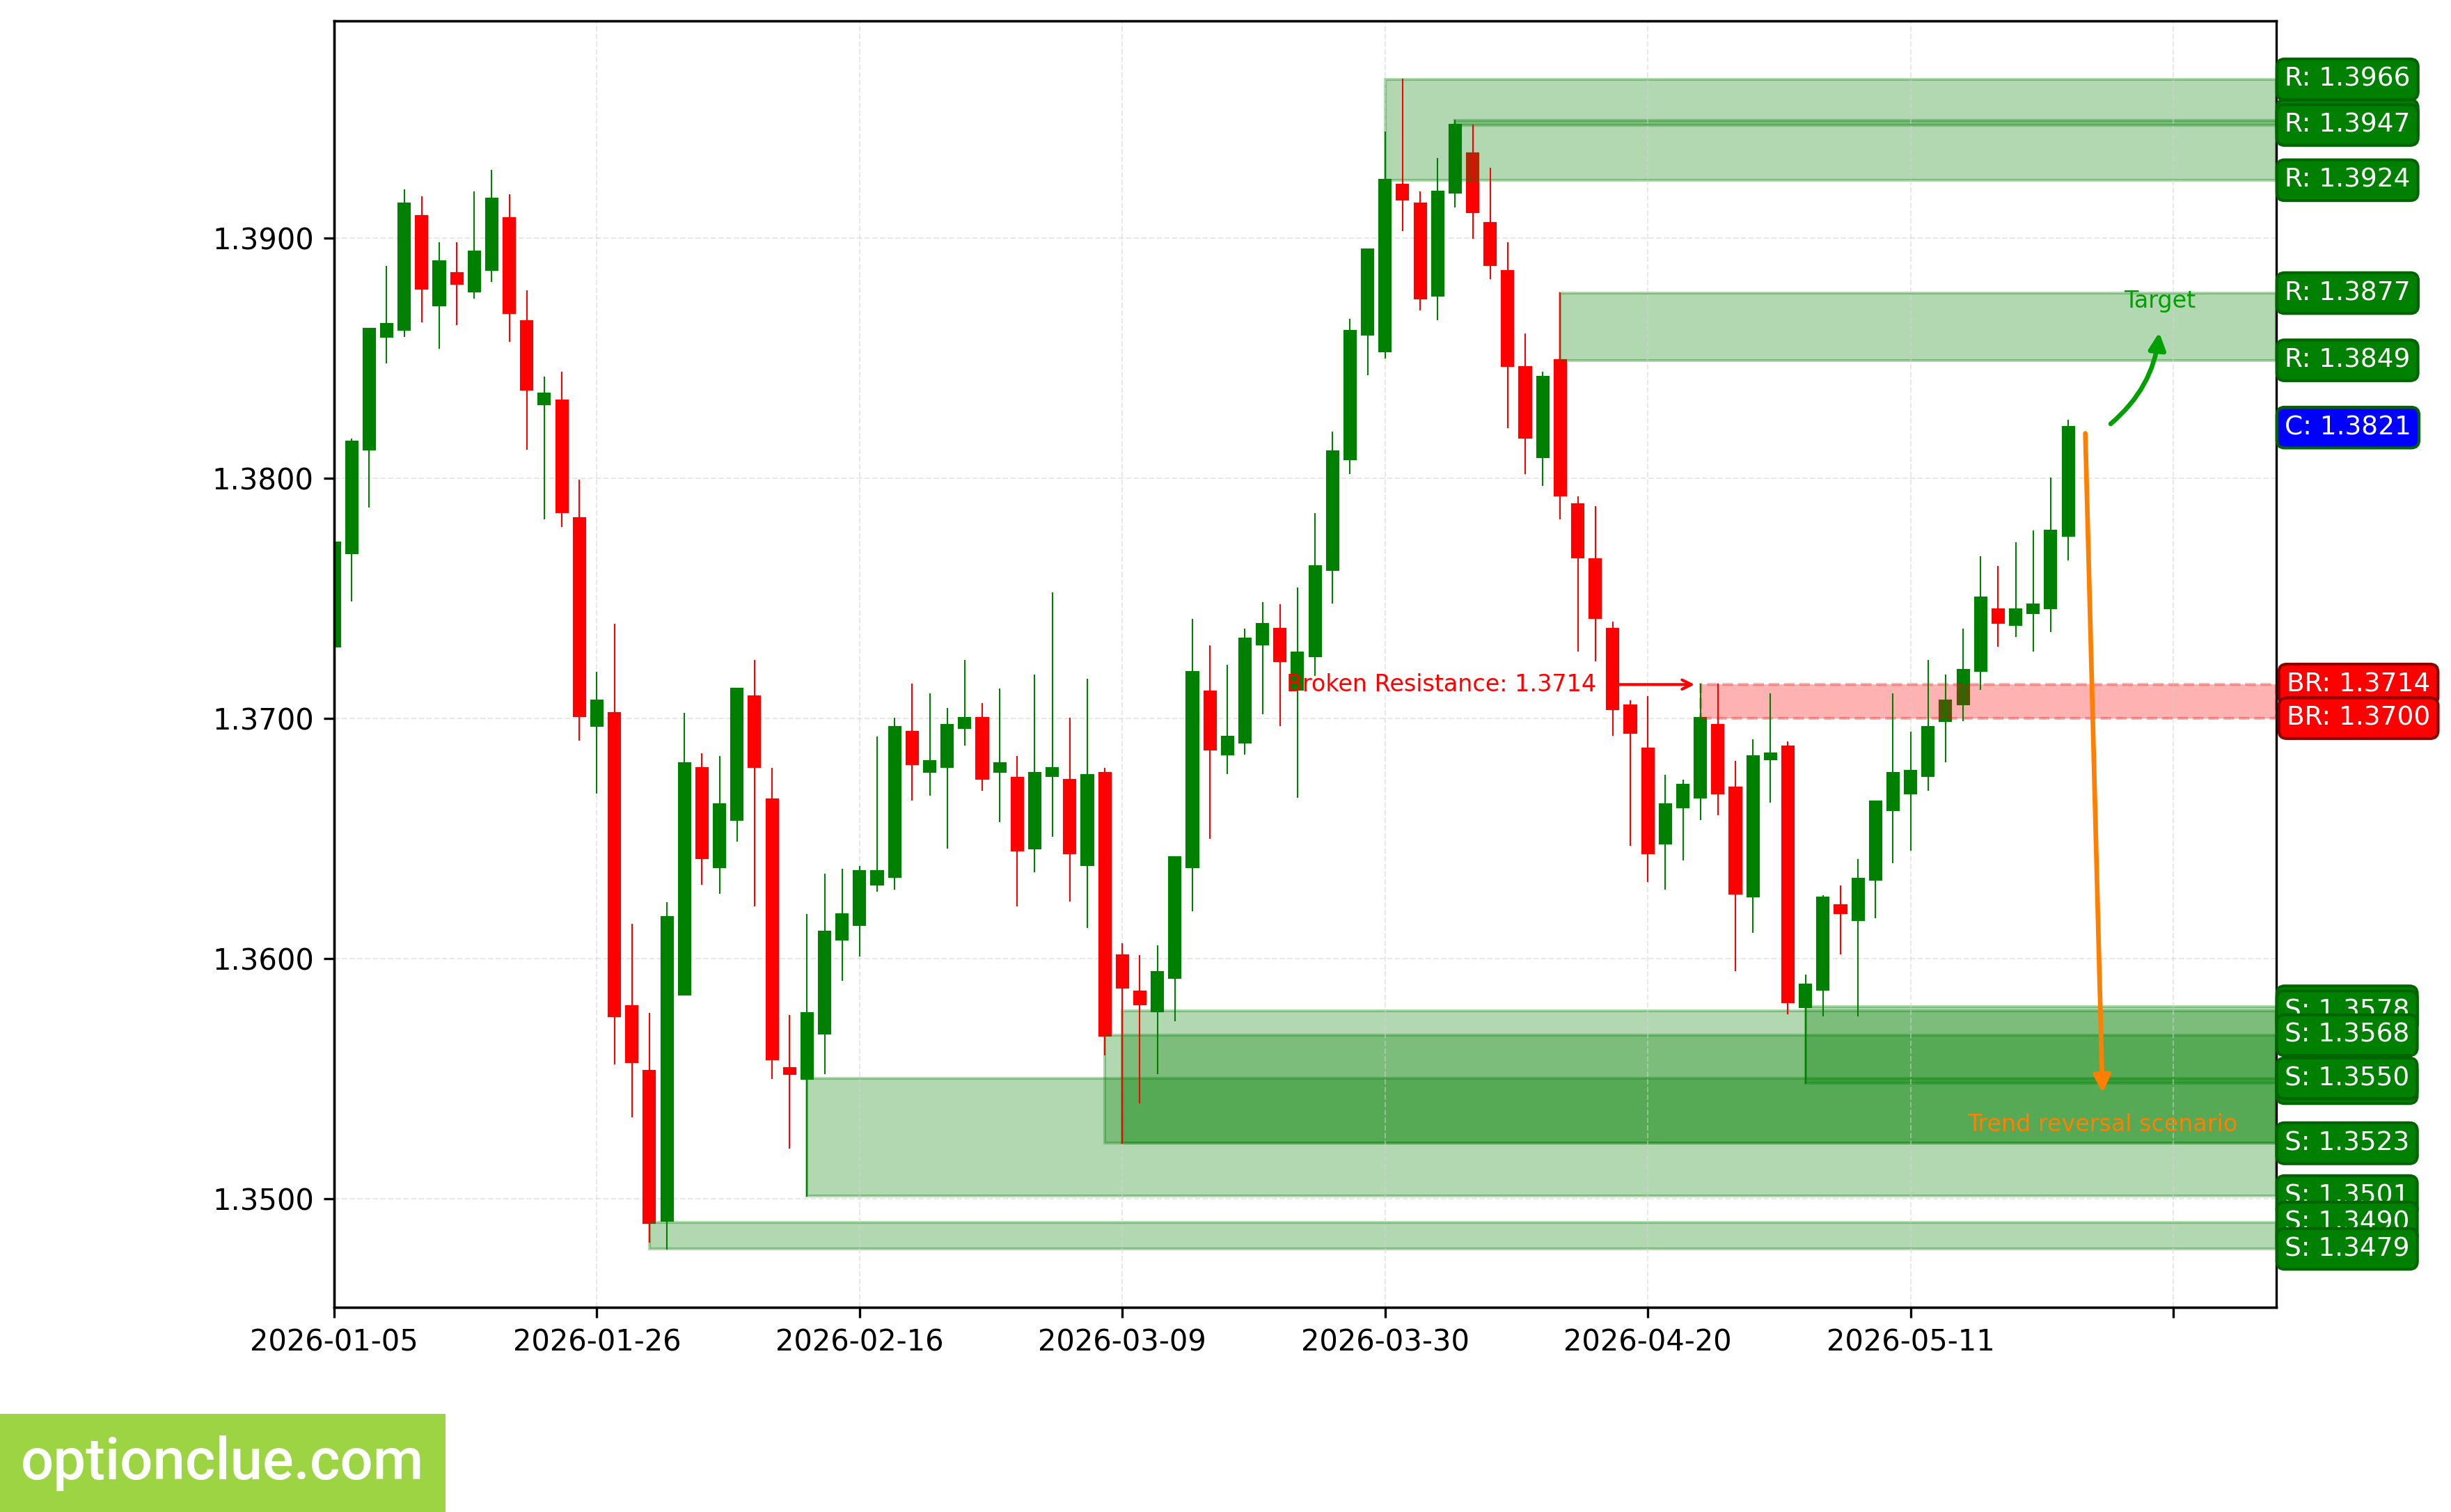
USDCAD. Technical analysis. D1.
Australian Dollar (AUDUSD)
The trend changed to bearish when the support level (0.7134 — 0.7167) was broken last week. The correction likely ended 2 candles ago, and an impulse wave is currently developing. The intermediate target for the downward movement is the support level with boundaries 0.7107 — 0.7114.
In case of a successful trend development, a further target will be at the support level with boundaries 0.6983 — 0.7018. From current prices, the reward/risk ratio is approximately 0.1:1.
When using the further target, it is also negligible (about 0.9:1).
Short positions will remain relevant as long as the market stays below the nearest resistance level with boundaries 0.7152 — 0.7174. If the market successfully consolidates above this nearest resistance, the trend will reverse to bullish.
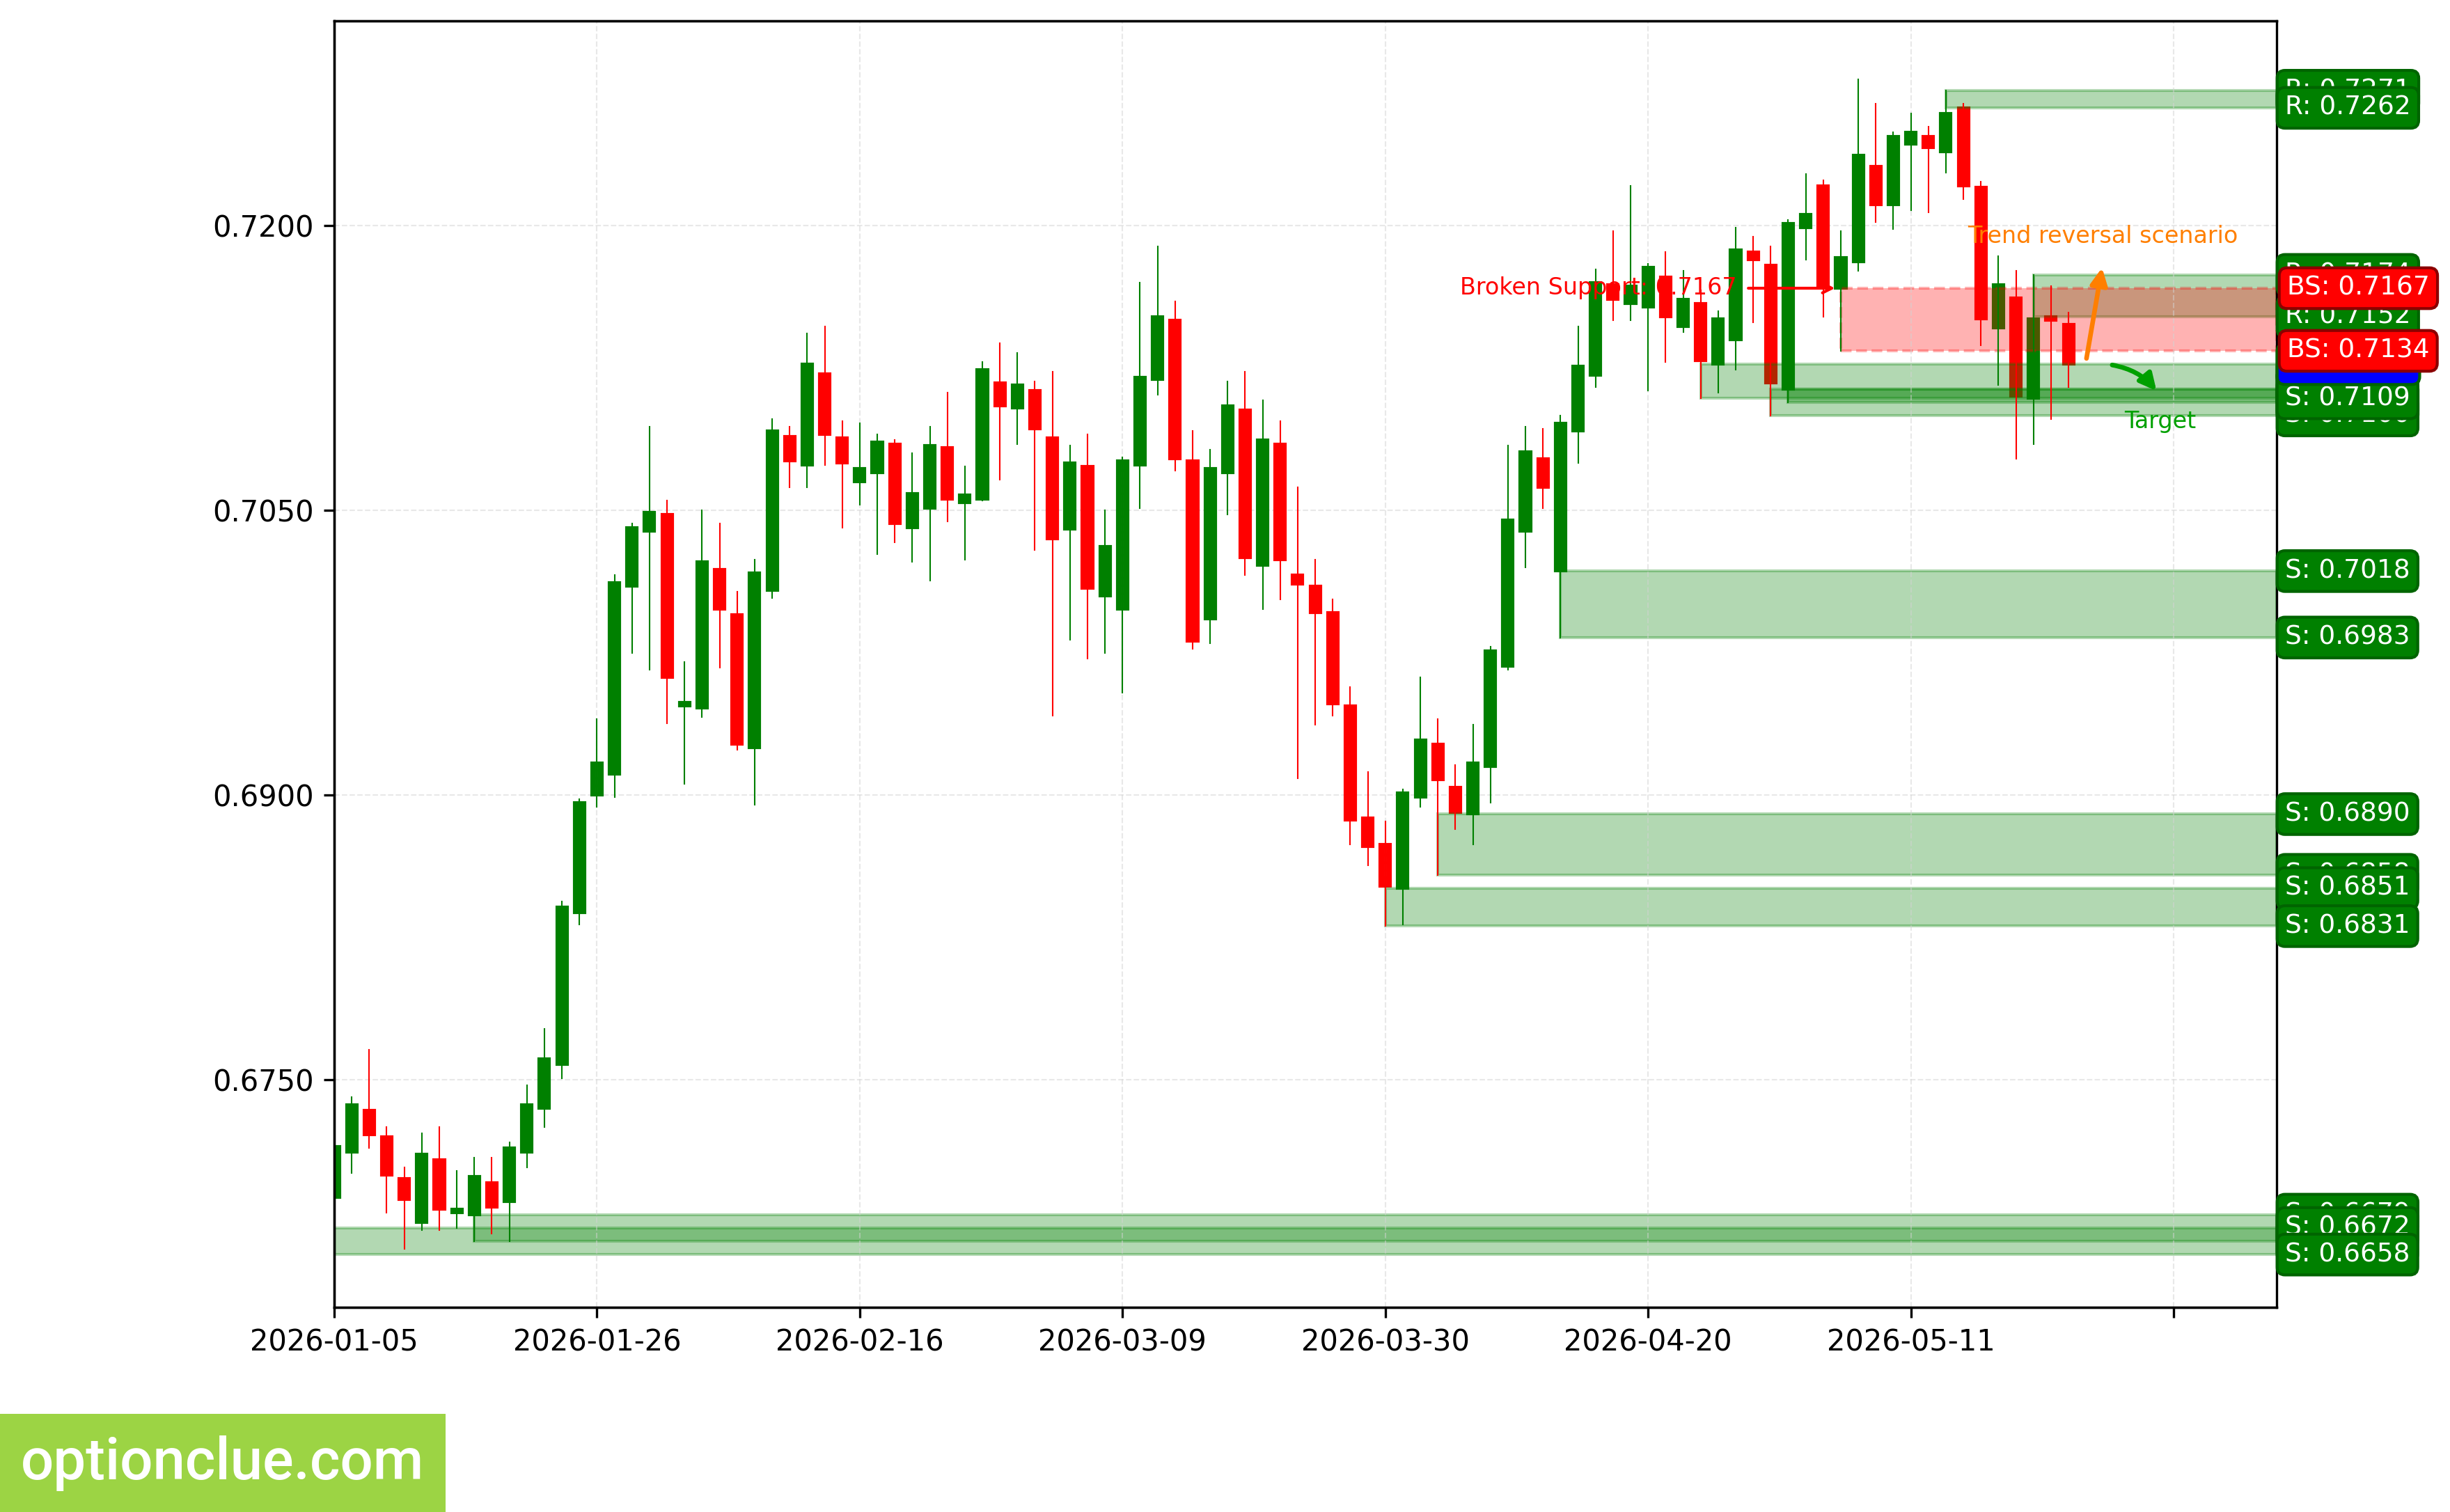
AUDUSD. Technical analysis. D1.
Bitcoin (BTC)
The bearish trend continues; a correction wave is developing. The last broken level was support (76029 — 76749). The breakout occurred 2 candles ago, and the price returned to this last broken level. A sell entry point on a rebound may form after the current correction is completed.
When the downward movement resumes, the first target will be the support level with boundaries 74959 — 75776. In case of a successful trend development, a further target will be at the support level with boundaries 70541 — 70753.
The potential reward/risk ratio from current prices when setting targets and fixing risks based on daily timeframe levels may be small (about 0.1:1). When using a further target, it is also negligible (about 0.8:1). If the correction ends in the area of the resistance level (81051 — 82006), then the potential reward/risk ratio may be approximately 2:1. For the further target, it is about 4:1.
Short positions will remain relevant as long as the market stays below the nearest resistance level with boundaries 81051 — 82006. If the market successfully consolidates above this nearest resistance, the trend will reverse to bullish.
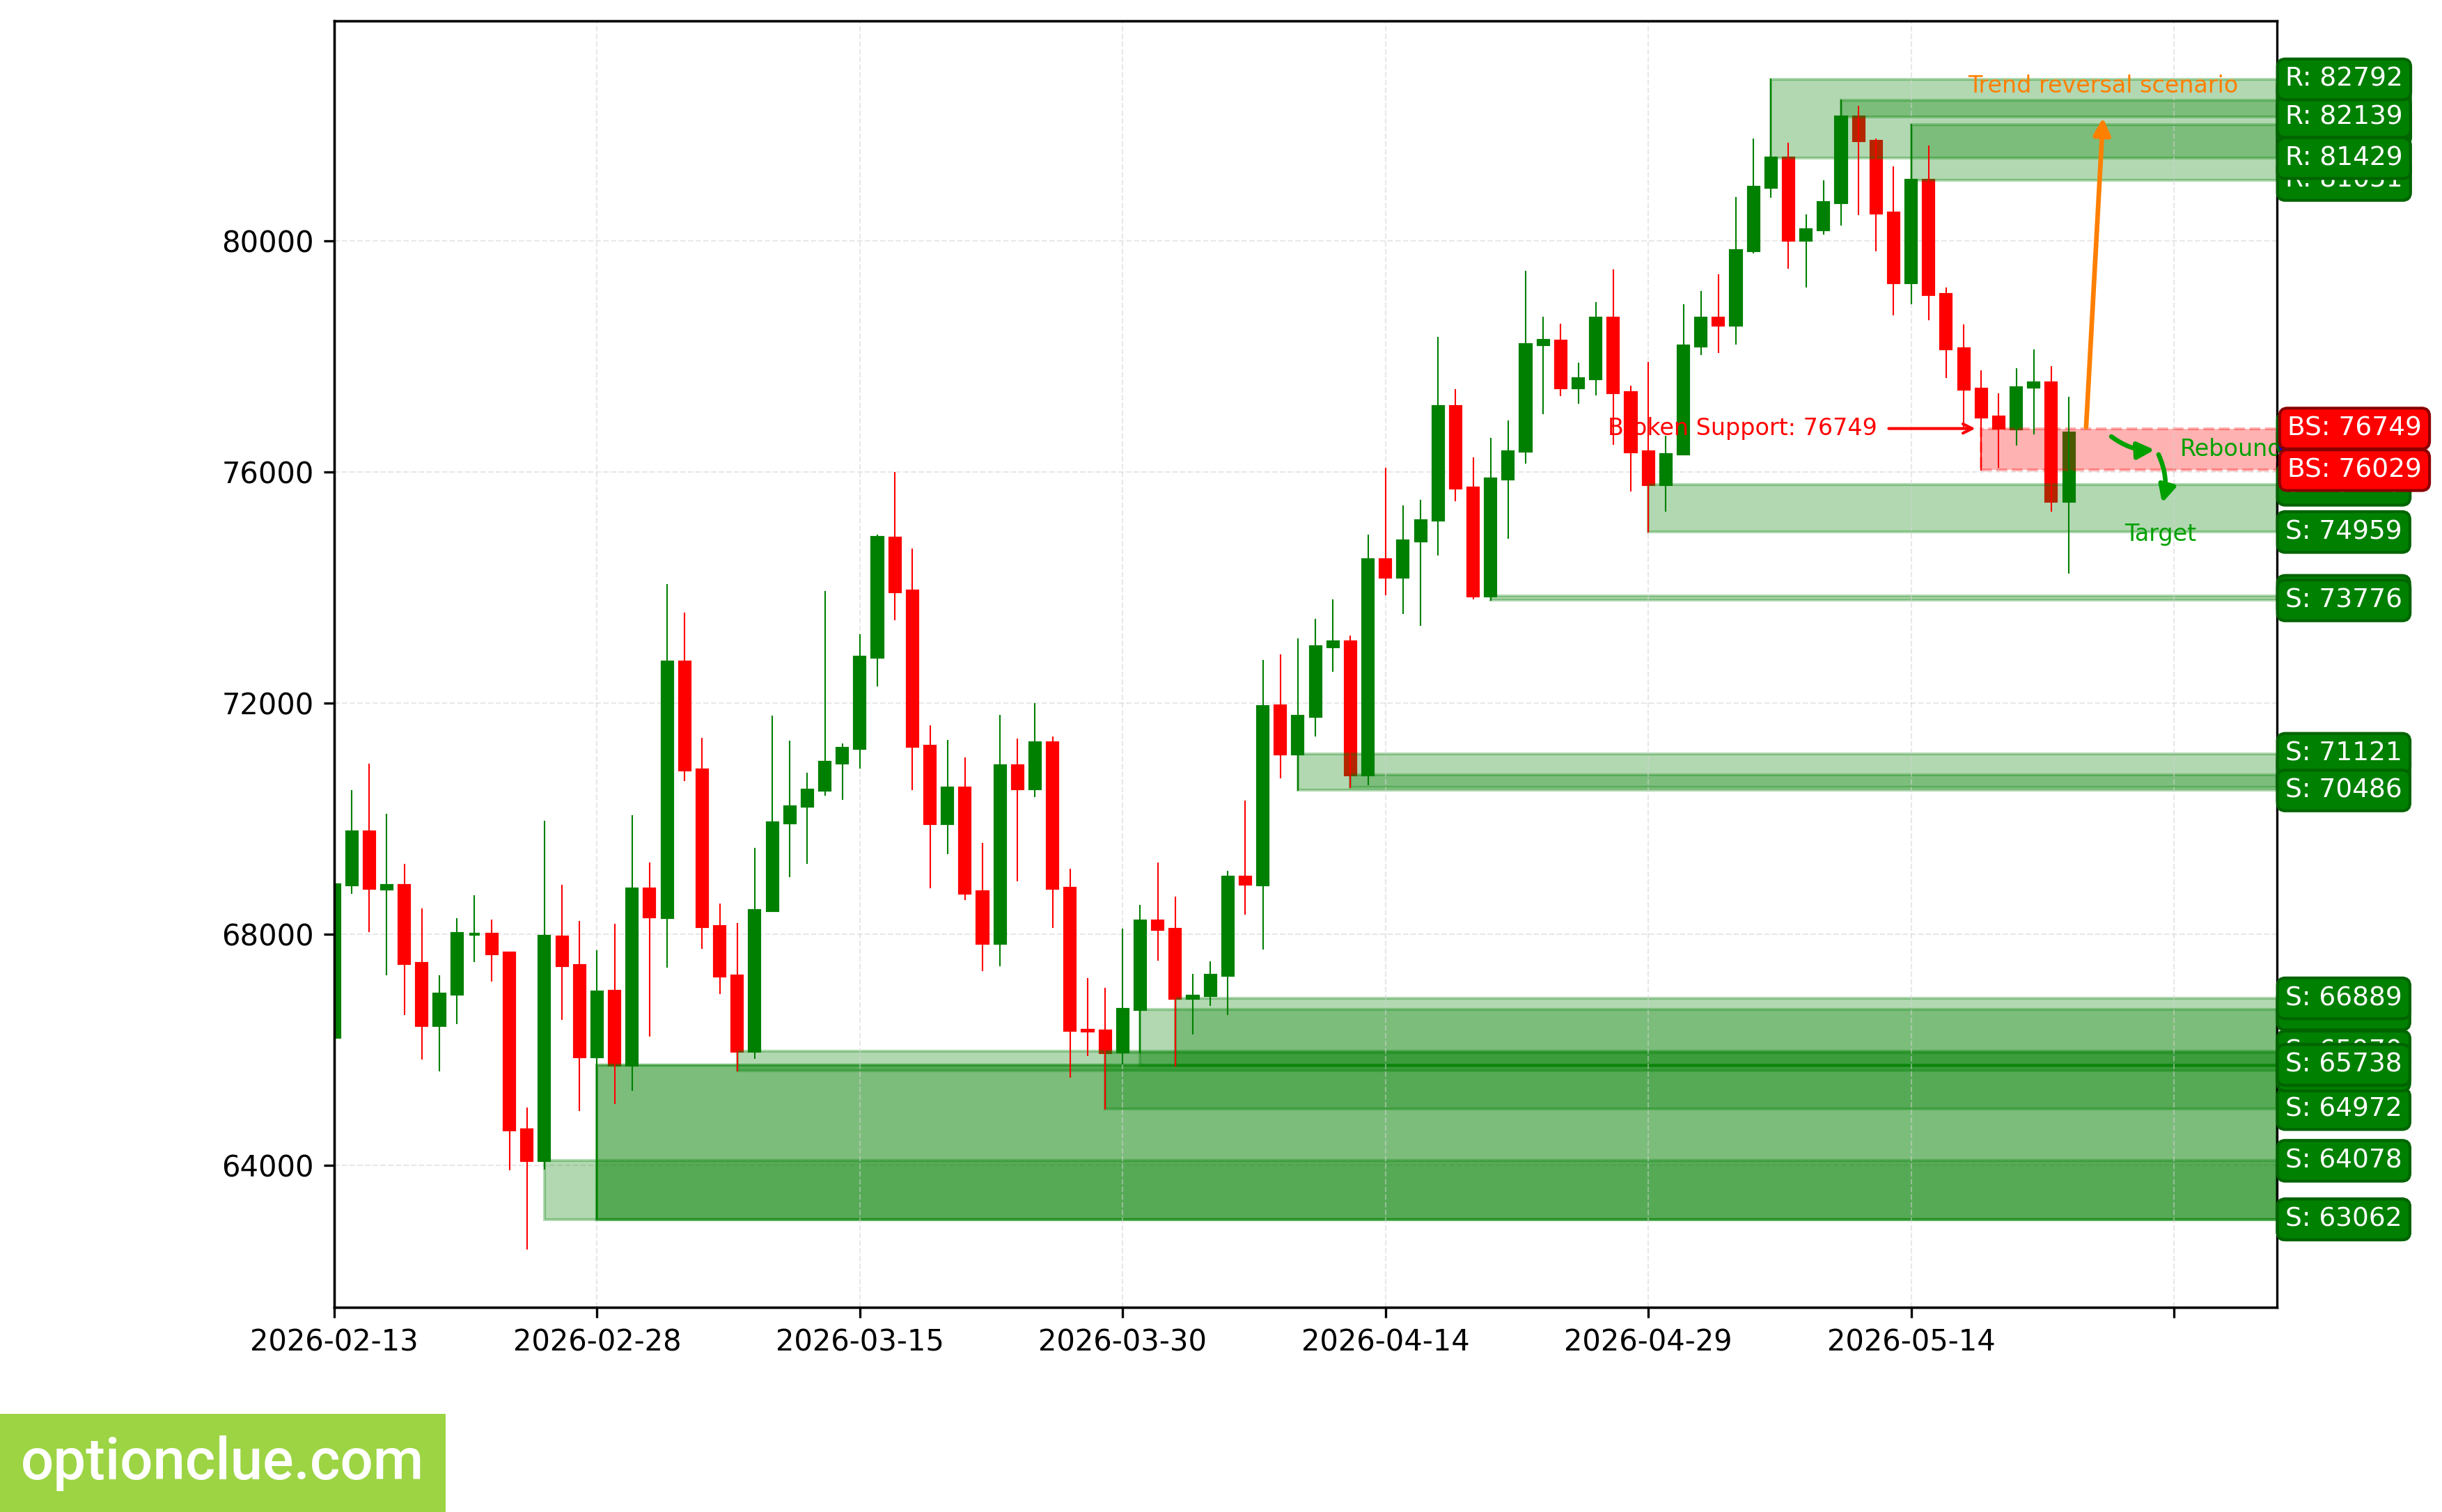
BTC. Technical analysis. D1.
Ether (ETH)
The market remains in a bearish trend; a correction wave is developing again. A sell entry point on a rebound may form after the current correction is completed. The last broken level was support (2266 — 2291). The breakout occurred 11 candles ago.
The intermediate target for the downward movement is the support level with boundaries 2017 — 2053. In case of a successful trend development, a further target will be at the support level with boundaries 1915 — 1937.
If the current correction ends in the area of the resistance level (2369 — 2381), then the potential reward/risk ratio may be more than 3:1. For the further target, more than 4:1. If the correction ends in the area of the last broken level (2266 — 2291), then the potential reward/risk ratio may be about 1.2:1. When choosing the further target, it is approximately 1.8:1.
Short positions will remain relevant as long as the market stays below the nearest resistance level with boundaries 2369 — 2381. If the market successfully consolidates above this nearest resistance, the trend will reverse to bullish.
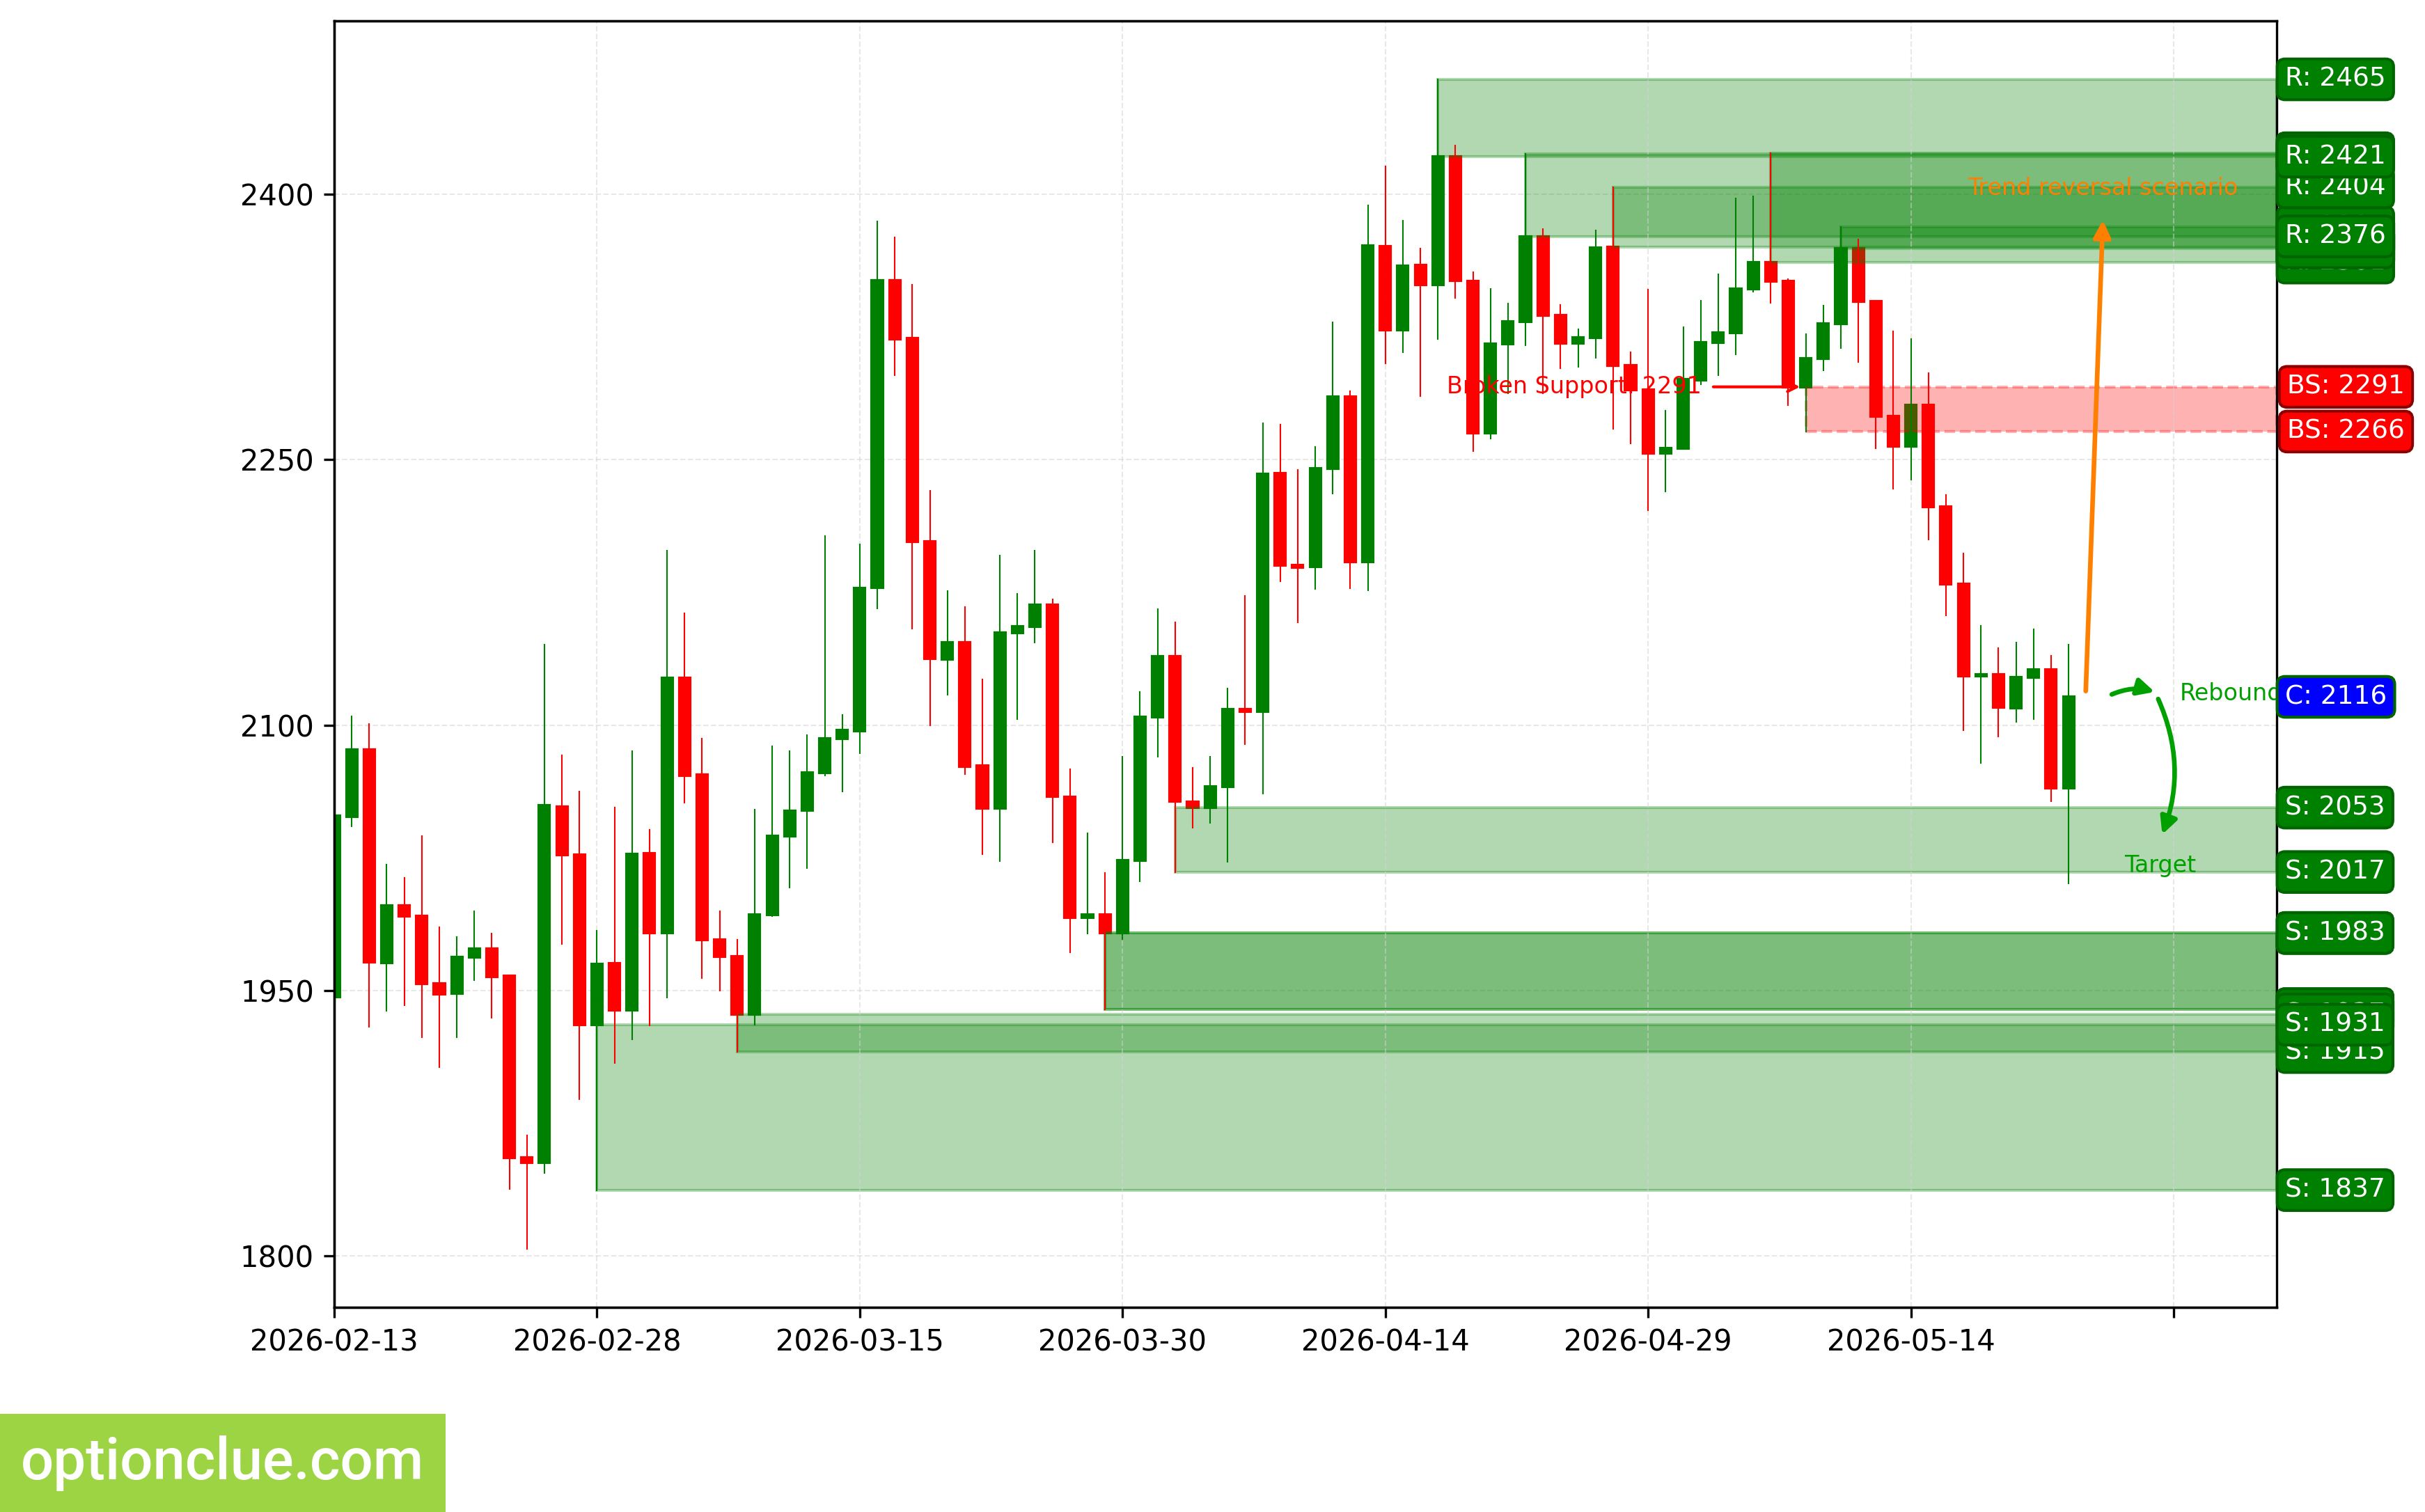
ETH. Technical analysis. D1.
Apple Inc (AAPL)
The bullish trend continues; an impulse wave is developing after the recent resistance breakout. The last broken level was resistance (300.24 — 303.20). The breakout occurred 2 candles ago. New buy entry points on a rebound on the daily timeframe may appear after a correction forms.
No active levels for determining movement targets were found on the current timeframe.
Long positions will remain relevant as long as the market stays above the nearest daily timeframe support level with boundaries 294.91 — 296.97. If the market successfully consolidates below this support, the trend will reverse to bearish.
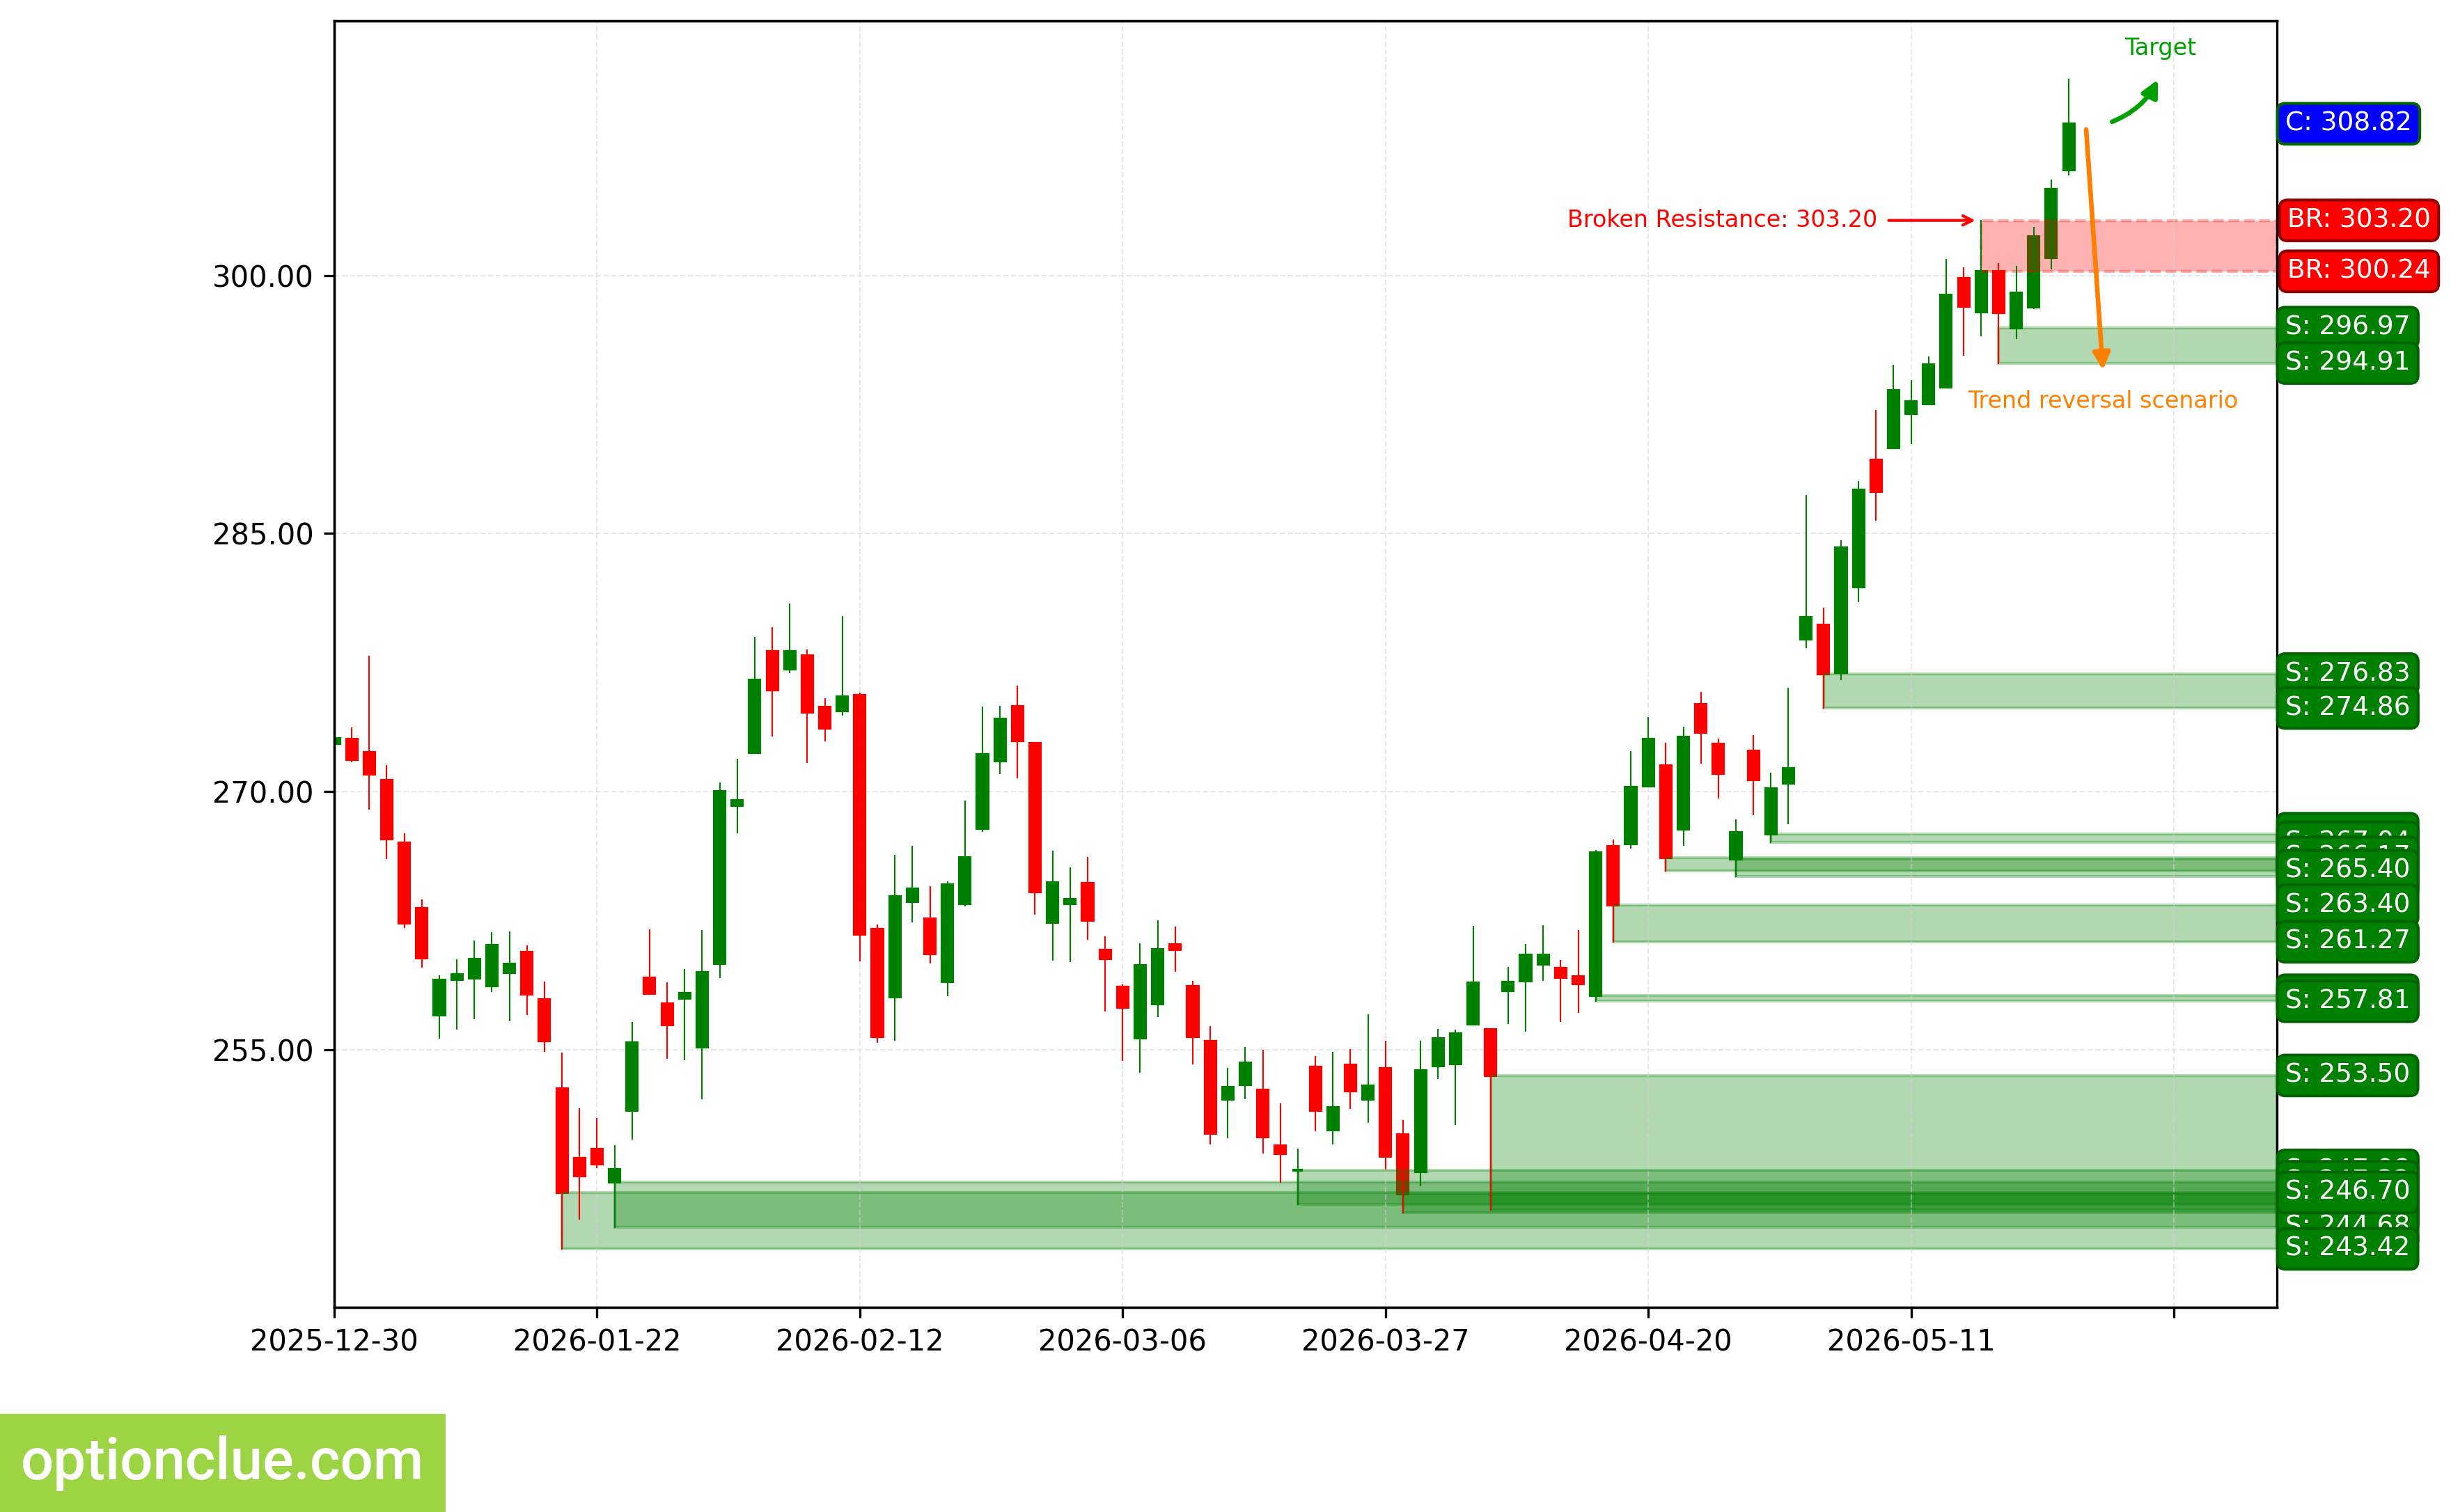
AAPL. Technical analysis. D1.
NVIDIA Corp (NVDA)
The trend changed to bearish when the support level (217.91 — 219.62) was broken on the last closed candle. An impulse wave is developing. A sell entry point on a rebound on the daily timeframe may appear after a correction forms.
The intermediate target for the downward movement is the support level with boundaries 194.74 — 196.50. In case of a successful trend development, a further target will be at the support level with boundaries 180.30 — 181.84.
If the next correction ends in the area of the resistance level (223.47 — 227.40), then the potential reward/risk ratio may be more than 2:1. For the further target, approximately 4:1. If the correction ends in the area of the last broken level (217.91 — 219.62), then the potential reward/risk ratio may be approximately 1.3:1. When choosing the further target, it is about 2:1.
Short positions will remain relevant as long as the market stays below the nearest daily timeframe resistance level with boundaries 223.47 — 227.40. If the market successfully consolidates above this nearest resistance, the trend will reverse to bullish.
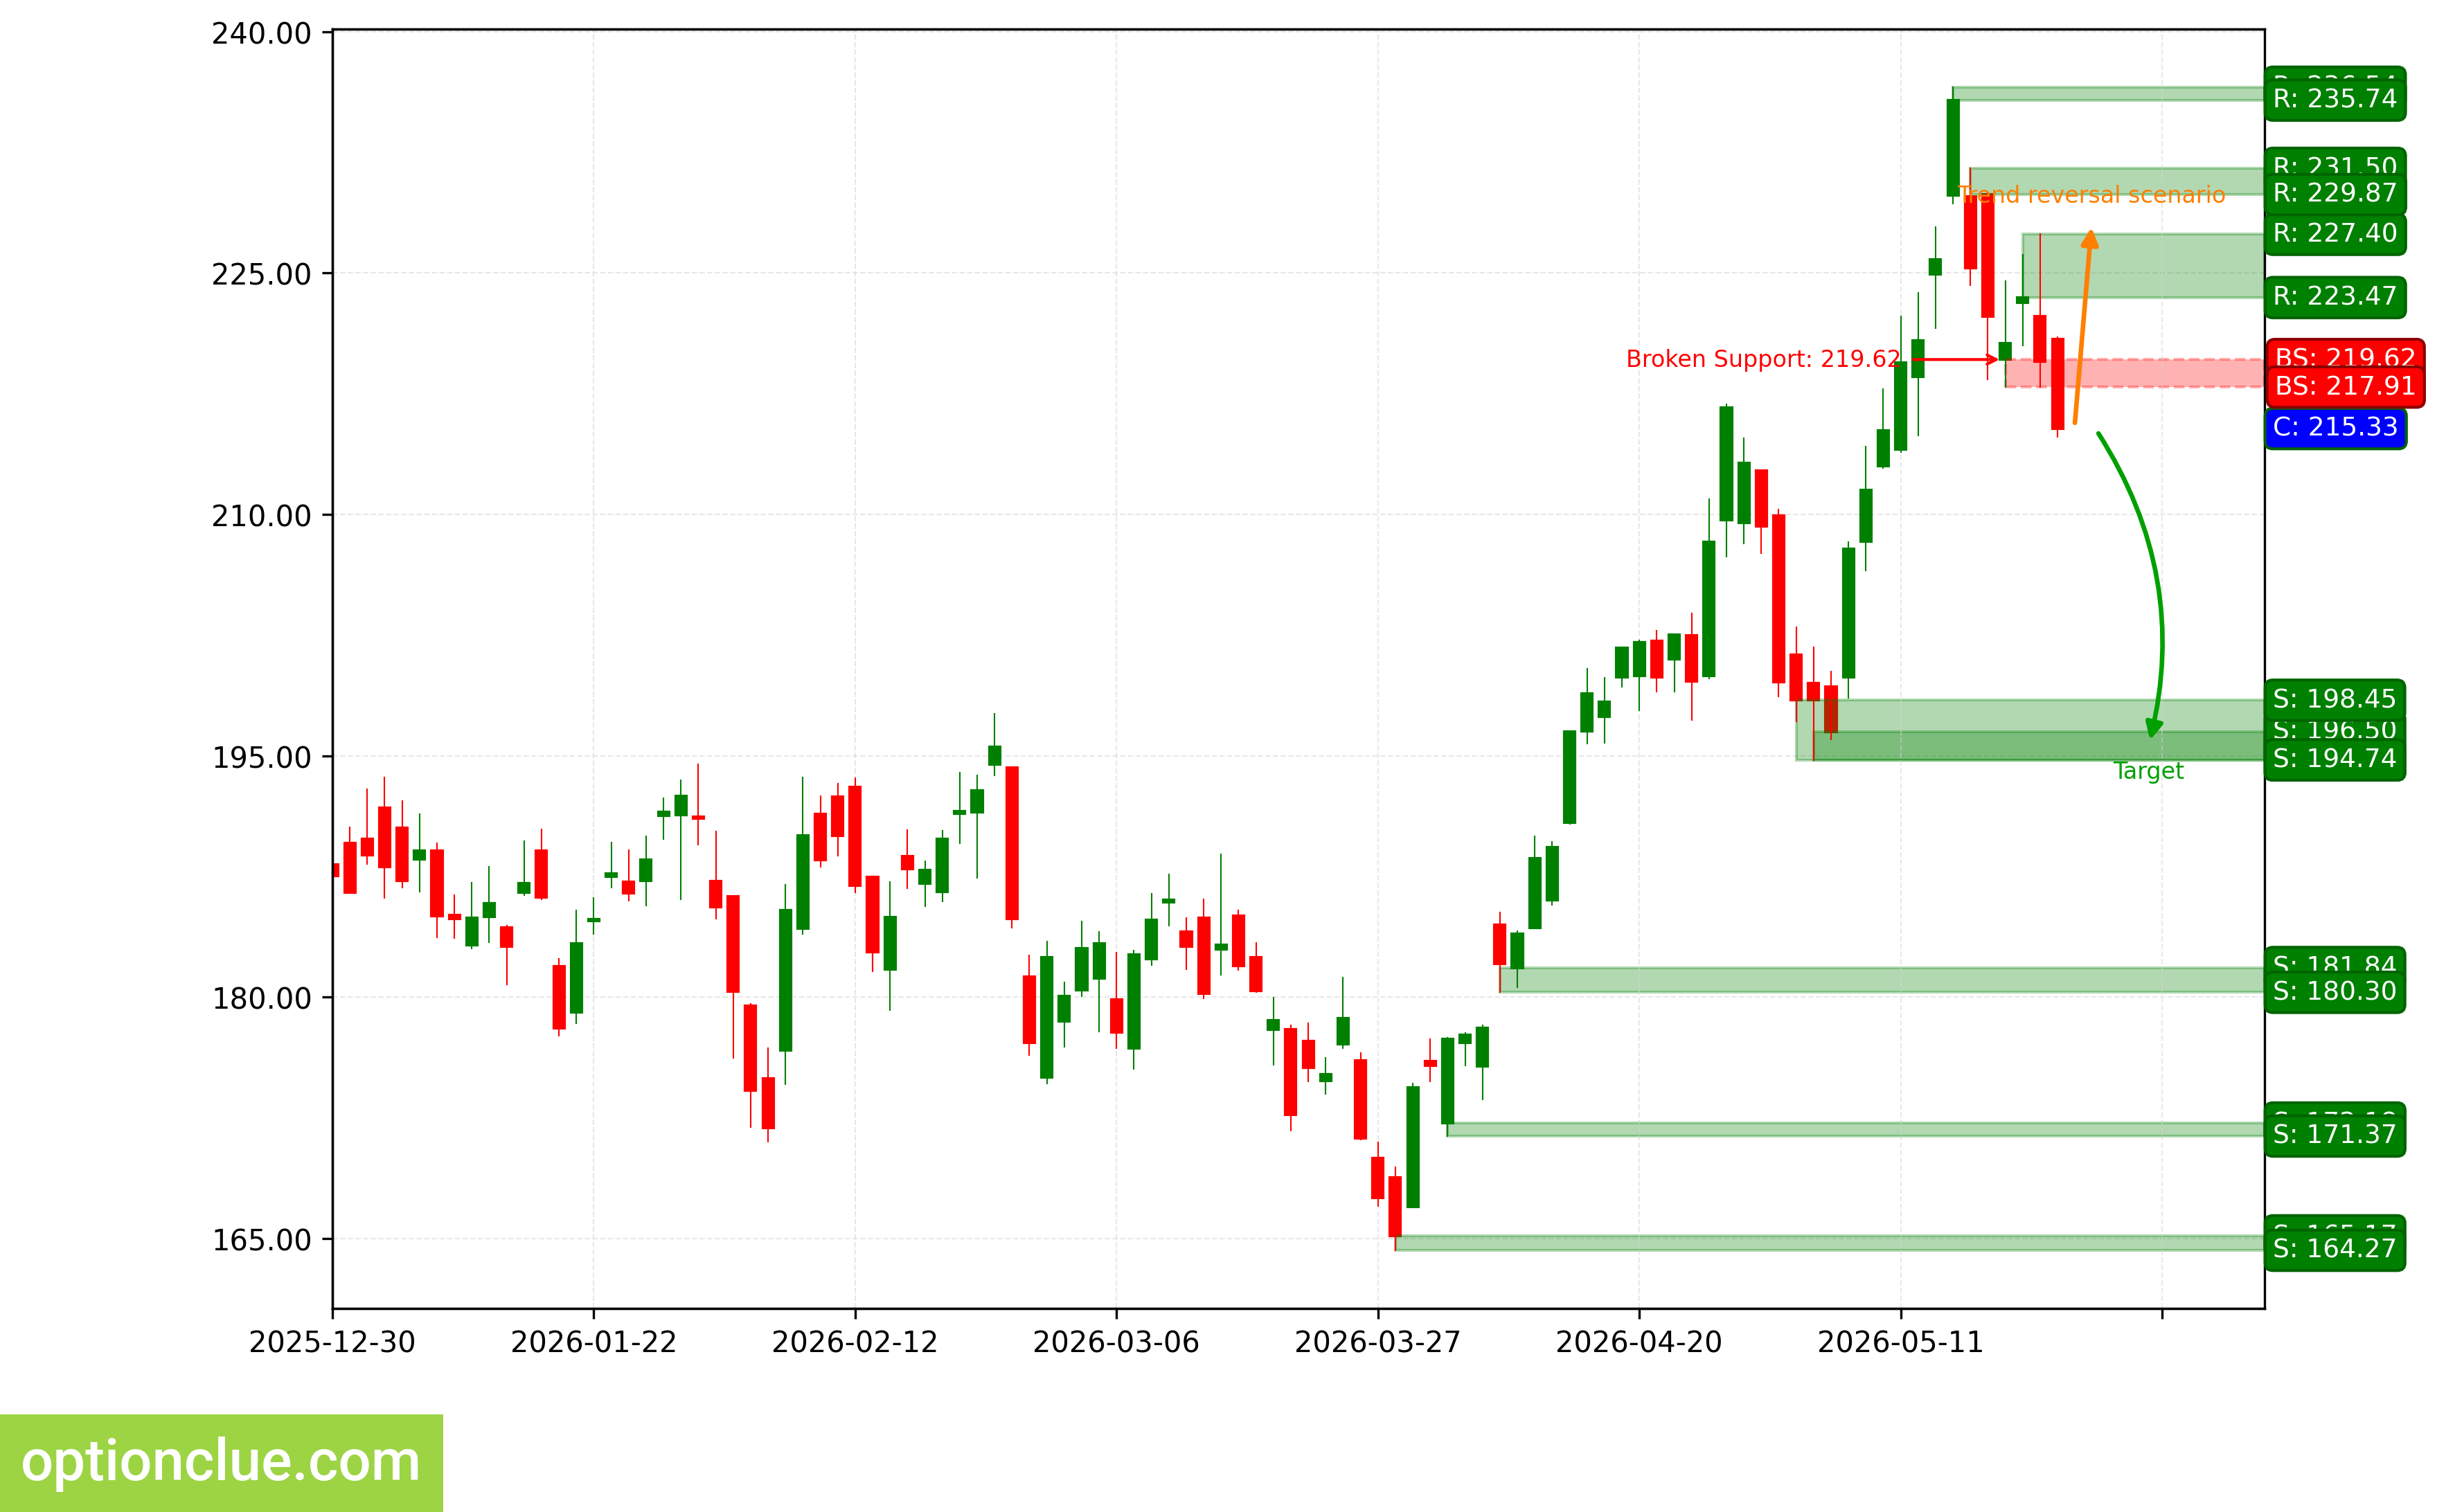
NVDA. Technical analysis. D1.
Tesla Inc (TSLA)
The bearish trend continues; a correction wave is developing again. A sell entry point on a rebound may form after the current correction is completed. The last broken level was support (416.80 — 422.16). The breakout occurred 5 candles ago.
When the downward movement resumes, the intermediate target will be the support level with boundaries 393.63 — 403.16. In case of a successful trend development, a further target will be at the support level with boundaries 364.02 — 372.09.
If the correction ends in the area of the resistance level (446.49 — 453.40), then the potential reward/risk ratio may be approximately 2:1. When choosing the further target, more than 3:1.
Short positions will remain relevant as long as the market stays below the nearest resistance level with boundaries 446.49 — 453.40. If the market successfully consolidates above this nearest resistance, the trend will reverse to bullish.
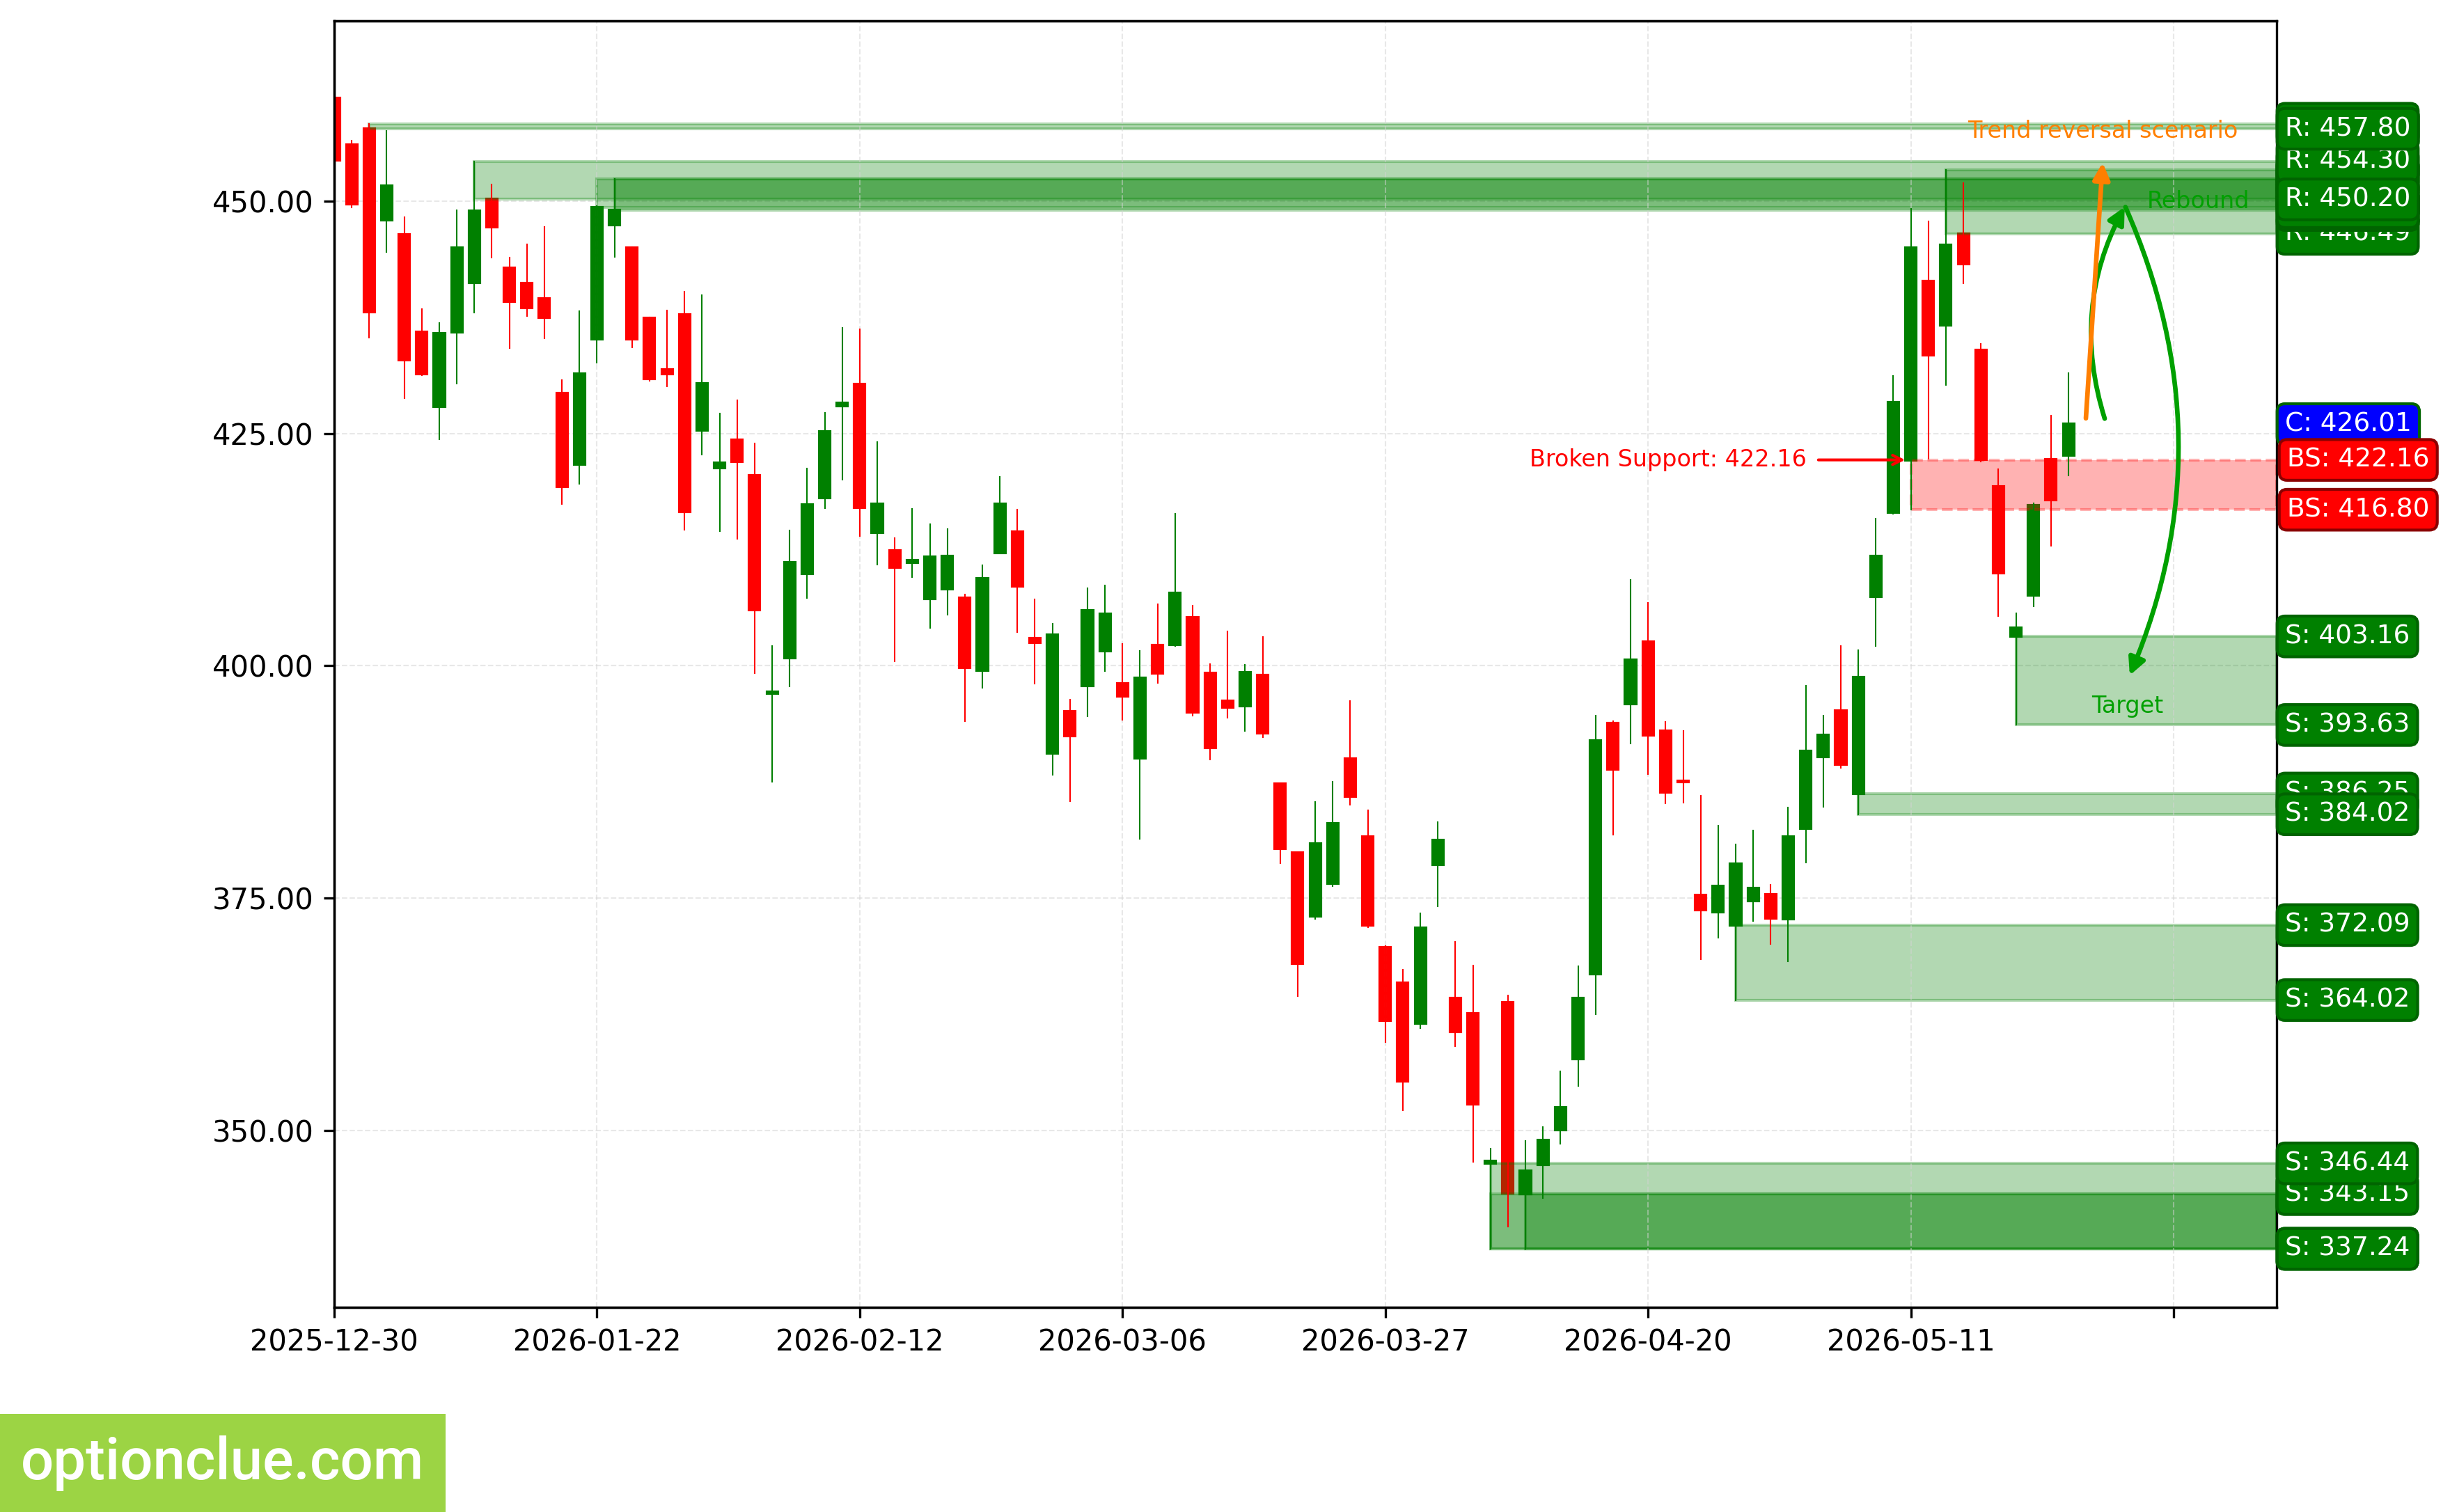
TSLA. Technical analysis. D1.
Summary
From a medium-term trading perspective, the following instruments could be considered potentially most interesting upon the completion of a correction near the closest risk zones: GBPUSD, USDCHF, TSLA.
Soon, depending on the depth of the market correction, the following may be worth attention: BTC.
The other financial instruments on the trading list may also be interesting, but on these markets, rebound signals on the Daily timeframe will likely appear no earlier than in a week.