
Starting from the basics: price and horizontal levels. We mark zones where the market has historically reacted, and check if there is confirmation this week. We prepare scenarios for breakout and rebound.
Key Topics
- Euro (EURUSD)
- British Pound (GBPUSD)
- Swiss Franc (USDCHF)
- Japanese Yen (USDJPY)
- Canadian Dollar (USDCAD)
- Australian Dollar (AUDUSD)
- Bitcoin (BTC)
- Ether (ETH)
- Apple Inc (AAPL)
- NVIDIA Corp (NVDA)
- Tesla Inc (TSLA)
- Summary
Euro (EURUSD)
Bullish trend continues, corrective wave is developing. Entry point for buy on rebound may form after completion of current correction. Last broken level — resistance (1.1666 — 1.1682). Breakout happened 7 candlesticks ago.
Intermediate target for upside movement is the resistance level with boundaries 1.1754 — 1.1804. In case of successful trend development, farther target will be at the resistance level with boundaries 1.1871 — 1.1918.
Potential profit/risk ratio from current prices when setting targets and fixing risks at daily timeframe levels may be small (around 0.2:1). When using farther target — insignificant (around 0.8:1). If correction completes near the support level (1.1615 — 1.1628), potential profit/risk ratio may be around 2:1. For farther target — more than 3:1. If correction completes near the last broken level (1.1666 — 1.1682), potential profit/risk ratio may be small (around 0.6:1). When assessing farther target — around 1.6:1.
Long positions will remain relevant as long as the market is above the nearest support level with boundaries 1.1615 — 1.1628. If the market successfully closes below this support, the trend will reverse to bearish.
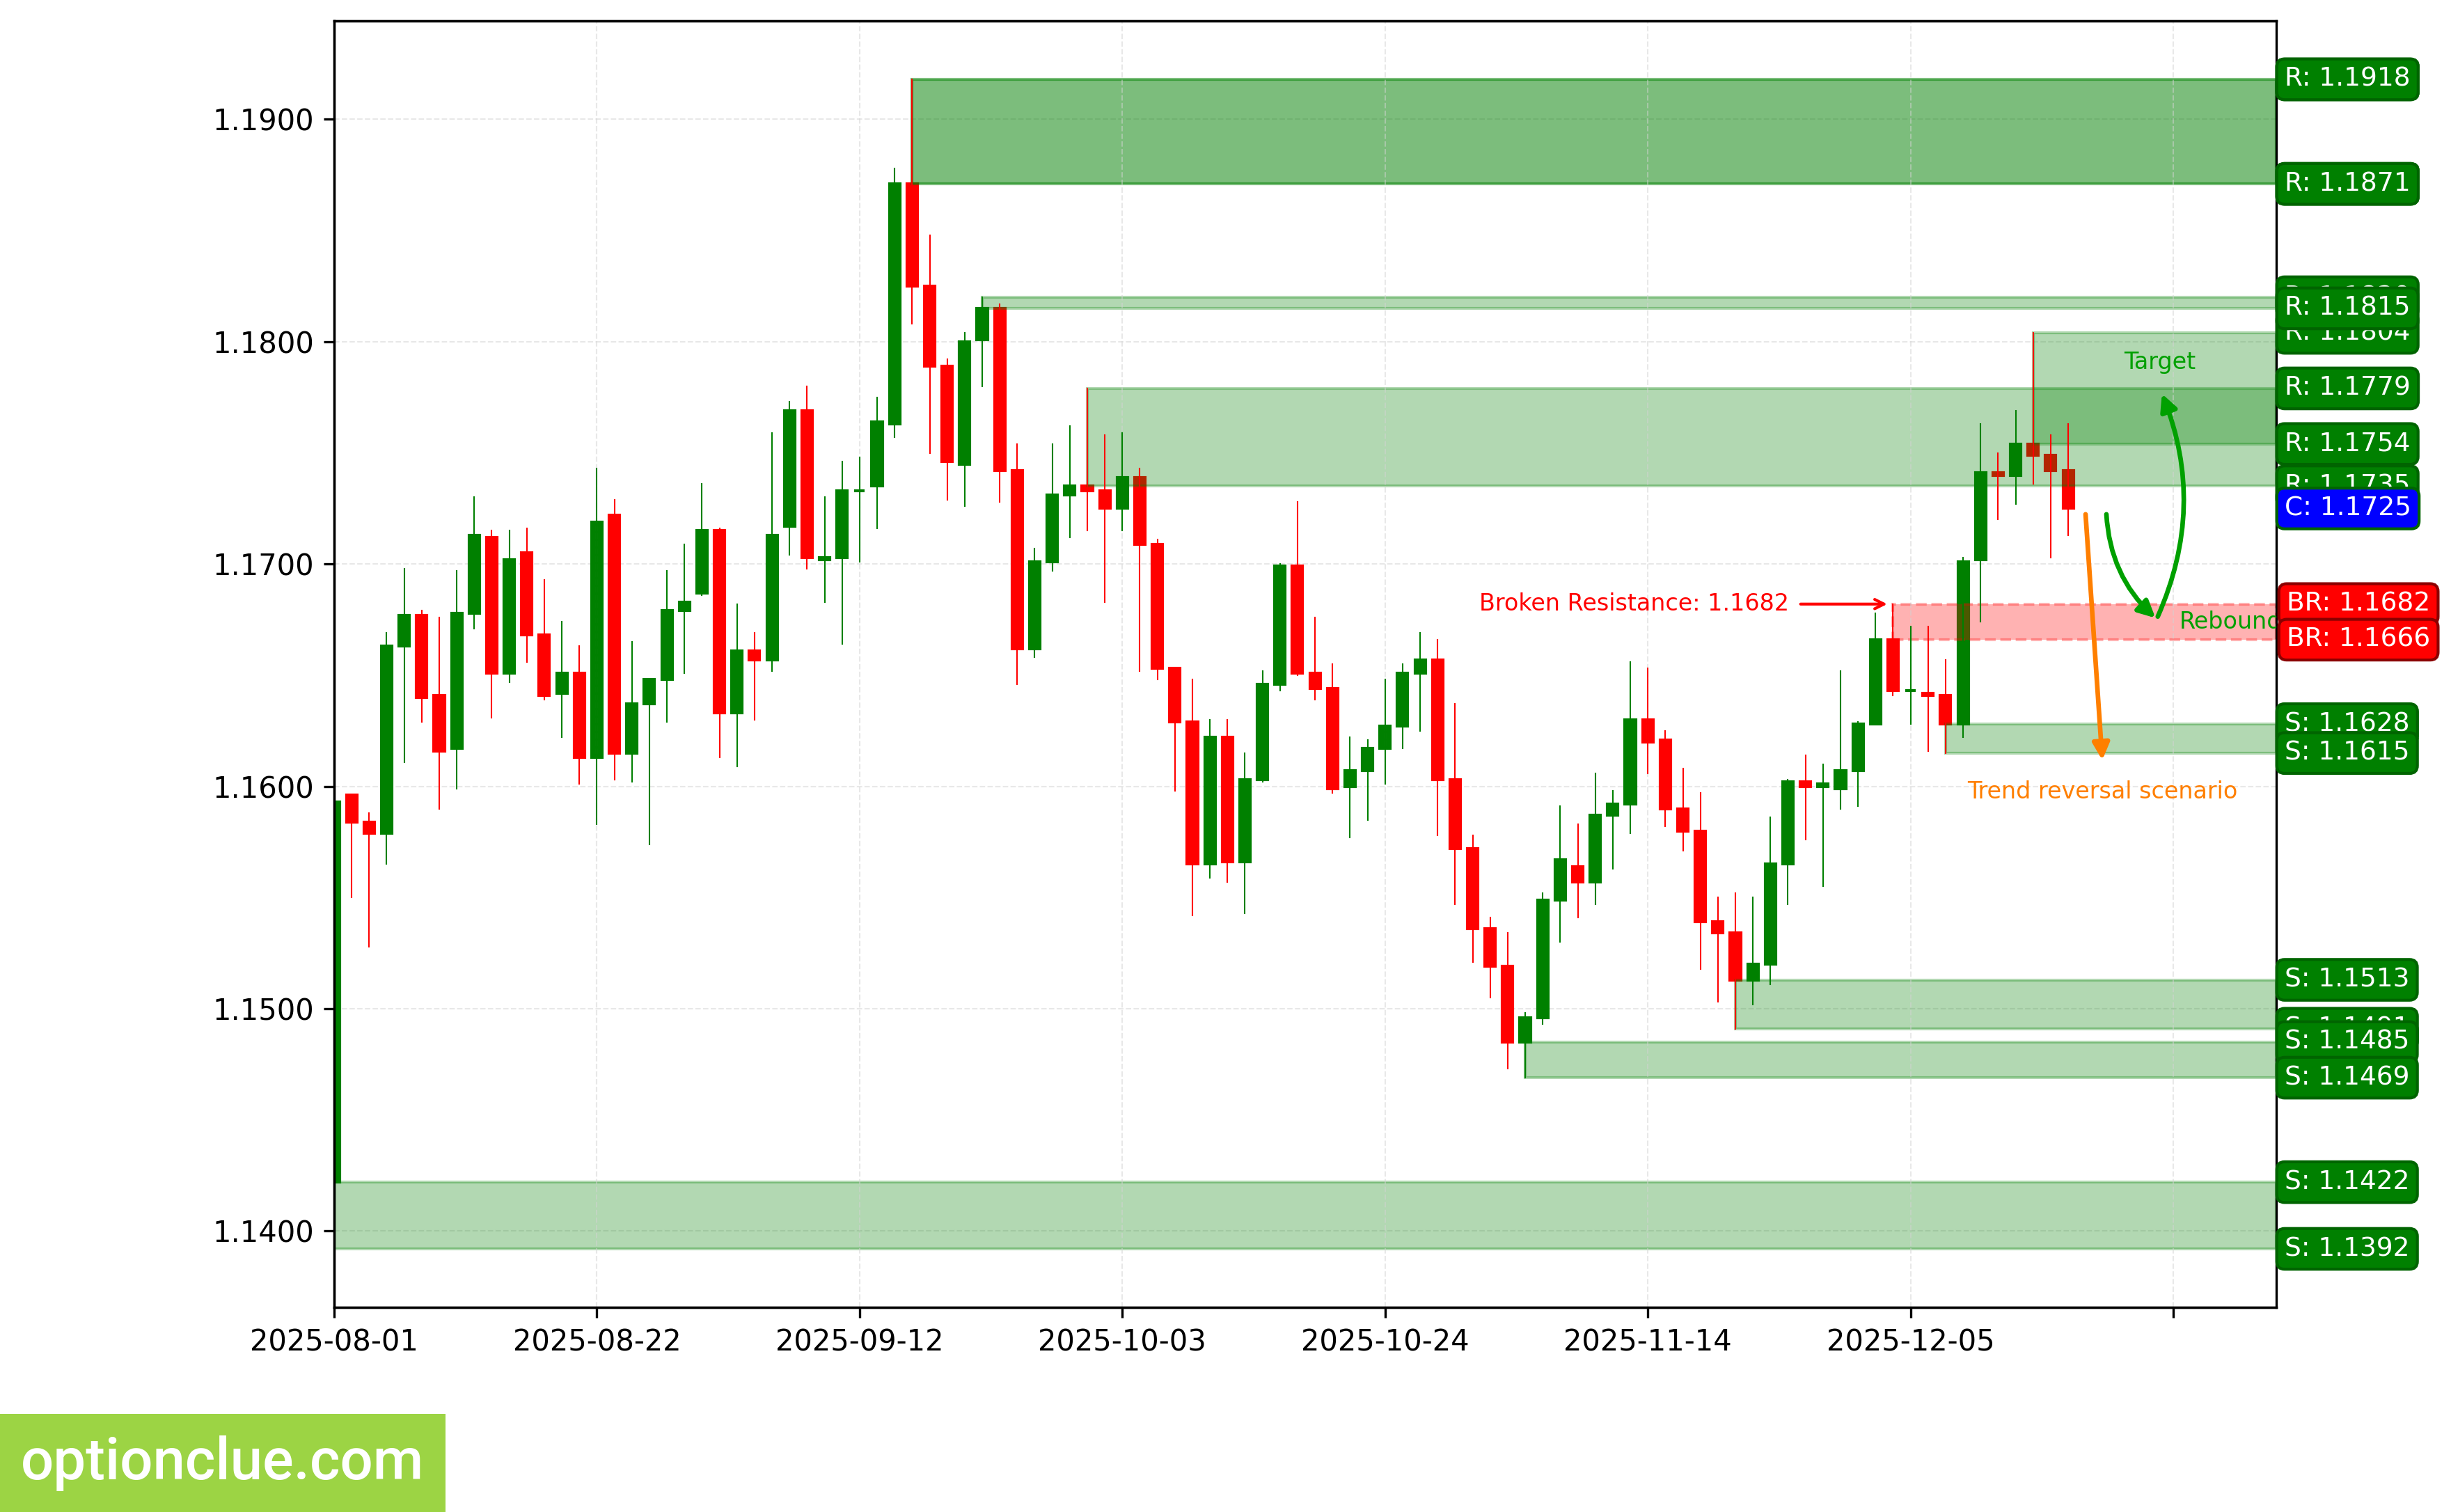
EURUSD. Technical Analysis. D1.
British Pound (GBPUSD)
Bullish trend continues, corrective wave is developing. Entry point for buy on rebound may form after completion of current correction. Last broken level — resistance (1.3333 — 1.3363). Breakout happened 7 candlesticks ago.
Intermediate target for upside movement is the resistance level with boundaries 1.3393 — 1.3438. In case of successful trend development, farther target will be at the resistance level with boundaries 1.3484 — 1.3490.
If correction completes near the support level (1.3343 — 1.3371), potential profit/risk ratio may be small (around 0.3:1). When using farther target — insignificant (around 1.2:1).
Long positions will remain relevant as long as the market is above the nearest support level with boundaries 1.3343 — 1.3371. If the market successfully closes below this nearest support, the trend will reverse to bearish.
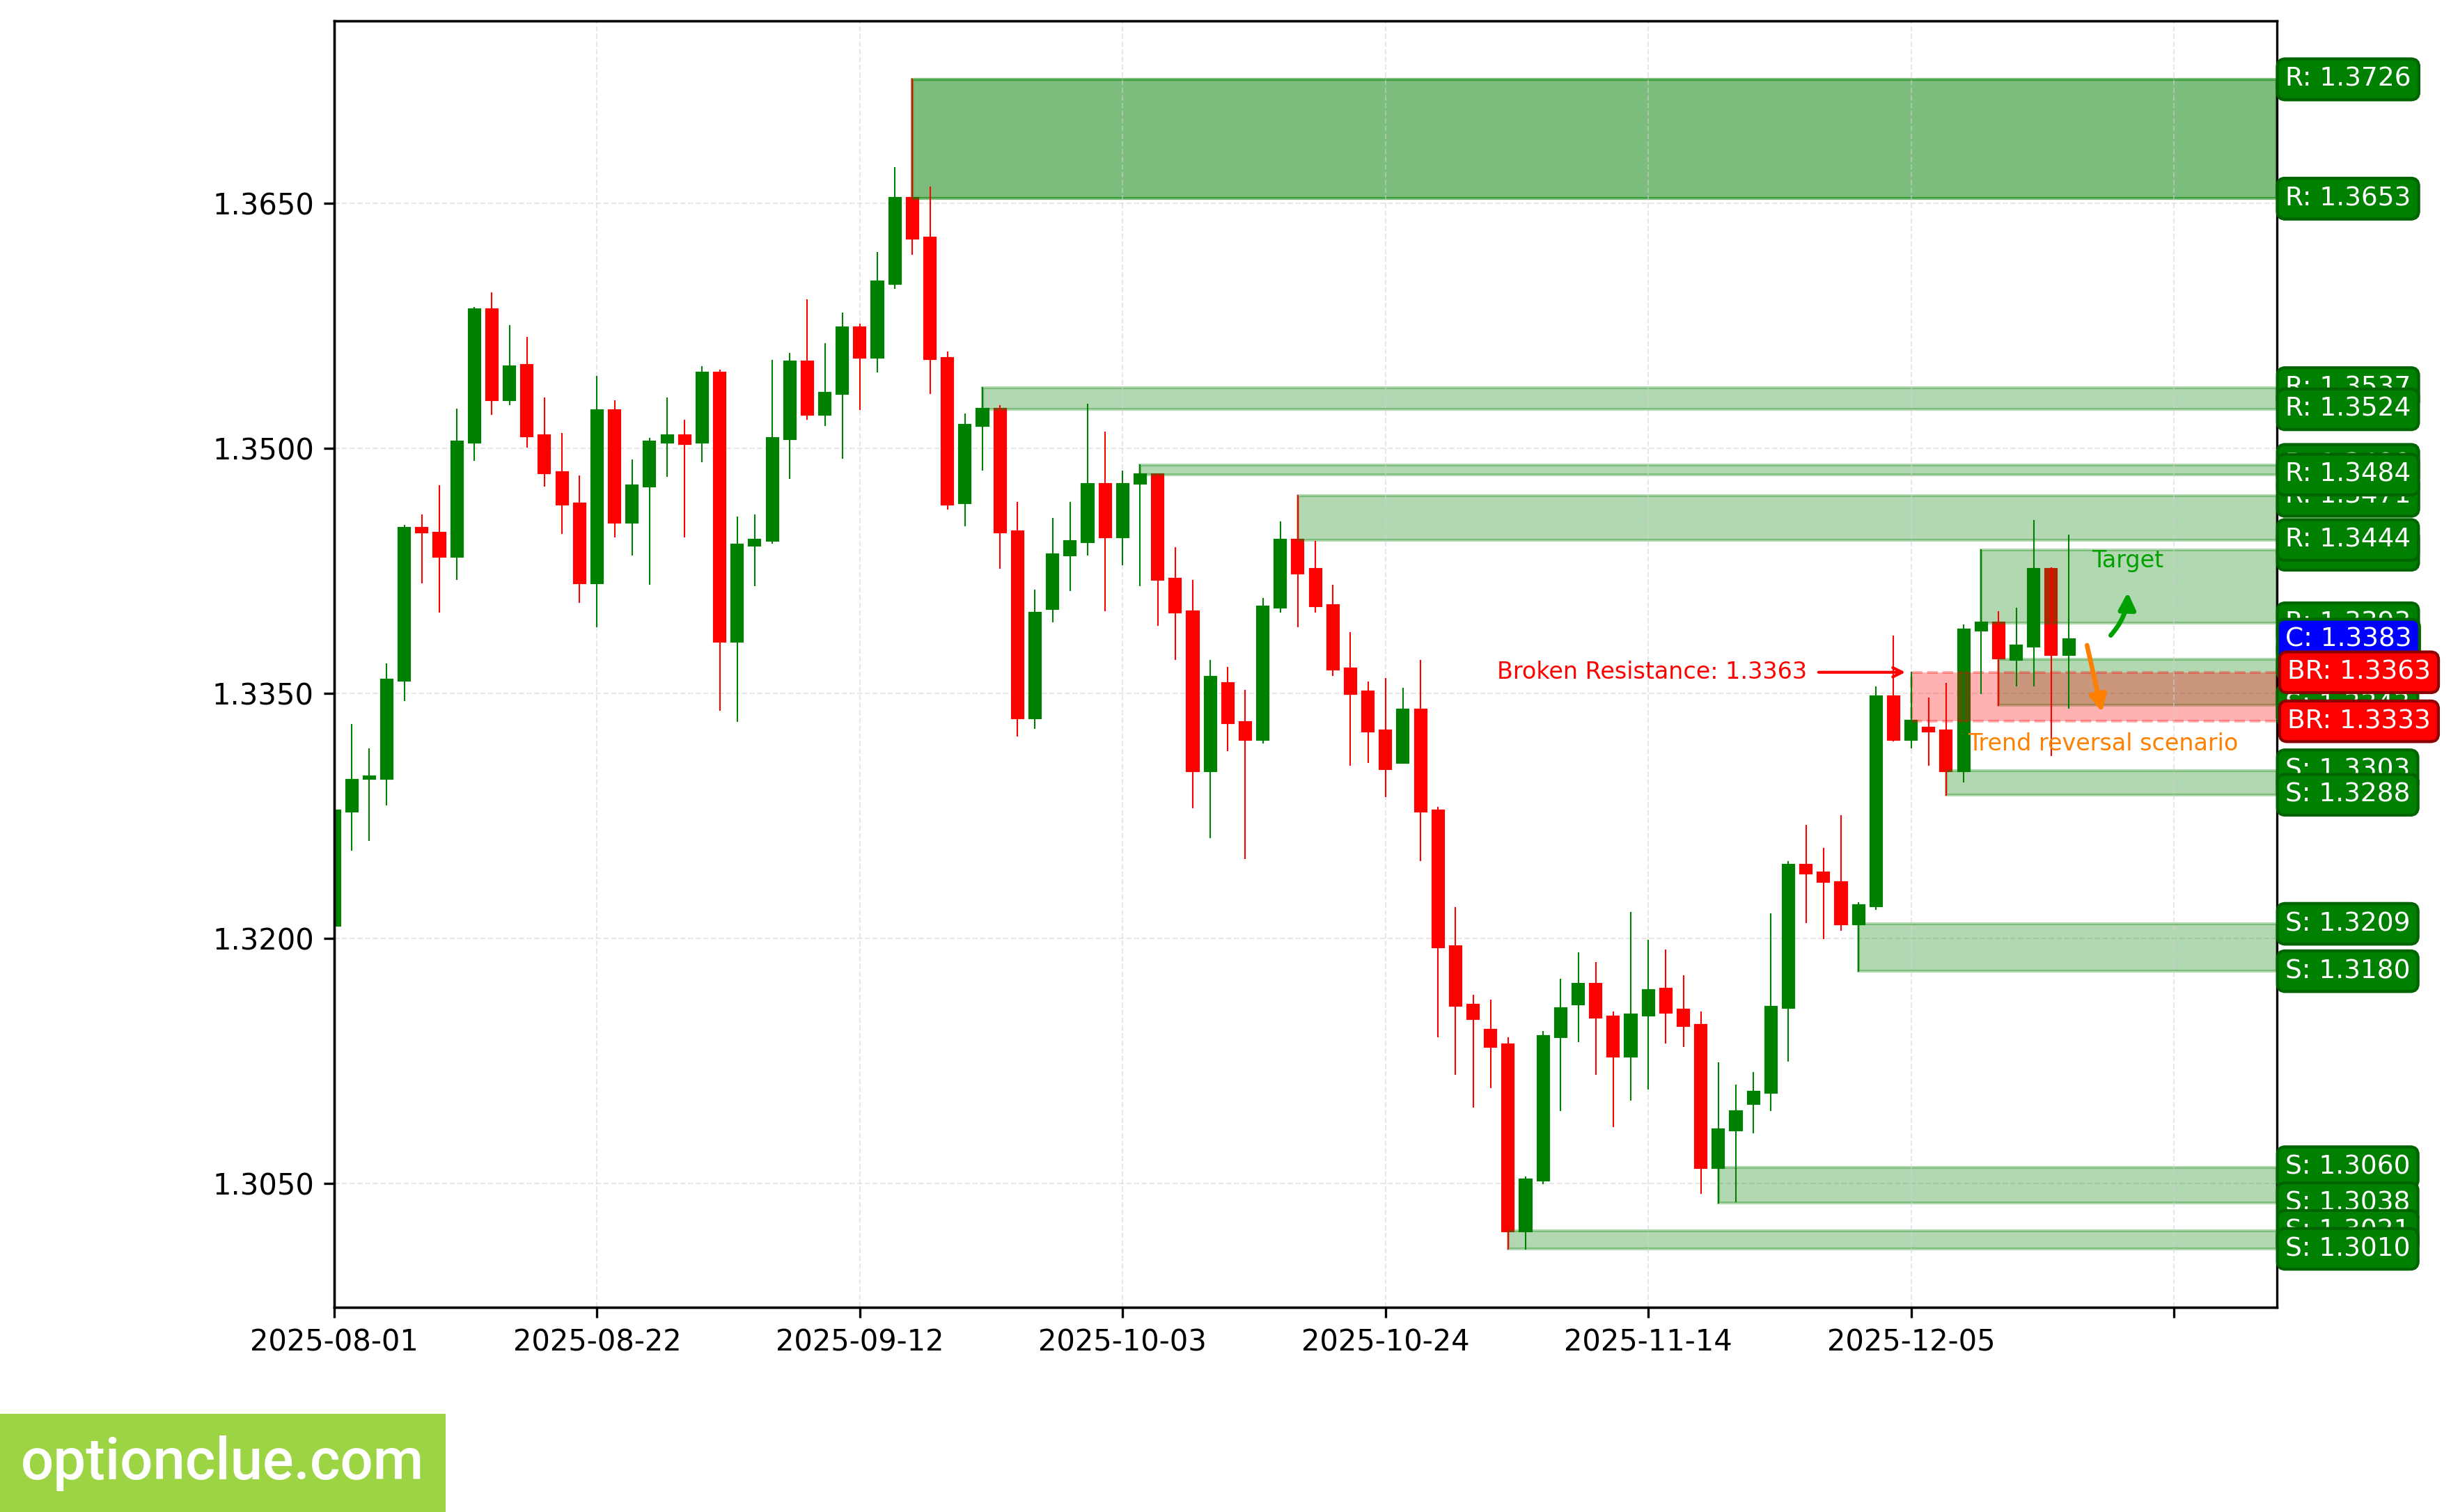
GBPUSD. Technical Analysis. D1.
Swiss Franc (USDCHF)
Bearish trend continues, corrective wave is developing. Entry point for sell on rebound may form after completion of current correction. Last broken level — support (0.7990 — 0.7997). Breakout happened 7 candlesticks ago.
Intermediate target for downside movement is the support level with boundaries 0.7876 — 0.7923.
If correction completes near the resistance level (0.8068 — 0.8085), potential profit/risk ratio may be around 2.5:1. If correction completes near the last broken level (0.7990 — 0.7997), potential profit/risk ratio may be small (around 0.5:1).
Short positions will remain relevant as long as the market remains below the nearest resistance level with boundaries 0.8068 — 0.8085. If the market successfully closes above this nearest resistance, the trend will reverse to bullish.
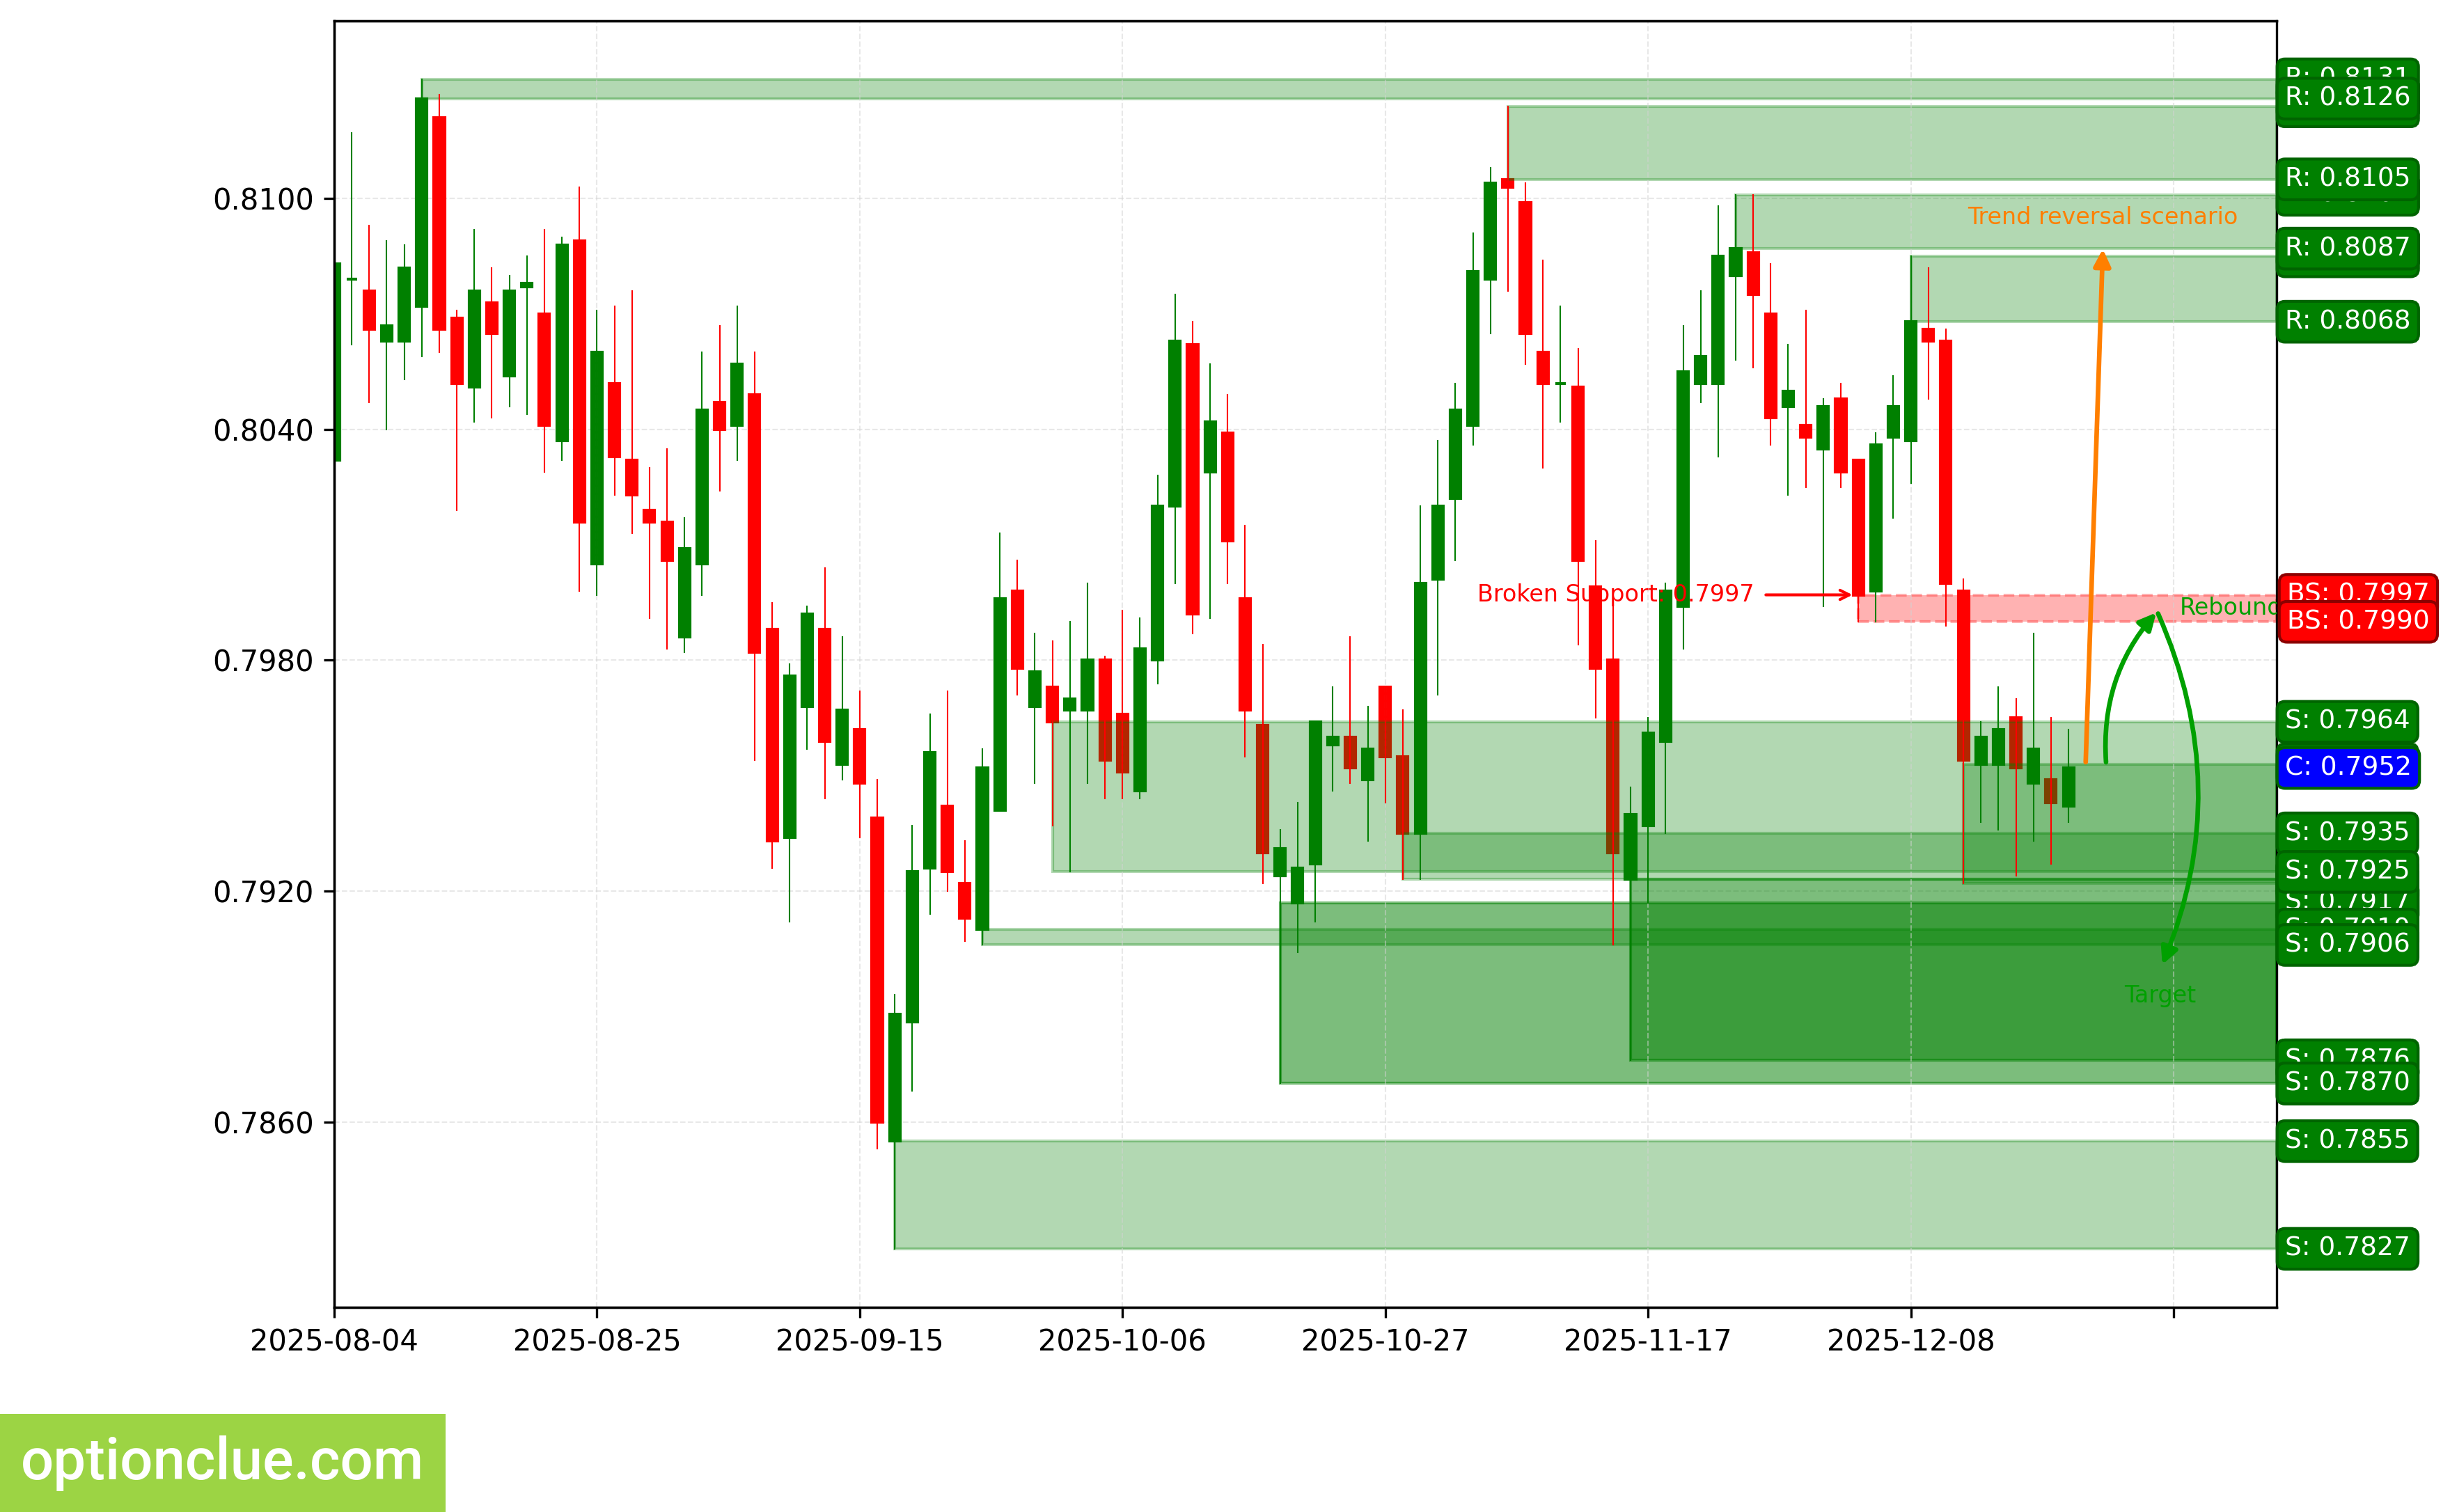
USDCHF. Technical Analysis. D1.
Japanese Yen (USDJPY)
Bullish trend continues, last broken level — resistance (156.82 — 156.95). Breakout happened on the last closed candlestick, impulse wave is developing.
Intermediate target for upside movement is the resistance level with boundaries 158.23 — 158.55. In case of successful trend development, farther target will be at the resistance level with boundaries 161.69 — 161.85.
If correction completes near the support level (154.40 — 154.77), potential profit/risk ratio may be more than 2:1. When using farther target — around 5:1. If correction completes near the last broken level (156.82 — 156.95), potential profit/risk ratio may be small (around 0.4:1). When selecting farther target — around 1.3:1.
Long positions will remain relevant as long as the market is above the nearest support level with boundaries 154.40 — 154.77. If the market successfully closes below this support, the trend will reverse to bearish.
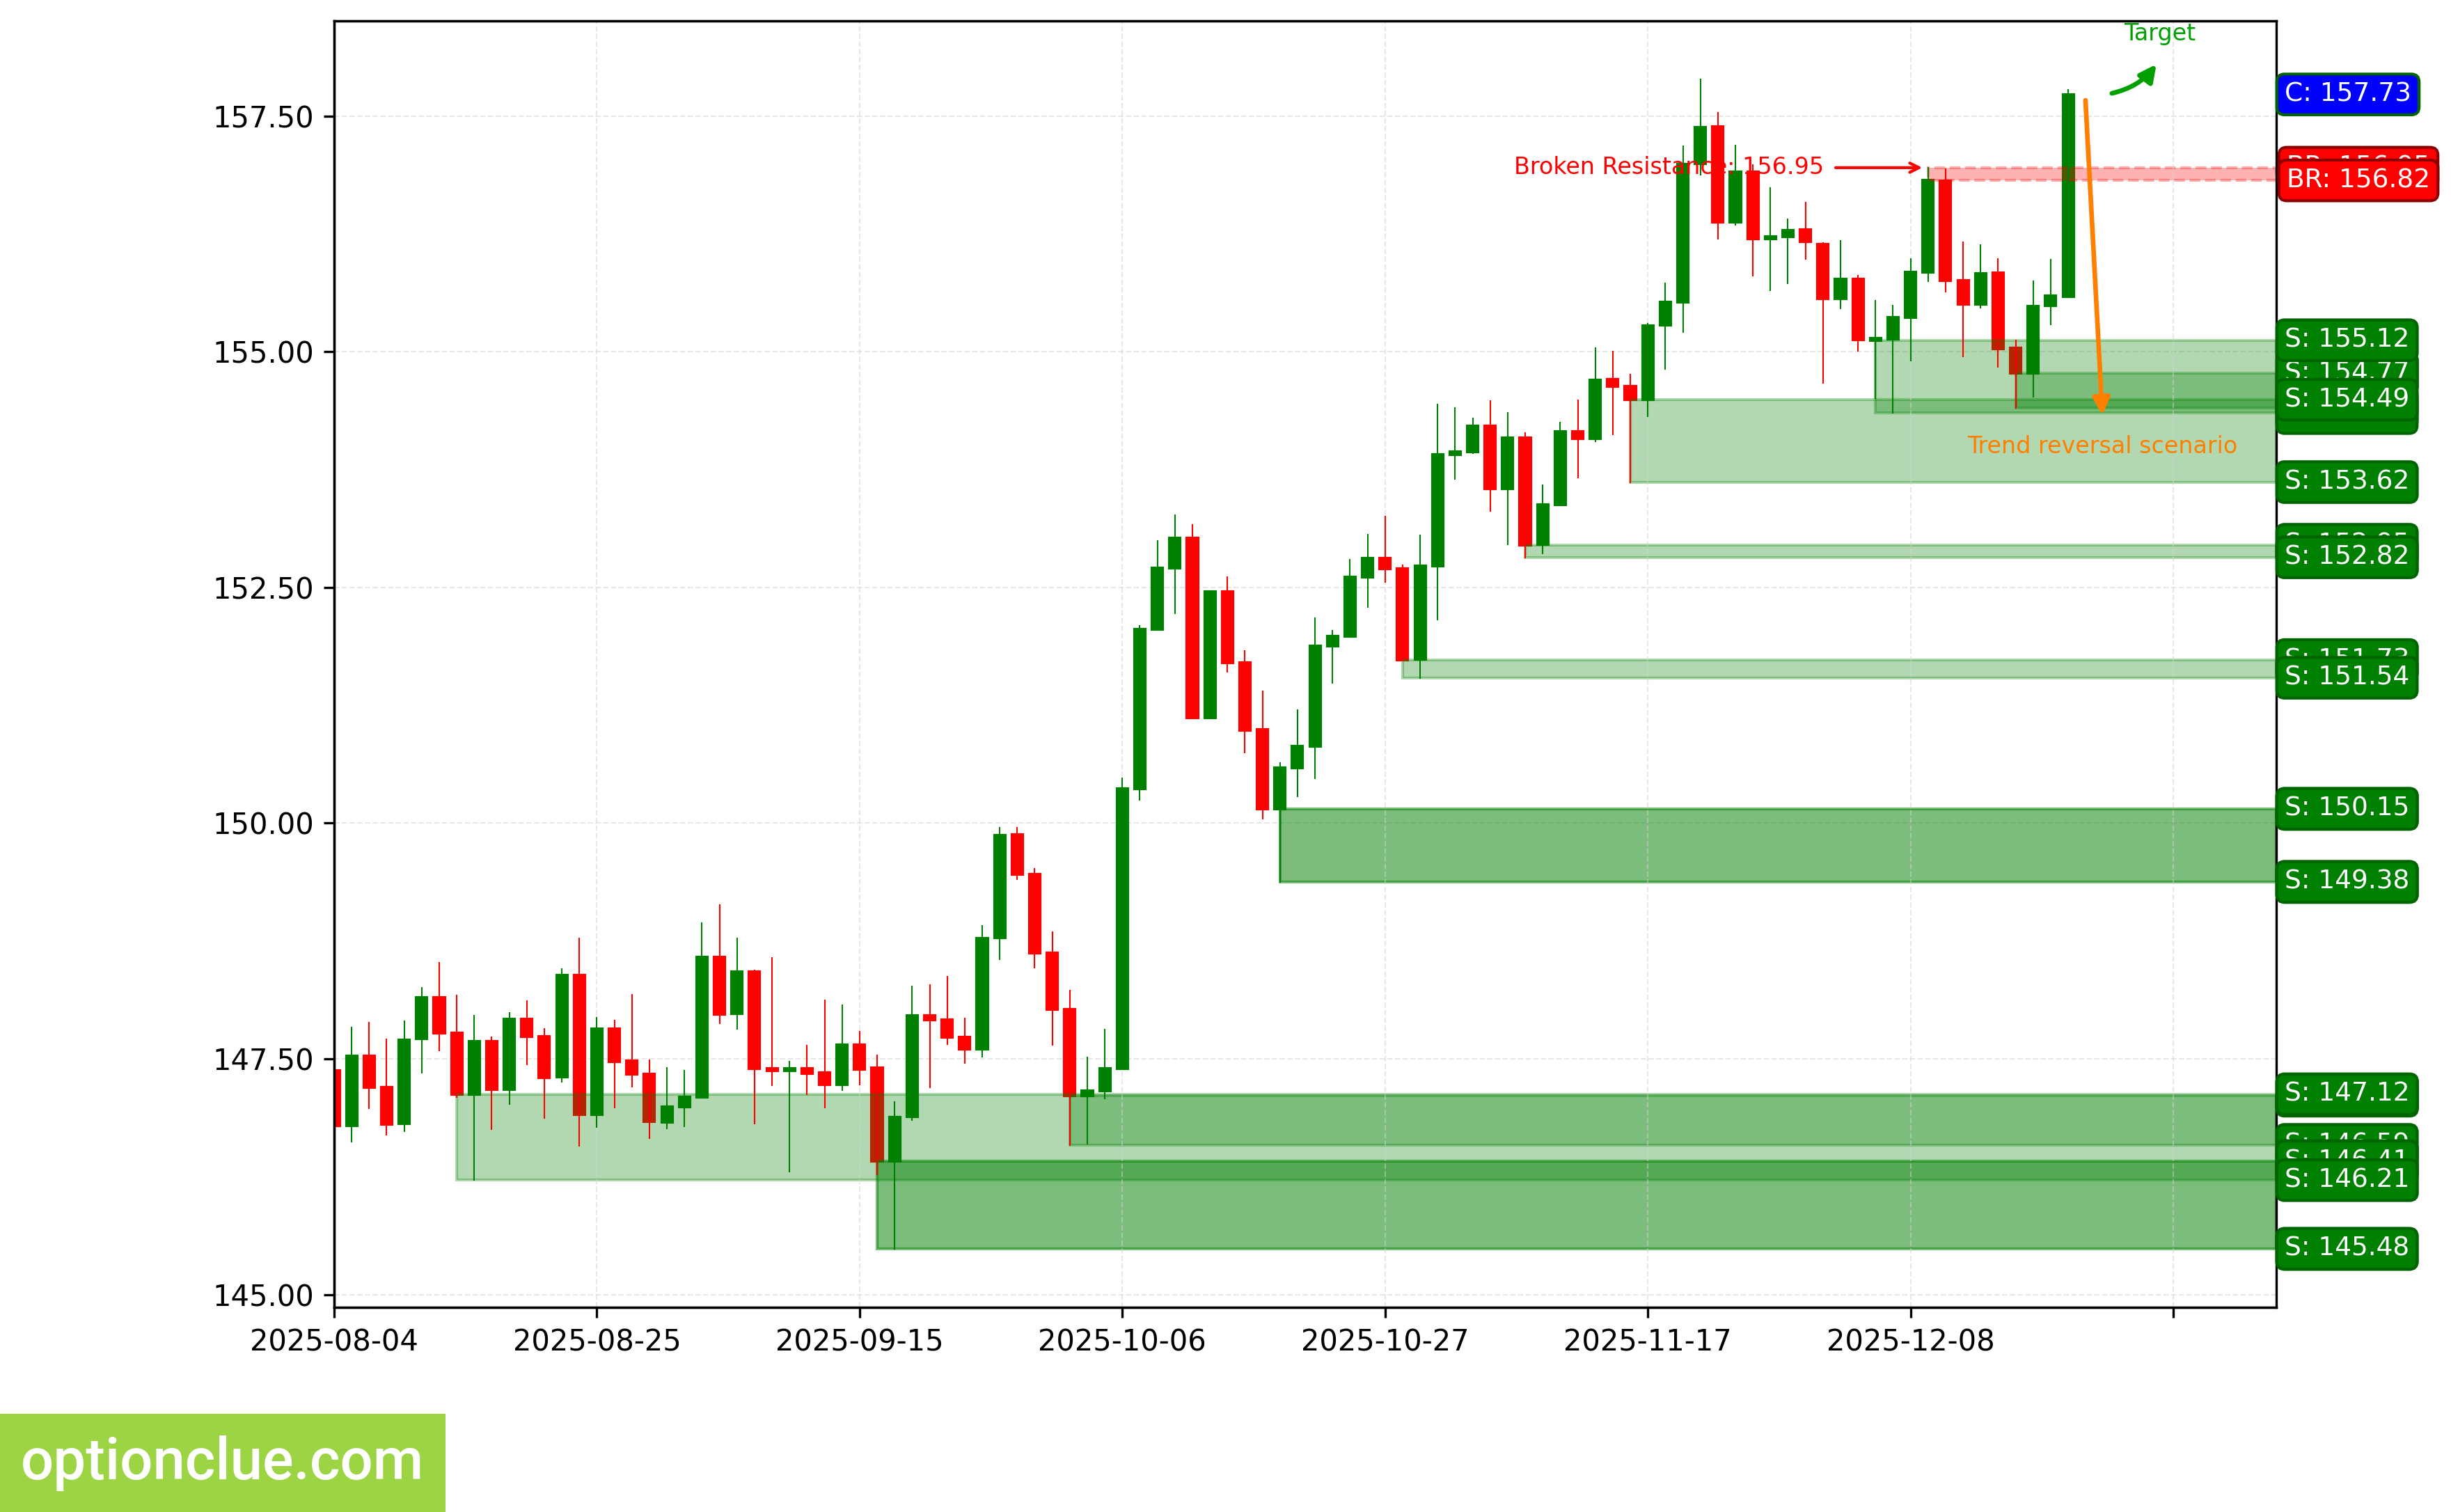
USDJPY. Technical Analysis. D1.
Canadian Dollar (USDCAD)
Bearish trend continues, corrective wave is developing. Last broken level — support (1.3983 — 1.4002).
Intermediate target for downside movement is the support level with boundaries 1.3746 — 1.3762.
If next correction completes near the resistance level (1.3858 — 1.3871), potential profit/risk ratio may be small (around 1.3:1).
Short positions will remain relevant as long as the market remains below the nearest resistance level with boundaries 1.3858 — 1.3871. If the market successfully closes above this nearest resistance, the trend will reverse to bullish.
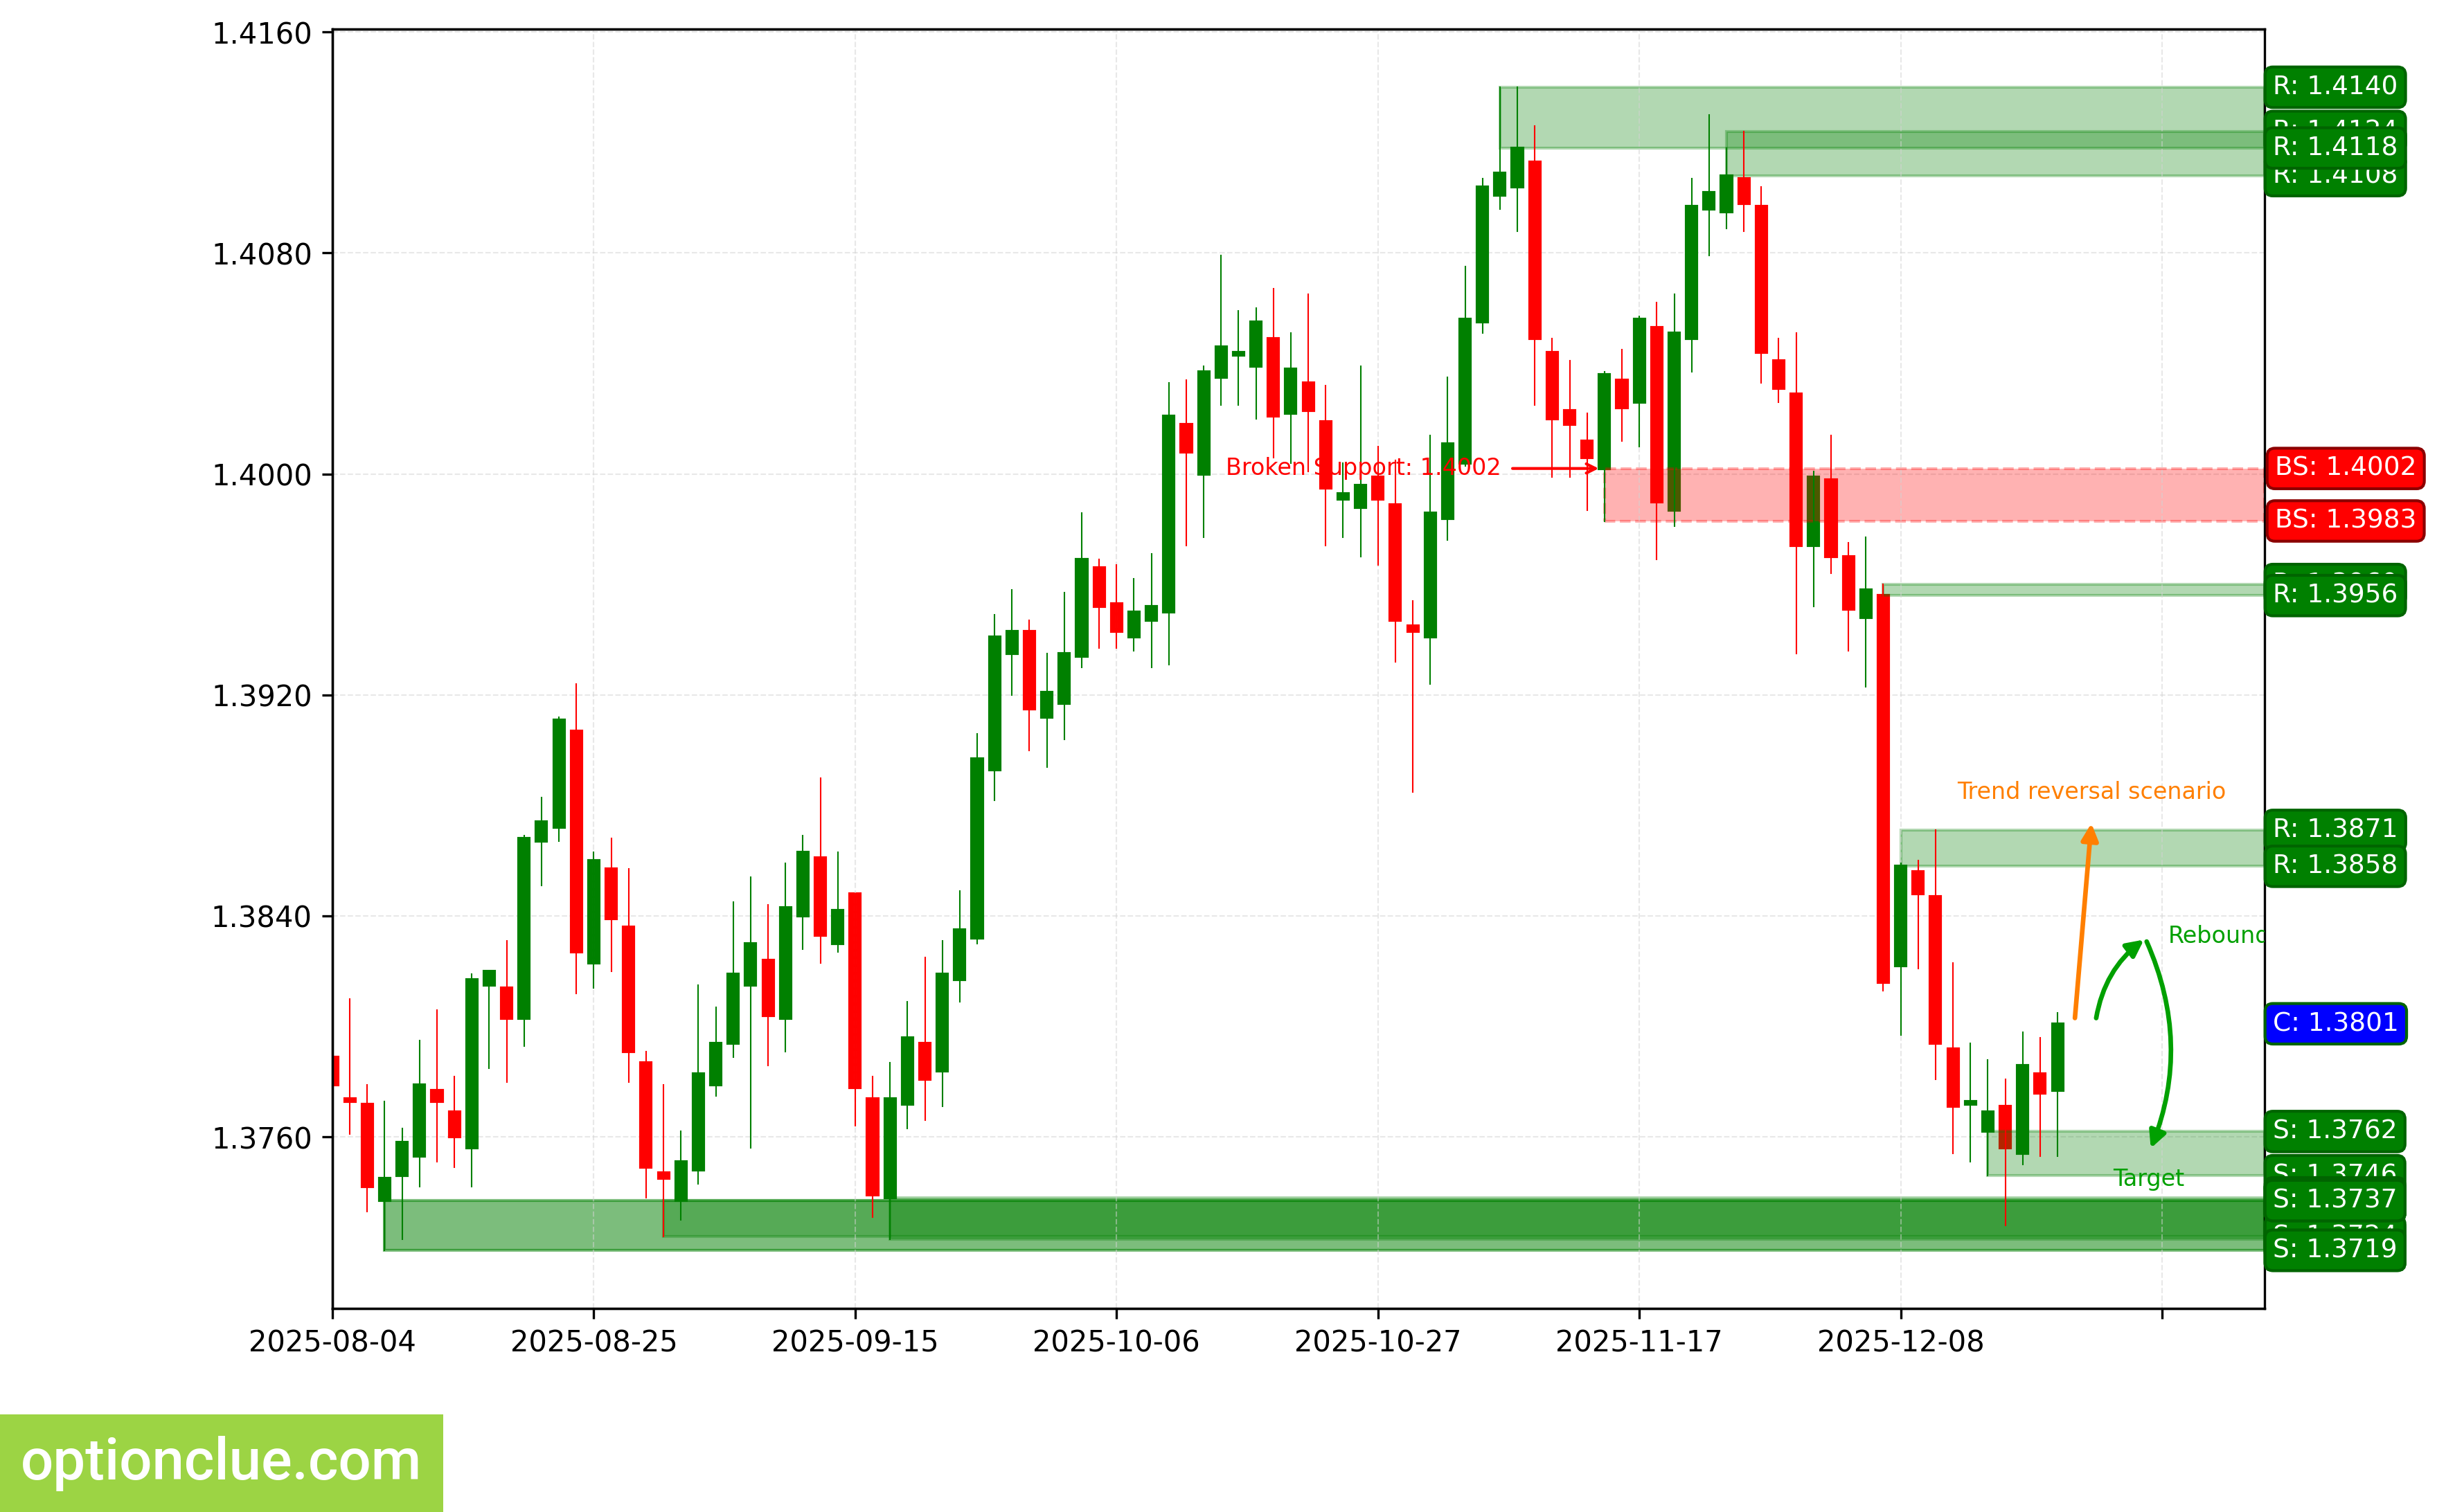
USDCAD. Technical Analysis. D1.
Australian Dollar (AUDUSD)
Bullish trend continues, corrective wave is developing. Entry point for buy on rebound may form after completion of current correction. Last broken level — resistance (0.6536 — 0.6580). Breakout happened 13 candlesticks ago.
Upon resumption of upside movement, first target will be the resistance level with boundaries 0.6676 — 0.6685.
If correction completes near the support level (0.6419 — 0.6439), potential profit/risk ratio may be around 4:1. If correction completes near the last broken level (0.6536 — 0.6580), potential profit/risk ratio may be small (around 0.6:1).
Long positions will remain relevant as long as the market is above the nearest support level with boundaries 0.6419 — 0.6439. If the market successfully closes below this nearest support, the trend will reverse to bearish.
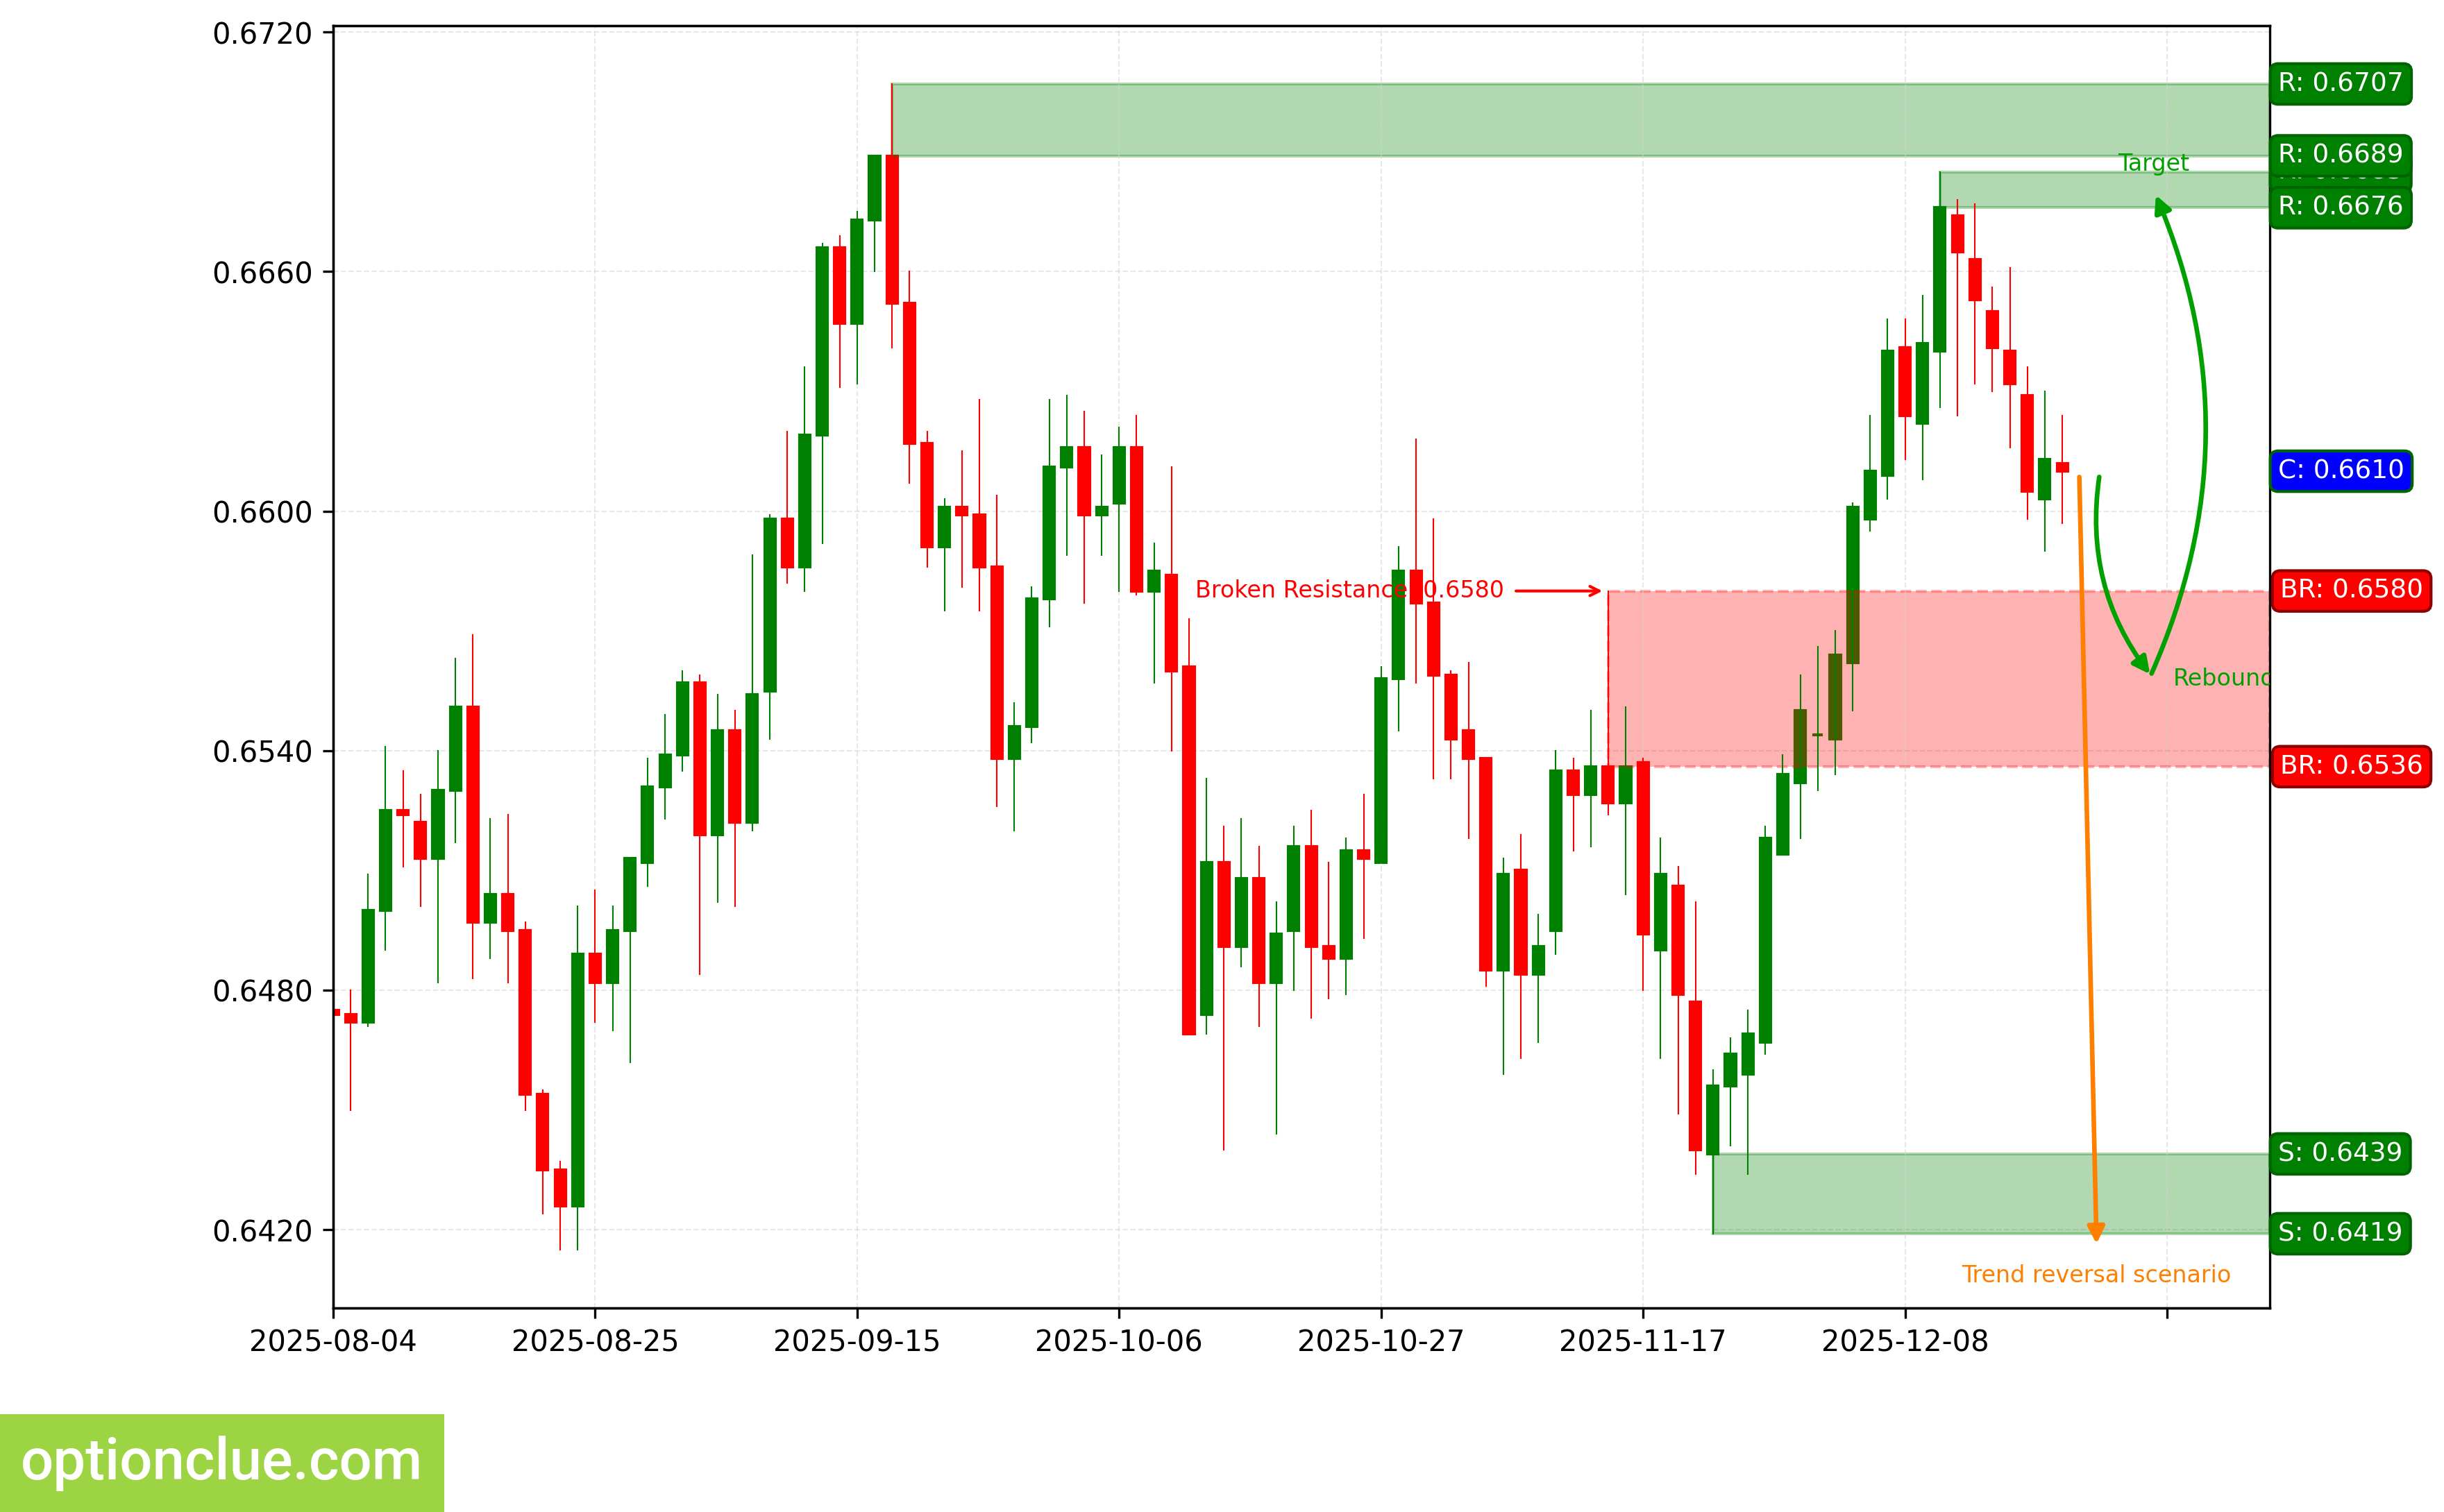
AUDUSD. Technical Analysis. D1.
Bitcoin (BTC)
Trend has reversed to bearish when support level (87800 — 89272) was broken. Breakout happened 4 candlesticks ago. 2 candlesticks ago, correction likely completed and entry point for sell on rebound formed, impulse wave is developing.
Intermediate target for downside movement is the support level with boundaries 80660 — 84648. In case of successful trend development, farther target will be at the support level with boundaries 74437 — 76272.
If correction completes near the resistance level (92695 — 94602), potential profit/risk ratio may be around 2:1. When using farther target — more than 3:1. If correction completes near the last broken level (87800 — 89272), potential profit/risk ratio may be small (around 0.4:1). When selecting farther target — insignificant (around 1.3:1).
Short positions will remain relevant as long as the market remains below the nearest resistance level with boundaries 92695 — 94602. If the market successfully closes above this nearest resistance, the trend will reverse to bullish.
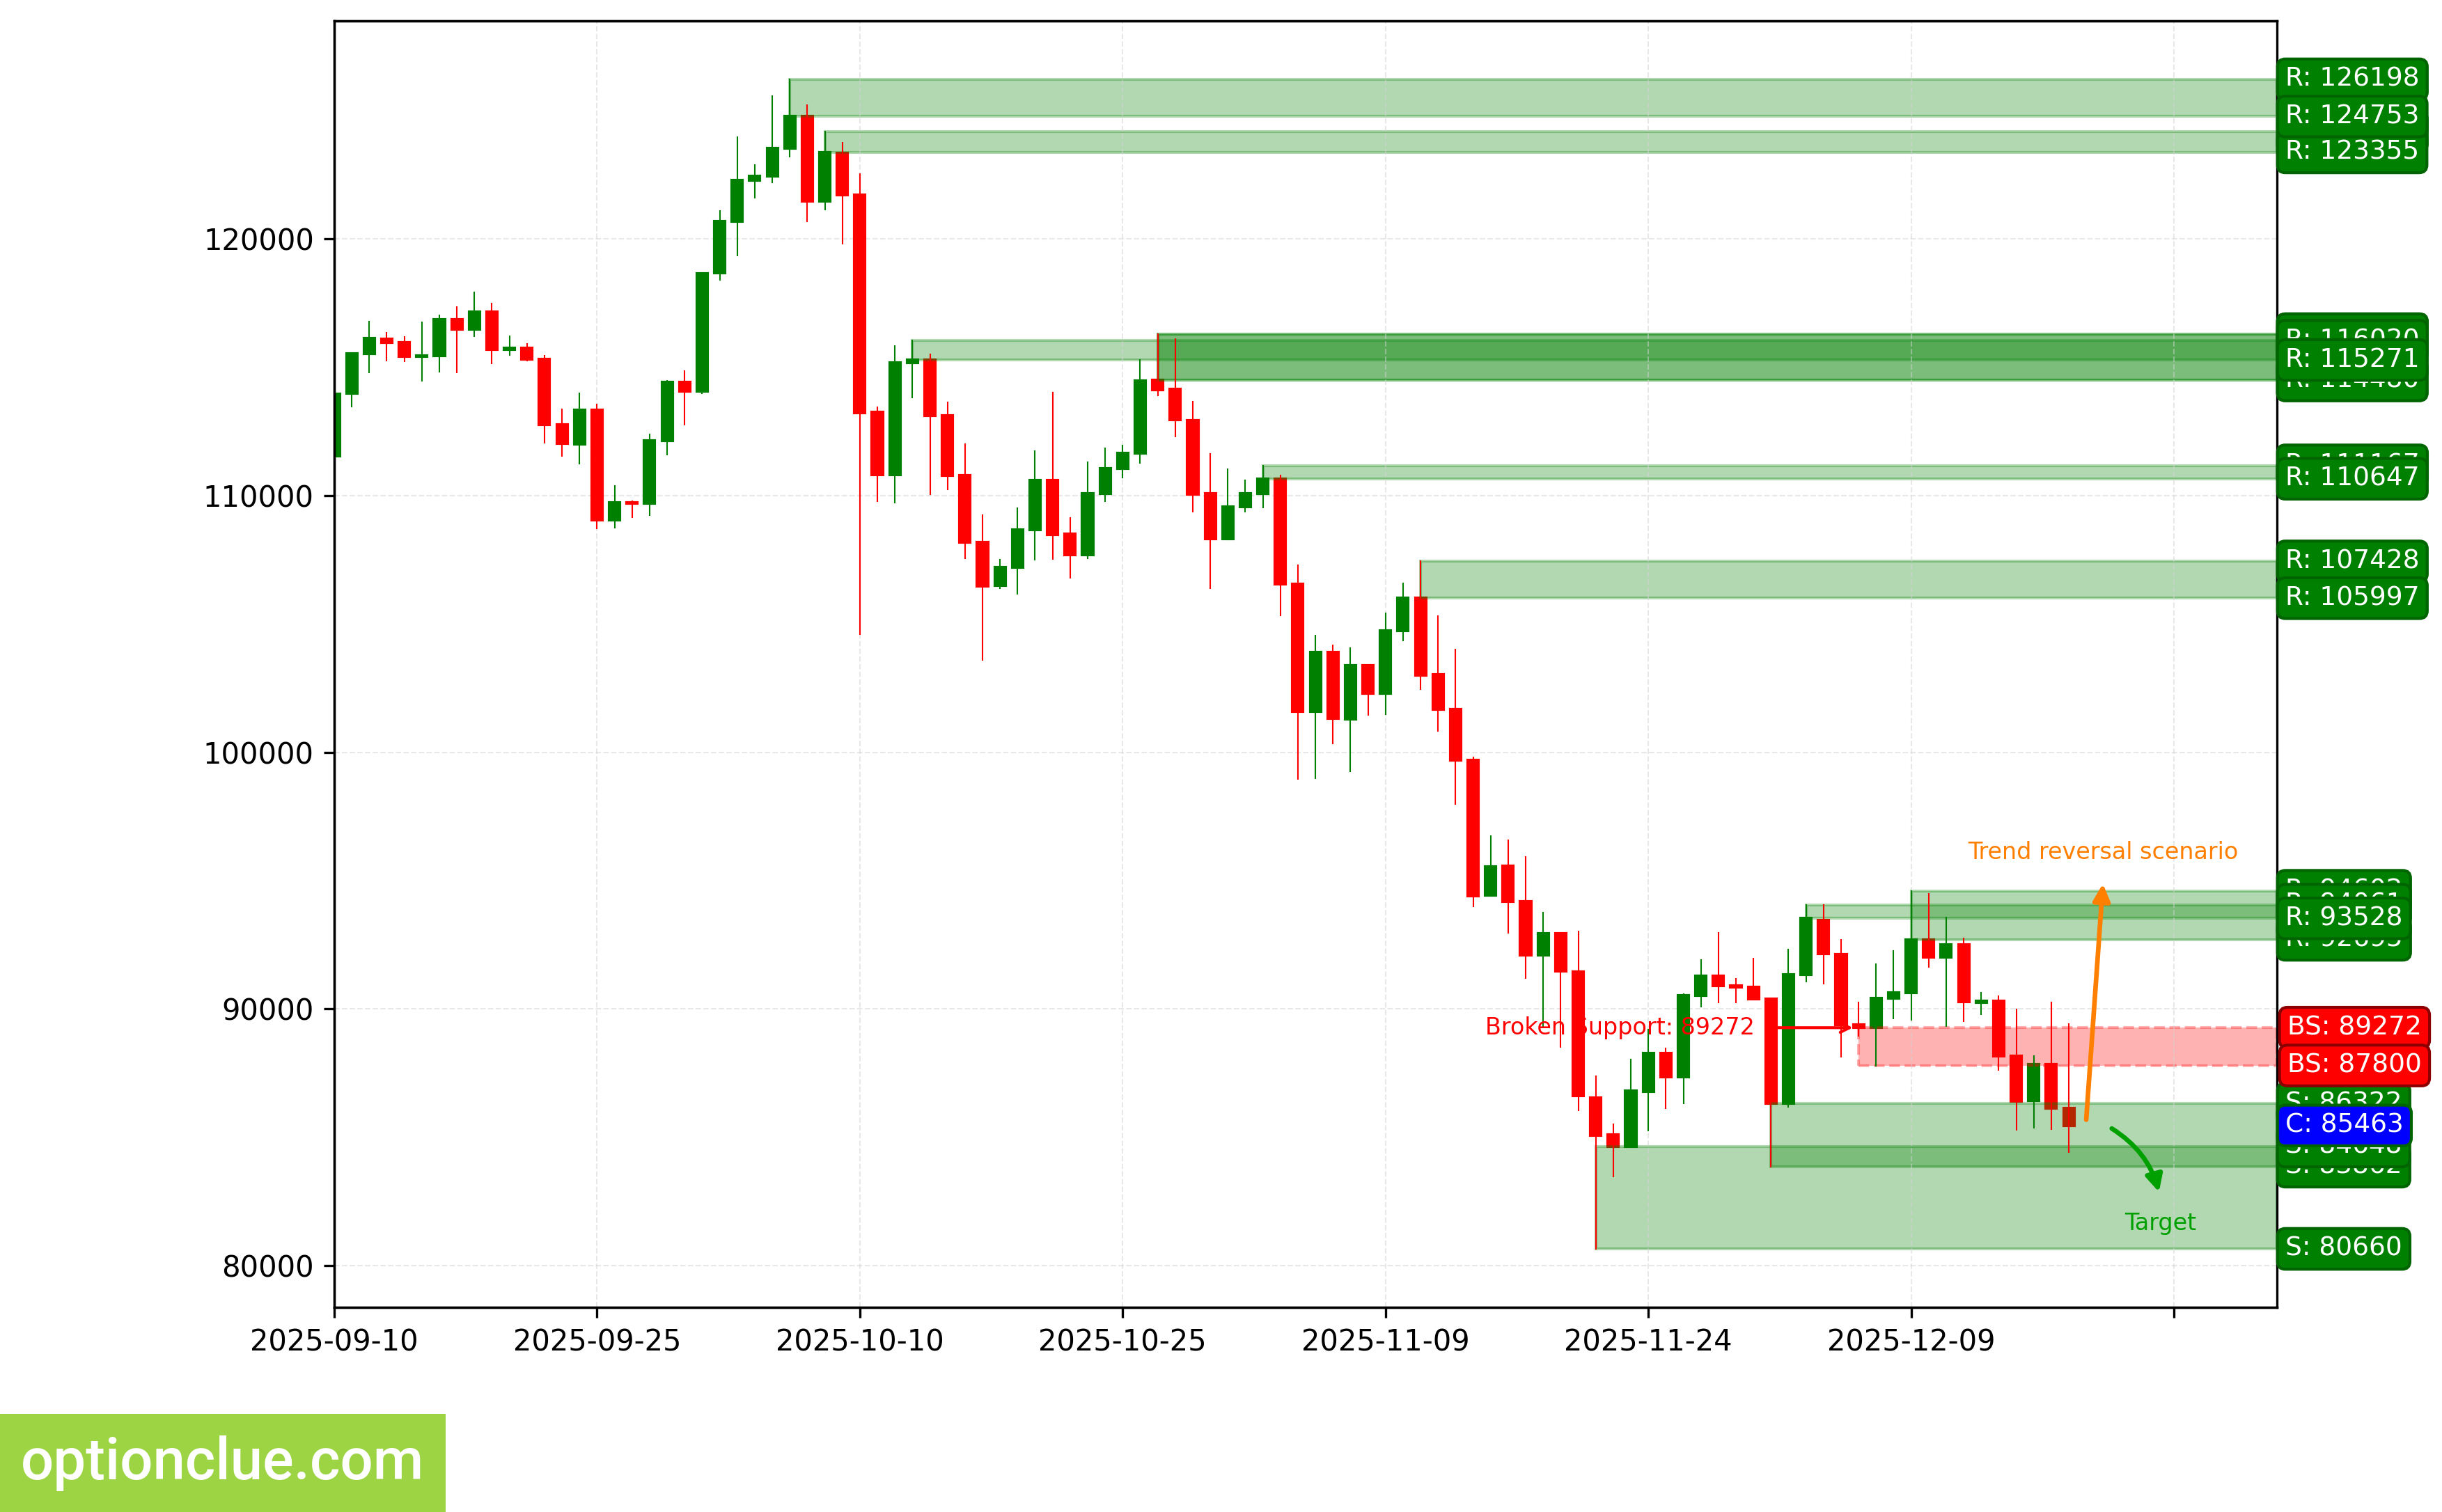
BTC. Technical Analysis. D1.
Ether (ETH)
Trend has reversed to bearish when 2 candlesticks ago support level (2931 — 3024) was broken. Impulse wave is developing. Sell entry points may appear after correction forms.
Intermediate target for downside movement is the support level with boundaries 2720 — 2800. In case of successful trend development, farther target will be at the support level with boundaries 2476 — 2508.
If correction completes near the resistance level (3325 — 3447), potential profit/risk ratio may be around 2.5:1. When using farther target — around 3.7:1. If correction completes near the last broken level (2931 — 3024), potential profit/risk ratio may be small (around 0.3:1). When selecting farther target — insignificant (around 0.7:1).
Short positions will remain relevant as long as the market remains below the nearest resistance level with boundaries 3325 — 3447. If the market successfully closes above this nearest resistance, the trend will reverse to bullish.
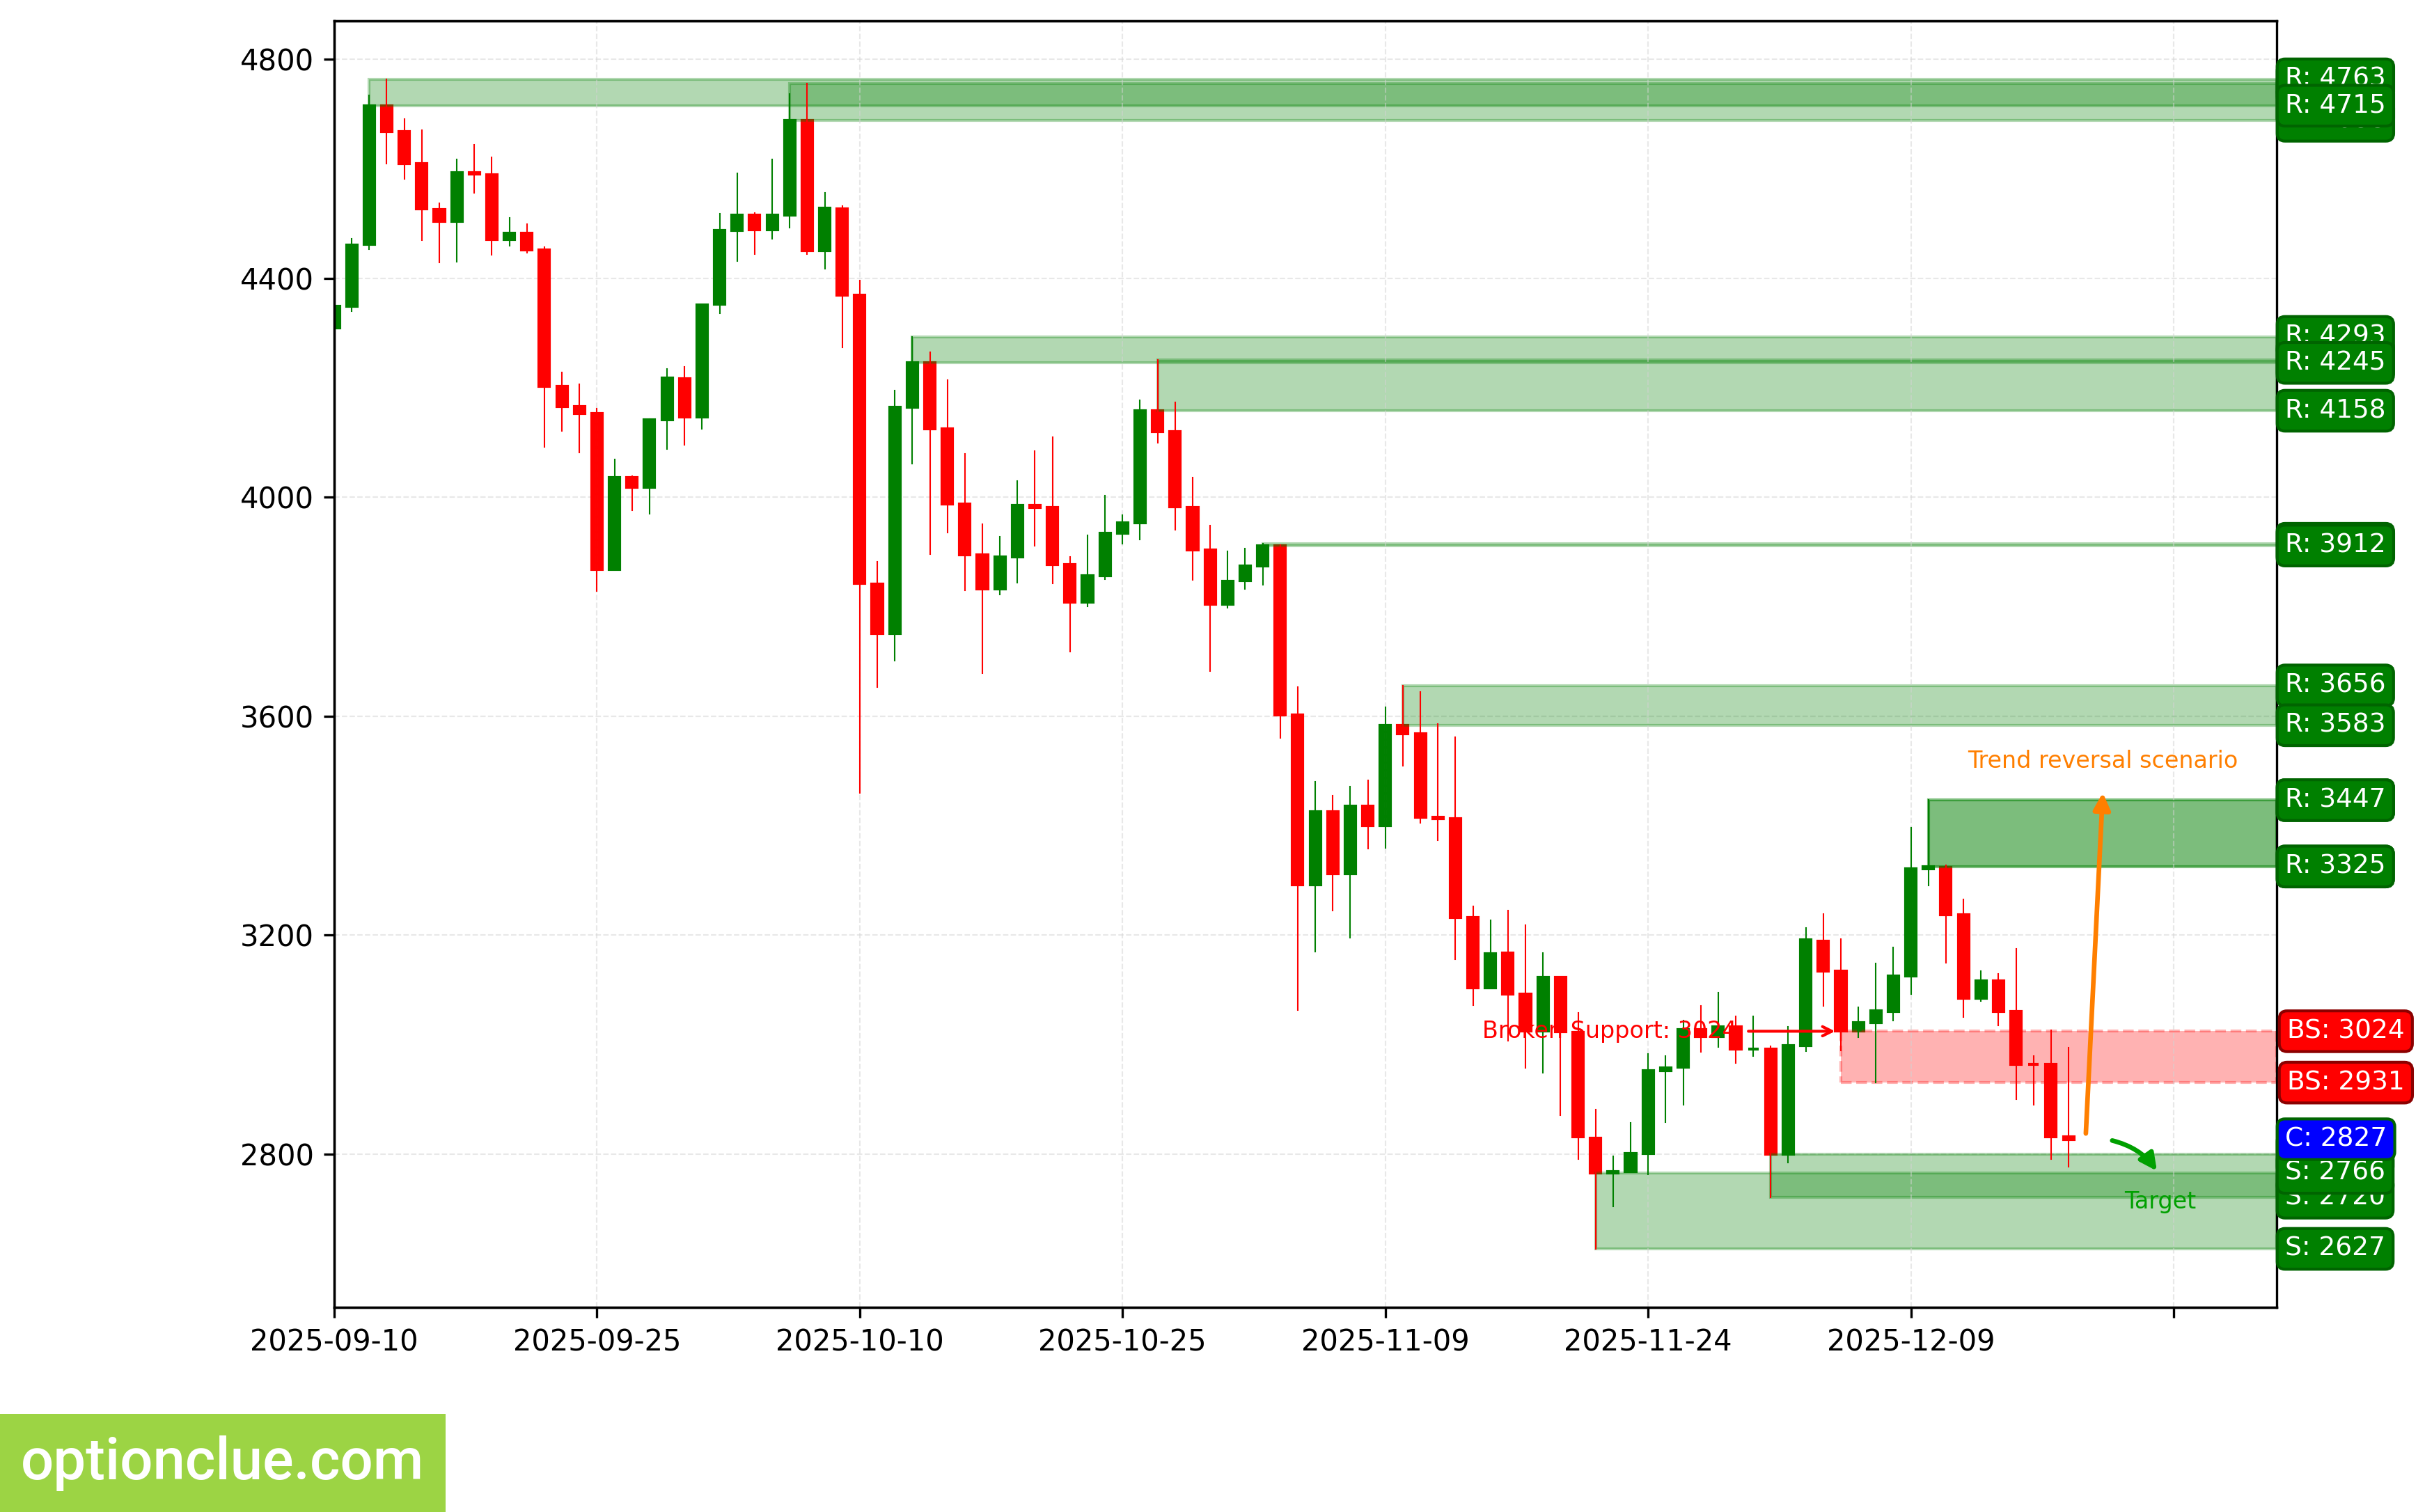
ETH. Technical Analysis. D1.
Apple Inc (AAPL)
Bullish trend continues, corrective wave is developing. Entry point for buy on rebound may form after completion of current correction. Last broken level — resistance (275.25 — 276.70). Breakout happened 18 candlesticks ago.
Upon resumption of upside movement, first target will be the resistance level with boundaries 286.20 — 288.62.
If correction completes near the support level (265.32 — 265.53), potential profit/risk ratio may be around 4:1.
Long positions will remain relevant as long as the market is above the nearest support level with boundaries 265.32 — 265.53. If the market successfully closes below this nearest support, the trend will reverse to bearish.
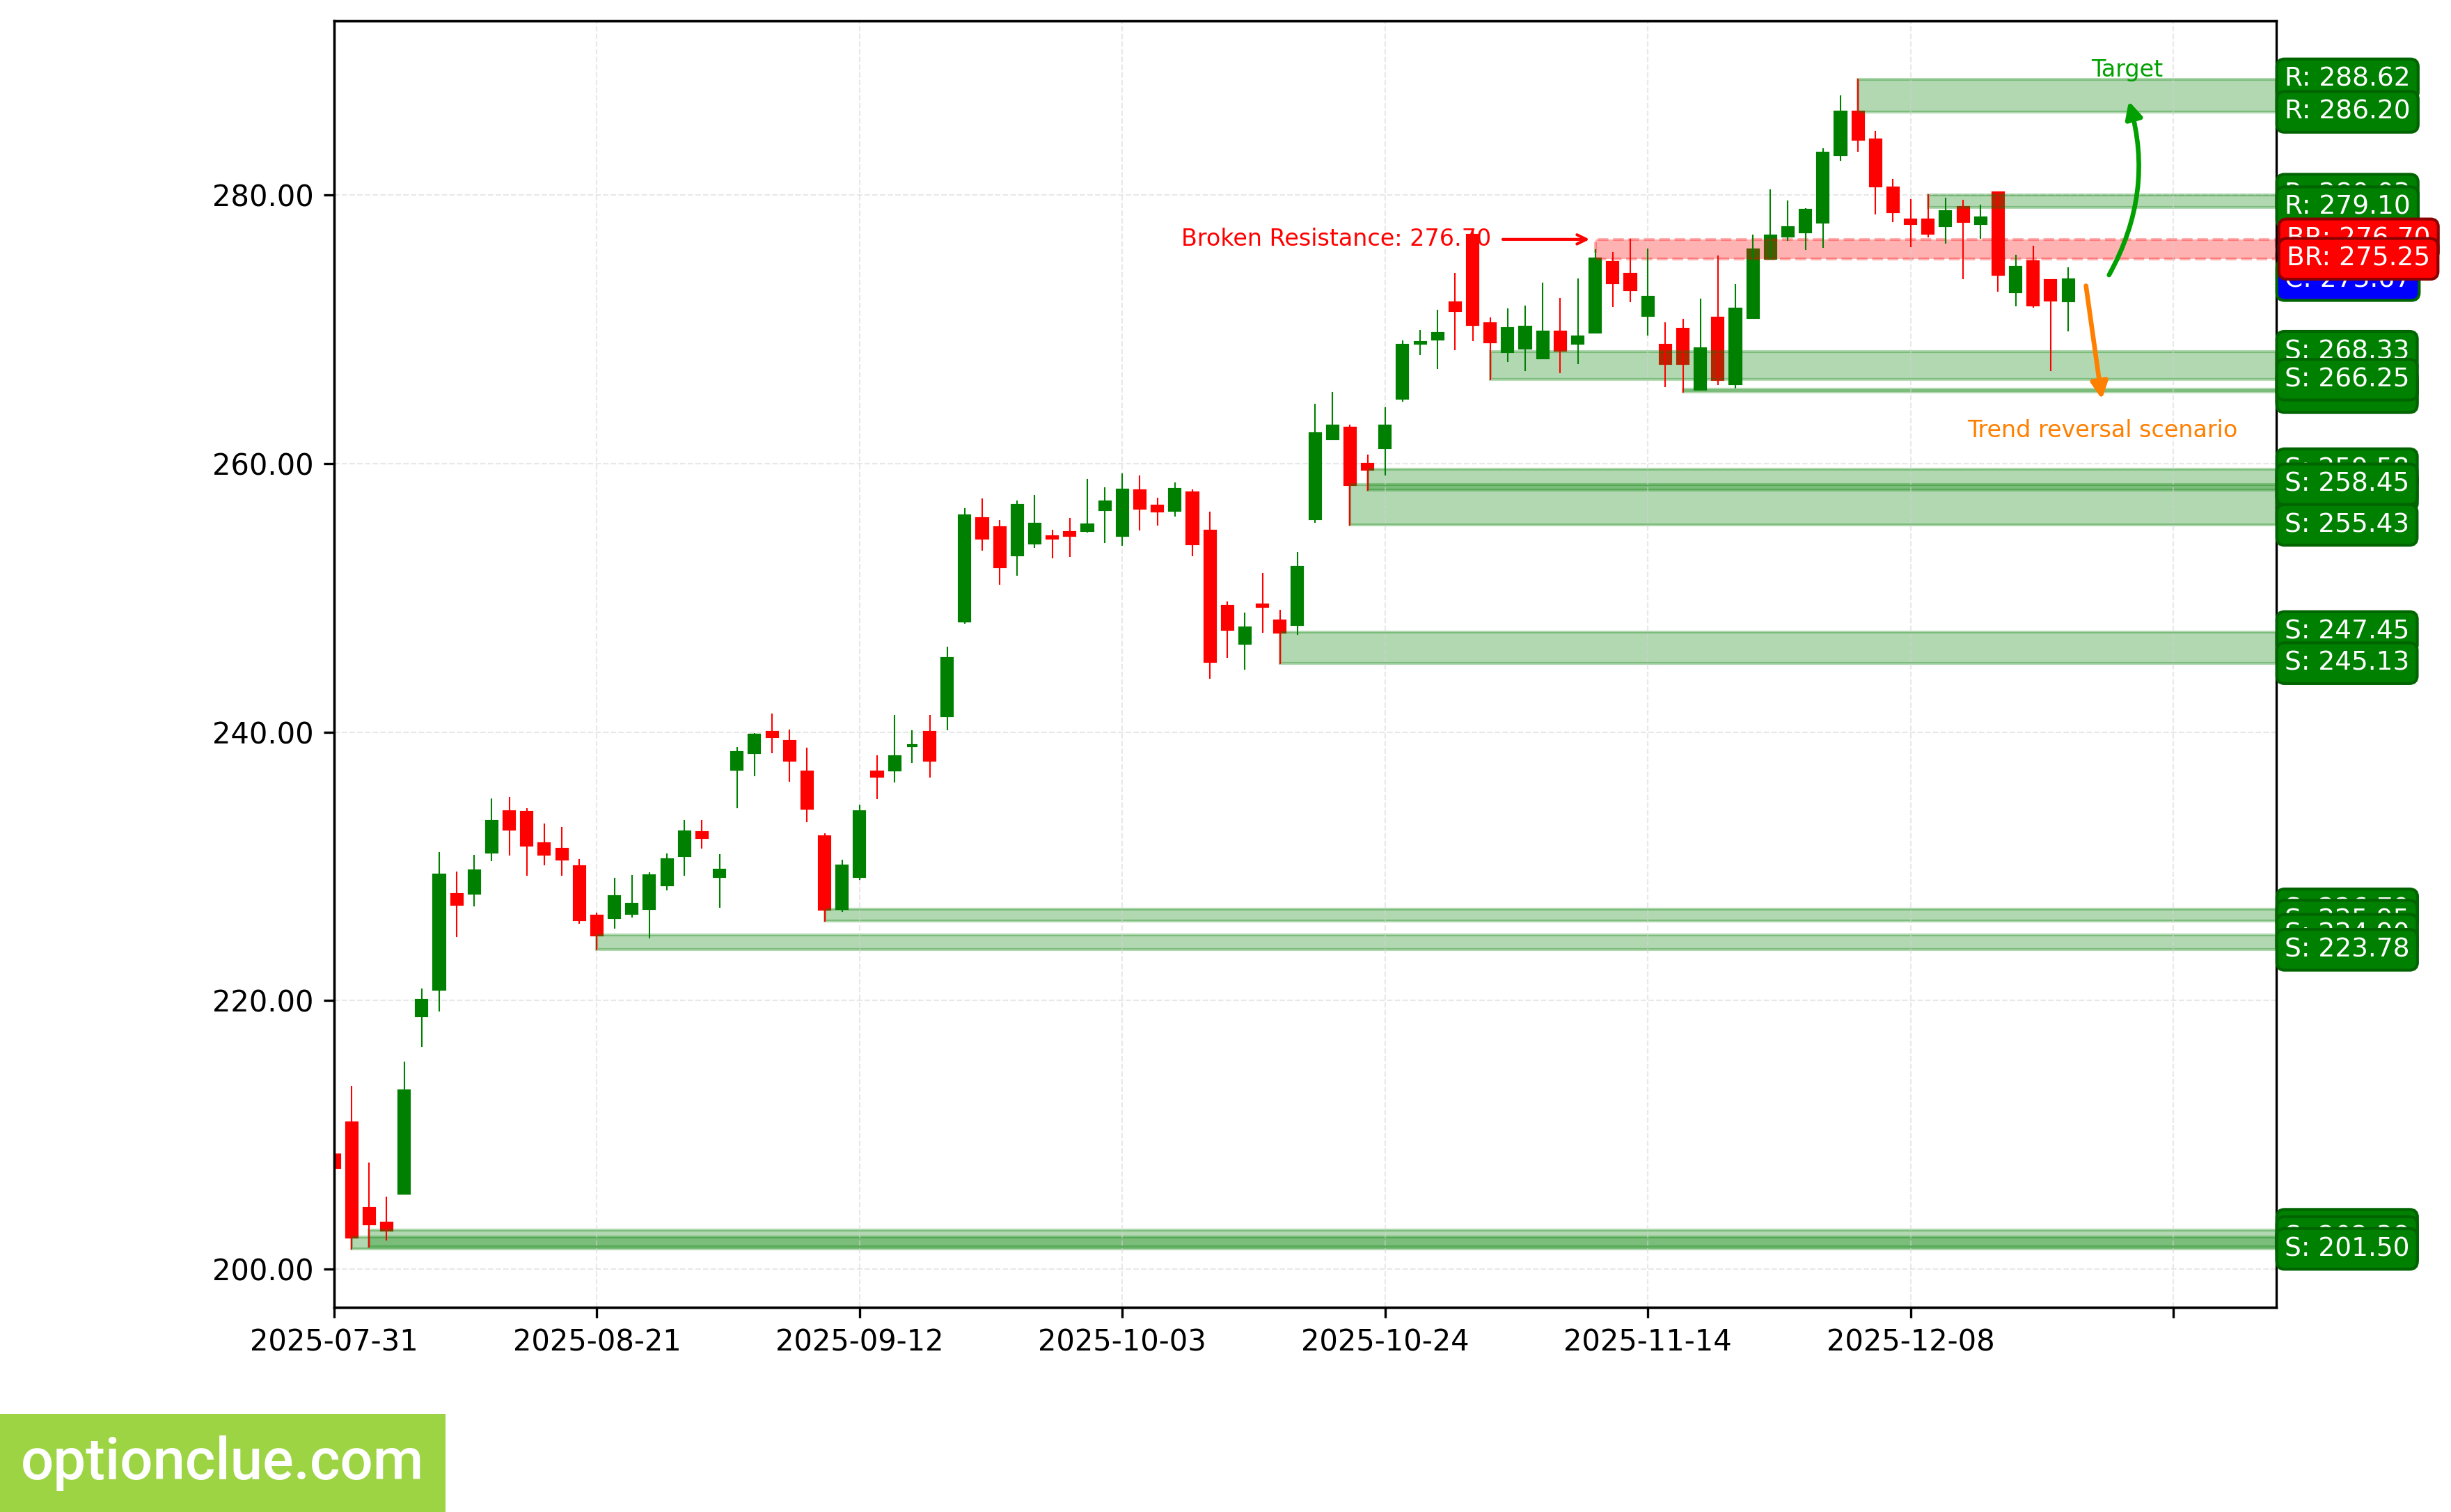
AAPL. Technical Analysis. D1.
NVIDIA Corp (NVDA)
Bearish trend continues, corrective wave is developing. Entry point for sell on rebound may form after completion of current correction. Last broken level — support (172.93 — 178.88). Breakout happened 3 candlesticks ago.
Intermediate target for downside movement is the support level with boundaries 170.31 — 170.94. In case of successful trend development, farther target will be at the support level with boundaries 164.07 — 167.02.
Potential profit/risk ratio from current prices when setting targets and fixing risks at daily timeframe levels may be insignificant (around 0.8:1). When using farther target — slightly more than 1:1. If correction completes near the resistance level (185.56 — 188.00), potential profit/risk ratio may be around 2:1. For farther target — around 3:1.
Short positions will remain relevant as long as the market remains below the nearest resistance level with boundaries 185.56 — 188.00. If the market successfully closes above this nearest resistance, the trend will reverse to bullish.
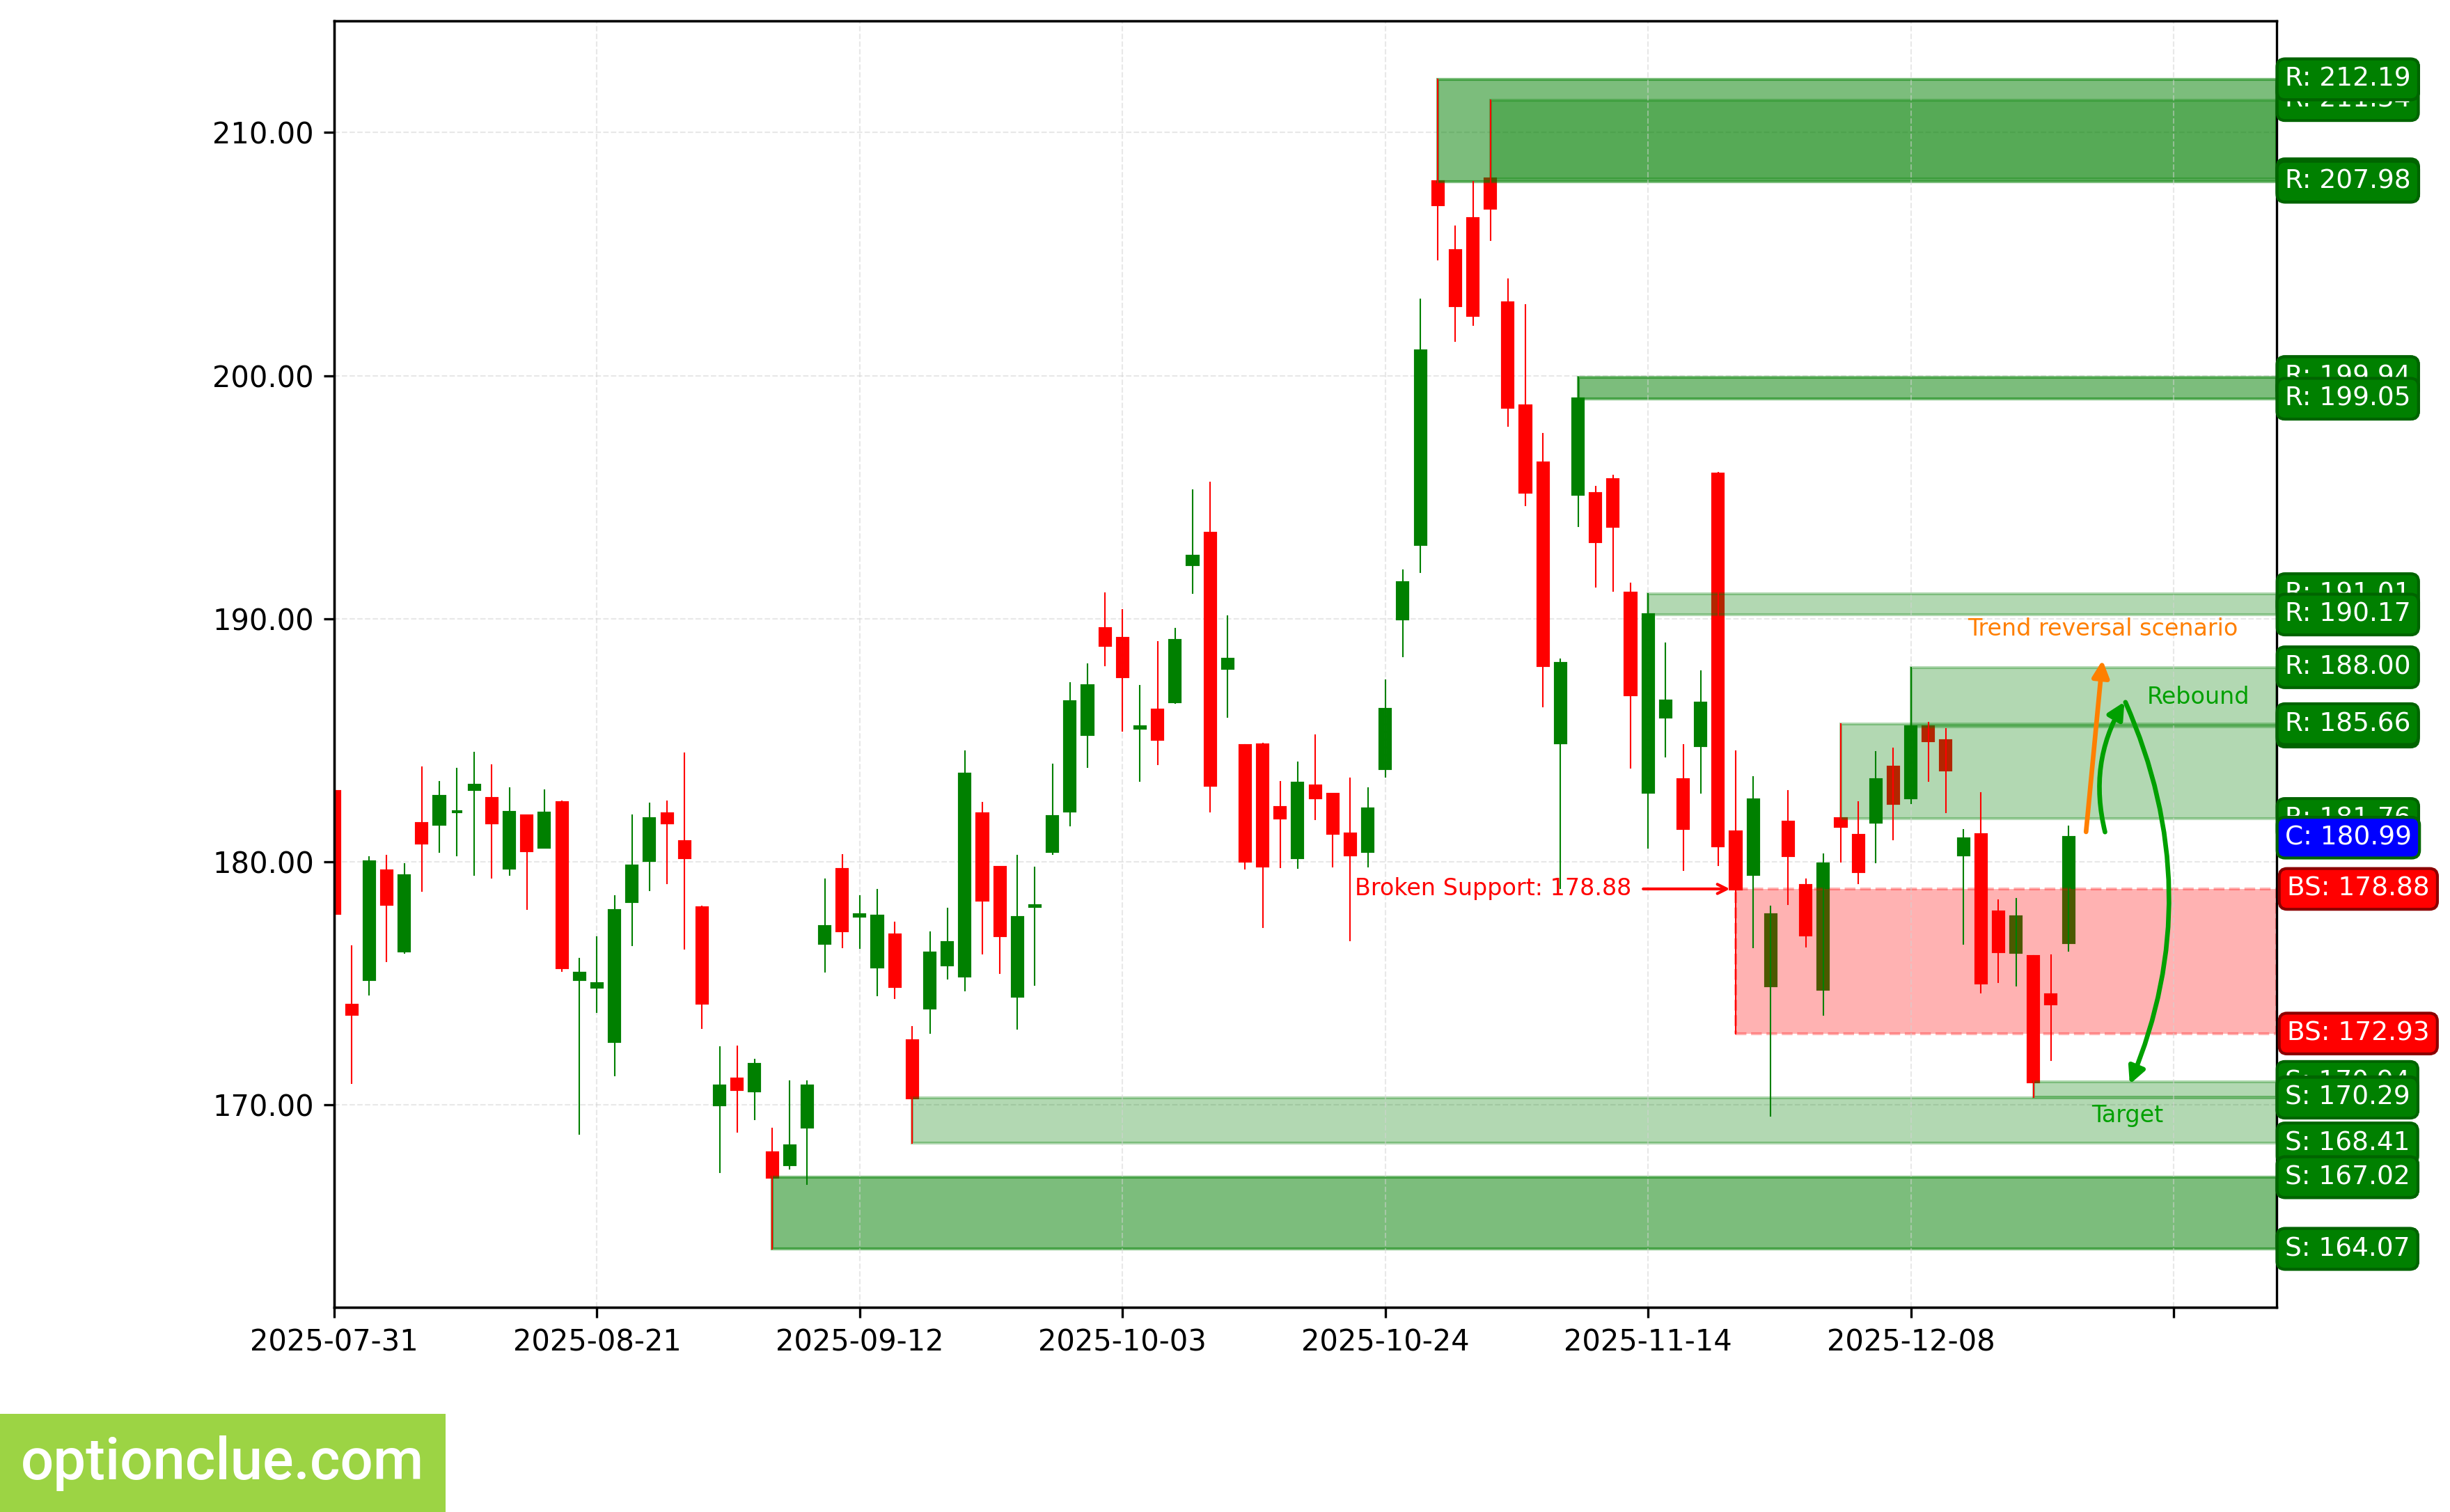
NVDA. Technical Analysis. D1.
Tesla Inc (TSLA)
Bullish trend continues, after rebound 6 candlesticks ago a weak impulse formed, now impulse wave is developing. Last broken level — resistance (442.15 — 442.49). Breakout happened 13 candlesticks ago.
Intermediate target for upside movement is the resistance level with boundaries 462.07 — 467.45.
Long positions will remain relevant as long as the market is above the nearest support level with boundaries 435.25 — 437.54. If the market successfully closes below this nearest support, the trend will reverse to bearish.
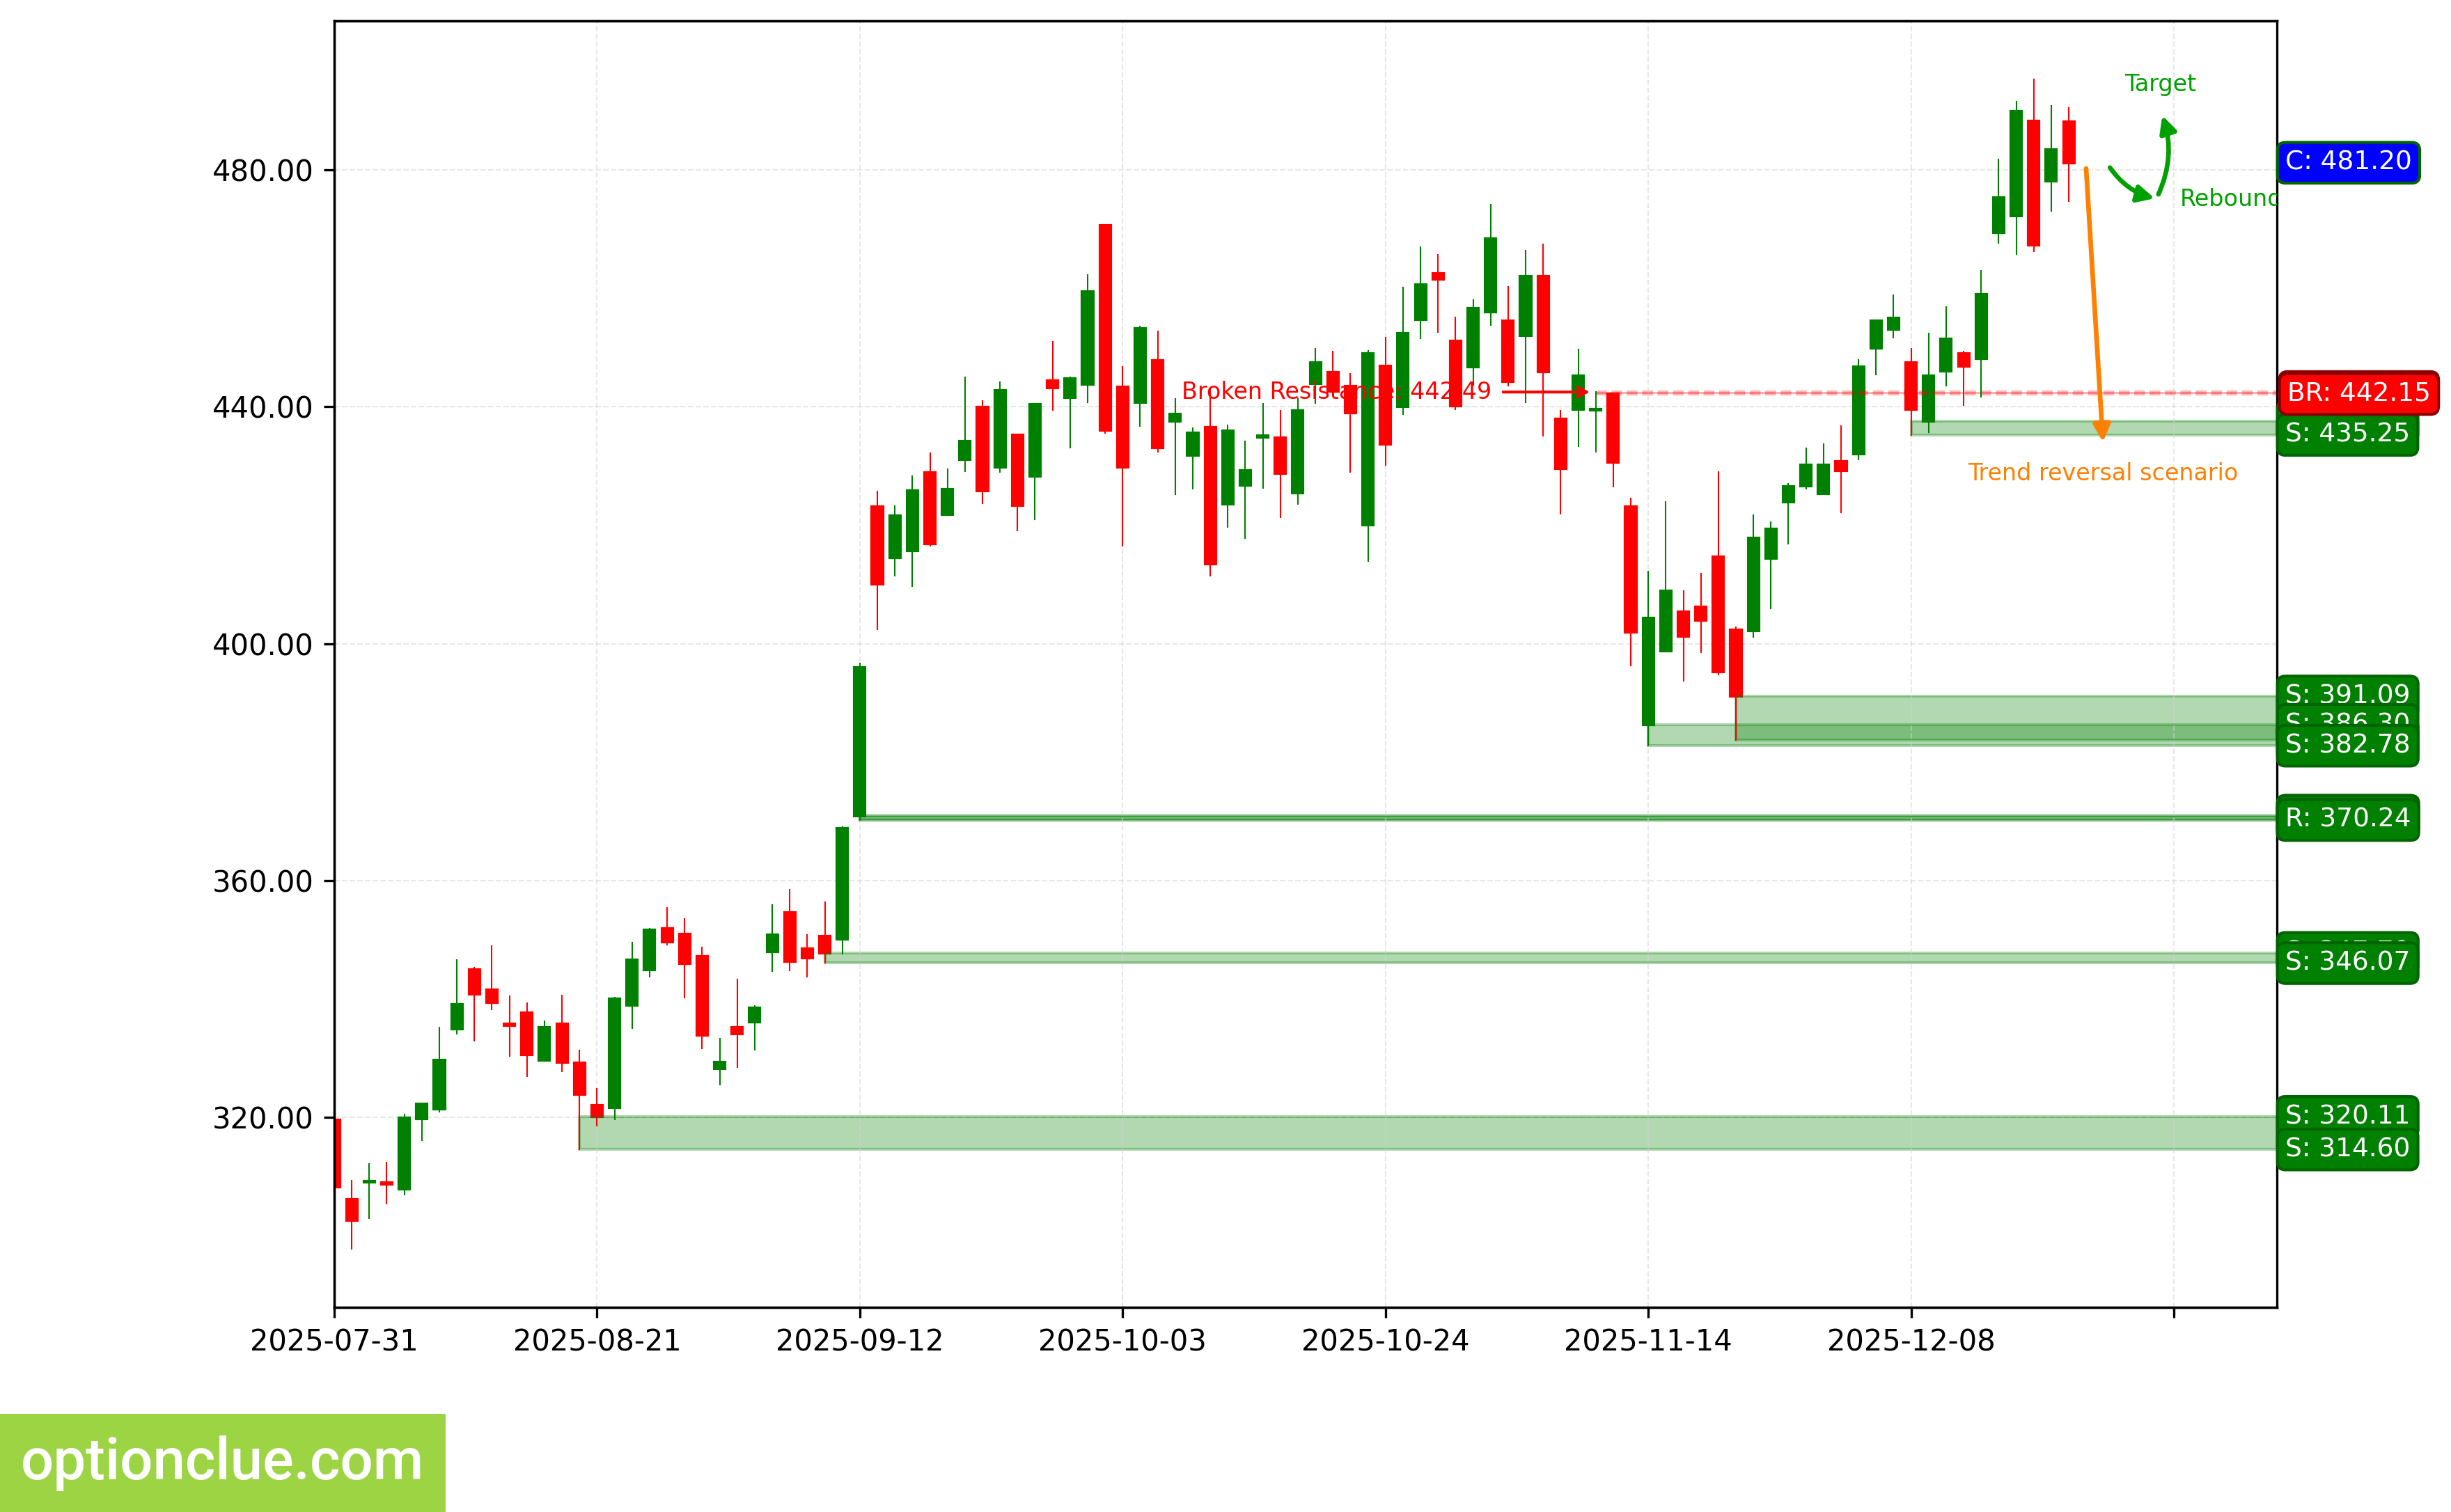
TSLA. Technical Analysis. D1.
Summary
From the perspective of medium-term trading, financial instruments with correction close to completion on Daily and/or potentially most promising profit-to-risk ratios include: EURUSD, USDCAD, AUDUSD, NVDA. Soon may be worth attention depending on the depth of market correction: USDJPY, TSLA.
The rest of the trading list financial instruments may also be interesting, but rebound signals on Daily on these markets will likely appear no earlier than in a week.