
This is a weekly market review based on technical analysis. We highlight strong horizontal levels and briefly explain what to expect from the market this week.
Key Topics
- Euro (EURUSD)
- British Pound (GBPUSD)
- Swiss Franc (USDCHF)
- Japanese Yen (USDJPY)
- Canadian Dollar (USDCAD)
- Australian Dollar (AUDUSD)
- New Zealand Dollar (NZDUSD)
- Bitcoin (BTC)
- Ether (ETH)
- Apple Inc (AAPL)
- NVIDIA Corp (NVDA)
- Tesla Inc (TSLA)
- Summary
Euro (EURUSD)
The bearish trend continues; a correction ended on Friday near the last broken level (1.1645 — 1.1665).
An impulse wave is now developing. The intermediate target for the downward movement is the support level with boundaries at 1.1540 — 1.1568.
If the market successfully establishes itself below this support, it will open the way for the price to move toward target #2 — the support level with boundaries at 1.1389 — 1.1404. Short positions may remain relevant as long as the price stays below the nearest resistance level with boundaries at 1.1733 — 1.1778.
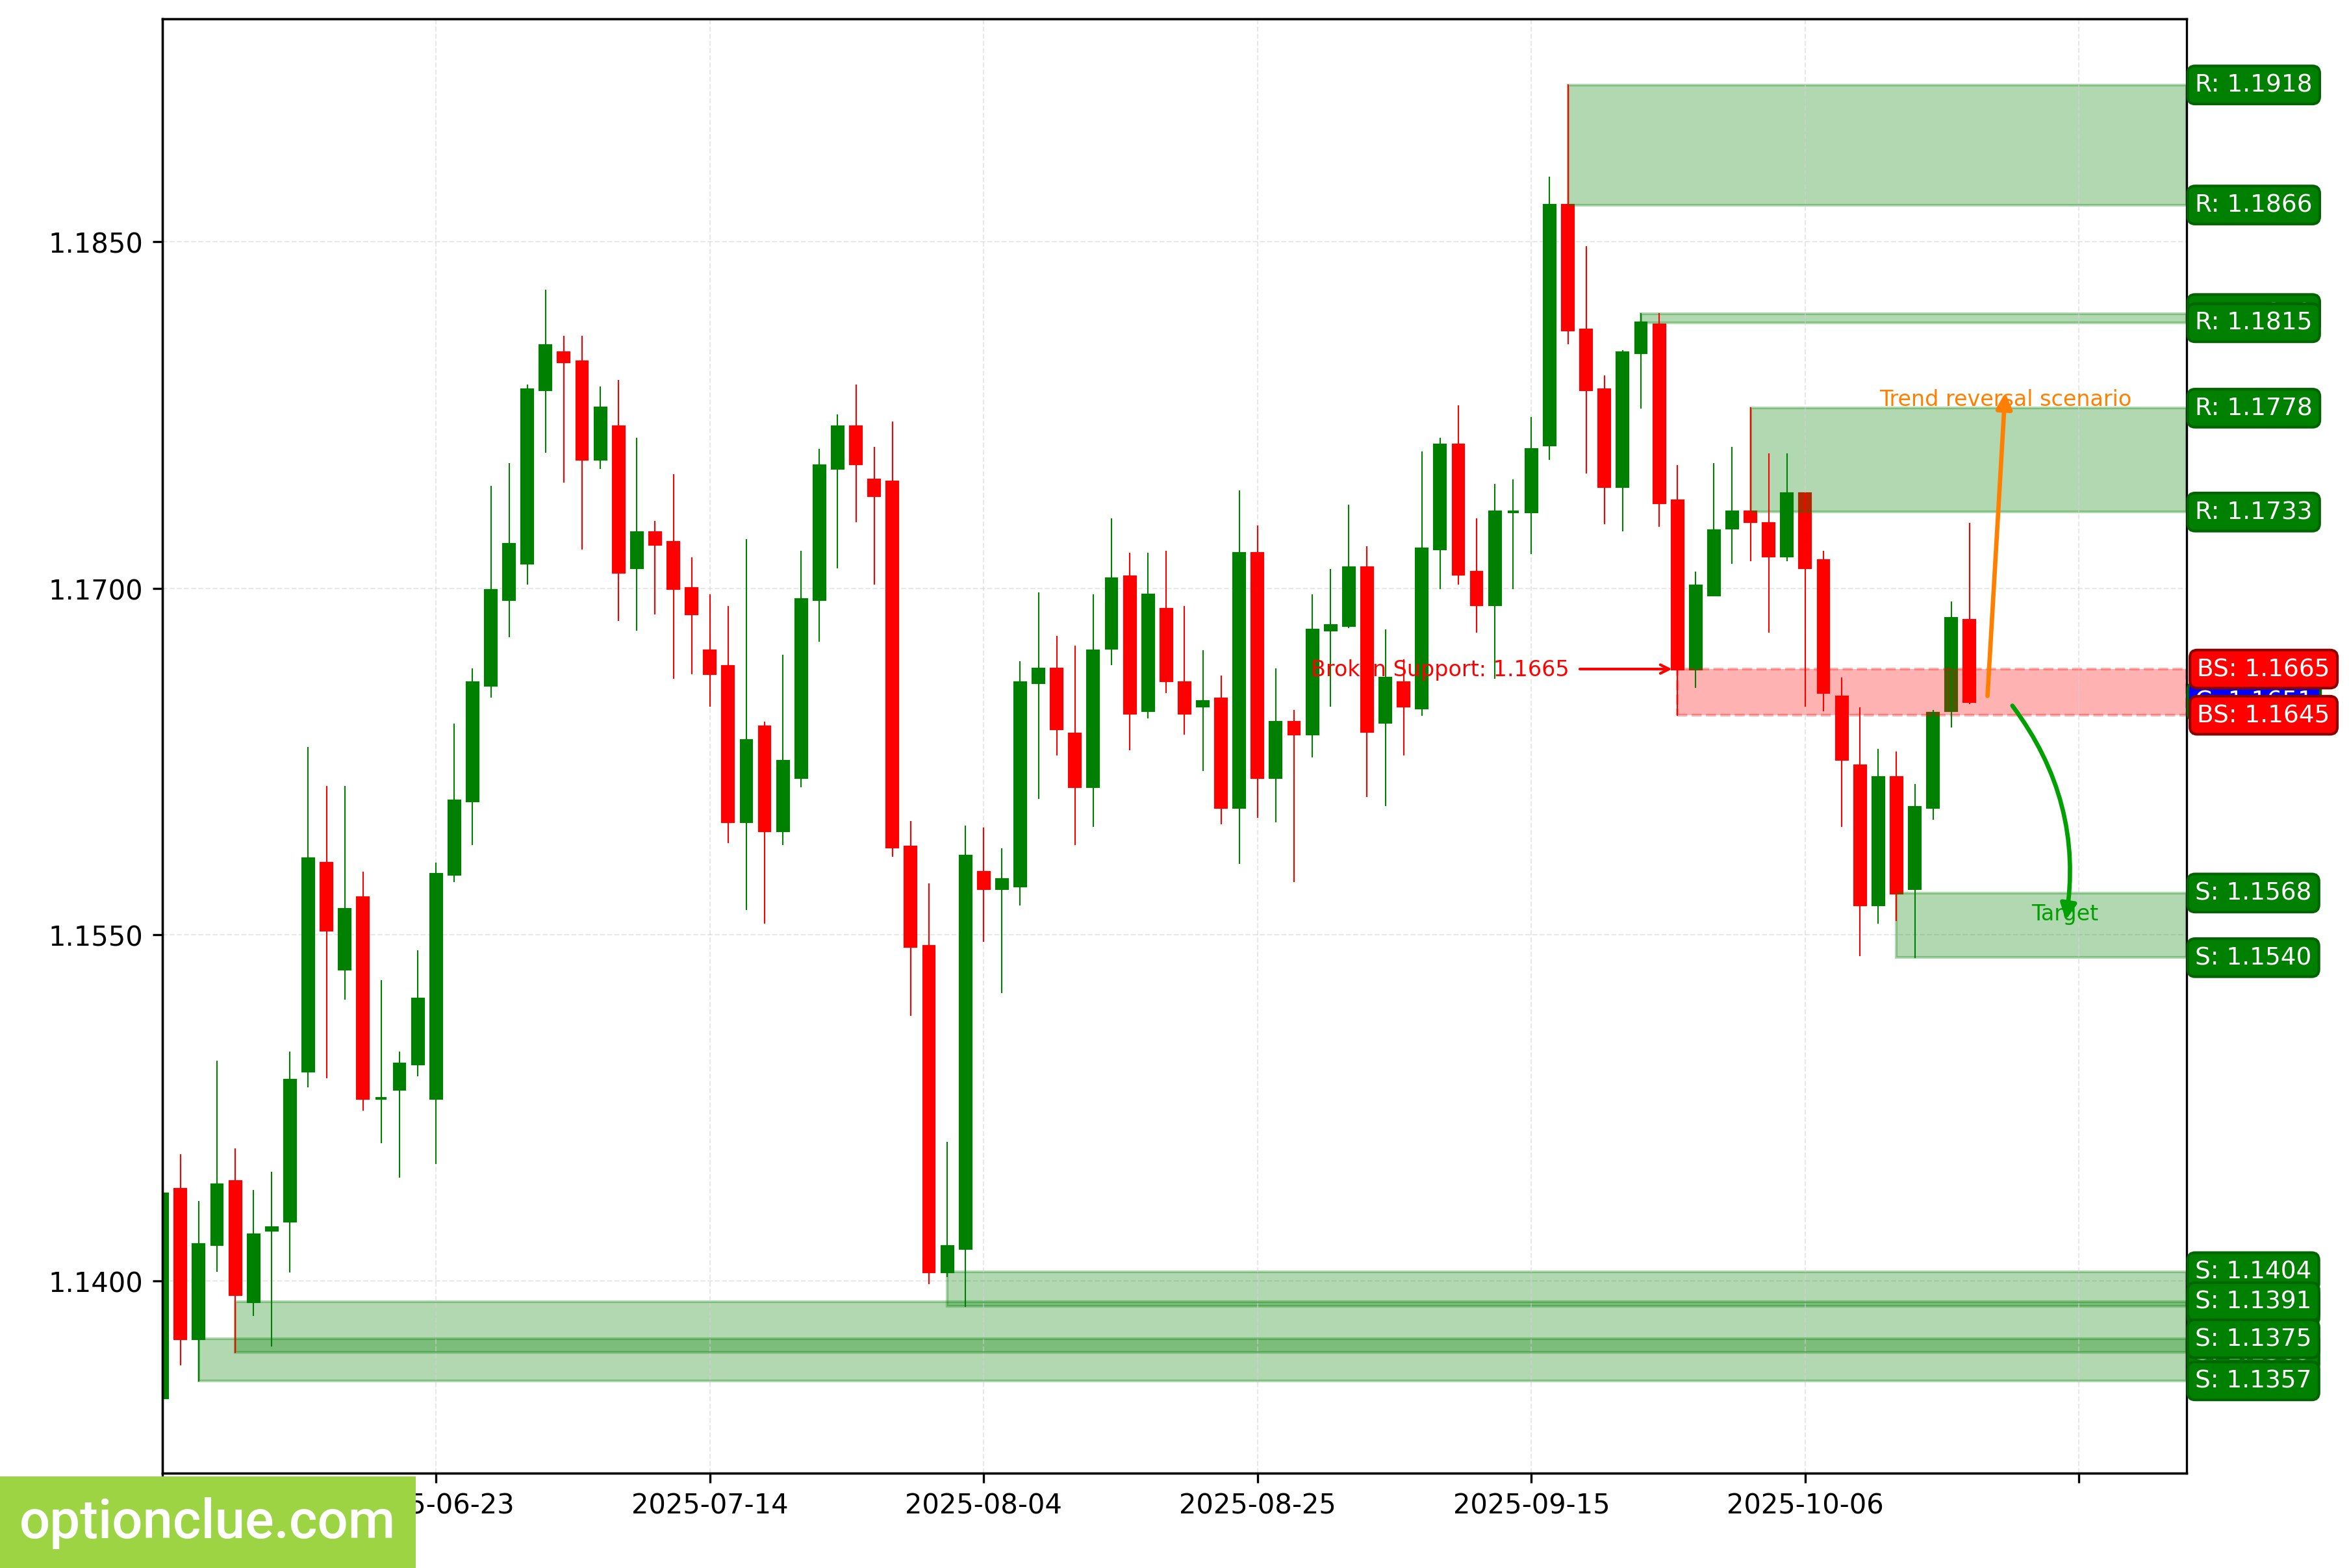
EURUSD. Technical analysis. D1.
British Pound (GBPUSD)
The trend has changed to bullish, as a resistance level formed last week and was then broken (1.3358 — 1.3370).
A correction is developing on the daily timeframe. A buy entry on a rebound may appear after it completes.
Upon resumption of the upward movement, the first target will be the resistance with boundaries at 1.3484 — 1.3490. If the trend develops successfully, a more distant target will be at the resistance level of 1.3477 — 1.3527.
Long positions will remain relevant as long as the market is above the nearest daily timeframe support level with boundaries at 1.3245 — 1.3316. A breach of this level would indicate a trend reversal.
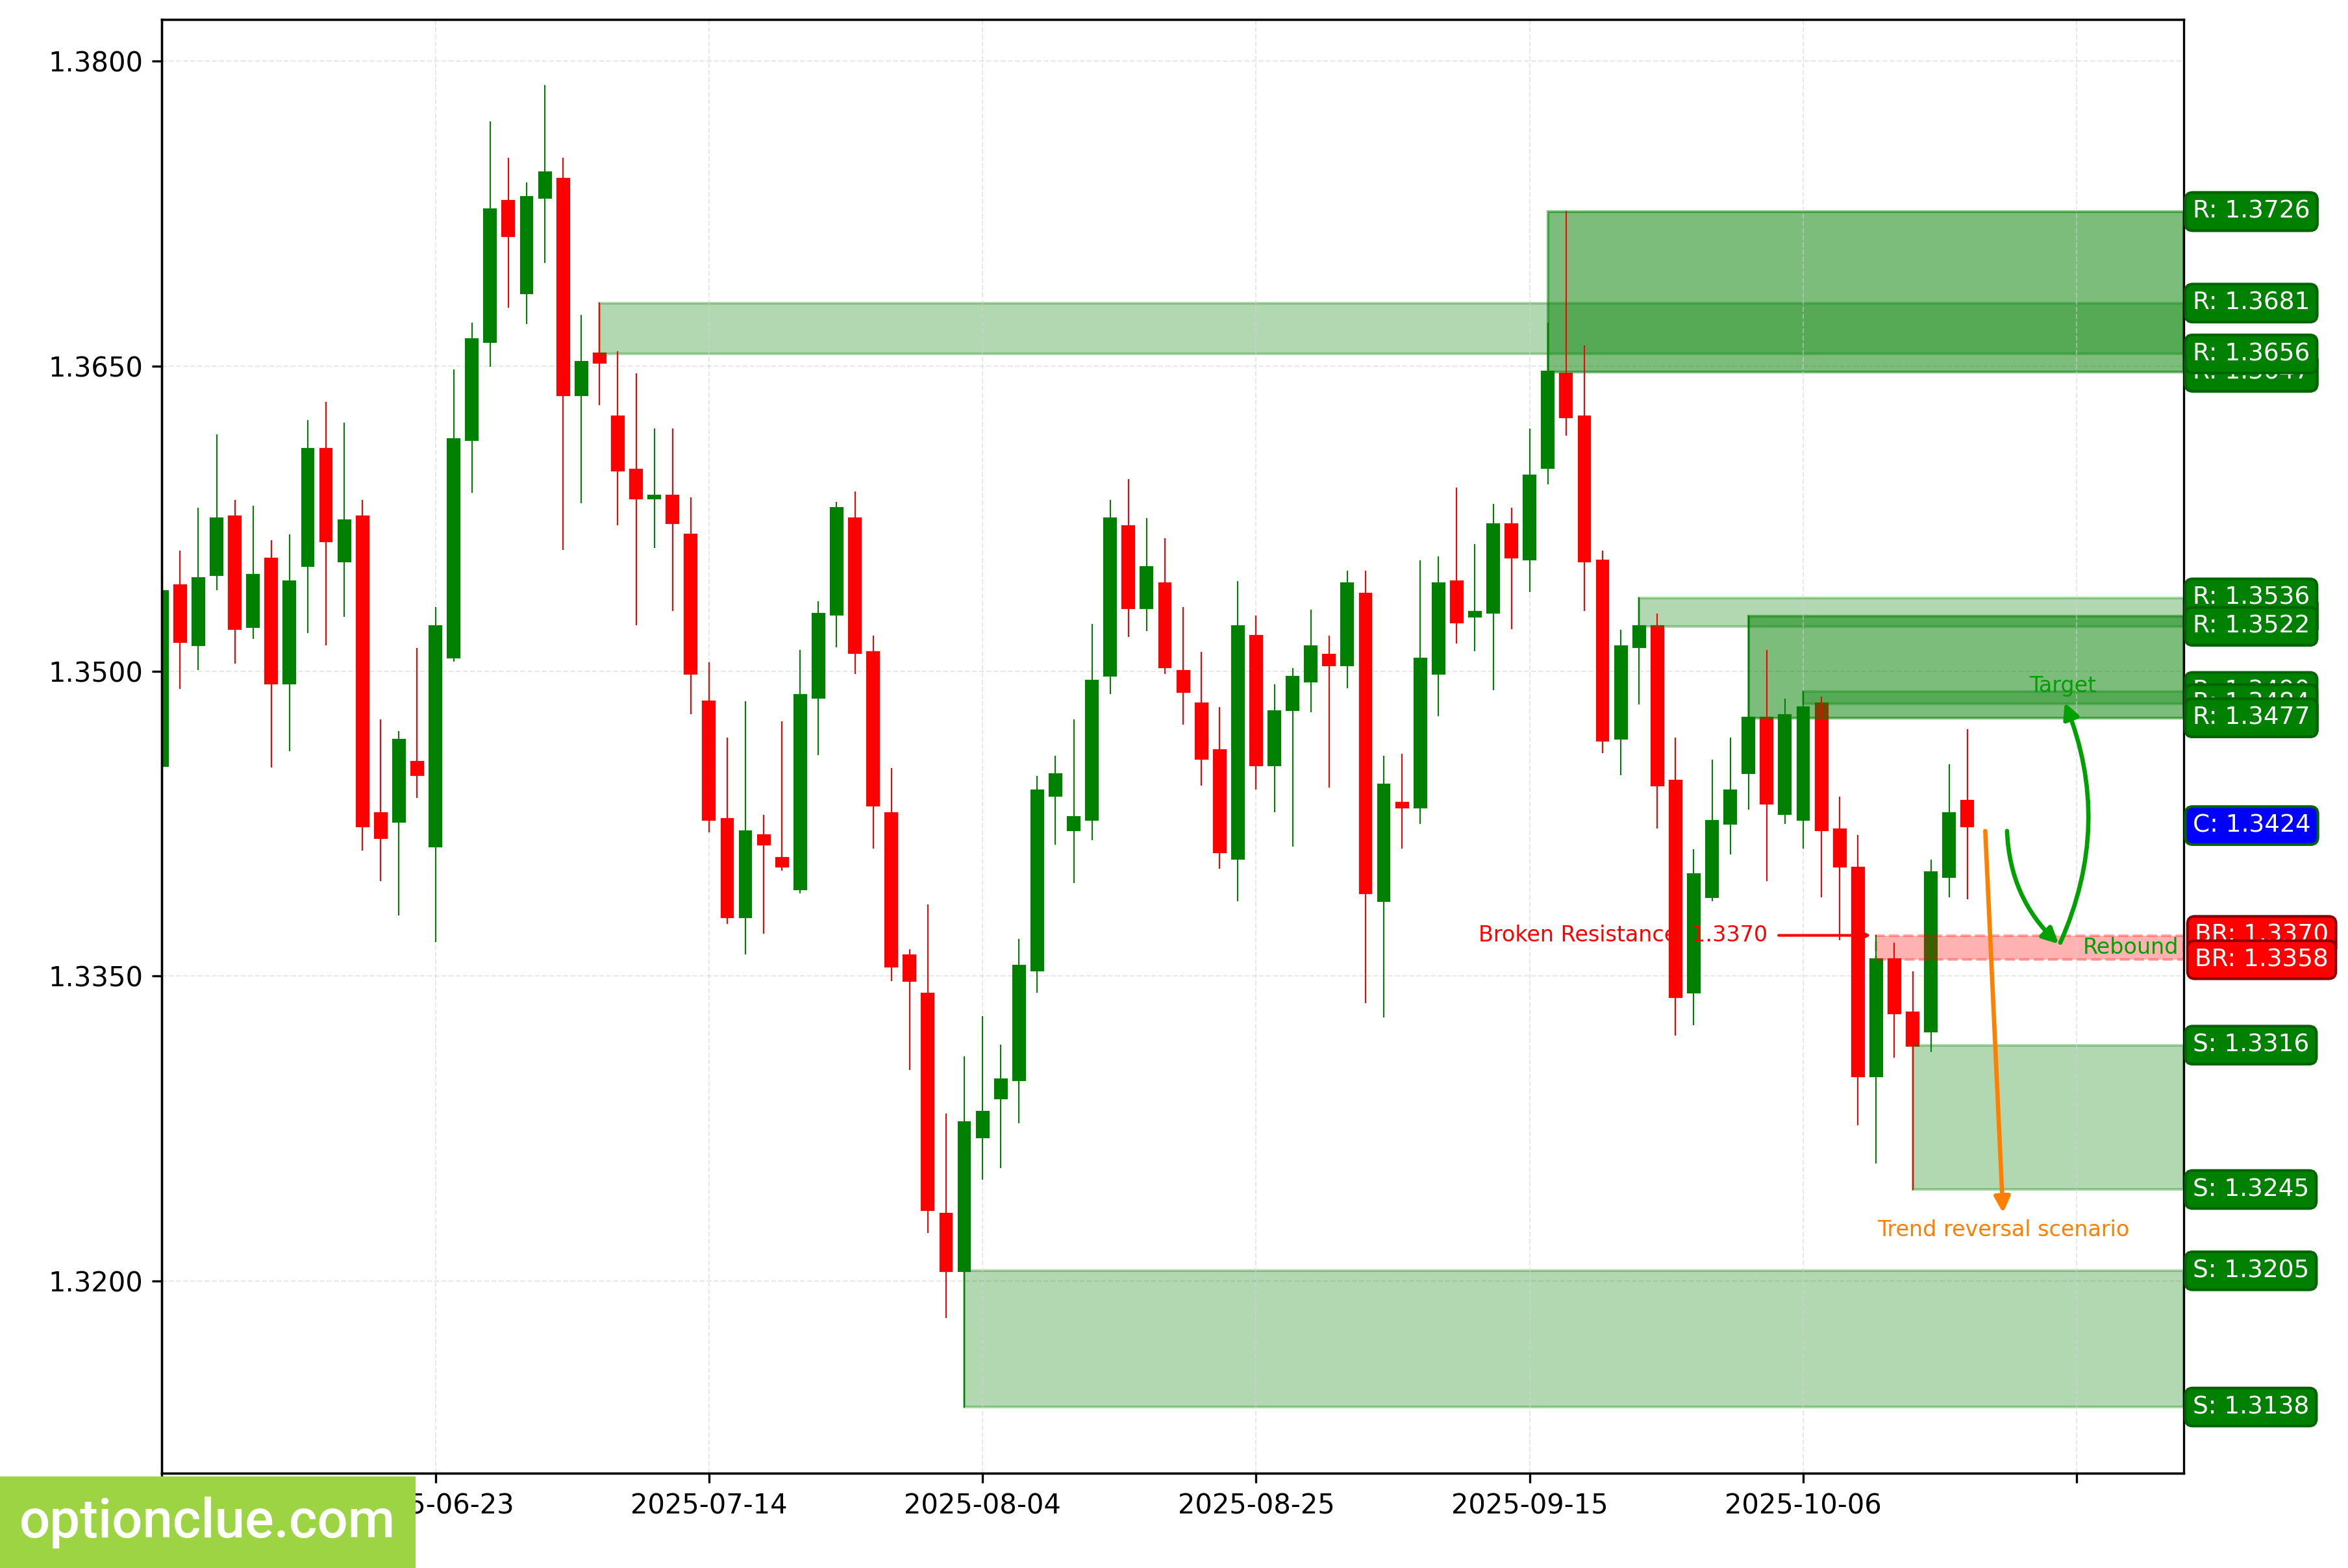
GBPUSD. Technical analysis. D1.
Swiss Franc (USDCHF)
The trend changed to bearish when the support level at 0.7987 — 0.7989 was broken last week.
A sell entry on a rebound may appear after the correction completes. The intermediate target for the downward movement is the support level with boundaries at 0.7906 — 0.7910.
If the trend develops successfully, a more distant target will be at the support level with boundaries at 0.7827 — 0.7855. Short positions will remain relevant as long as the market stays below the nearest daily timeframe resistance level with boundaries at 0.8053 — 0.8072. A breach of this level would indicate a trend reversal.
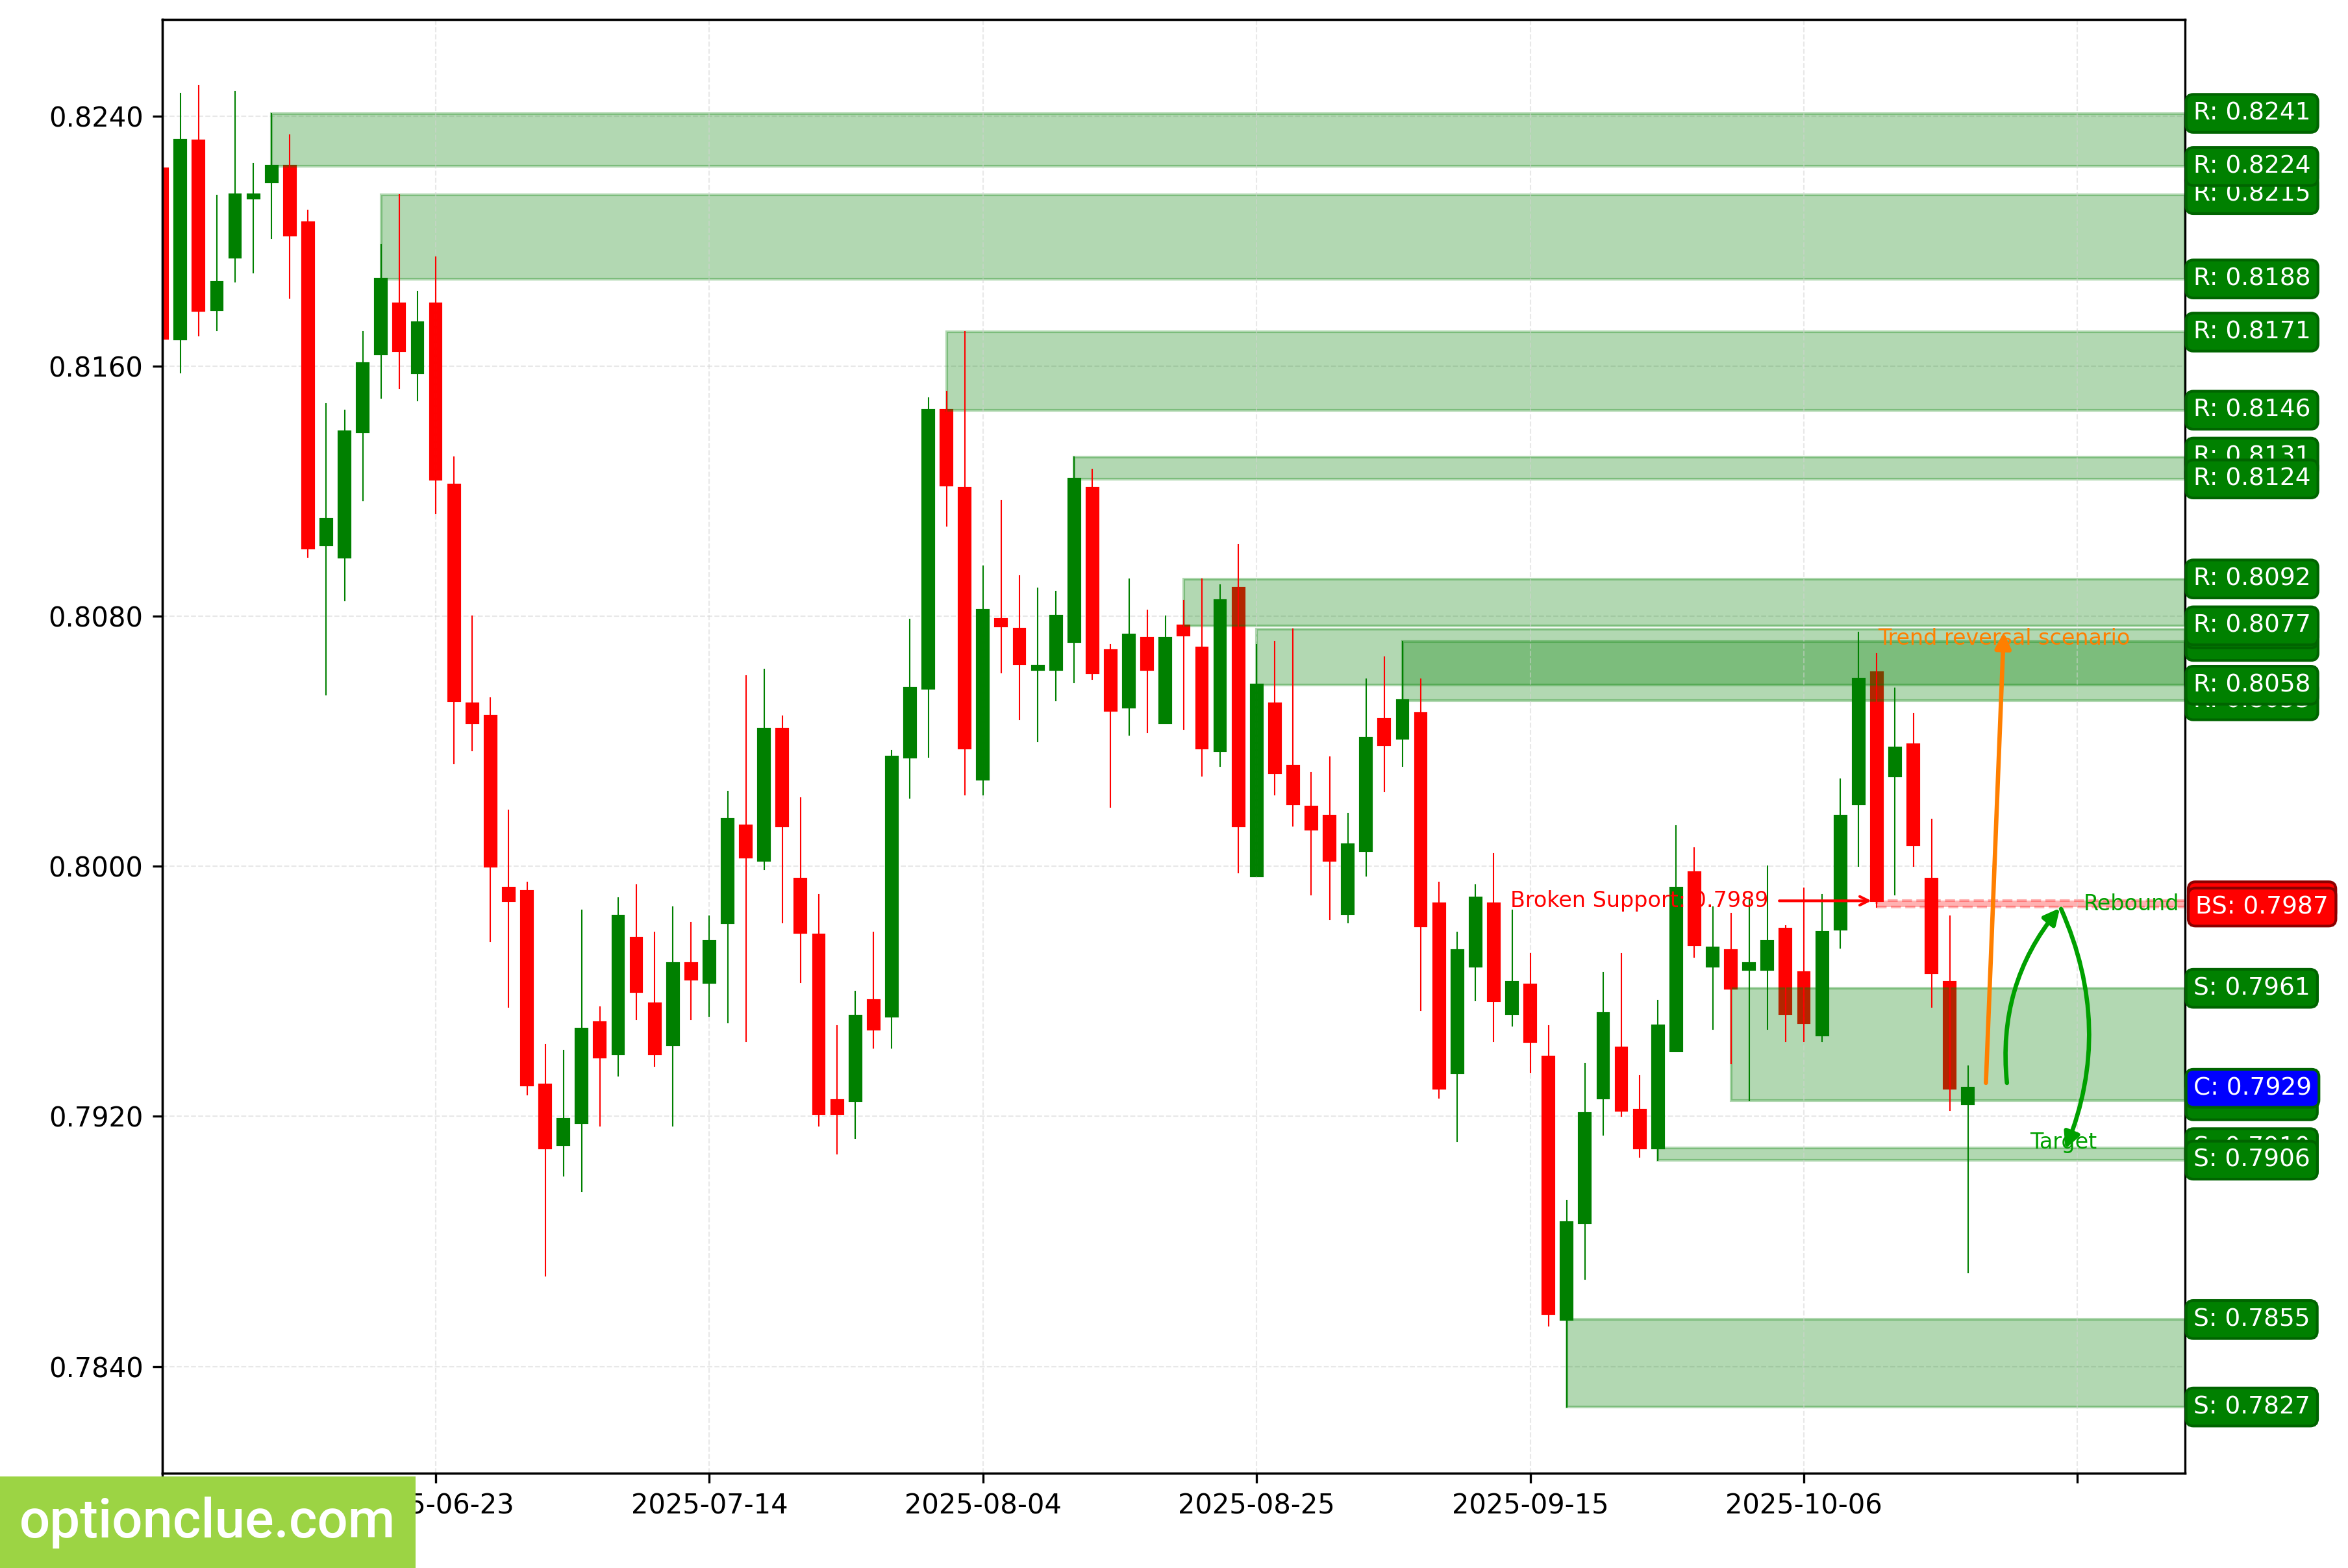
USDCHF. Technical analysis. D1.
Japanese Yen (USDJPY)
The bullish trend continues; the price is near the last broken level (149.83 — 149.95) as the correction completes. The intermediate target for the upward movement is the resistance level with boundaries at 152.27 — 152.61.
If the market successfully establishes itself above this resistance, it will open the way for the price to move toward target #2 — the resistance level with boundaries at 154.41 — 154.80. Long positions will remain relevant as long as the market is above the support level with boundaries at 146.57 — 147.05.
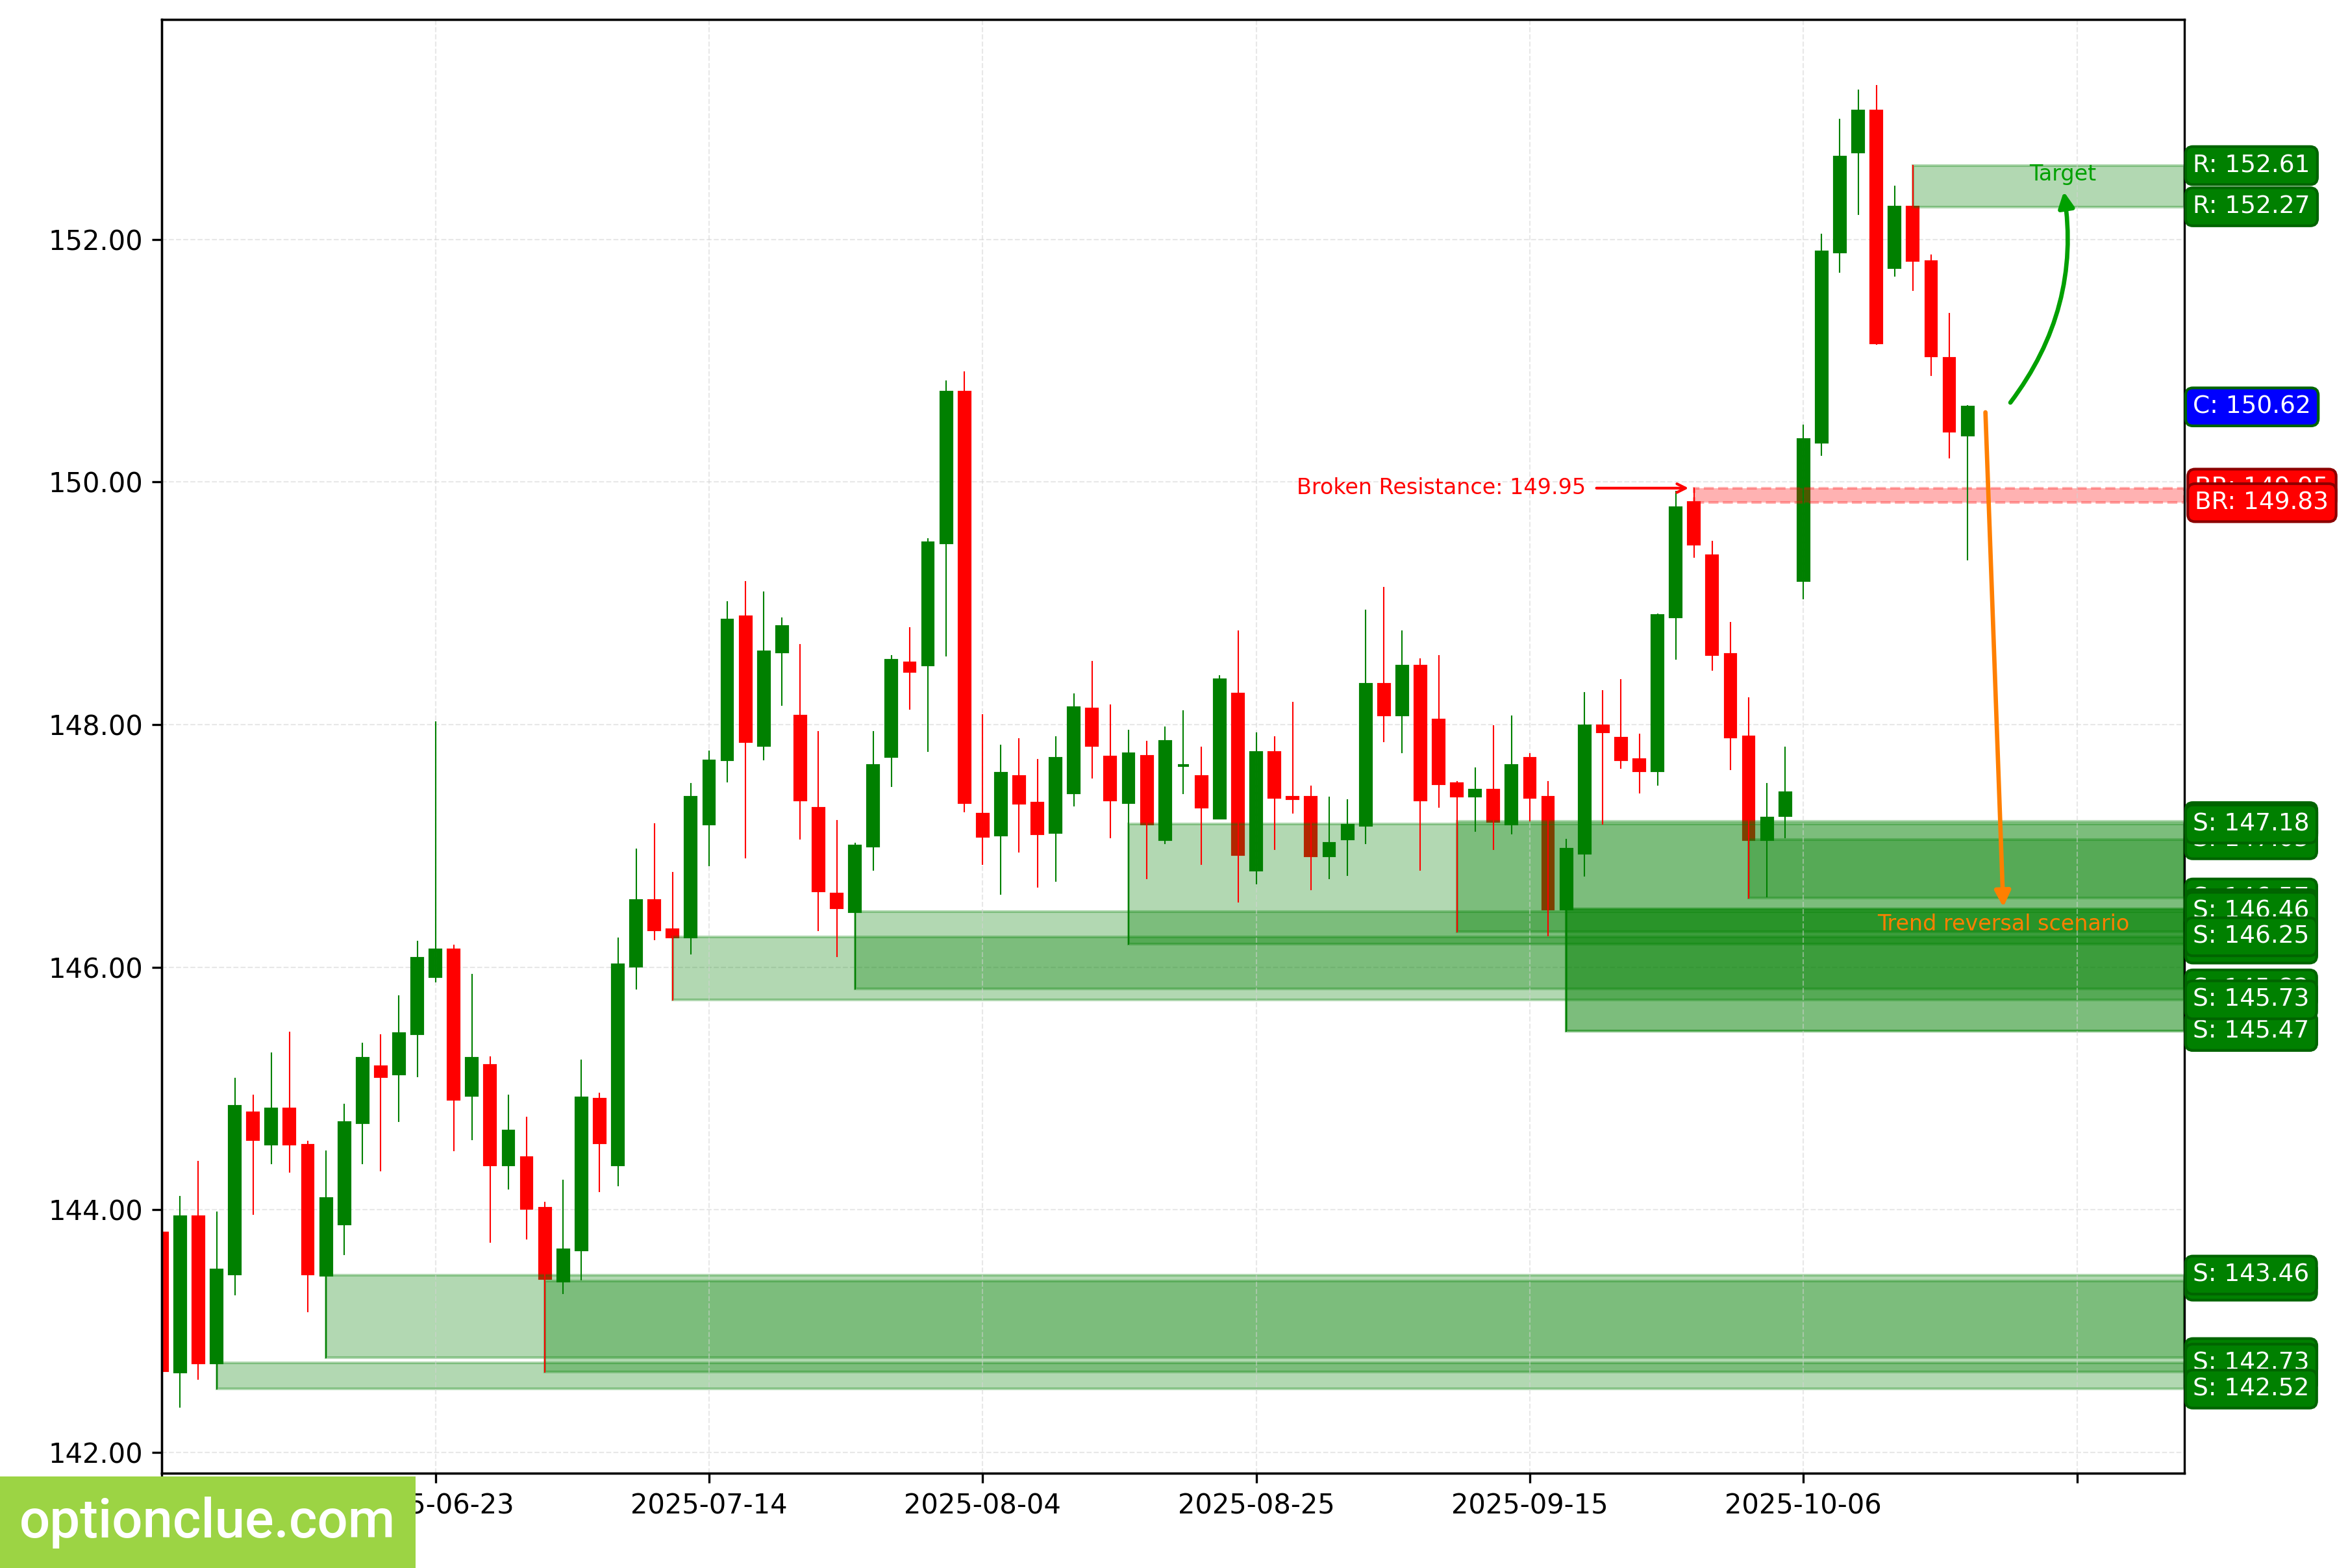
USDJPY. Technical analysis. D1.
Canadian Dollar (USDCAD)
The bullish trend continues; a corrective wave is developing. A buy entry on a rebound may appear after it completes. The last broken level was resistance at 1.3966 — 1.3986.
The breakout occurred 7 days ago. Upon resumption of the upward movement, the first target will be the resistance level with boundaries at 1.4385 — 1.4415.
If the market successfully establishes itself above this resistance, it will open the way for the price to move toward target #2 — the resistance level with boundaries at 1.4349 — 1.4402. Long positions may remain relevant as long as the market is above the nearest daily timeframe support level with boundaries at 1.3930 — 1.3941.
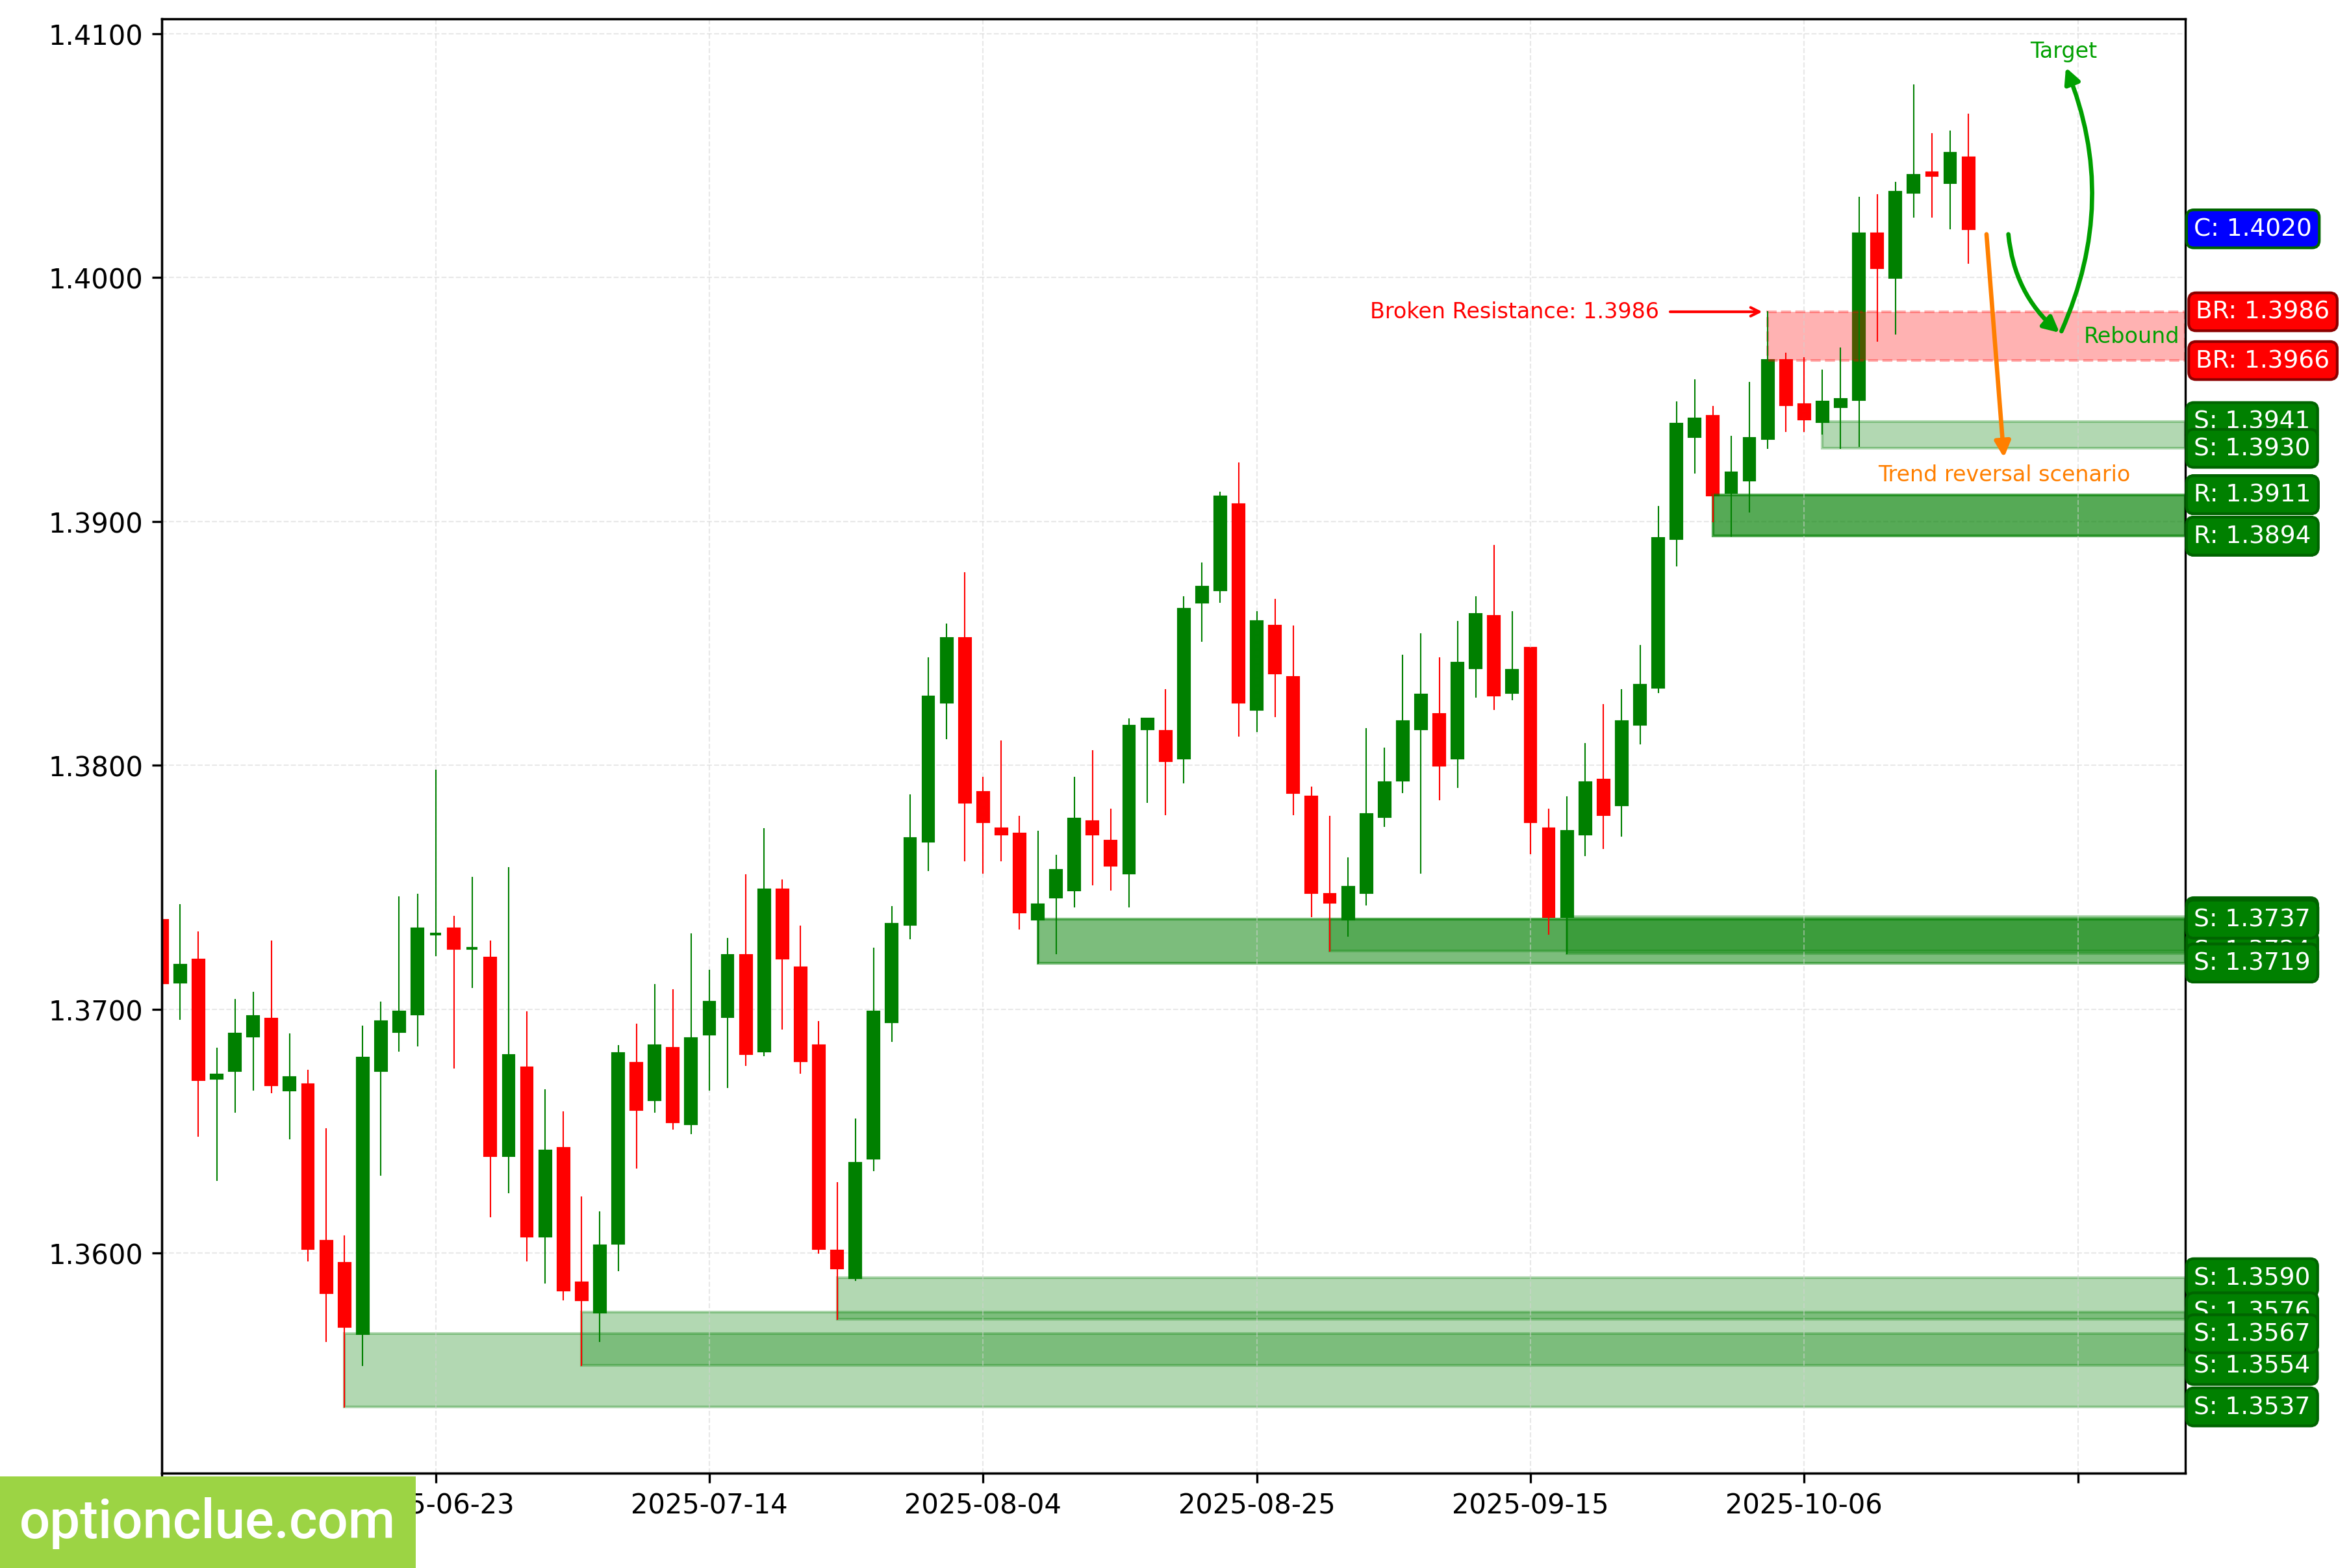
USDCAD. Technical analysis. D1.
Australian Dollar (AUDUSD)
The bearish trend continues, the price is consolidating after a strong impulse move. The last broken level was support at 0.6575 — 0.6595. The breakout occurred 7 days ago.
Upon resumption of the downward movement, the first target will be the support level with boundaries at 0.6370 — 0.6437. A more distant target is located in the support area of 0.6407 — 0.6422.
Short positions will remain relevant as long as the price stays below the nearest resistance level with boundaries at 0.6513 — 0.6532. If this zone is broken, the medium-term trend will change to bullish.
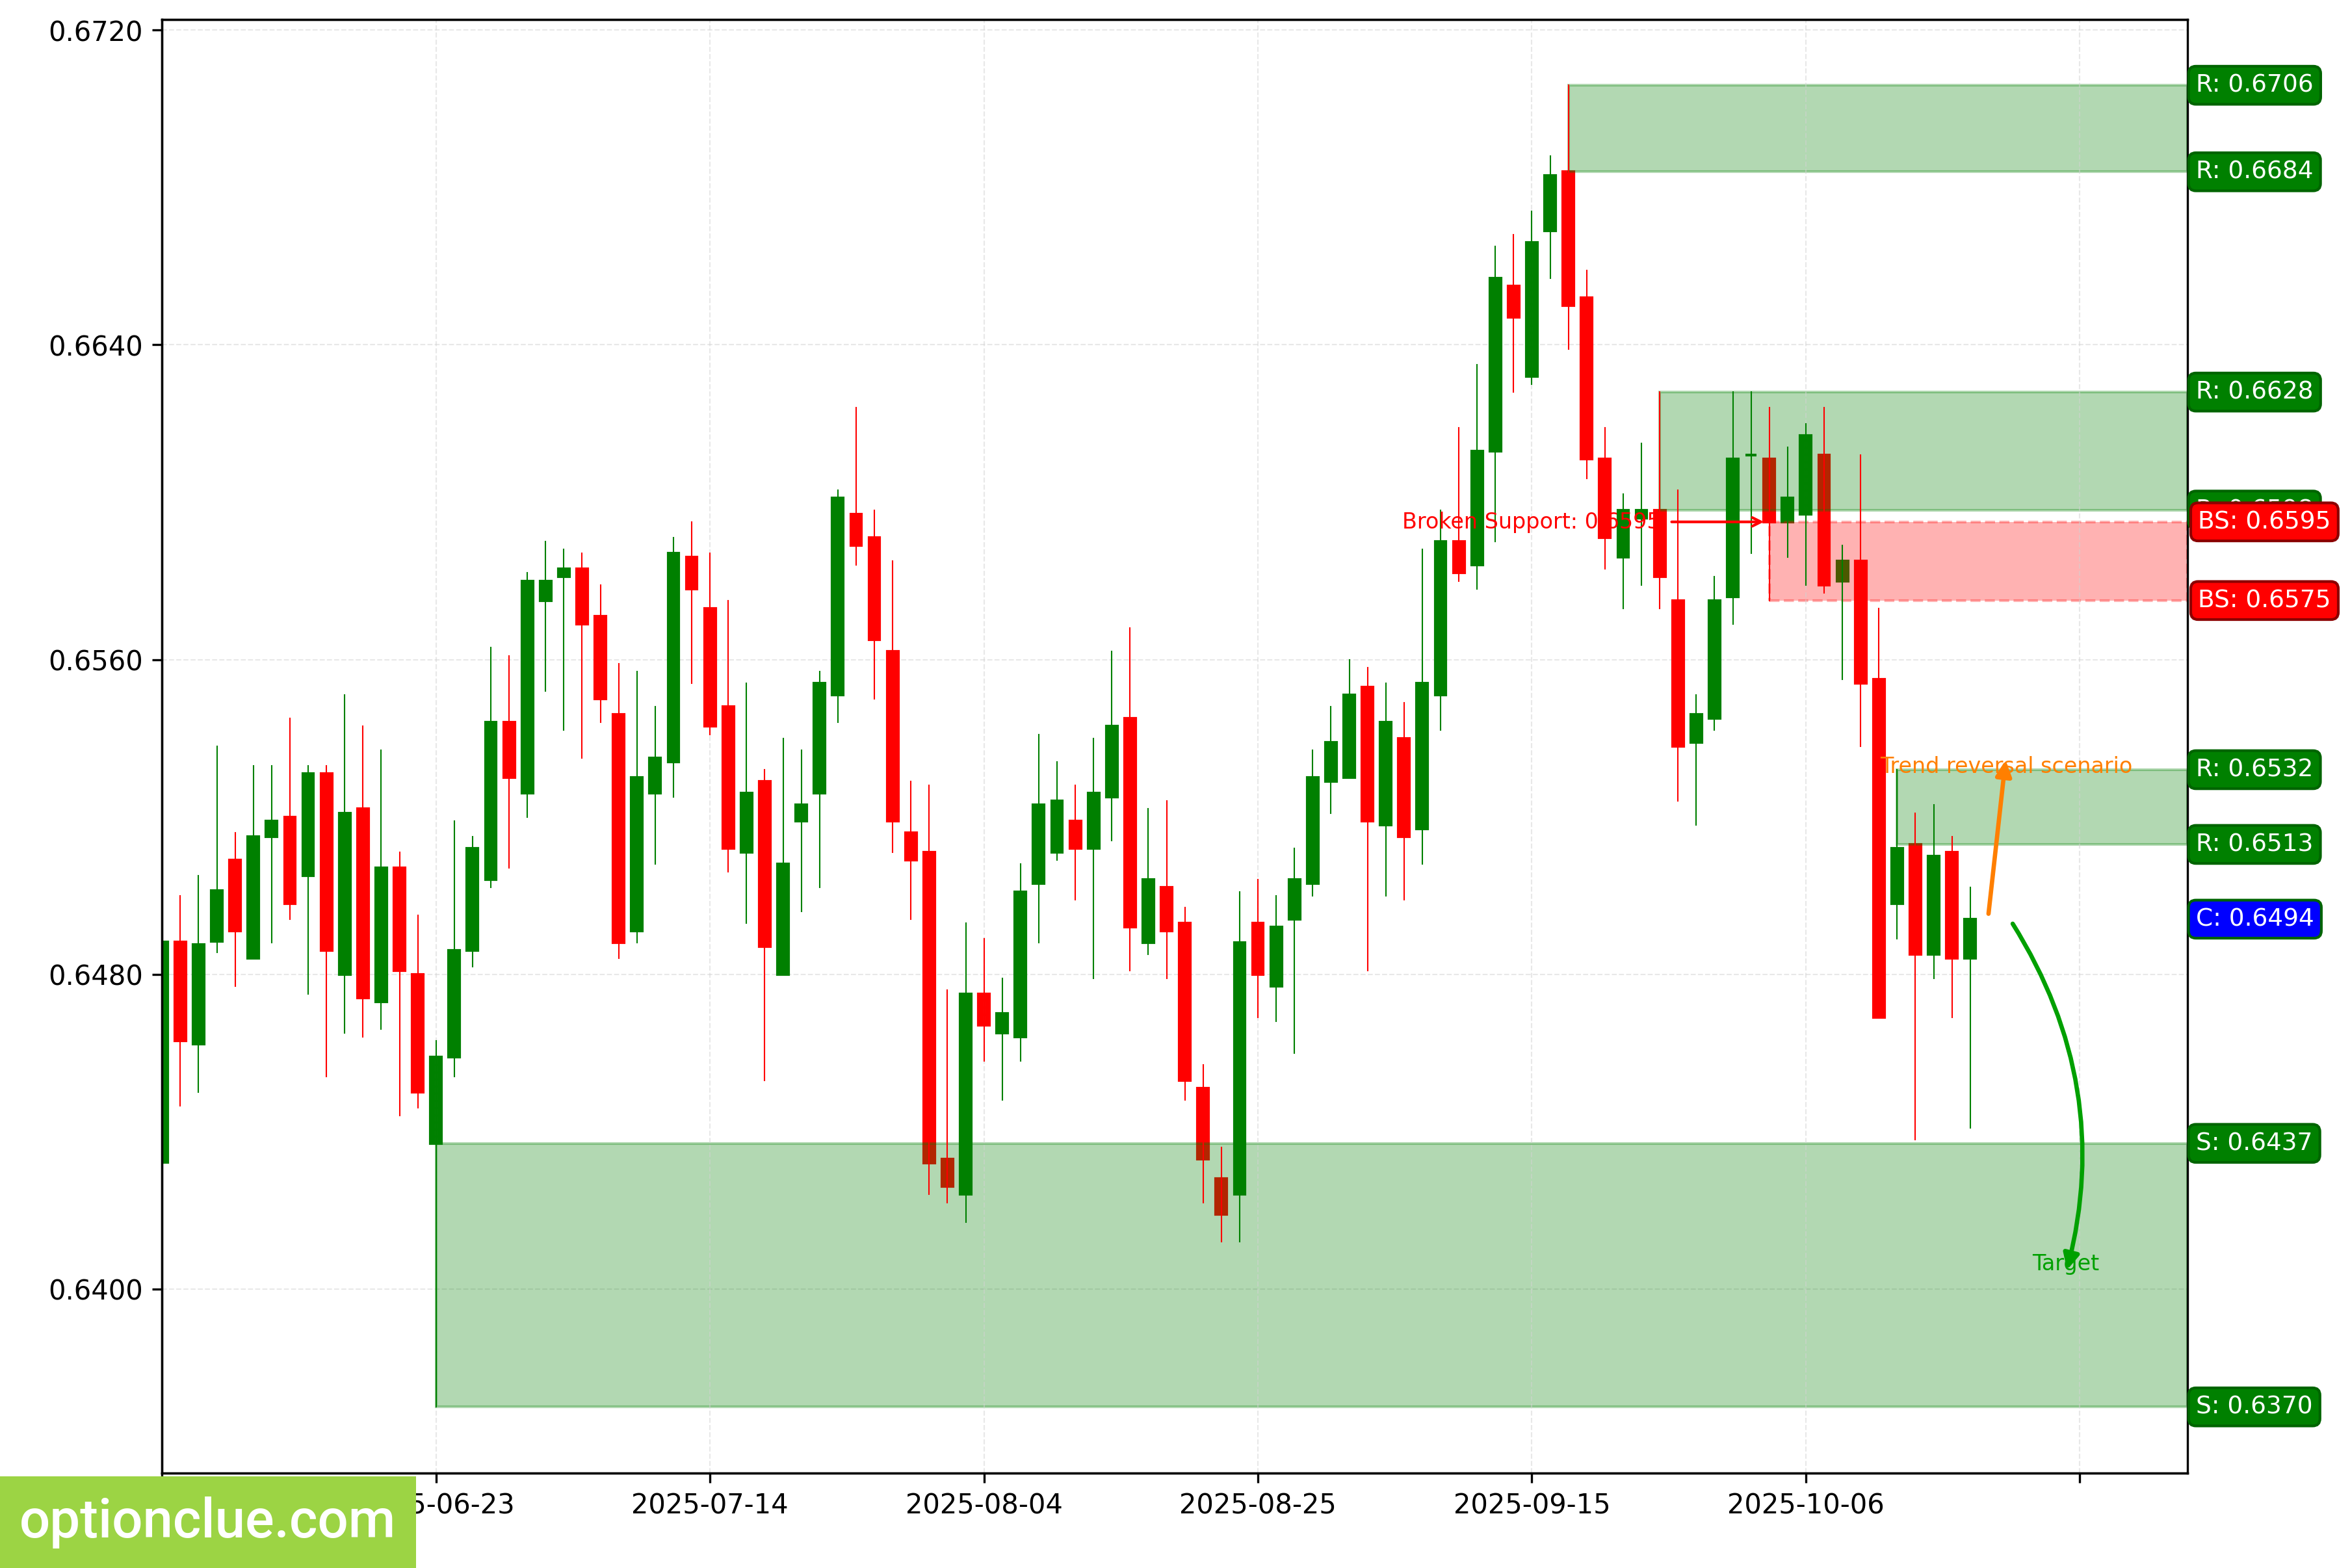
AUDUSD. Technical analysis. D1.
New Zealand Dollar (NZDUSD)
The bearish trend continues; a corrective wave is developing. Last week, the price returned to the previously broken support level (0.5752 — 0.5763). A sell entry on a rebound may appear after
the correction completes.
The intermediate target for the downward movement is the support level with boundaries at 0.5681 — 0.5713. If the trend develops successfully, a more distant target will be at the level of 0.5485 — 0.5528.
Short positions will remain relevant as long as the market stays below the resistance level with boundaries at 0.5842 —
0.5844. If this zone is broken, the medium-term trend will change to bullish.
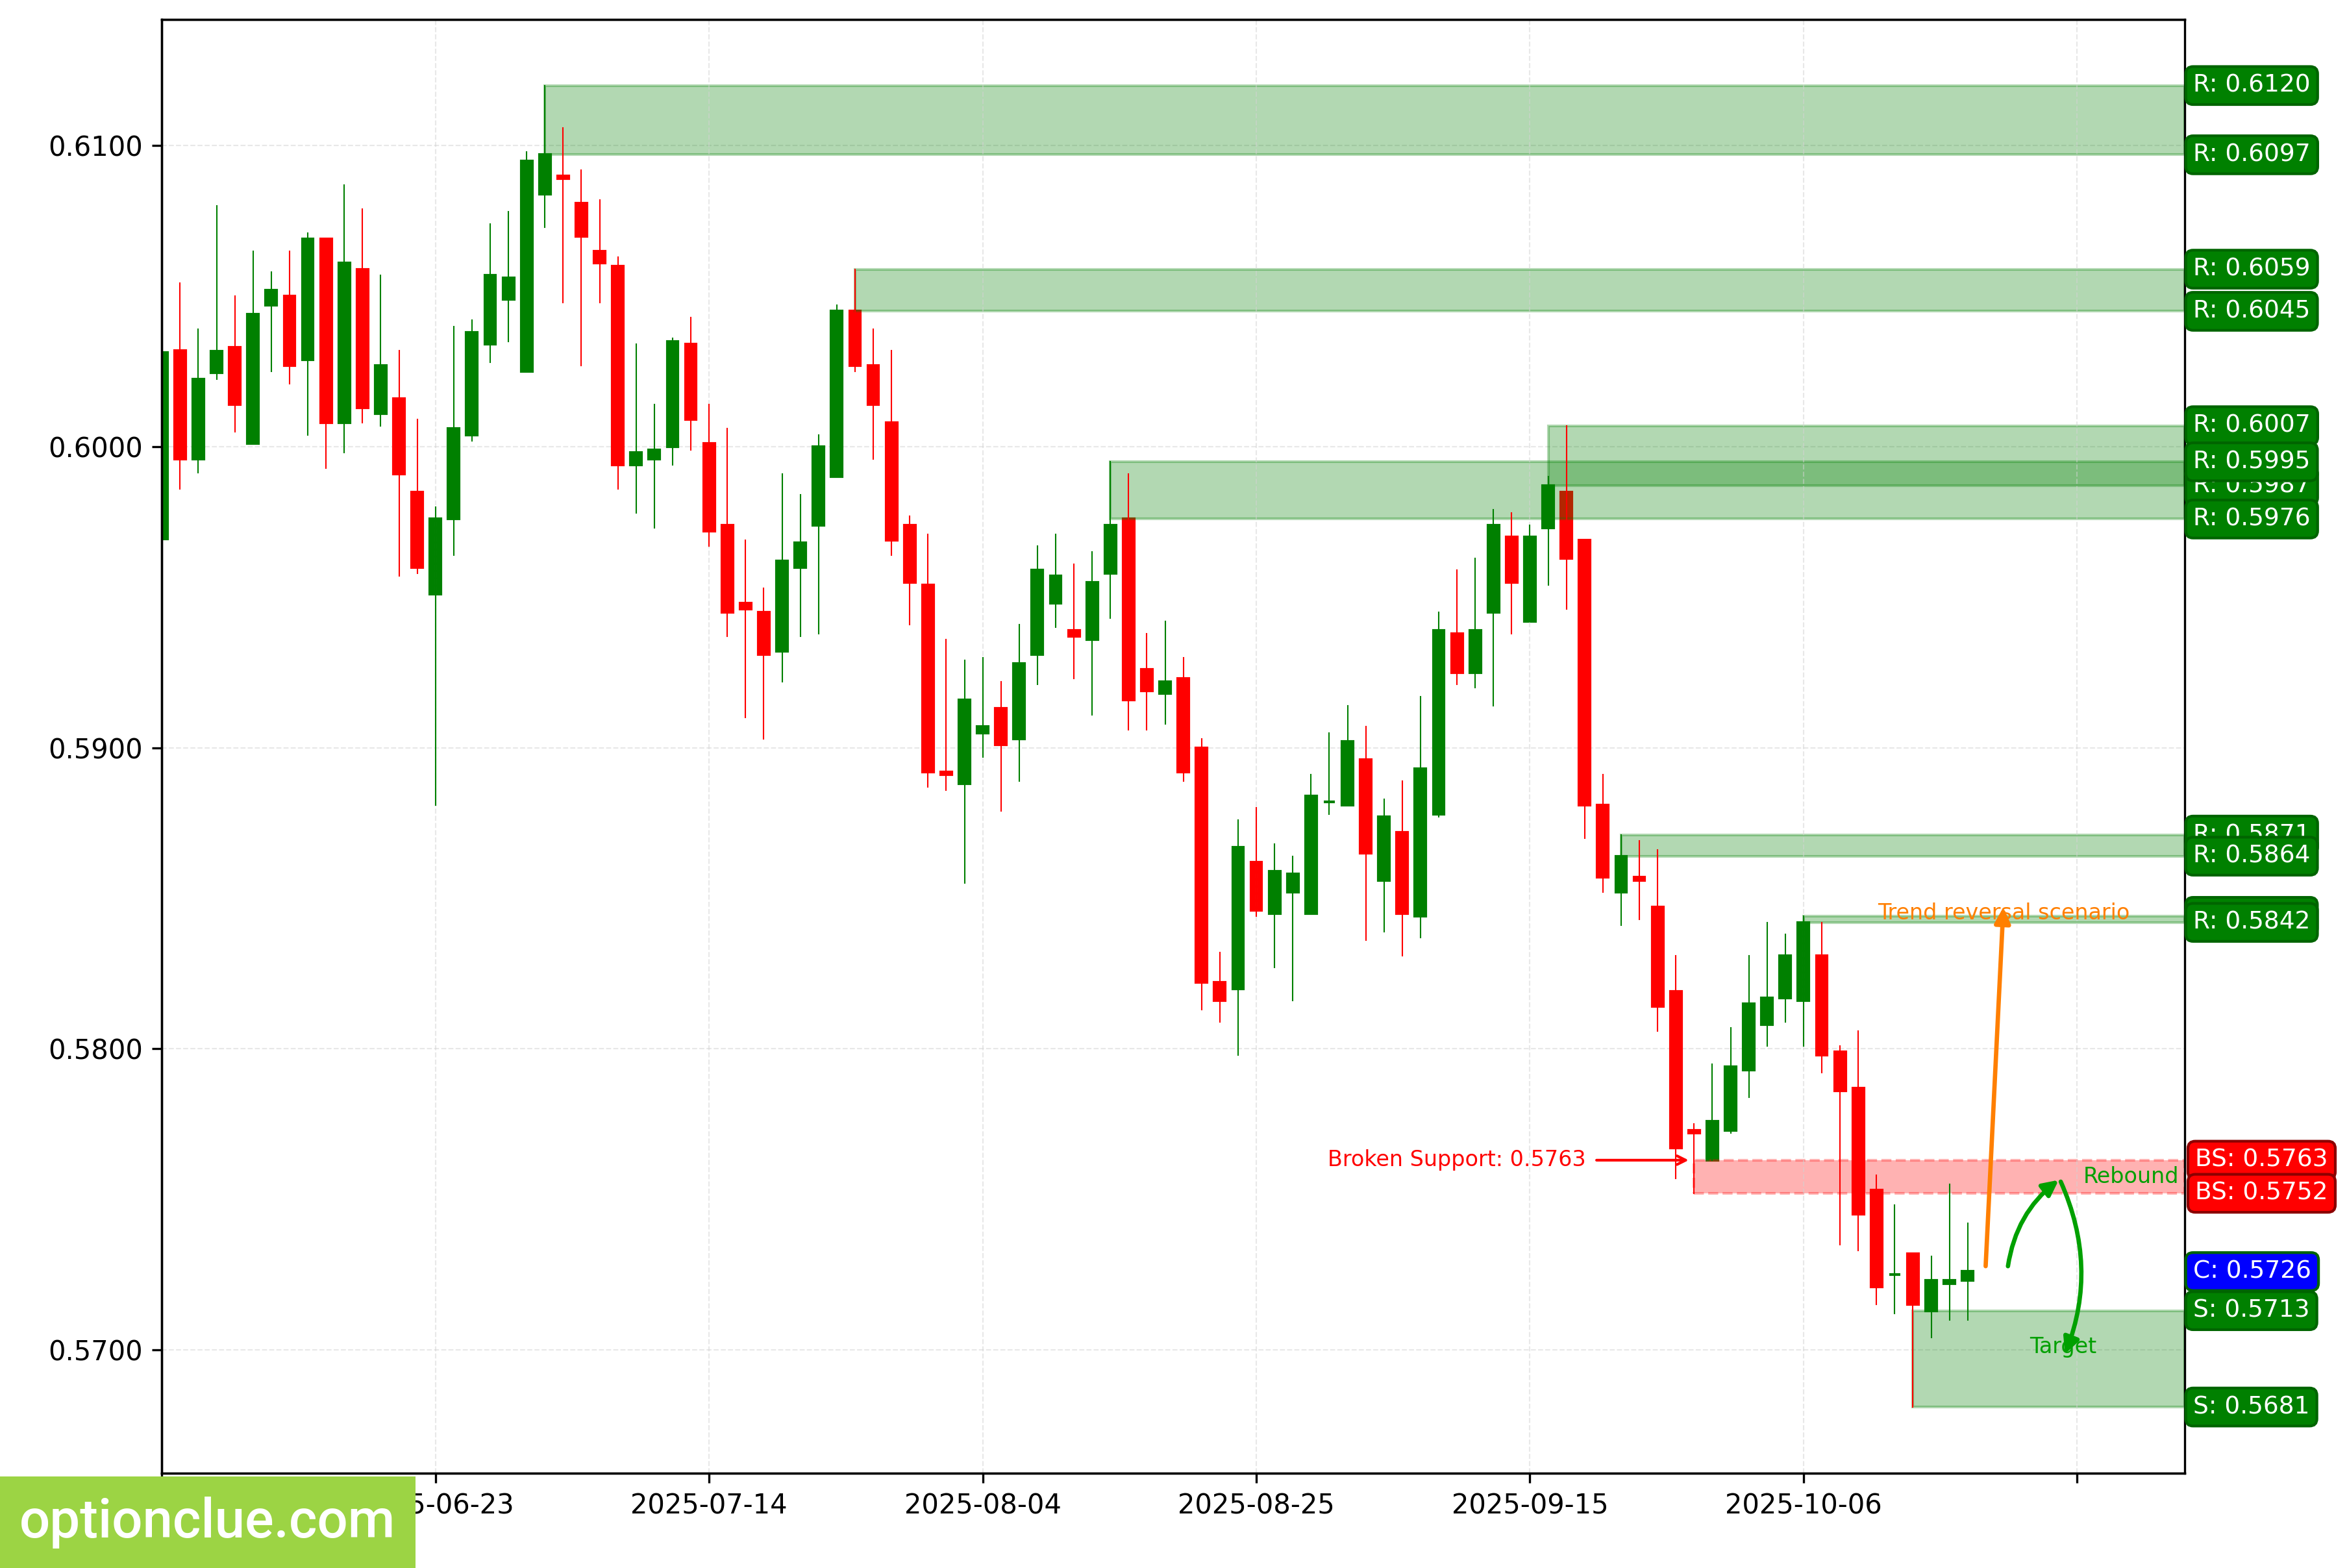
NZDUSD. Technical analysis. D1.
Bitcoin (BTC)
The bearish trend continues. The last broken level was support at 107000 — 110769. The breakout occurred 3 days ago.
An impulse wave is developing. A sell entry on a rebound may appear after a correction forms.
The first target for the downward movement is the support level with boundaries at 105120 — 105712. If the market successfully establishes itself below this support, it will open the way for the price to move toward target #2 — the support level with boundaries at 98225 — 100997.
Short positions will remain relevant as long as the market is below the nearest resistance level with boundaries at 115274 — 116078.
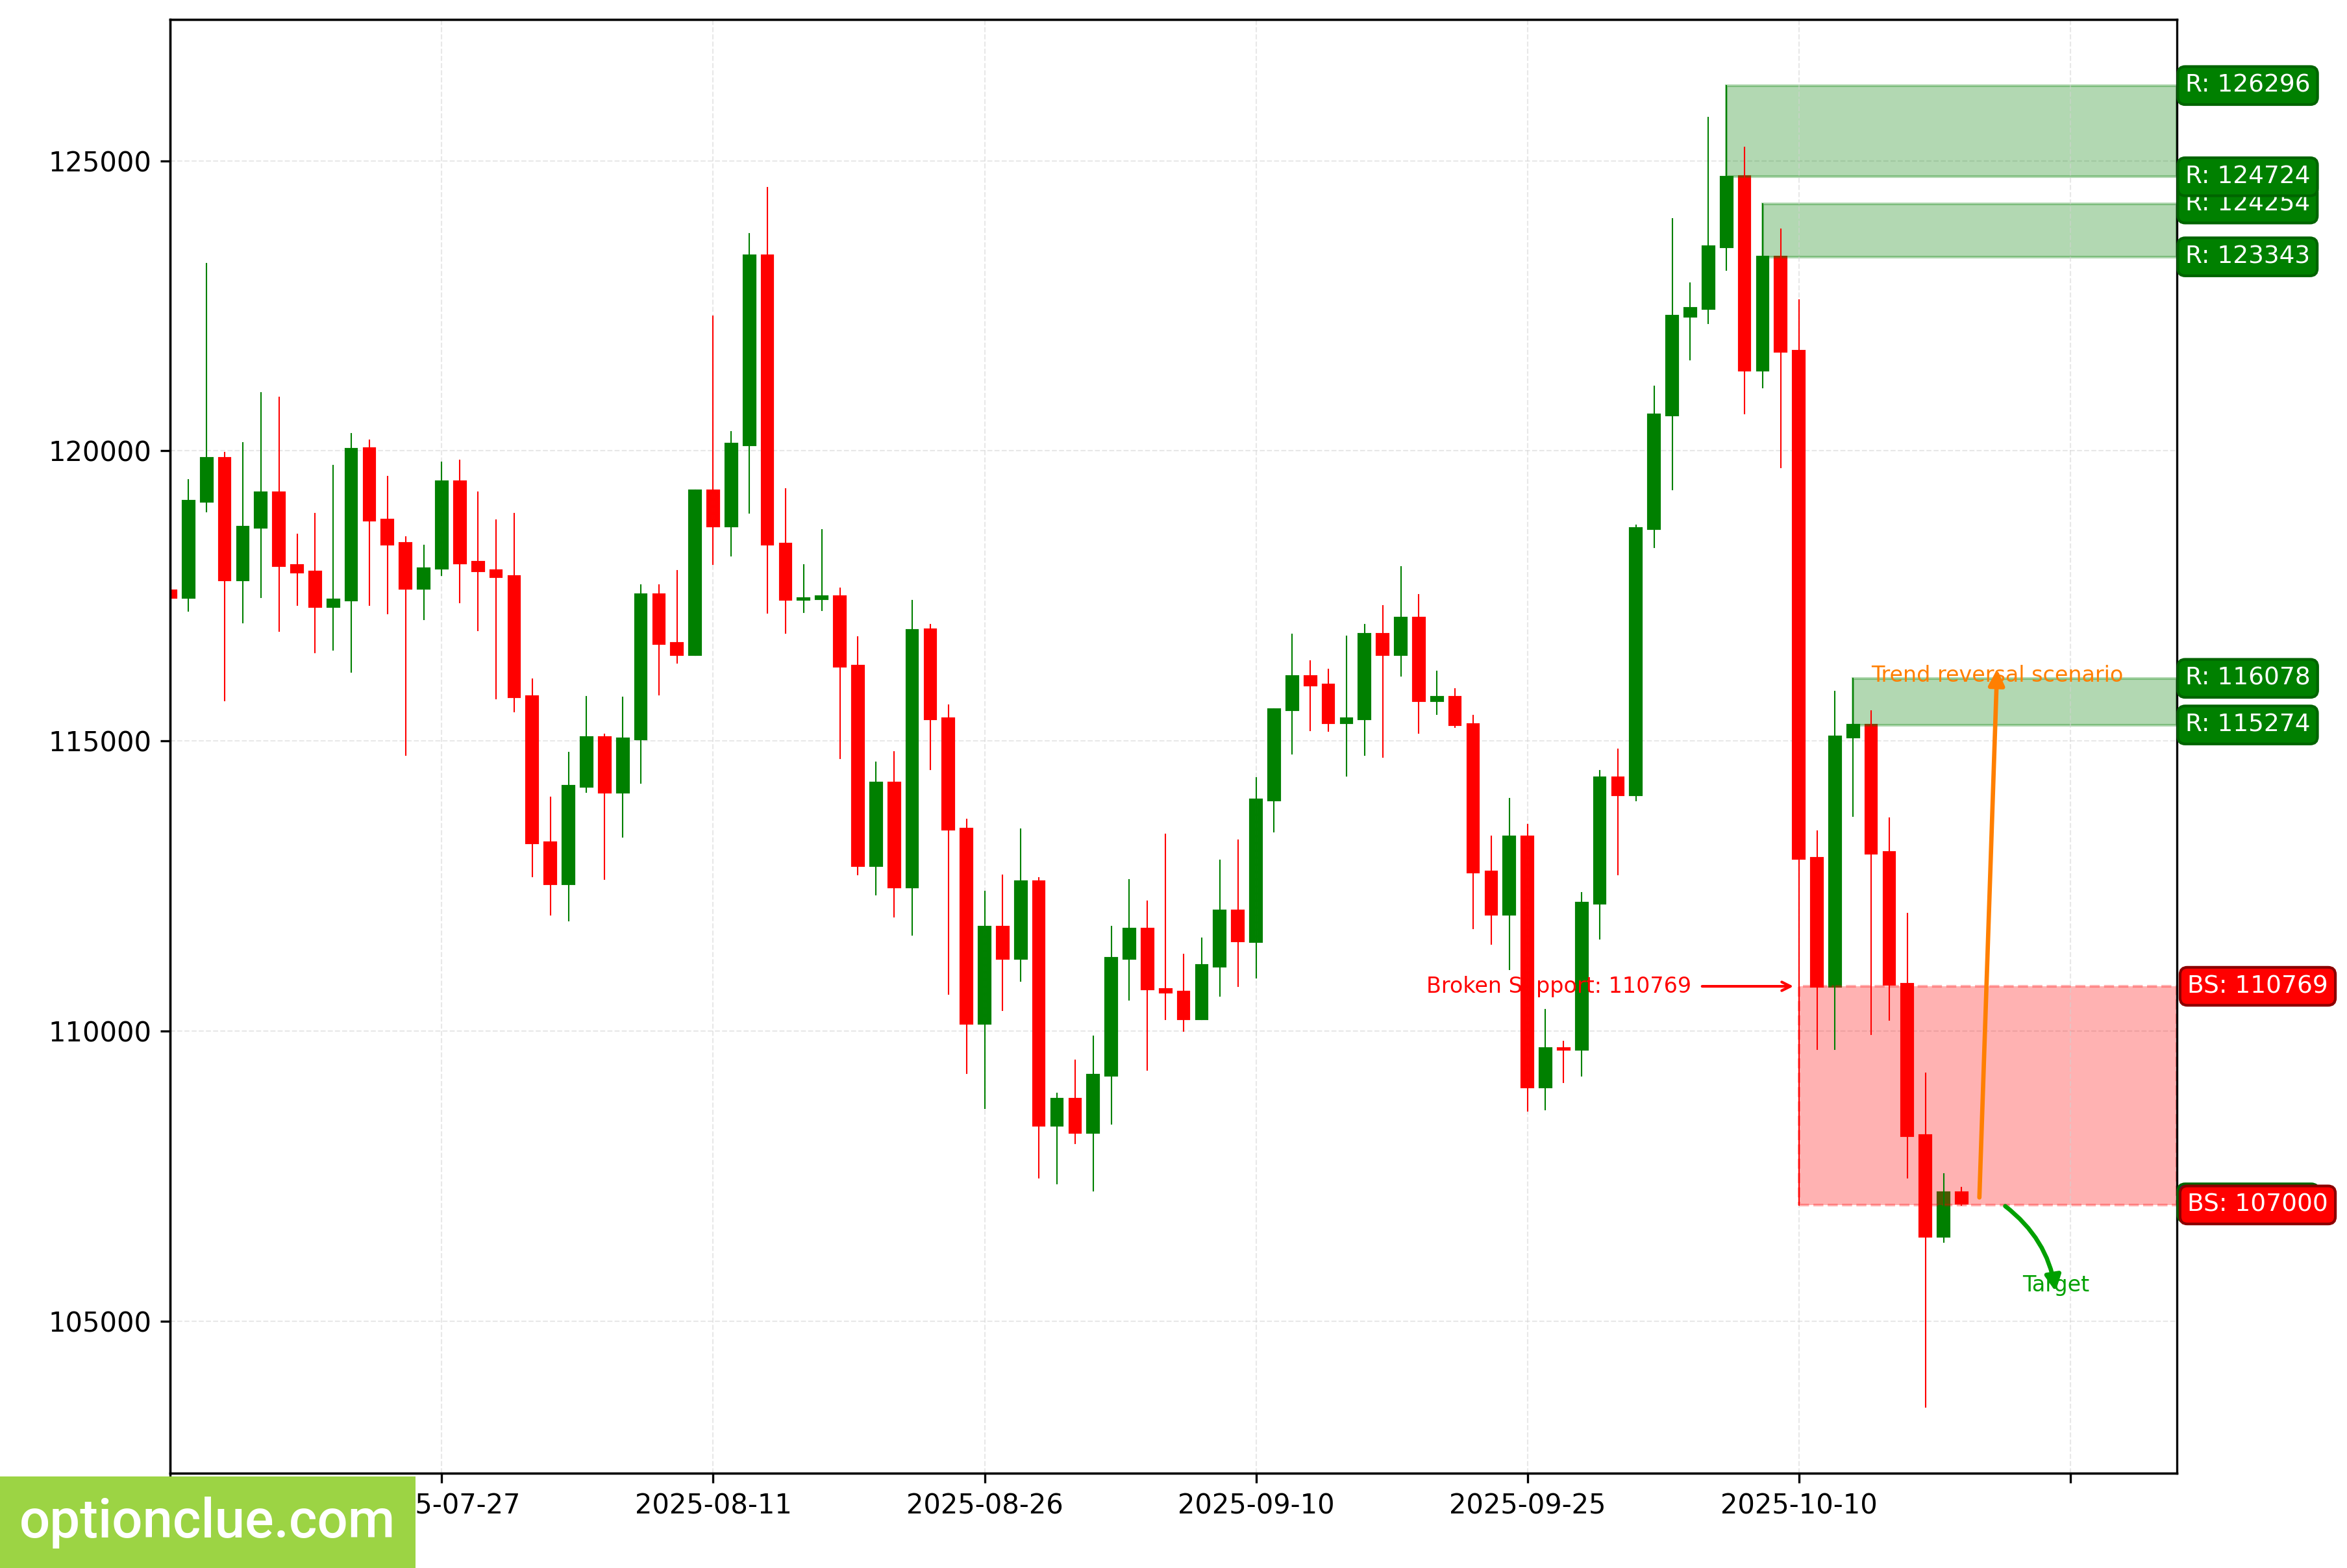
BTC. Technical analysis. D1.
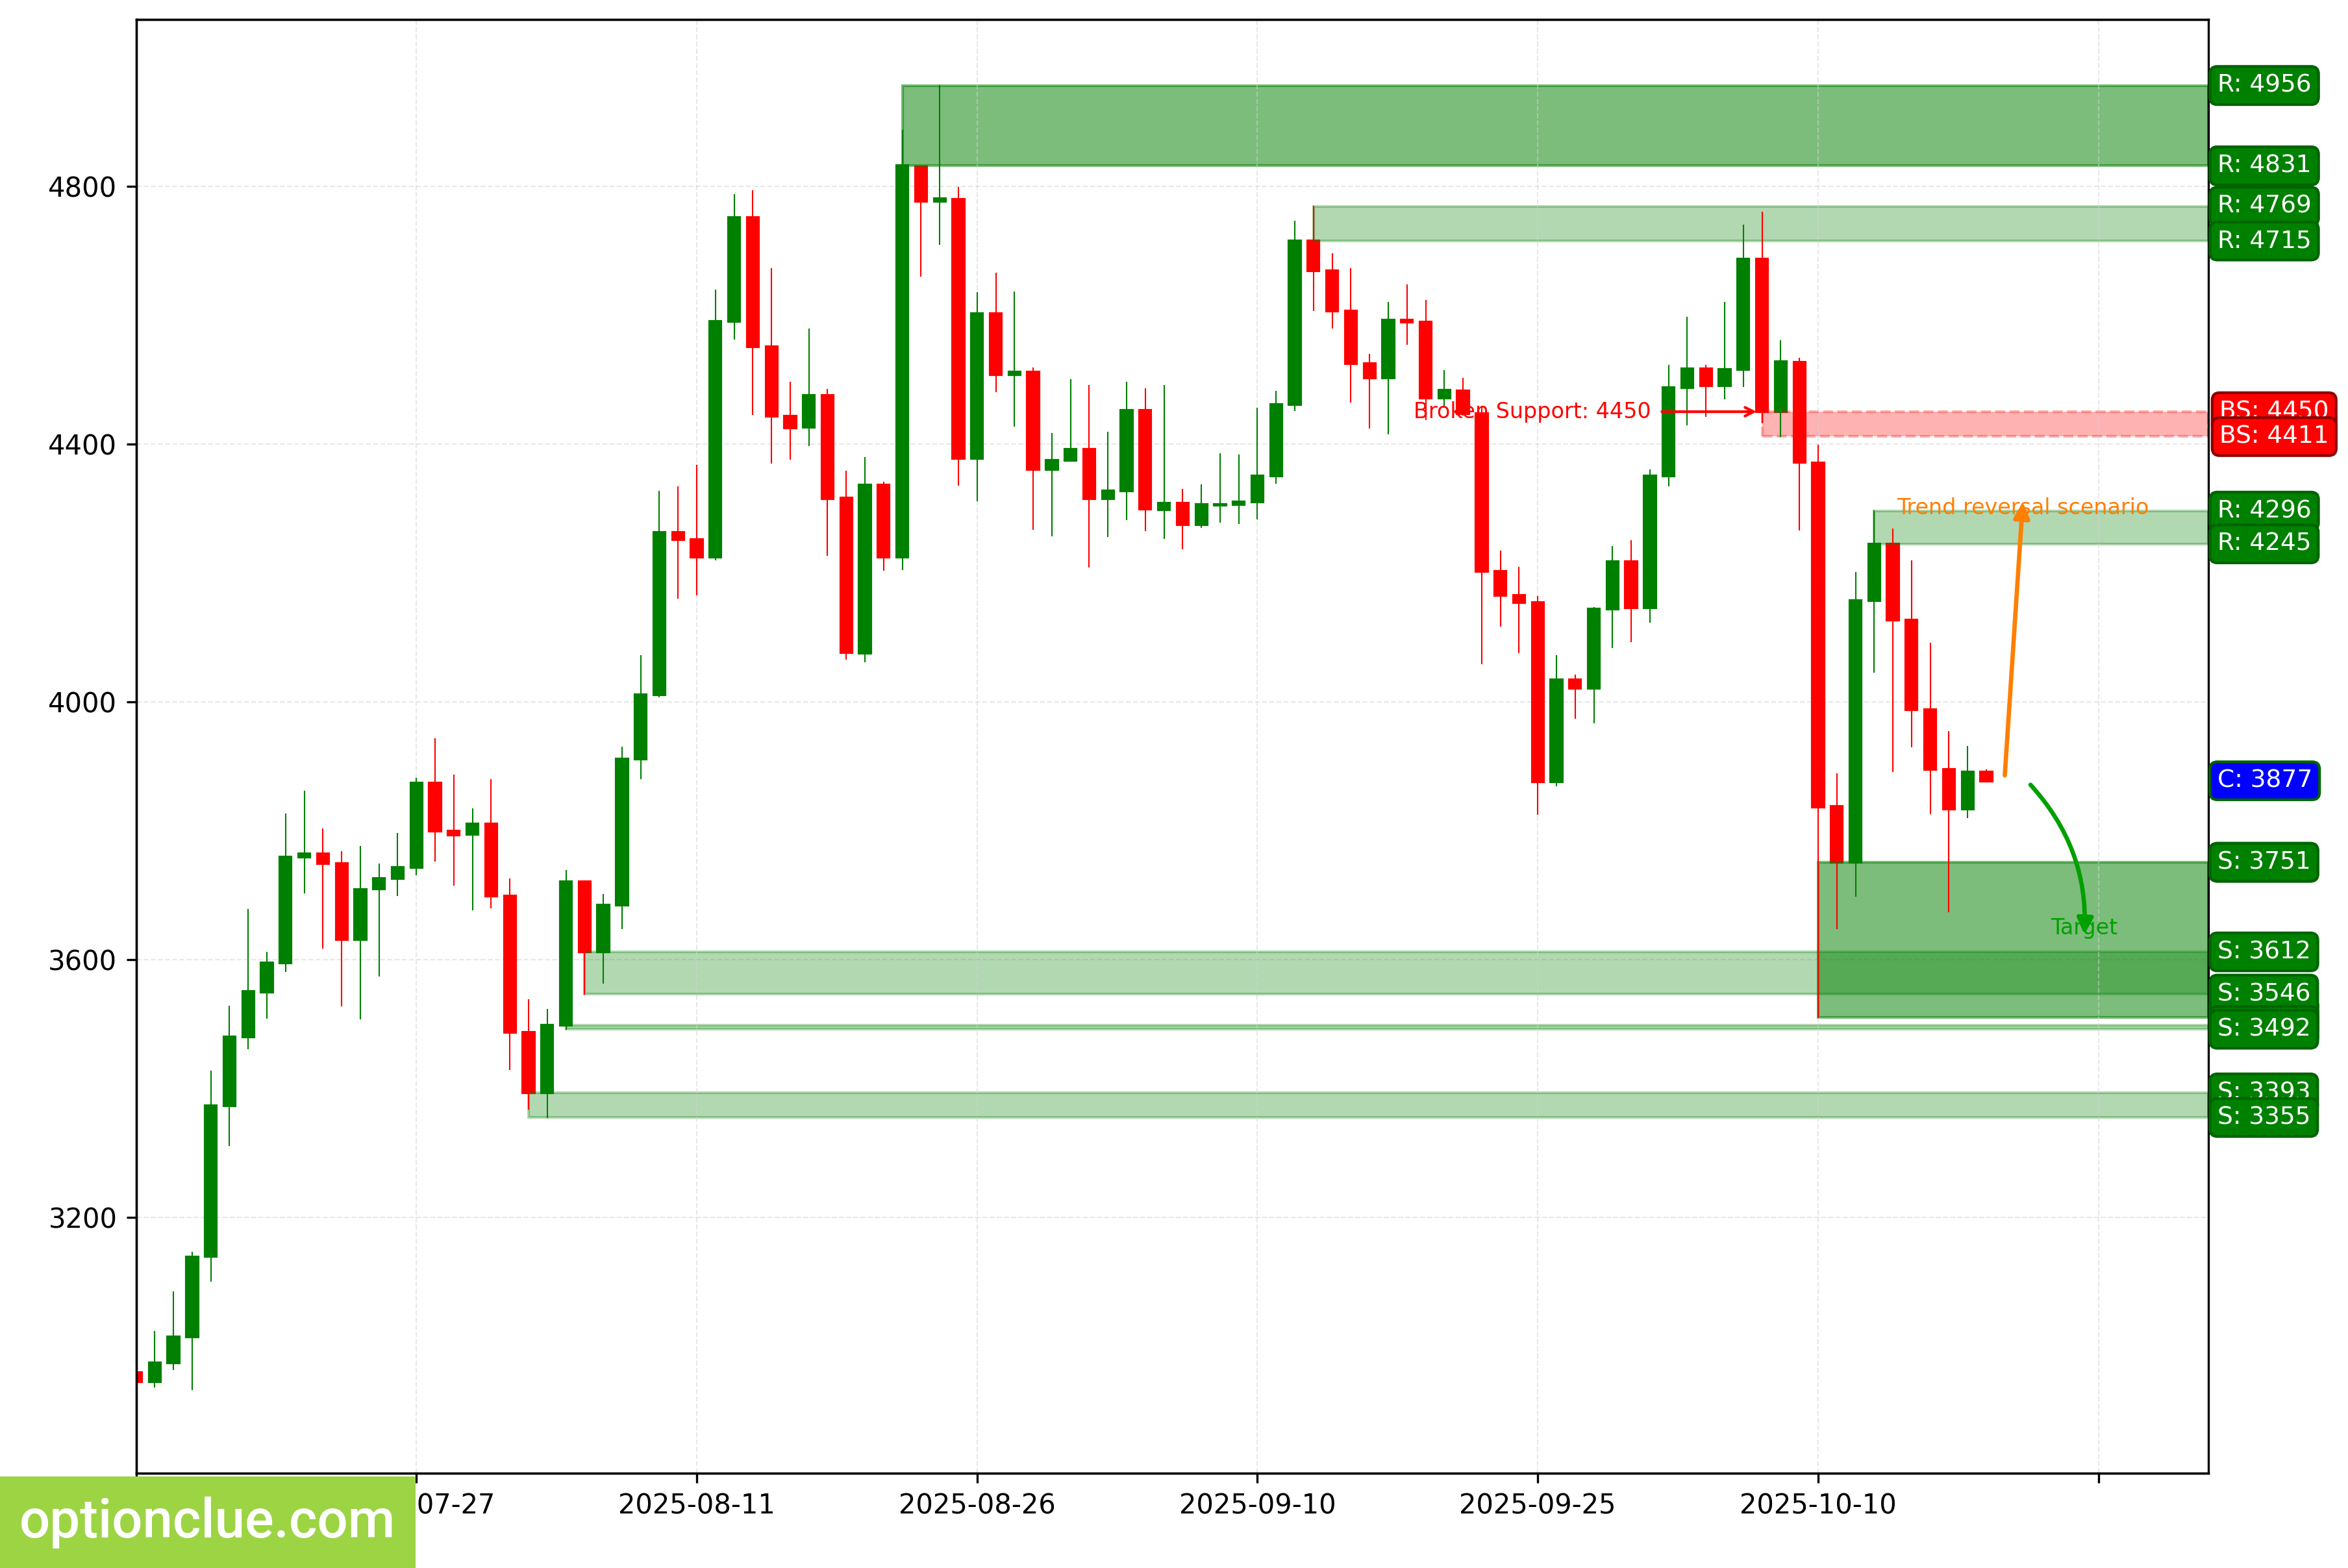
Ether (ETH)
The bearish trend continues. The last broken level was support at 4411 — 4450; a correction is forming. A sell entry on a rebound may appear after it completes. The first target for the downward movement is the support level with boundaries at 3510 — 3751.
If the trend develops successfully, a more distant target will be in the 3546 — 3612 area. Short positions will remain relevant as long as the market stays below the nearest resistance level with boundaries at 4245 — 4296.
ETH. Technical analysis. D1.
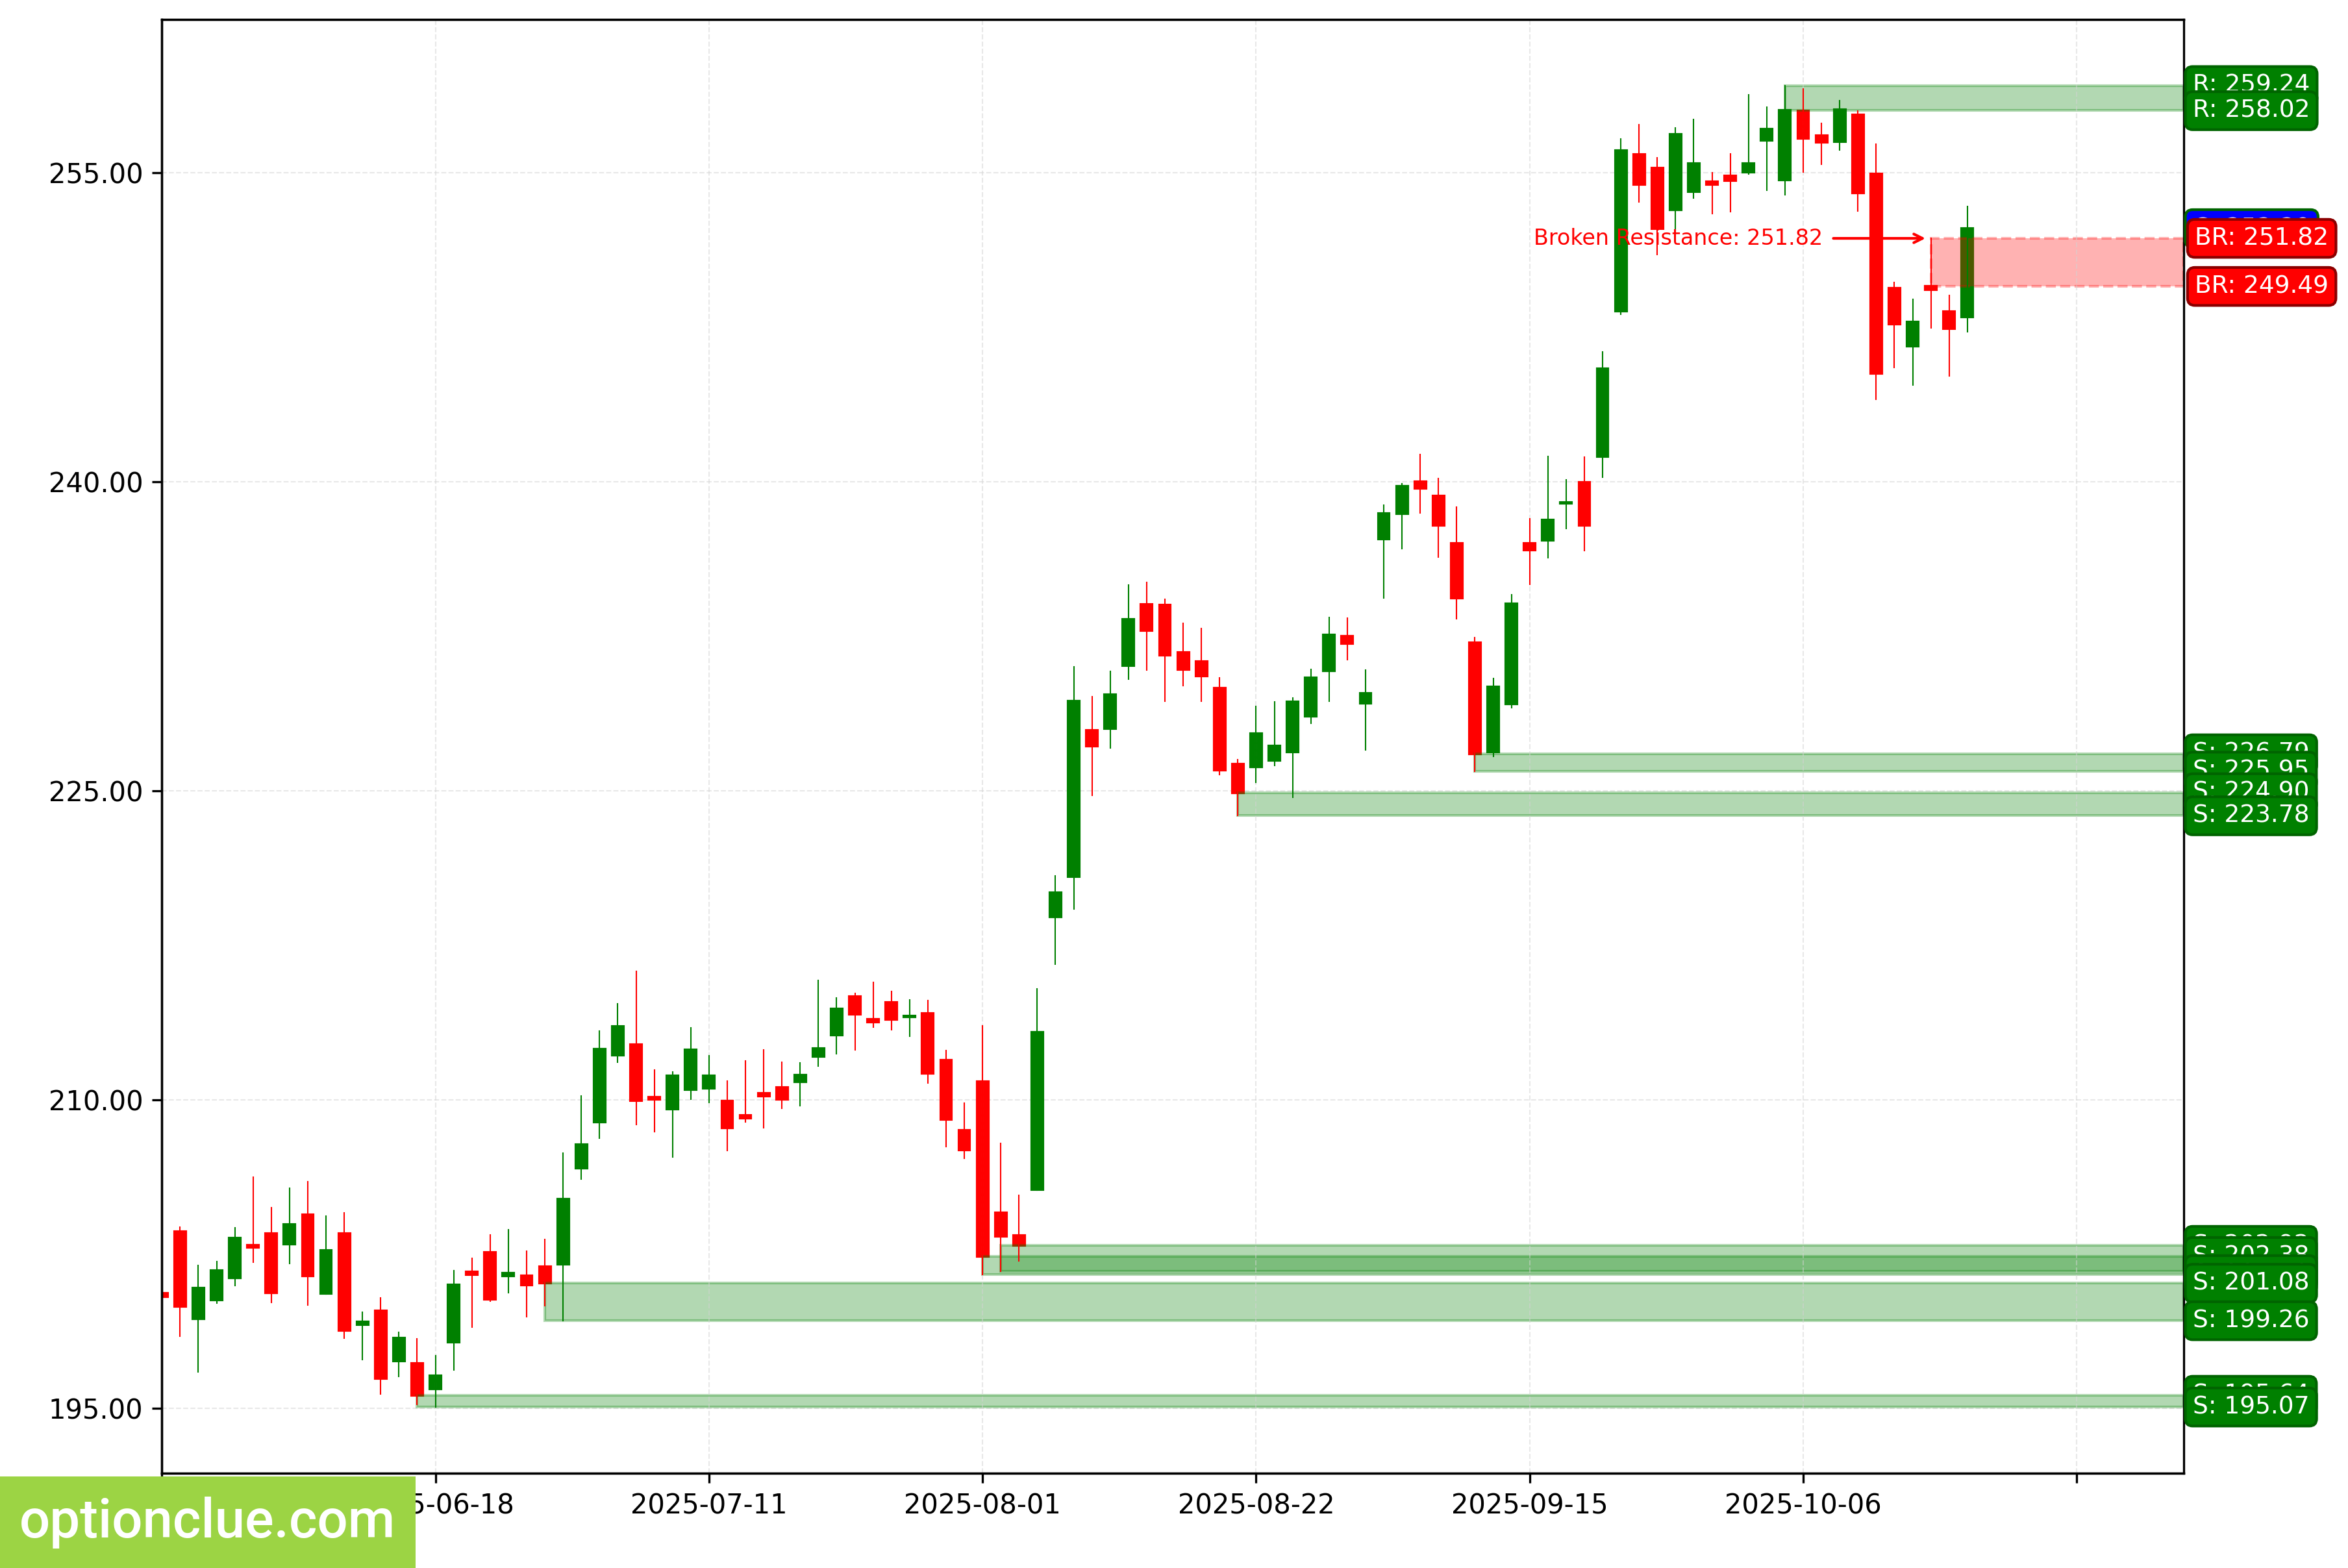
Apple Inc (AAPL)
The trend changed to bullish when a resistance level at 249.49 — 251.82 formed last week and was then broken.
An impulse move is developing on the daily timeframe. A sell entry on a rebound may appear after a full correction forms.
Upon resumption of the upward movement, the first target will be the resistance level with boundaries at 258.02 — 259.24. If the trend develops successfully, a more distant target will be at the resistance level with boundaries at 259.02 — 260.10.
Long positions will remain relevant as long as the market is above the nearest daily timeframe support level with boundaries at 225.95 — 226.79. A breach of this level would indicate a trend reversal.
AAPL. Technical analysis. D1.
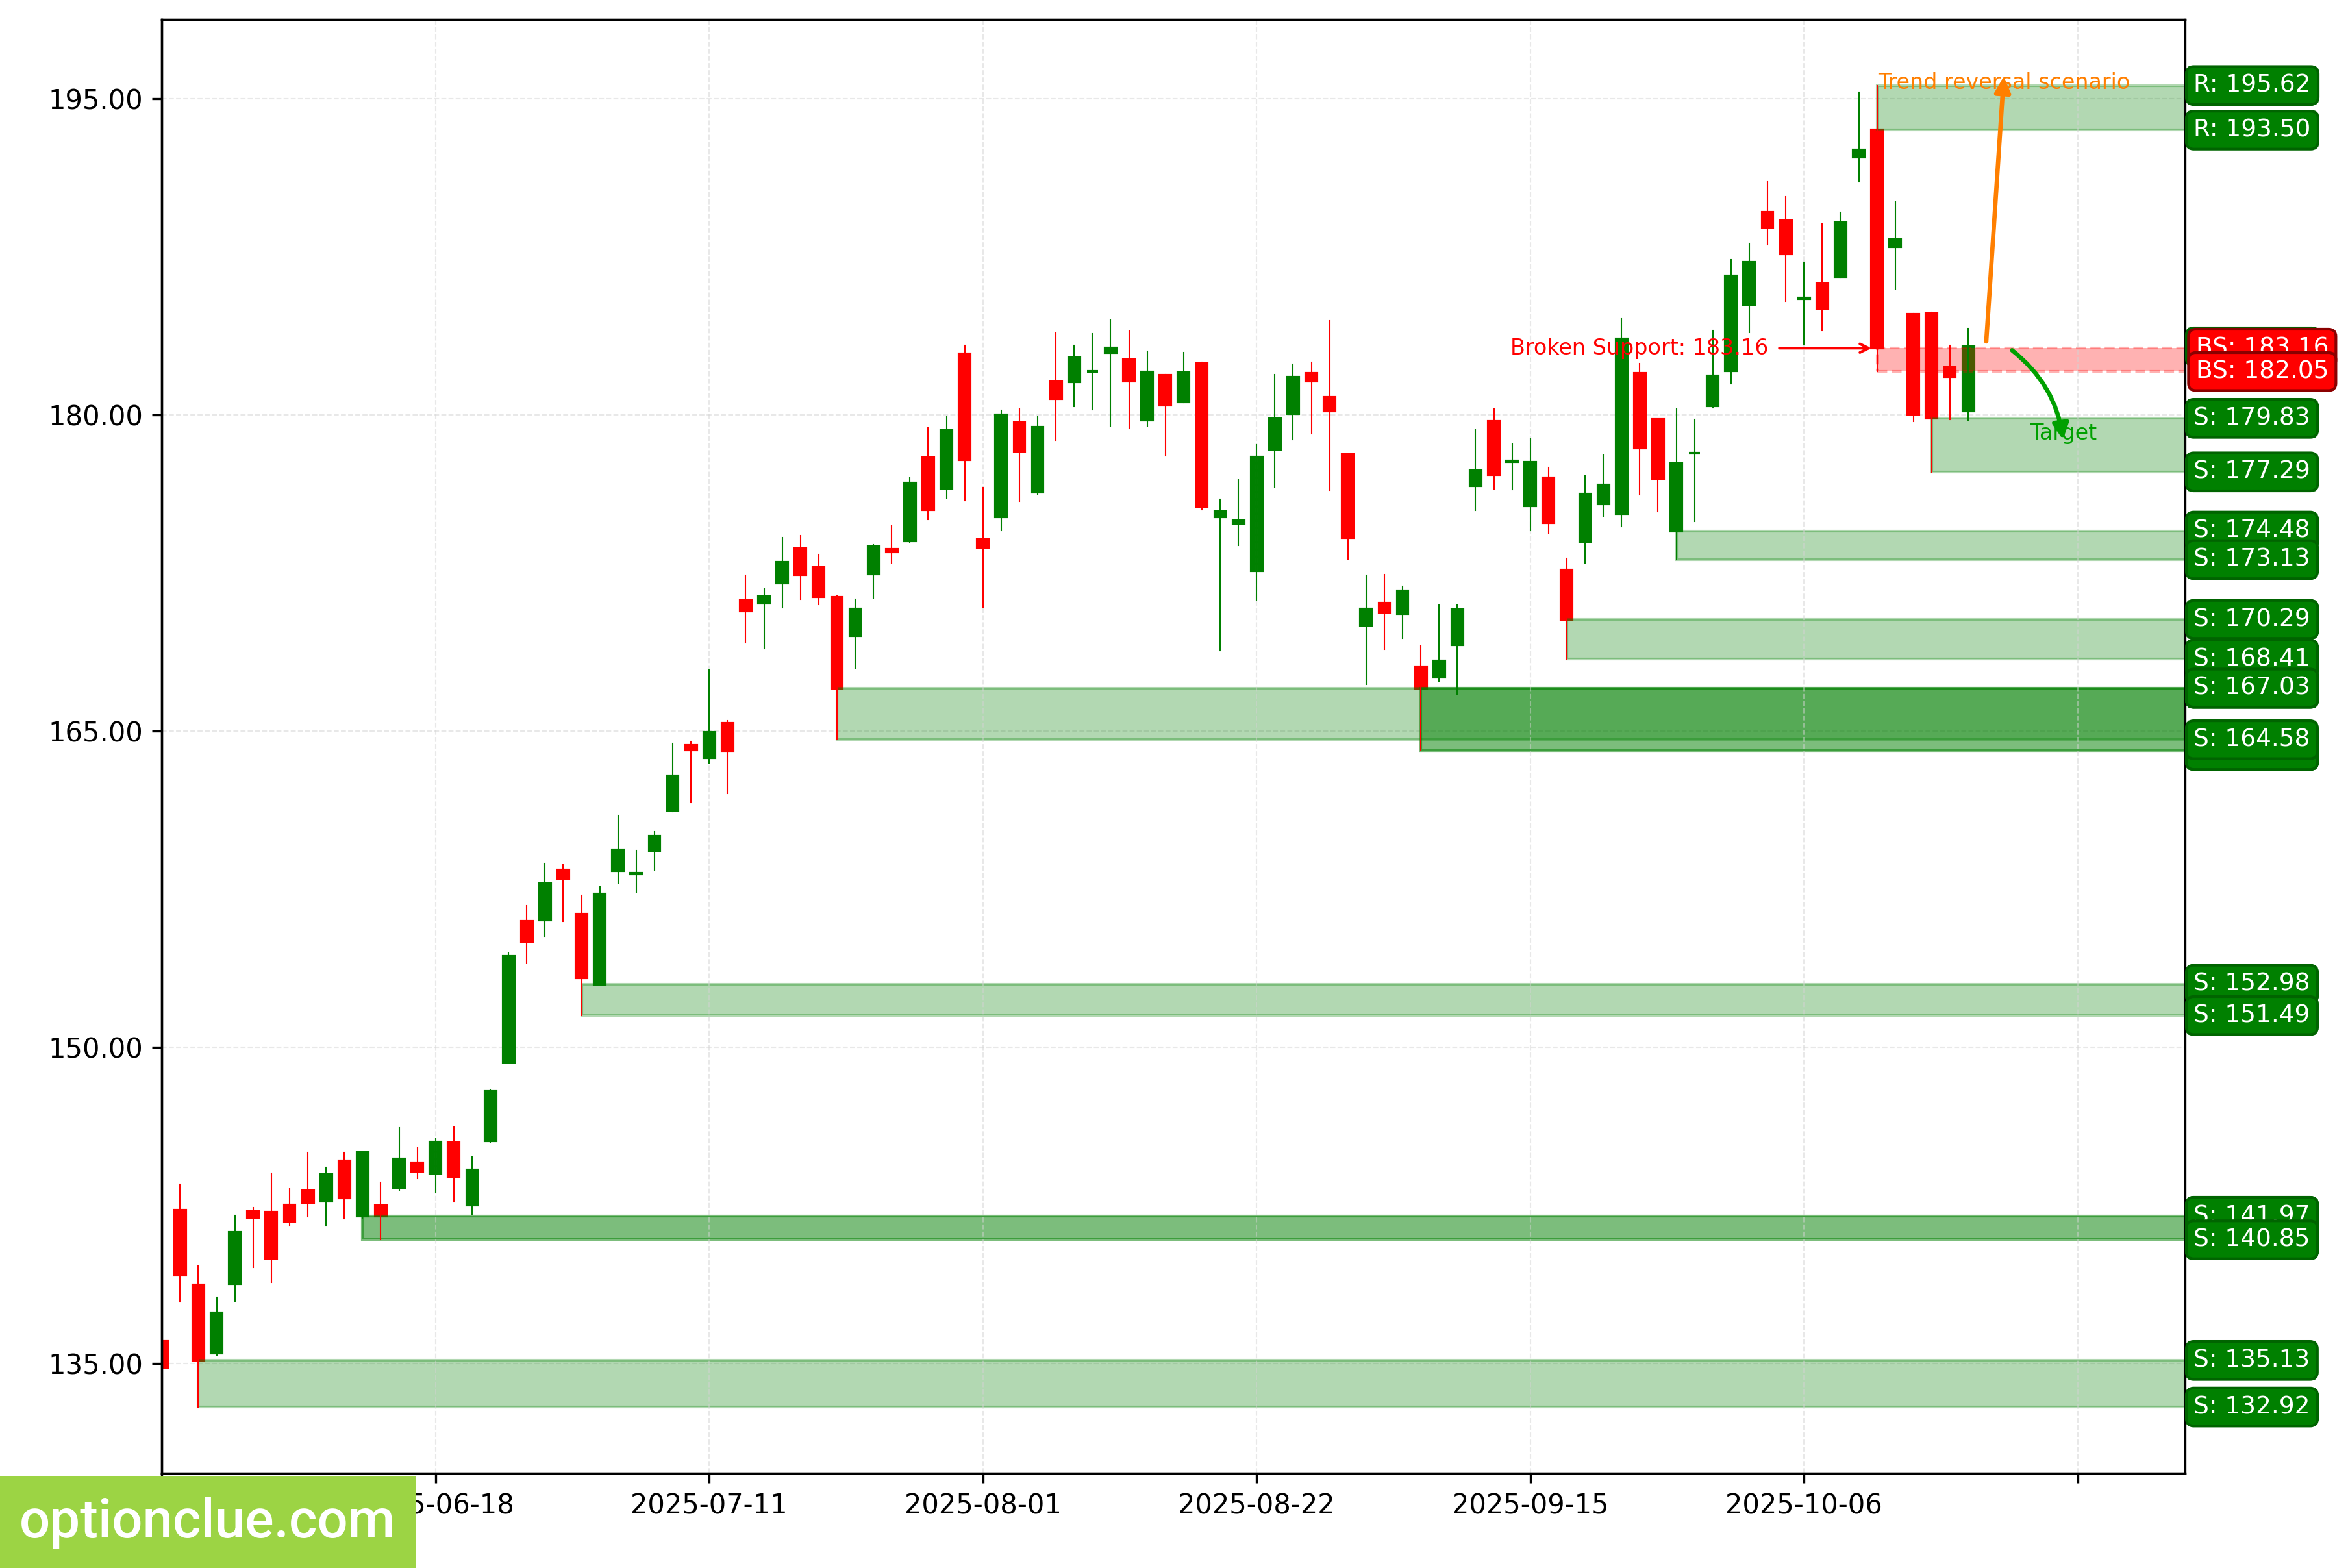
NVIDIA Corp (NVDA)
The trend changed to bearish when a support level at 182.05 — 183.16 formed and was broken last week.
A corrective wave is developing. A sell entry on a rebound may appear after it completes.
The intermediate target for the downward movement is the support level with boundaries at 177.29 — 179.83. If the trend develops successfully, a more distant target will be in the support zone of 173.13 — 174.48.
Short positions will remain relevant as long as the market stays below the nearest resistance level with boundaries at 193.51 — 195.62. A confident breakout of this level would indicate a reversal of the medium-term trend.
NVDA. Technical analysis. D1.
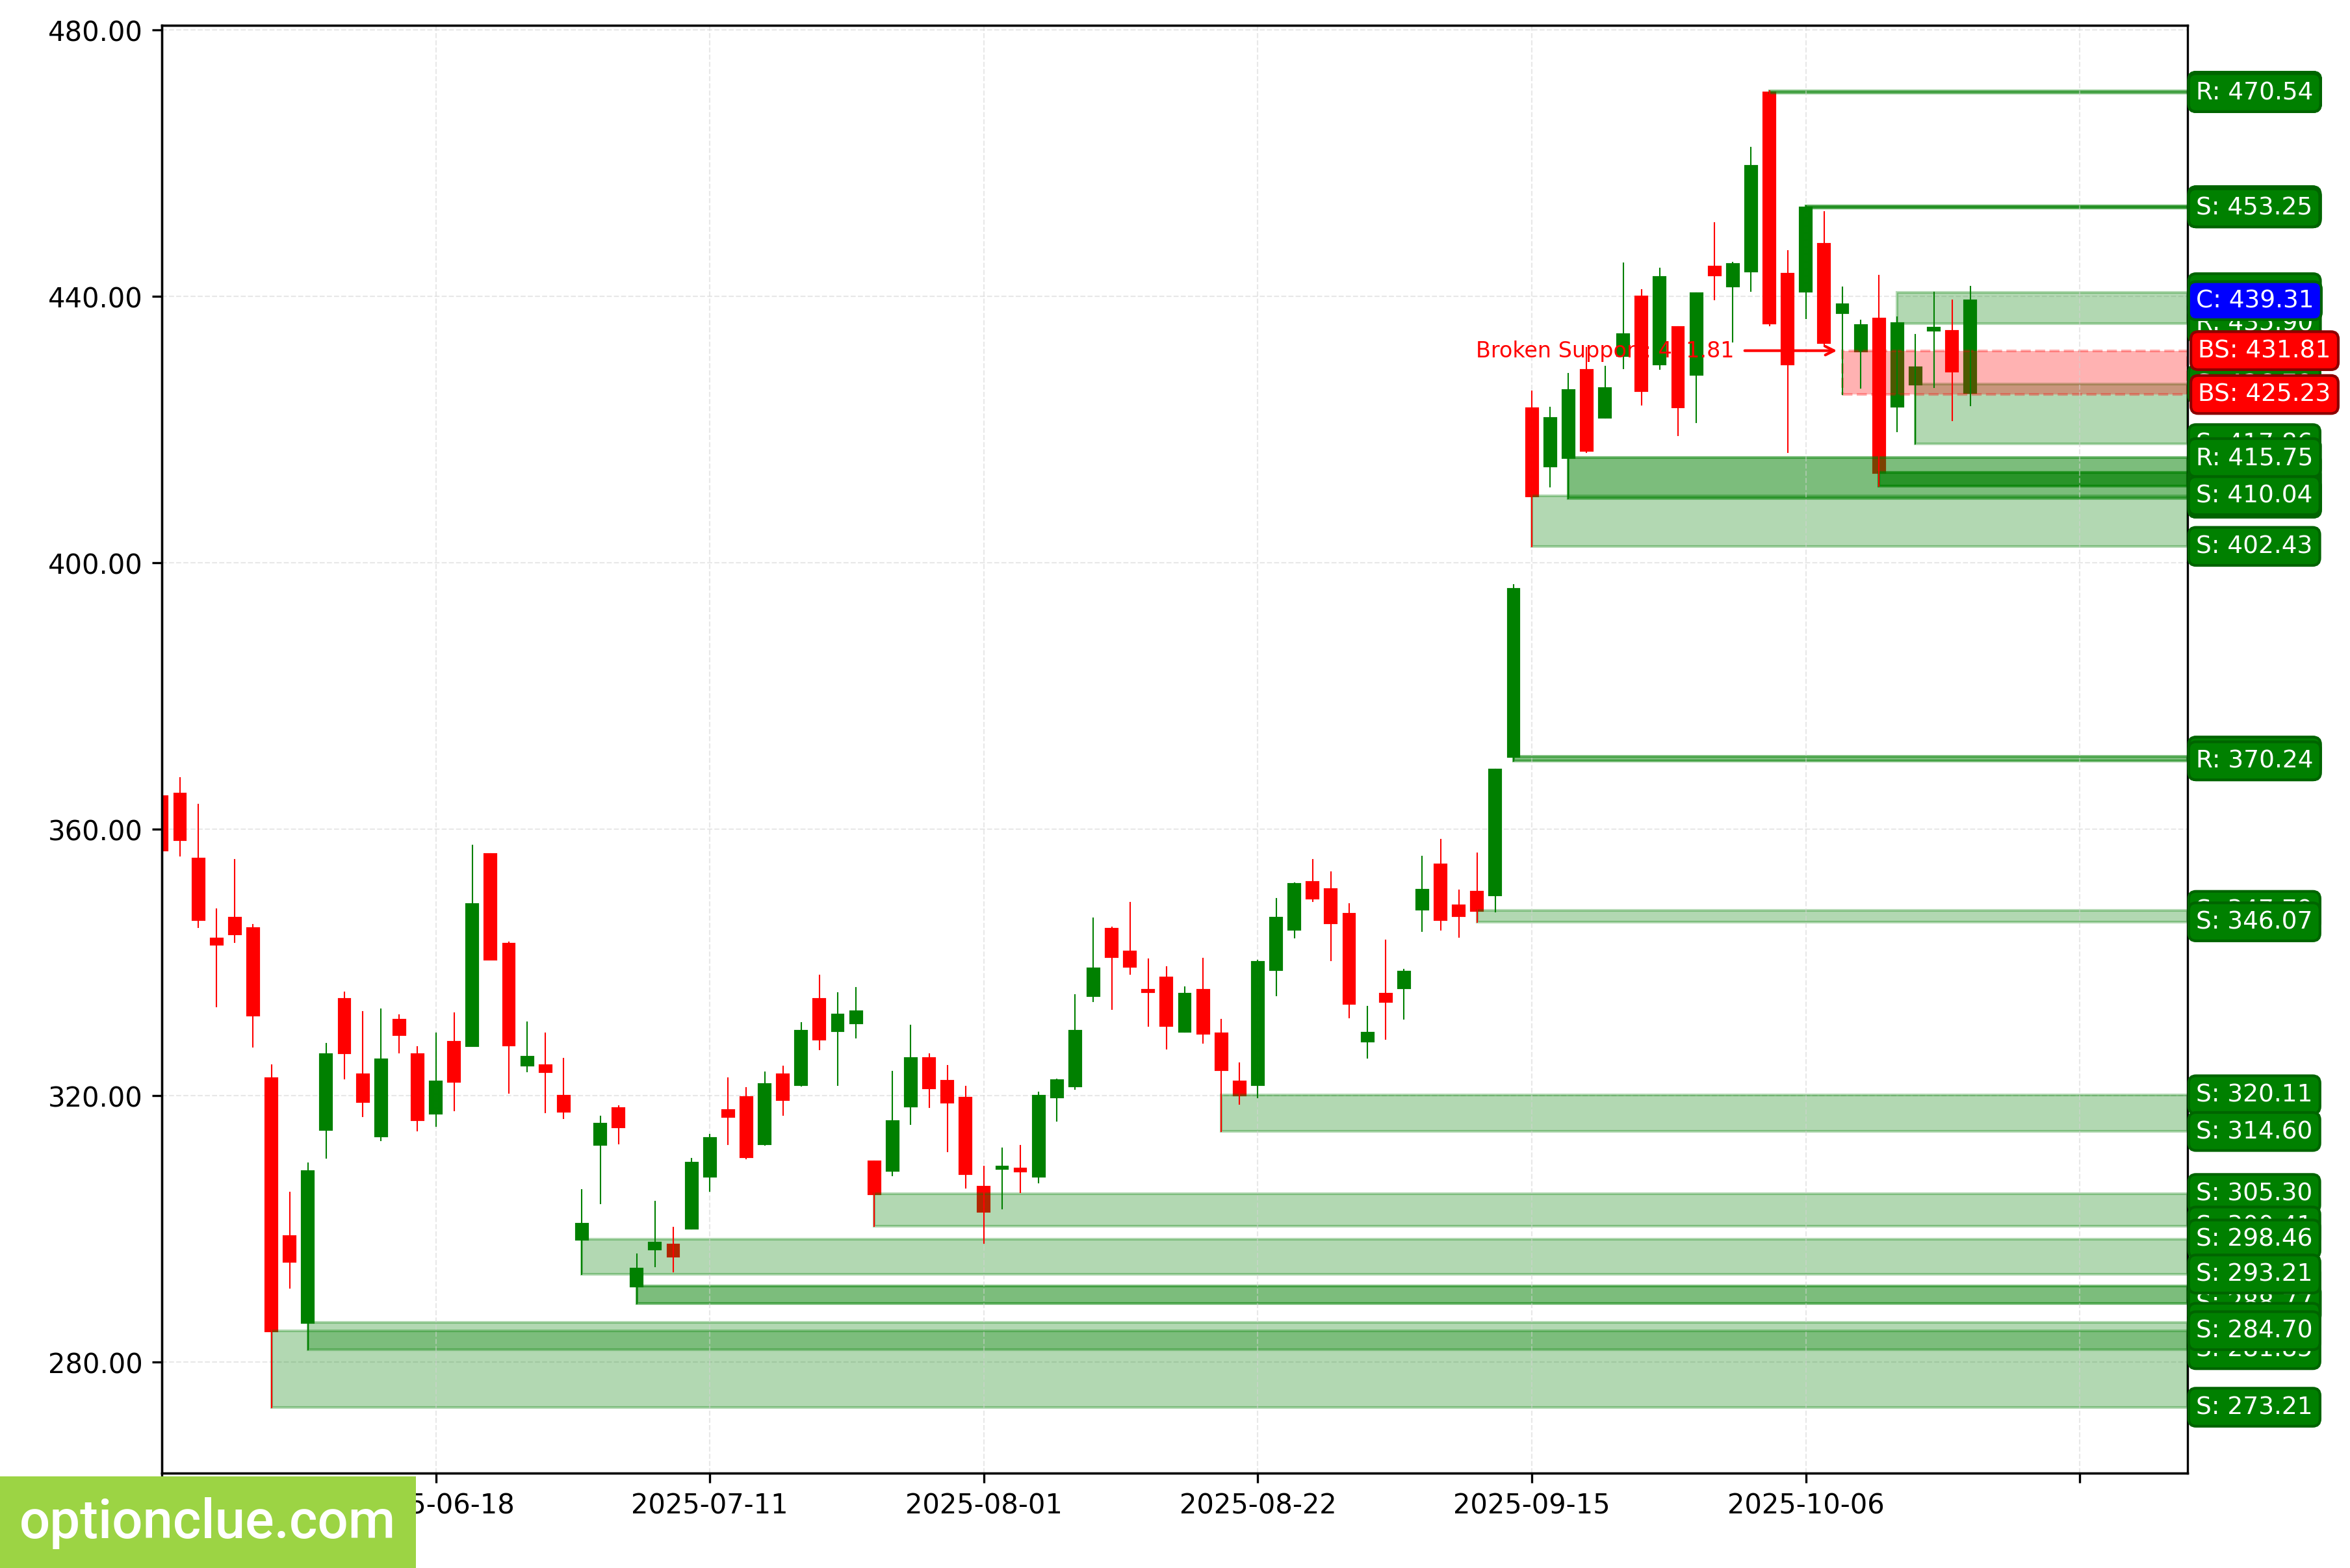
Tesla Inc (TSLA)
The bearish trend continues; the price is consolidating near the last broken level (425.23 — 431.81).
Upon resumption of the downward movement, the first target will be the support level with boundaries at 417.86 — 426.79. A more distant target is located in the support area of 411.45 — 413.49.
Short positions will remain relevant as long as the price stays below the nearest resistance level with boundaries at 435.90 — 440.51. If this zone is broken, the medium-term trend will change to bullish.
TSLA. Technical analysis. D1.
Summary
In the medium-term perspective, EURUSD, USDJPY, NZDUSD, and NVDA stand out with corrections nearing completion on the
daily timeframe.
The other assets may be worthy of attention depending on the depth of the market correction.