
We examine the most important levels for key financial instruments and probable scenarios for the development of events.
Key Topics
- Euro (EURUSD)
- British Pound (GBPUSD)
- Swiss Franc (USDCHF)
- Japanese Yen (USDJPY)
- Canadian Dollar (USDCAD)
- Australian Dollar (AUDUSD)
- Bitcoin (BTC)
- Ether (ETH)
- Apple Inc (AAPL)
- Tesla Inc (TSLA)
- Summary
Euro (EURUSD)
The trend has changed to bearish, the support level (1.1677 — 1.1692) was broken 2 candlesticks ago. An impulse wave is developing. An entry point for selling on a rebound may form after a full correction develops.
The intermediate target for the downward move is the support level with boundaries 1.1471 — 1.1521.
If the correction ends near the resistance level (1.1809 — 1.1809), the potential reward/risk ratio may be approximately 3.8:1. If the correction ends near the most recently broken level (1.1677 — 1.1692), the potential reward/risk ratio may be small (around 0.8:1).
Short positions will remain relevant, as long as the market stays below the nearest resistance level with boundaries 1.1809 — 1.1809. If the market successfully consolidates above this nearest resistance, the trend will reverse to the opposite direction (bullish).
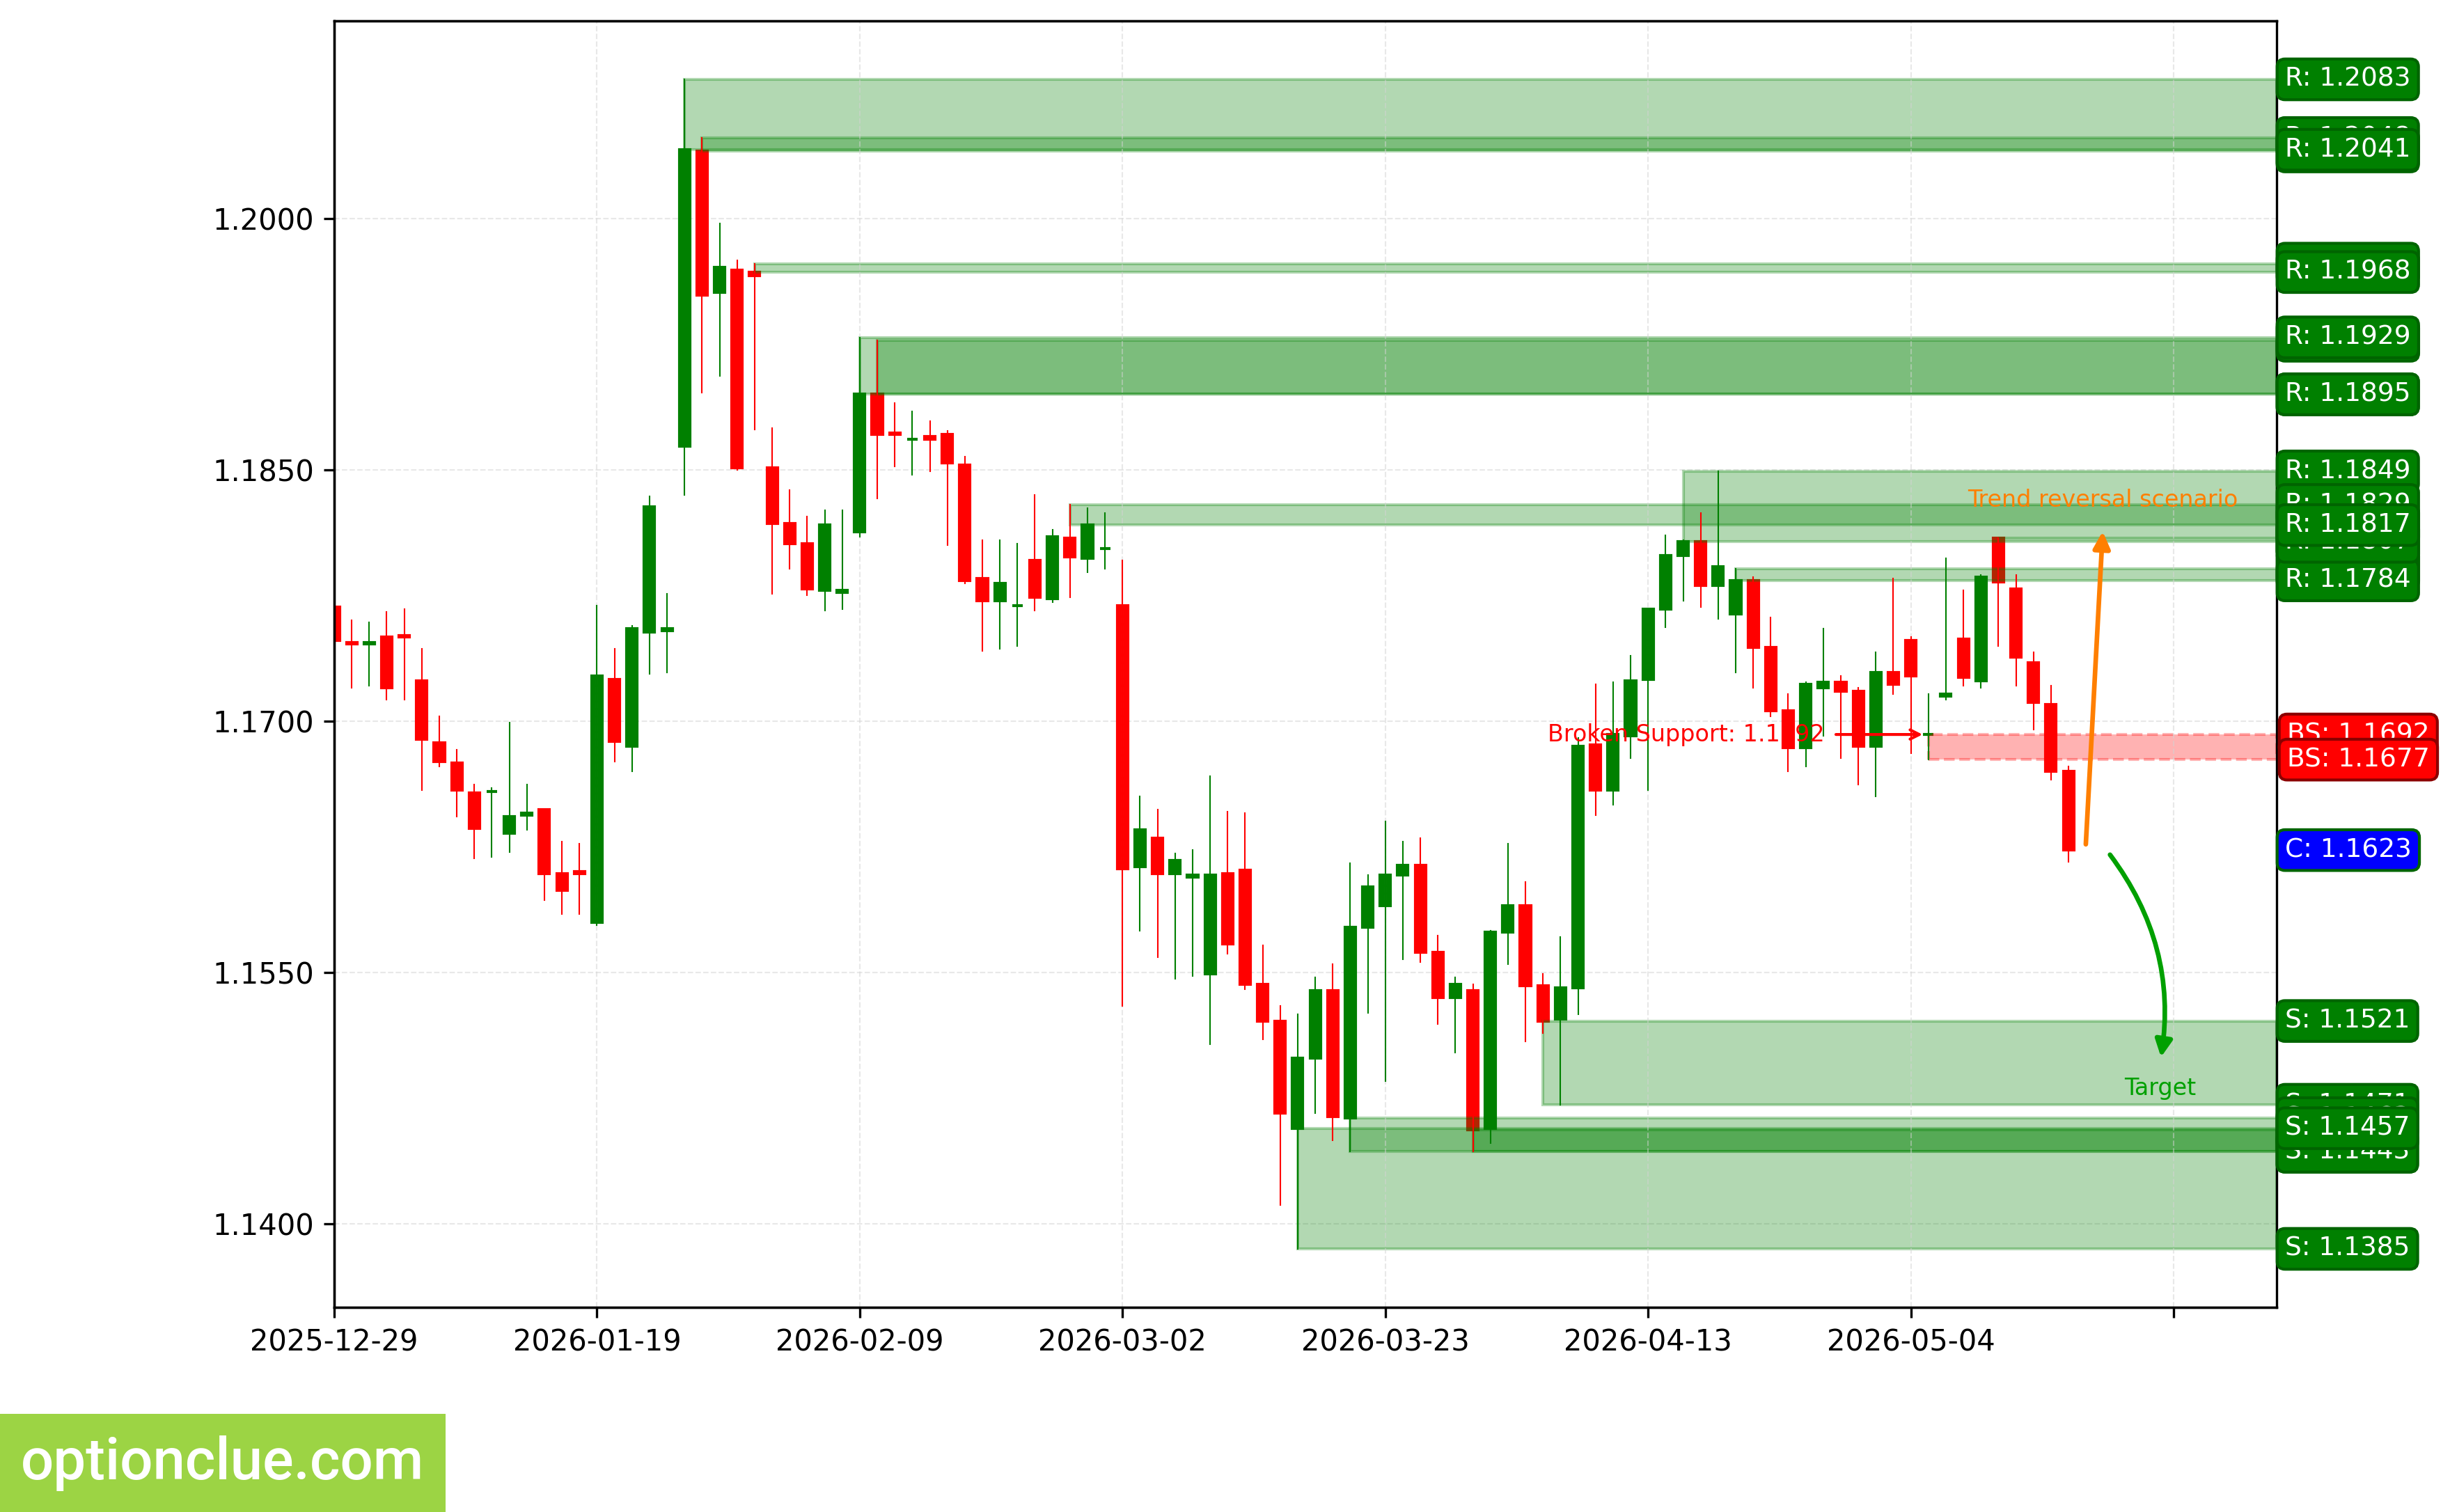
EURUSD. Technical Analysis. D1.
British Pound (GBPUSD)
The trend has changed to bearish 1 candlestick ago, when the support level (1.3511 — 1.3532) was broken. An impulse wave is developing. An entry point for selling on a rebound may form after a full correction develops.
The intermediate target for the downward move is the support level with boundaries 1.3446 — 1.3466. If the trend develops successfully, a more distant target will be at the support level with boundaries 1.3156 — 1.3196.
If the correction ends near the most recently broken level (1.3511 — 1.3532), the potential reward/risk ratio may be small (around 0.2:1). When selecting the more distant target — approximately 1.4:1. If the correction ends near the resistance level (1.3615 — 1.3655), the potential reward/risk ratio may be approximately 1.4:1. For the more distant target — around 3.5:1.
Short positions will remain relevant, as long as the market stays below the nearest resistance level with boundaries 1.3615 — 1.3655. If the market successfully consolidates above this nearest resistance, the trend will reverse to the opposite direction (bullish).
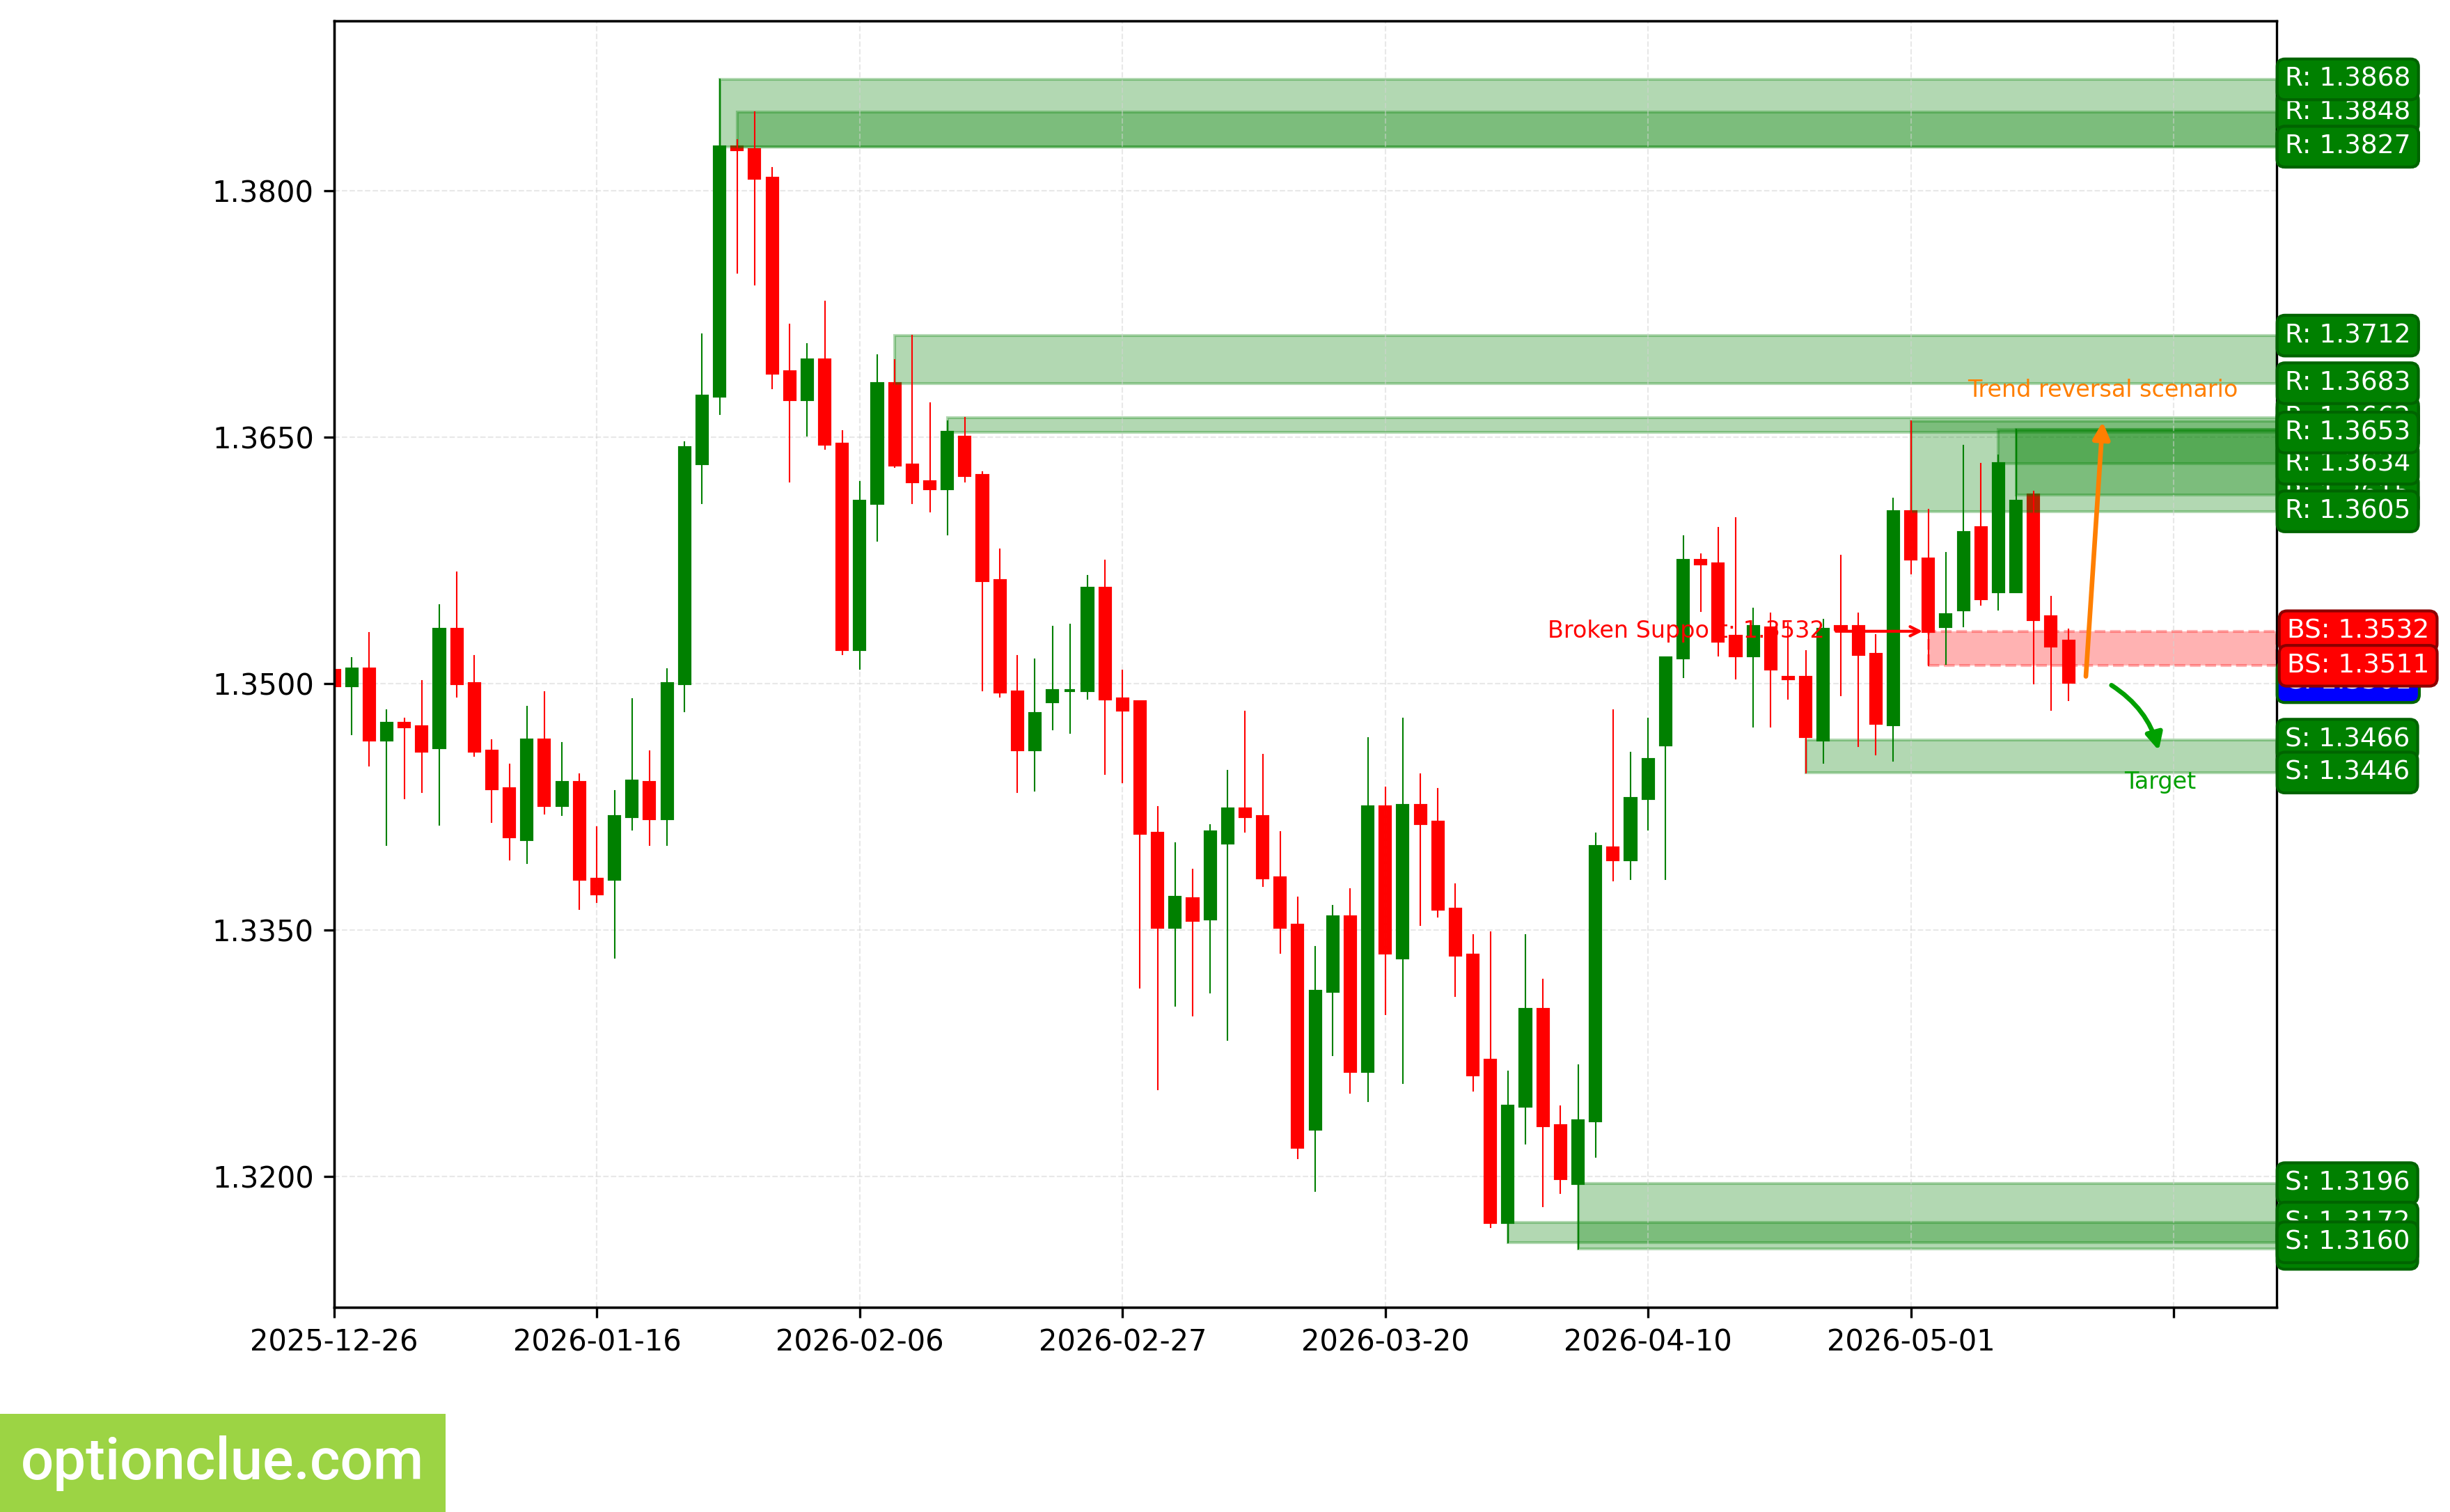
GBPUSD. Technical Analysis. D1.
Swiss Franc (USDCHF)
The trend has changed to bullish, the resistance level (0.7835 — 0.7848) was broken 1 candlestick ago; an impulse wave is developing. An entry point for buying on a rebound may form after a full correction develops.
The intermediate target for the upward move is the resistance level with boundaries 0.7912 — 0.7924. If the trend develops successfully, a more distant target will be at the resistance level with boundaries 0.8010 — 0.8018.
If the new correction ends near the most recently broken level (0.7835 — 0.7848), the potential reward/risk ratio may be small (0.5:1). When using the more distant target — around 1.2:1. If the correction ends near the support level (0.7760 — 0.7768), the potential reward/risk ratio may be approximately 2.2:1. For the more distant target — around 3.7:1.
Long positions will remain relevant, as long as the market stays above the nearest support level with boundaries 0.7760 — 0.7768. If the market successfully consolidates below this support, the trend will reverse to the opposite direction (bearish).
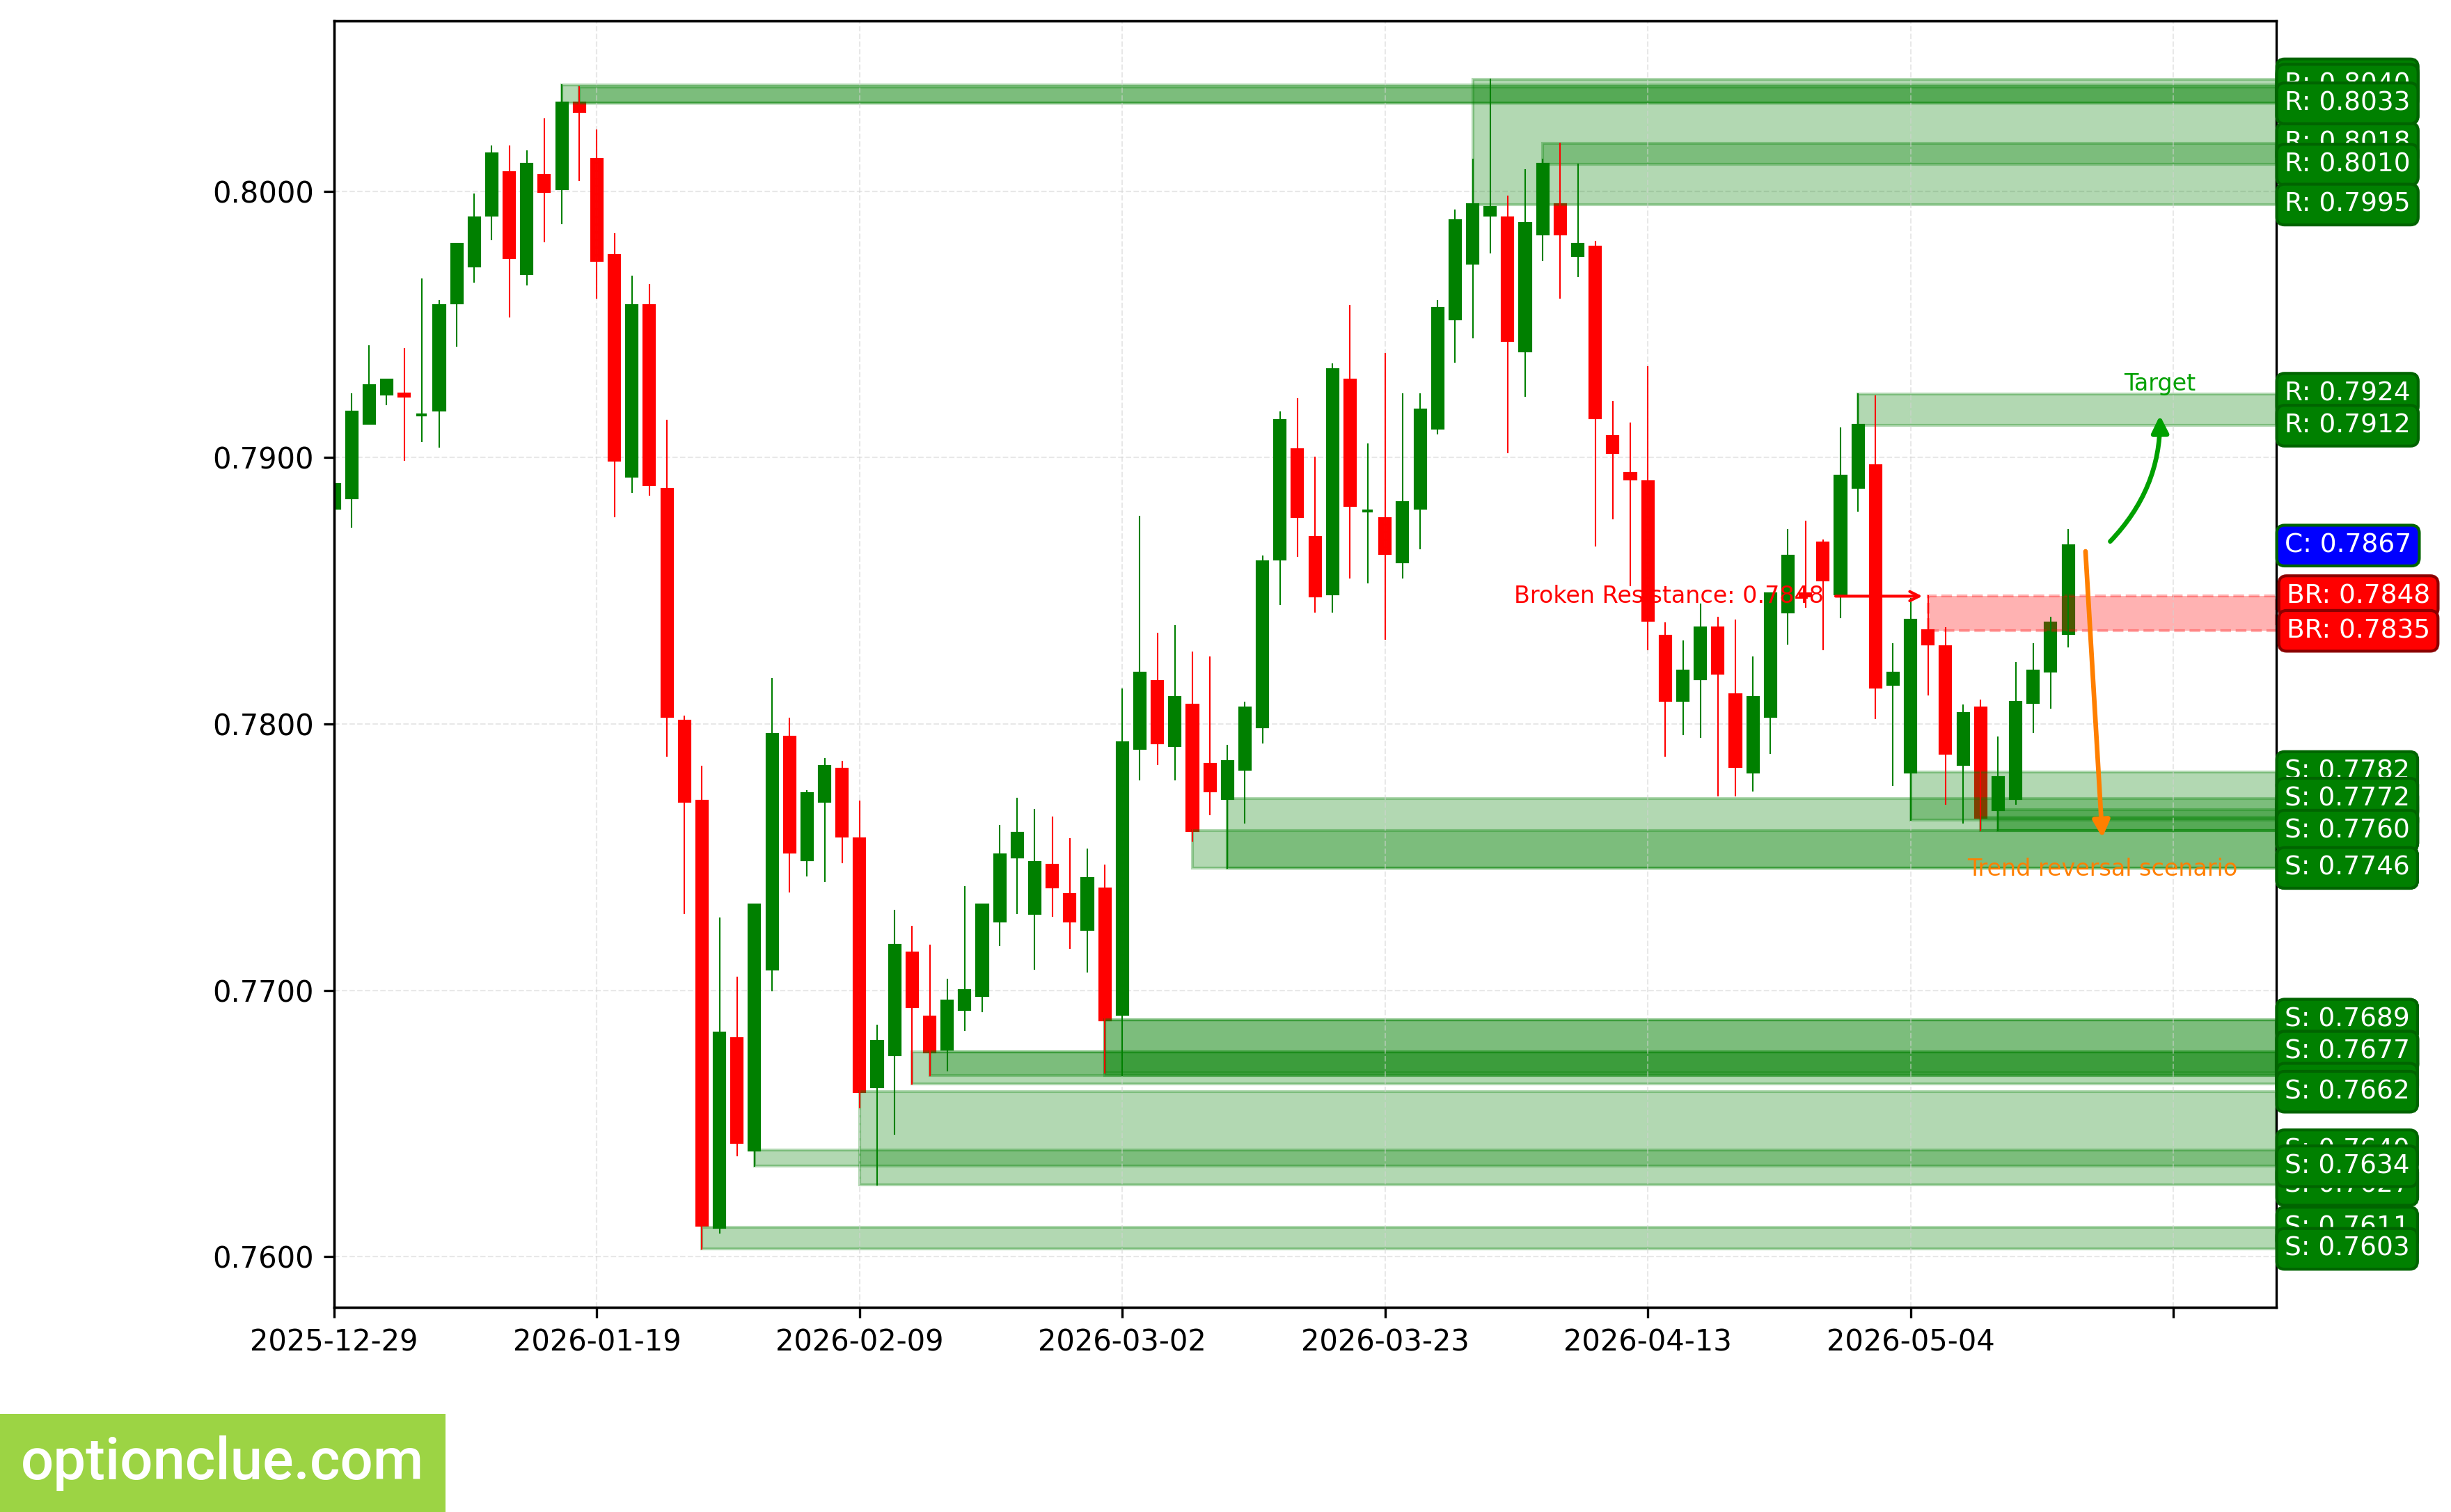
USDCHF. Technical Analysis. D1.
Japanese Yen (USDJPY)
The trend has changed to bullish, when the resistance level (157.68 — 157.89) was broken 2 candlesticks ago. An impulse wave is developing. An entry point for buying on a rebound may form after a correction develops.
The intermediate target for the upward move is the resistance level with boundaries 160.20 — 160.72.
If the correction ends near the support level (156.39 — 156.39), the potential reward/risk ratio may be around 2.4:1.
Long positions will remain relevant, as long as the market stays above the nearest support level with boundaries 156.39 — 156.39. If the market successfully consolidates below this support, the trend will reverse to the opposite direction (bearish).
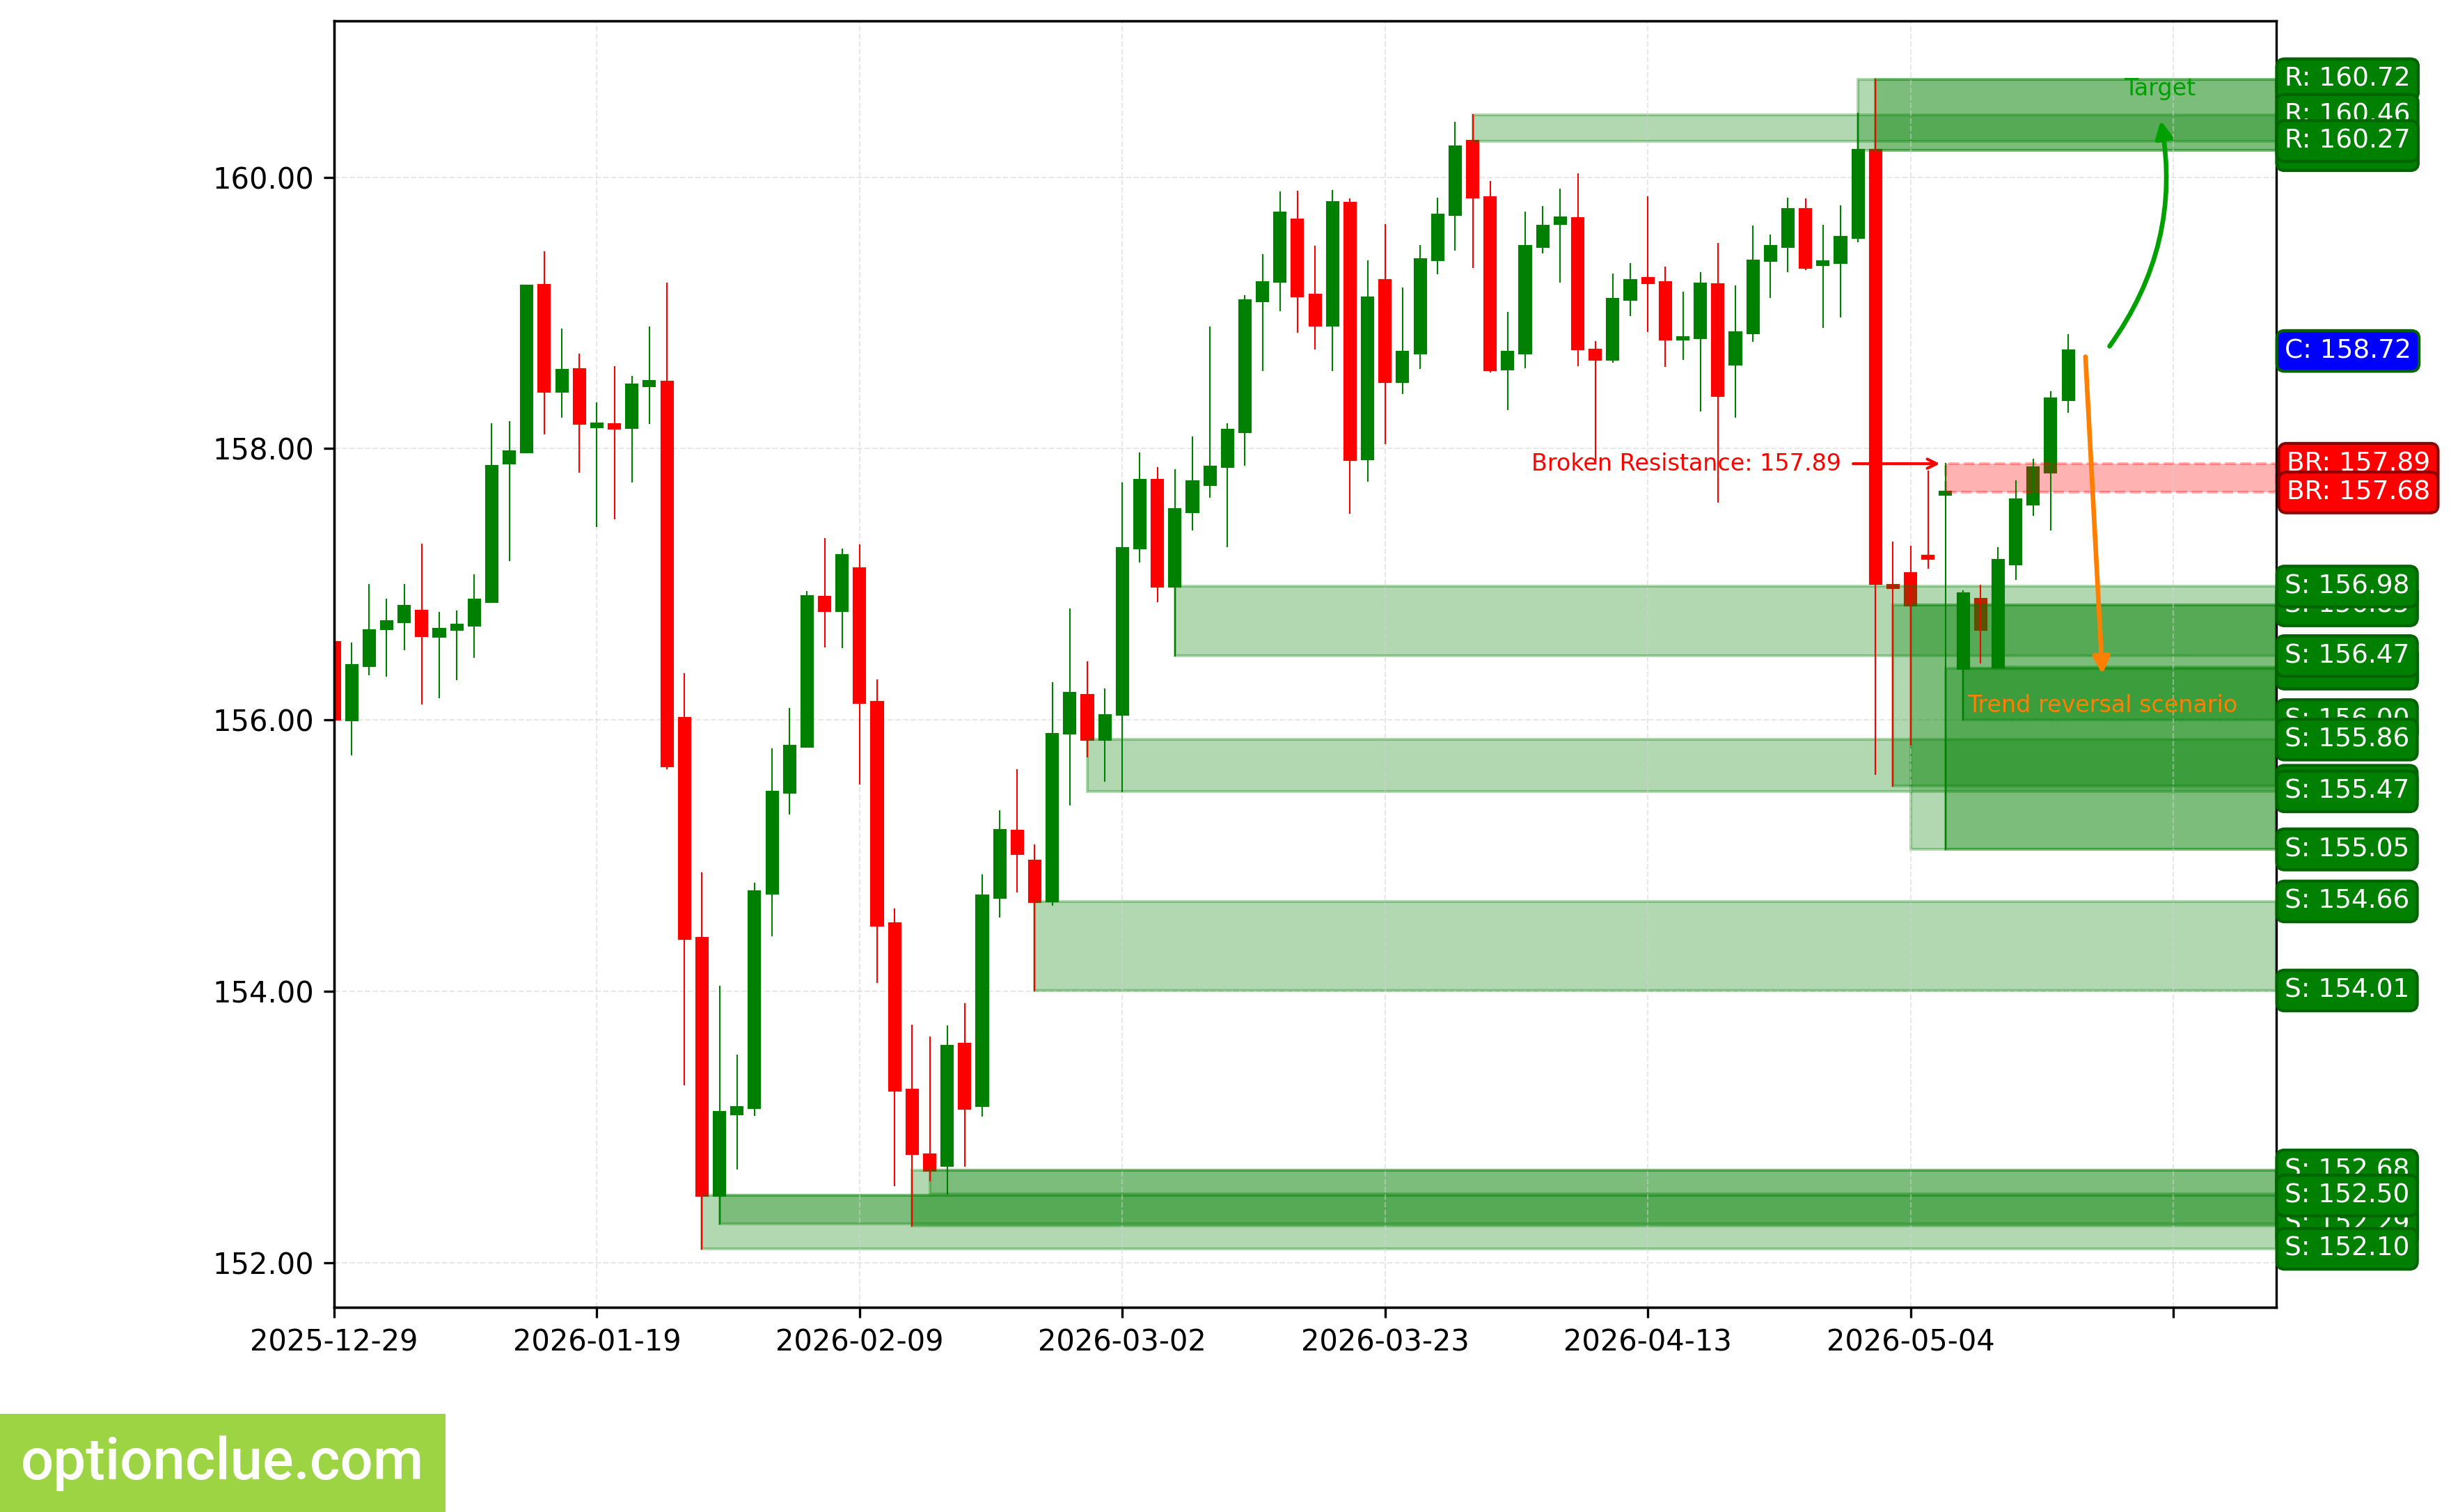
USDJPY. Technical Analysis. D1.
Canadian Dollar (USDCAD)
The trend has changed to bullish, an impulse wave is developing. The most recently broken level is resistance (1.3688 — 1.3710). The breakout occurred 2 candlesticks ago.
The intermediate target for the upward move is the resistance level with boundaries 1.3849 — 1.3877. If the trend develops successfully, a more distant target will be at the resistance level with boundaries 1.3947 — 1.3949.
If the next correction ends near the support level (1.3548 — 1.3580), the potential reward/risk ratio may be around 3.4:1. When selecting the more distant target — around 4.5:1. If the correction ends near the most recently broken level (1.3688 — 1.3710), the potential reward/risk ratio may be small (around 0.7:1).
Long positions will remain relevant, as long as the market stays above the nearest support level with boundaries 1.3548 — 1.3580. If the market successfully consolidates below this support, the trend will reverse to the opposite direction (bearish).
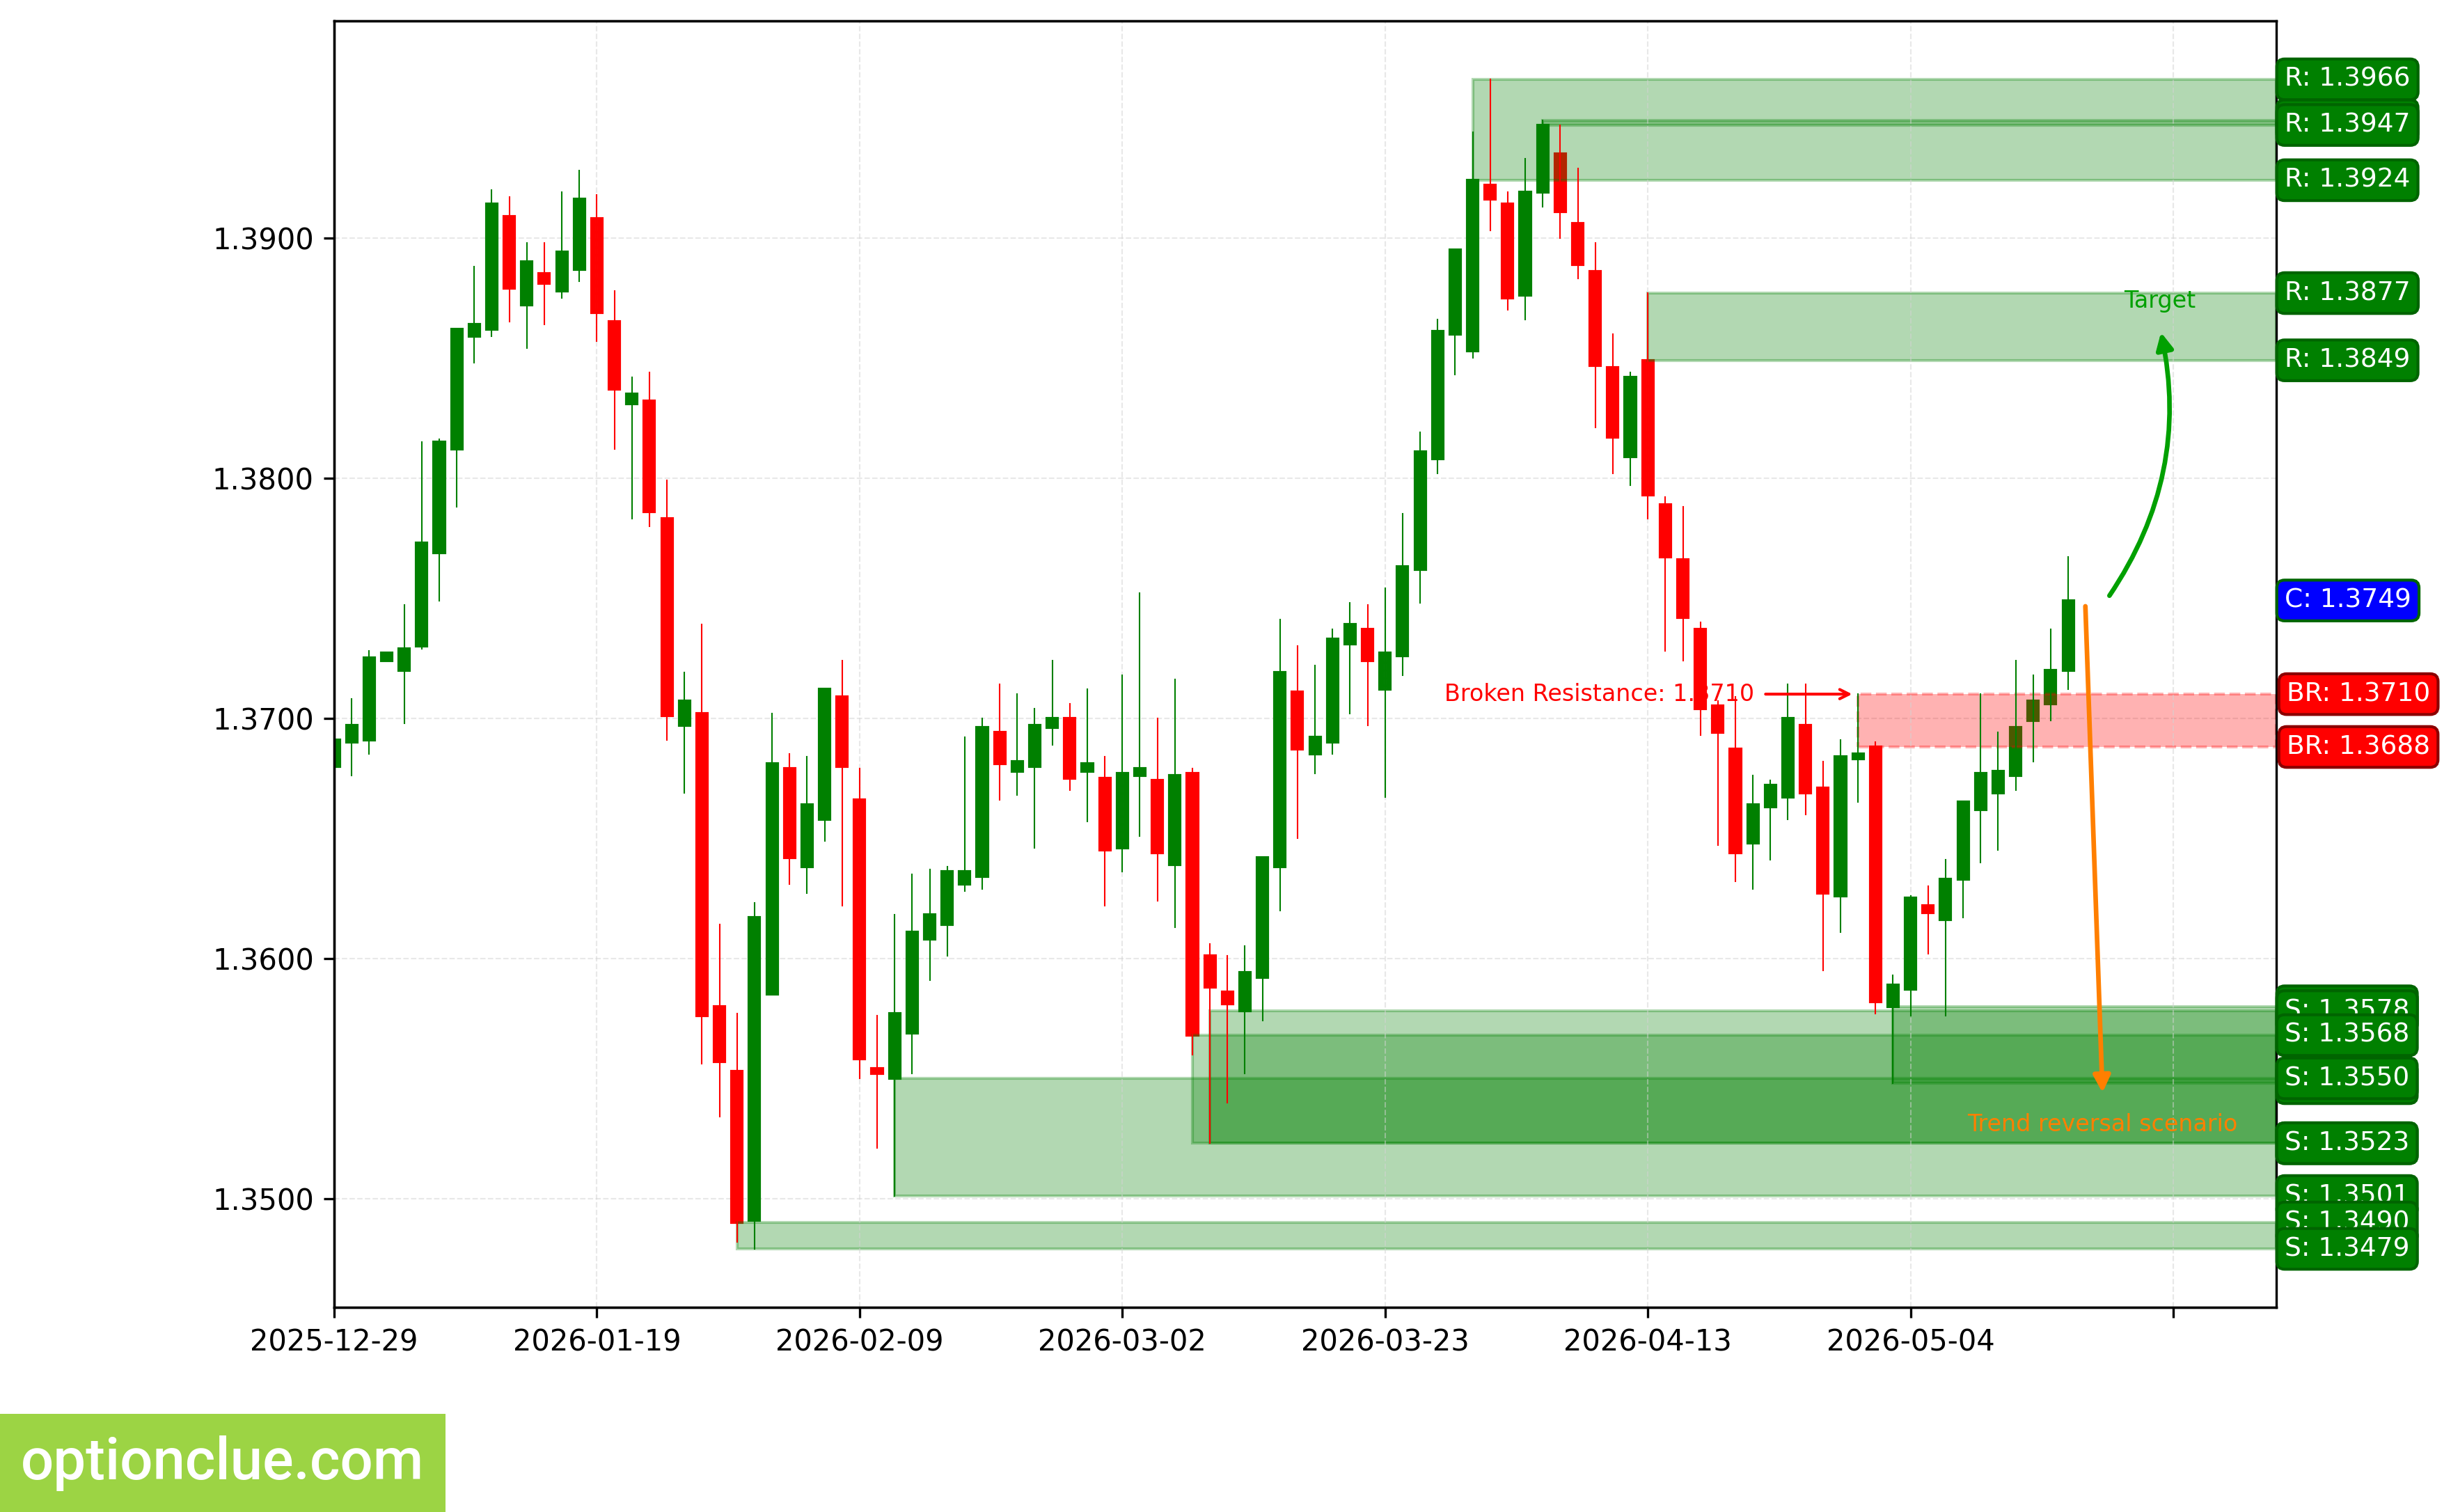
USDCAD. Technical Analysis. D1.
Australian Dollar (AUDUSD)
The bullish trend continues, a corrective wave is developing. An entry point for buying on a rebound may form after the current correction completes. The most recently broken level is resistance (0.7221 — 0.7227). The breakout occurred 8 candlesticks ago.
Upon resumption of the upward move, the first target will be the resistance level with boundaries 0.7262 — 0.7271.
If the correction ends near the support level (0.7134 — 0.7167), the potential reward/risk ratio may be approximately 1.3:1.
Long positions will remain relevant, as long as the market stays above the nearest support level with boundaries 0.7134 — 0.7167. If the market successfully consolidates below this support, the trend will reverse to the opposite direction (bearish).
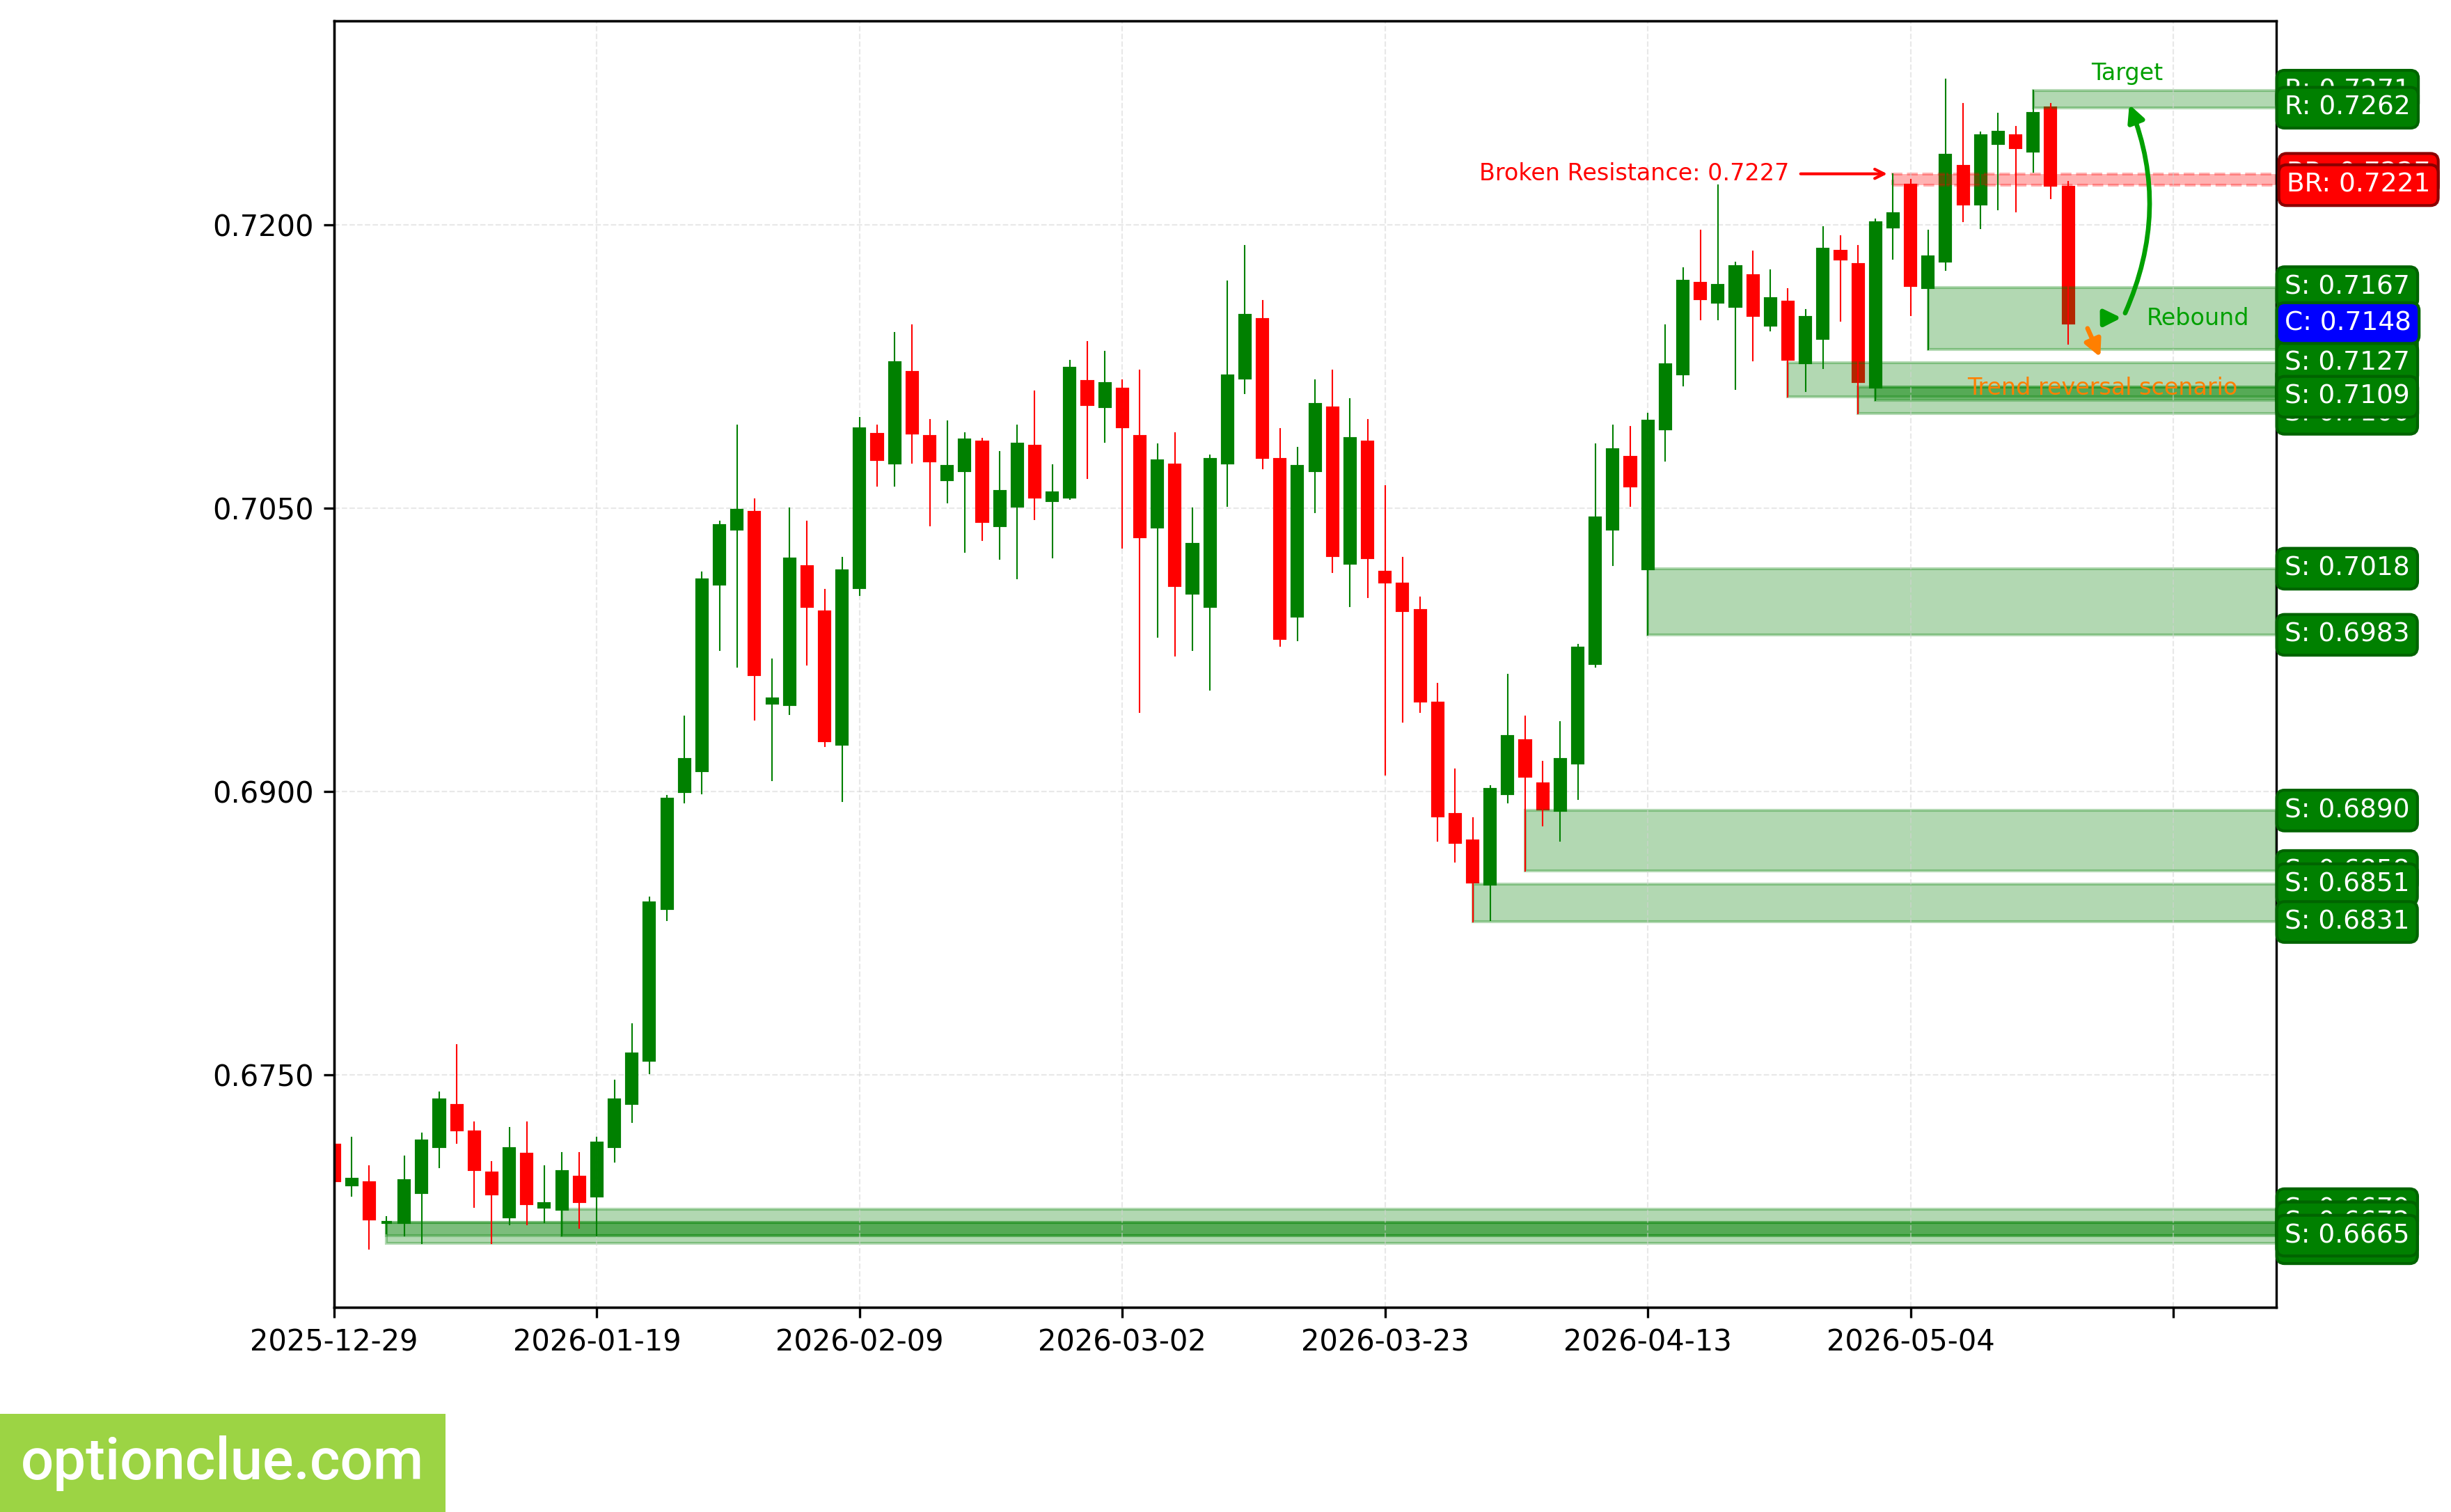
AUDUSD. Technical Analysis. D1.
Bitcoin (BTC)
The trend has changed to bearish, the support level (79206 — 80010) was broken 1 candlestick ago. An impulse wave is developing. An entry point for selling on a rebound may form after a full correction develops.
The intermediate target for the downward move is the support level with boundaries 74959 — 75776. If the trend develops successfully, a more distant target will be at the support level with boundaries 70589 — 70758.
If the correction ends near the resistance level (82139 — 82326), the potential reward/risk ratio may be around 3:1. When using the more distant target — around 5:1.
Short positions will remain relevant, as long as the market stays below the nearest resistance level with boundaries 82139 — 82326. If the market successfully consolidates above this nearest resistance, the trend will reverse to the opposite direction (bullish).
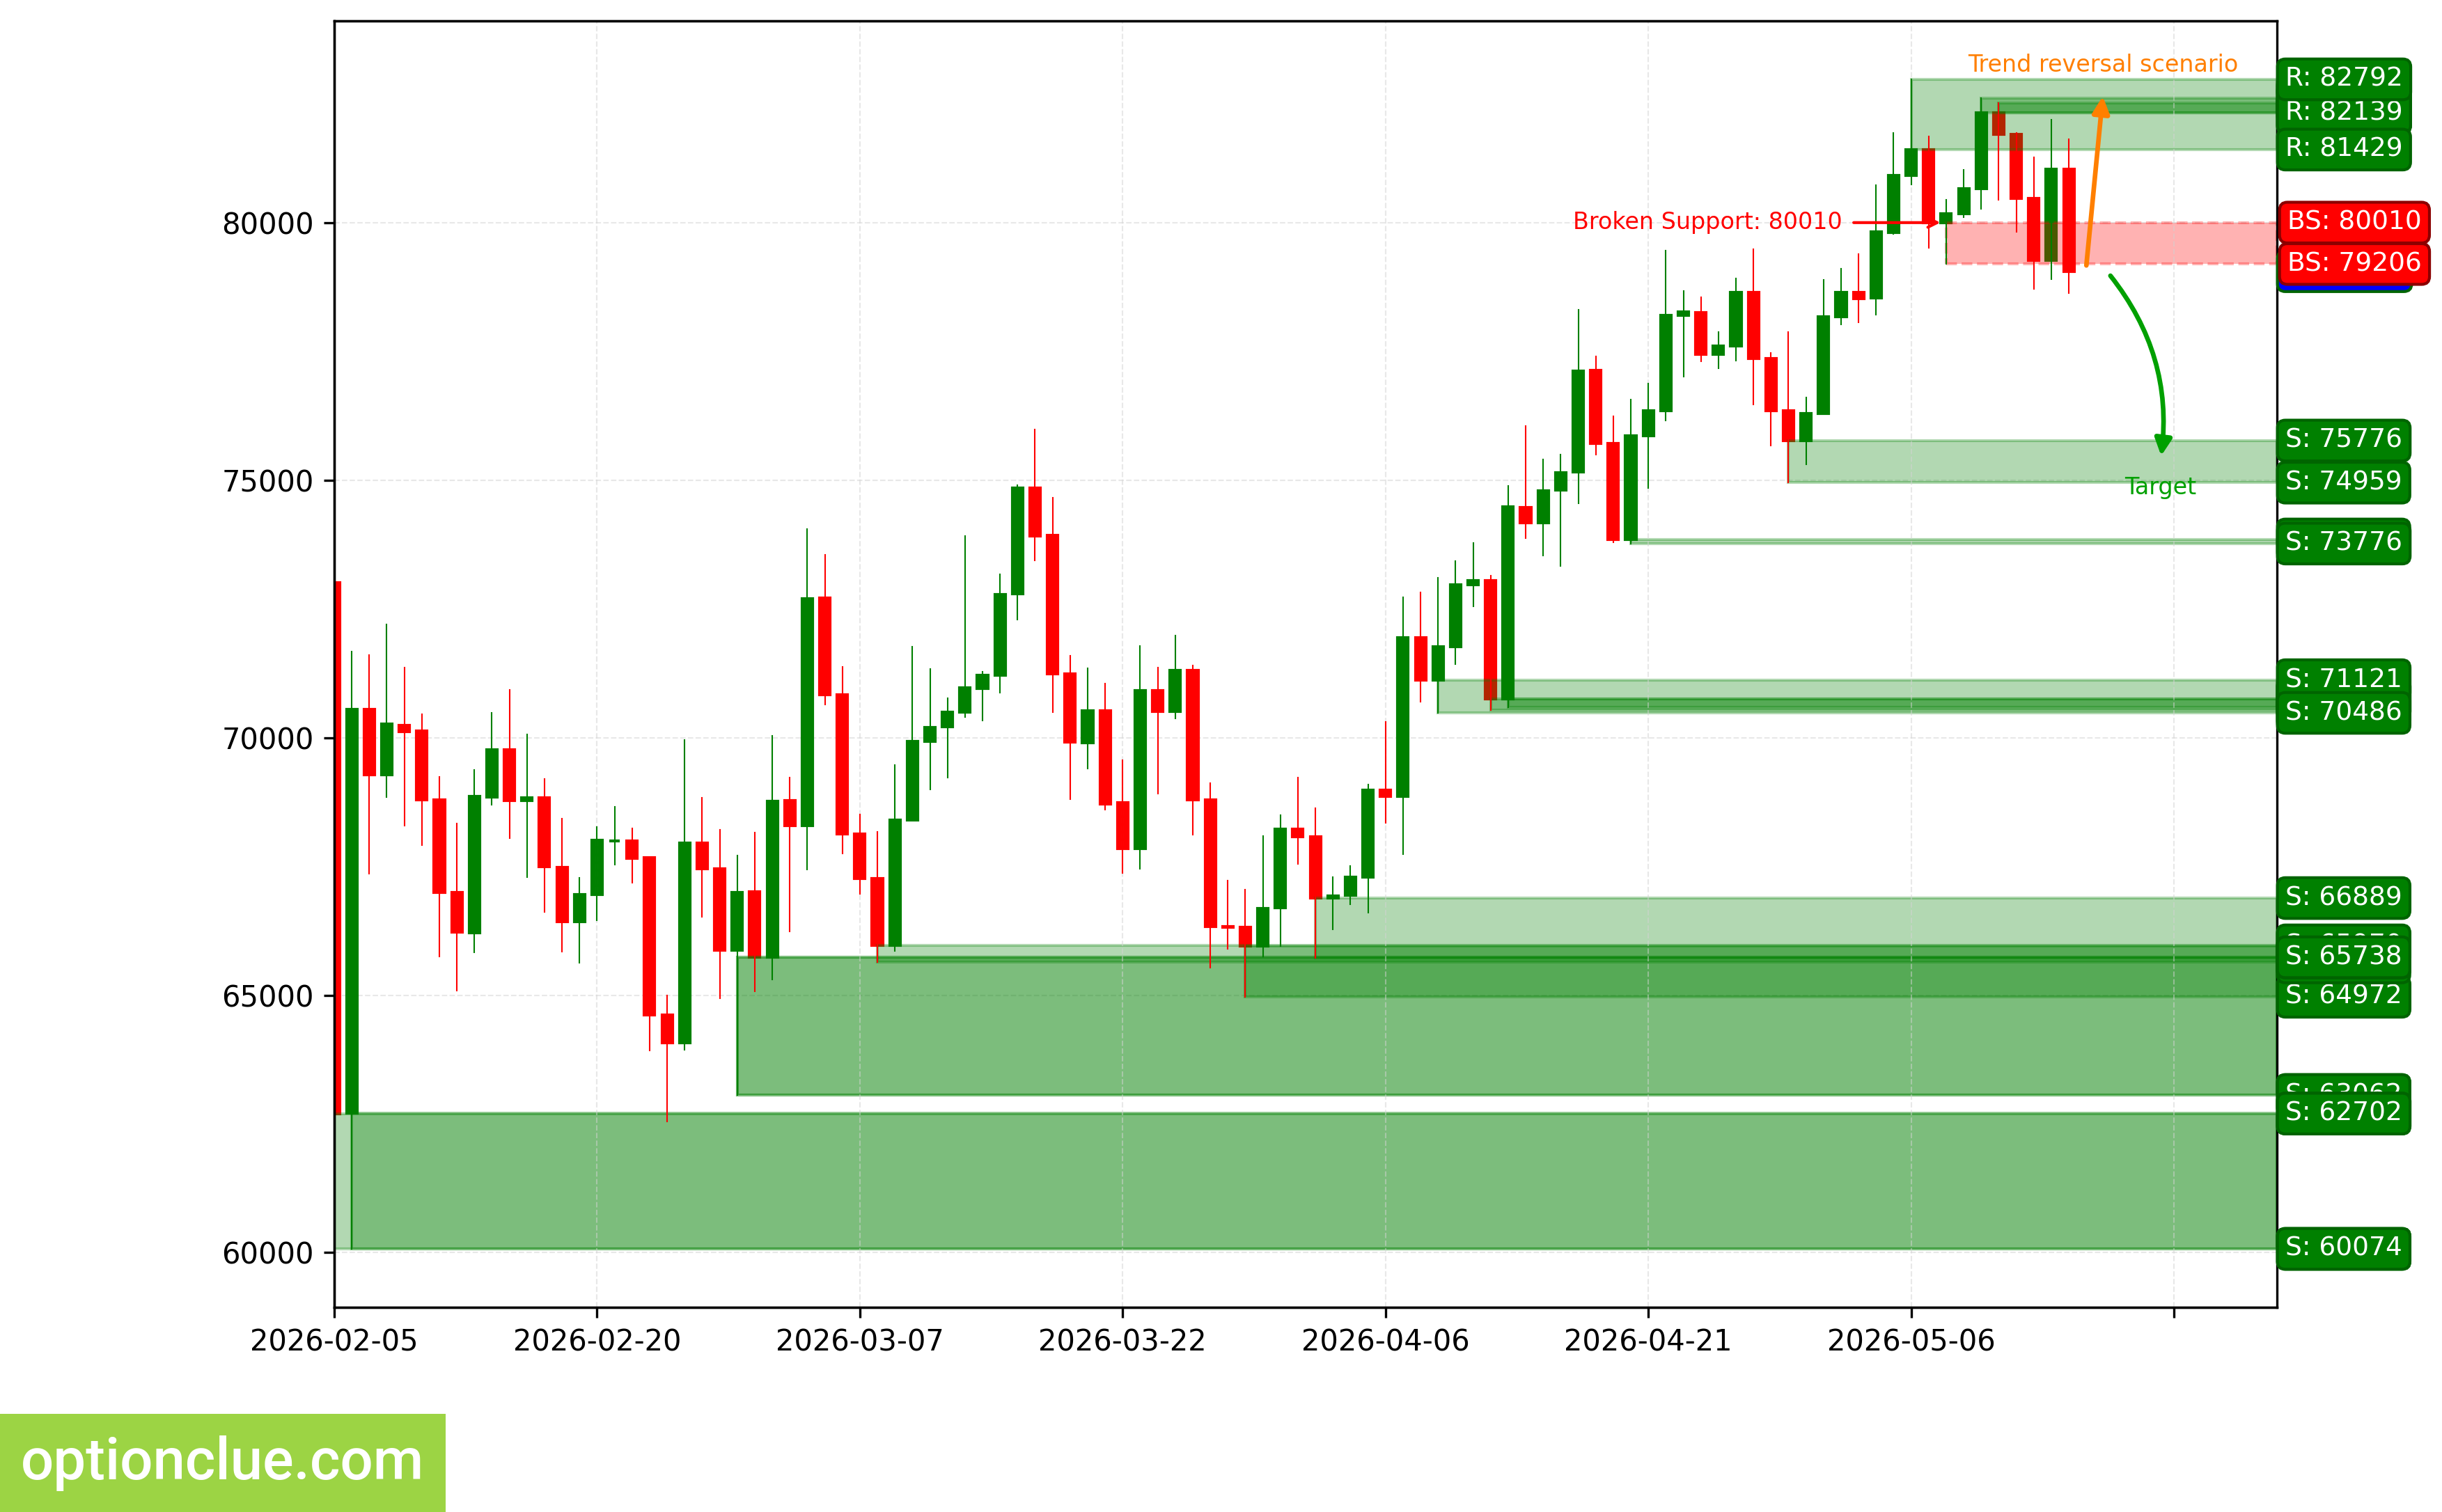
BTC. Technical Analysis. D1.
Ether (ETH)
The bearish trend continues, an impulse wave is developing. The most recently broken level is support (2266 — 2291). The breakout occurred 3 candlesticks ago.
The intermediate target for the downward move is the support level with boundaries 2176 — 2192. If the trend develops successfully, a more distant target will be at the support level with boundaries 2023 — 2053.
If the correction ends near the resistance level (2369 — 2381), the potential reward/risk ratio may be around 2.3:1. When using the more distant target — around 4:1. If the correction ends near the most recently broken level (2266 — 2291), the potential reward/risk ratio may be small (around 0.5:1). When selecting the more distant target — approximately 1.3:1.
Short positions will remain relevant, as long as the market stays below the nearest resistance level with boundaries 2369 — 2381. If the market successfully consolidates above this nearest resistance, the trend will reverse to the opposite direction (bullish).
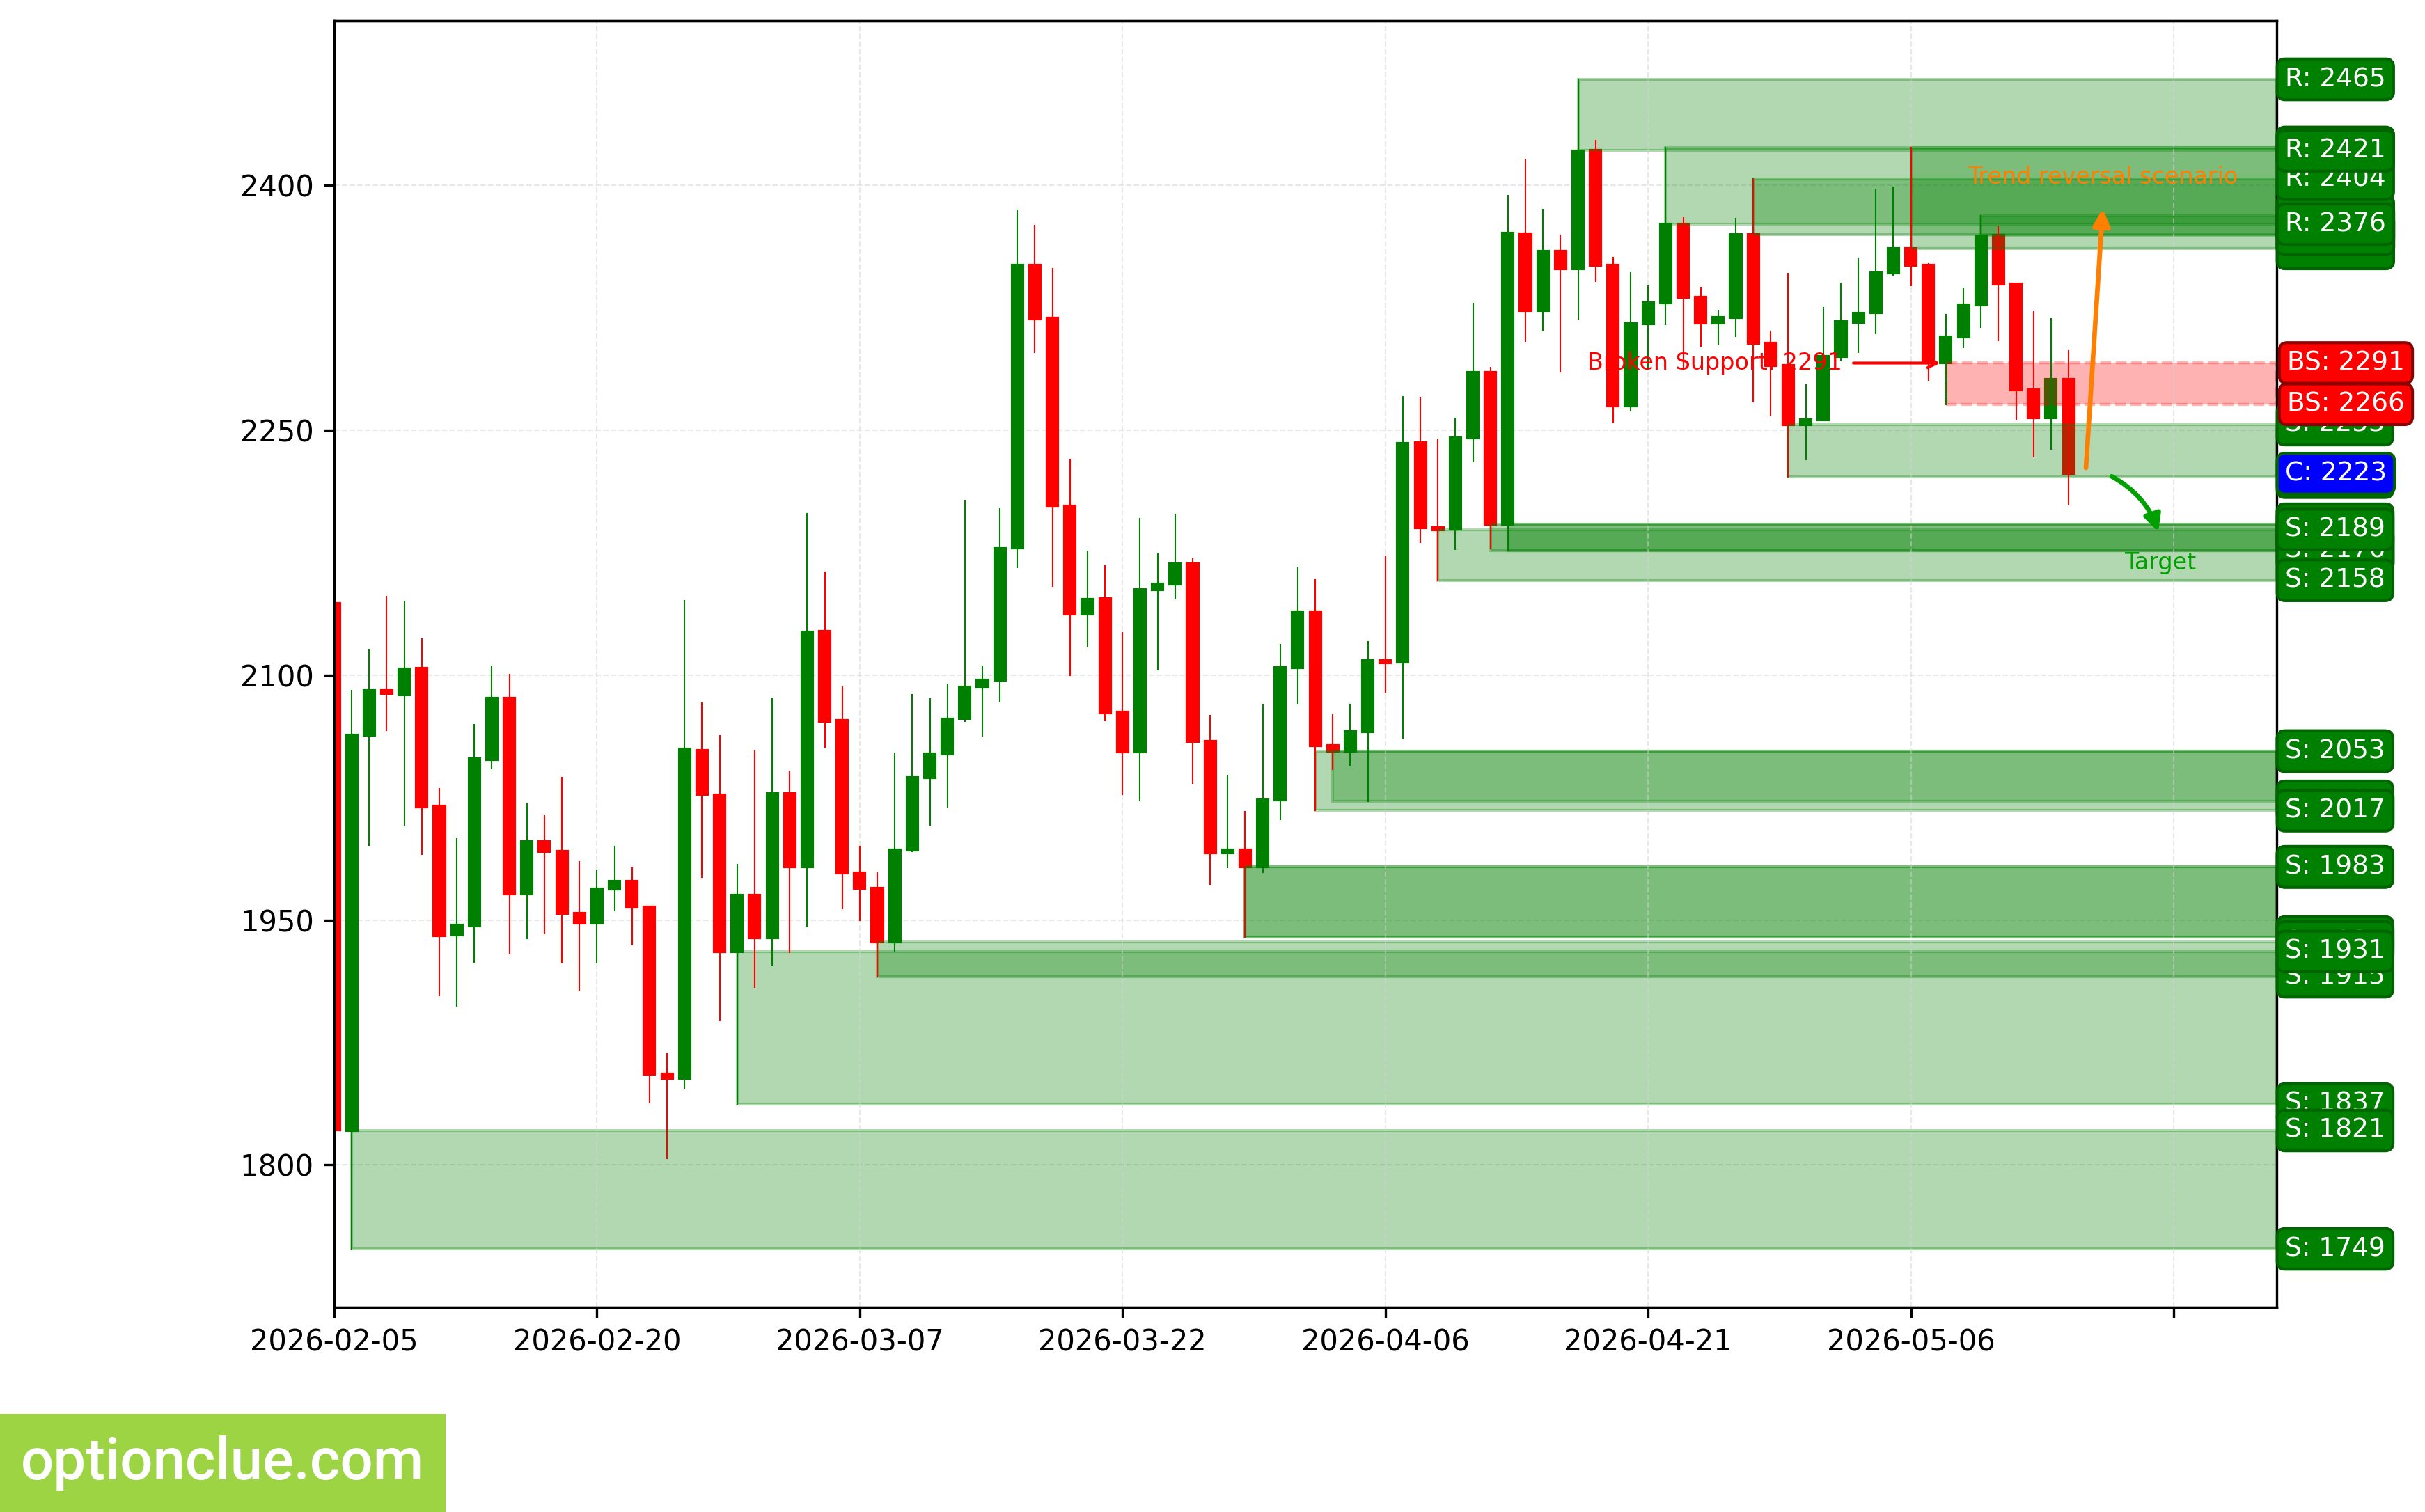
ETH. Technical Analysis. D1.
Apple Inc (AAPL)
The bullish trend continues, the correction completed 9 candlesticks ago and an entry point for buying on a rebound formed; an impulse wave is developing. The most recently broken level is resistance (275.05 — 275.77). The breakout occurred 11 candlesticks ago.
No relevant levels for determining price targets on the current timeframe have been identified.
Long positions will remain relevant, as long as the market stays above the nearest support level with boundaries 276.50 — 276.93. If the market successfully consolidates below this support, the trend will reverse to the opposite direction (bearish).
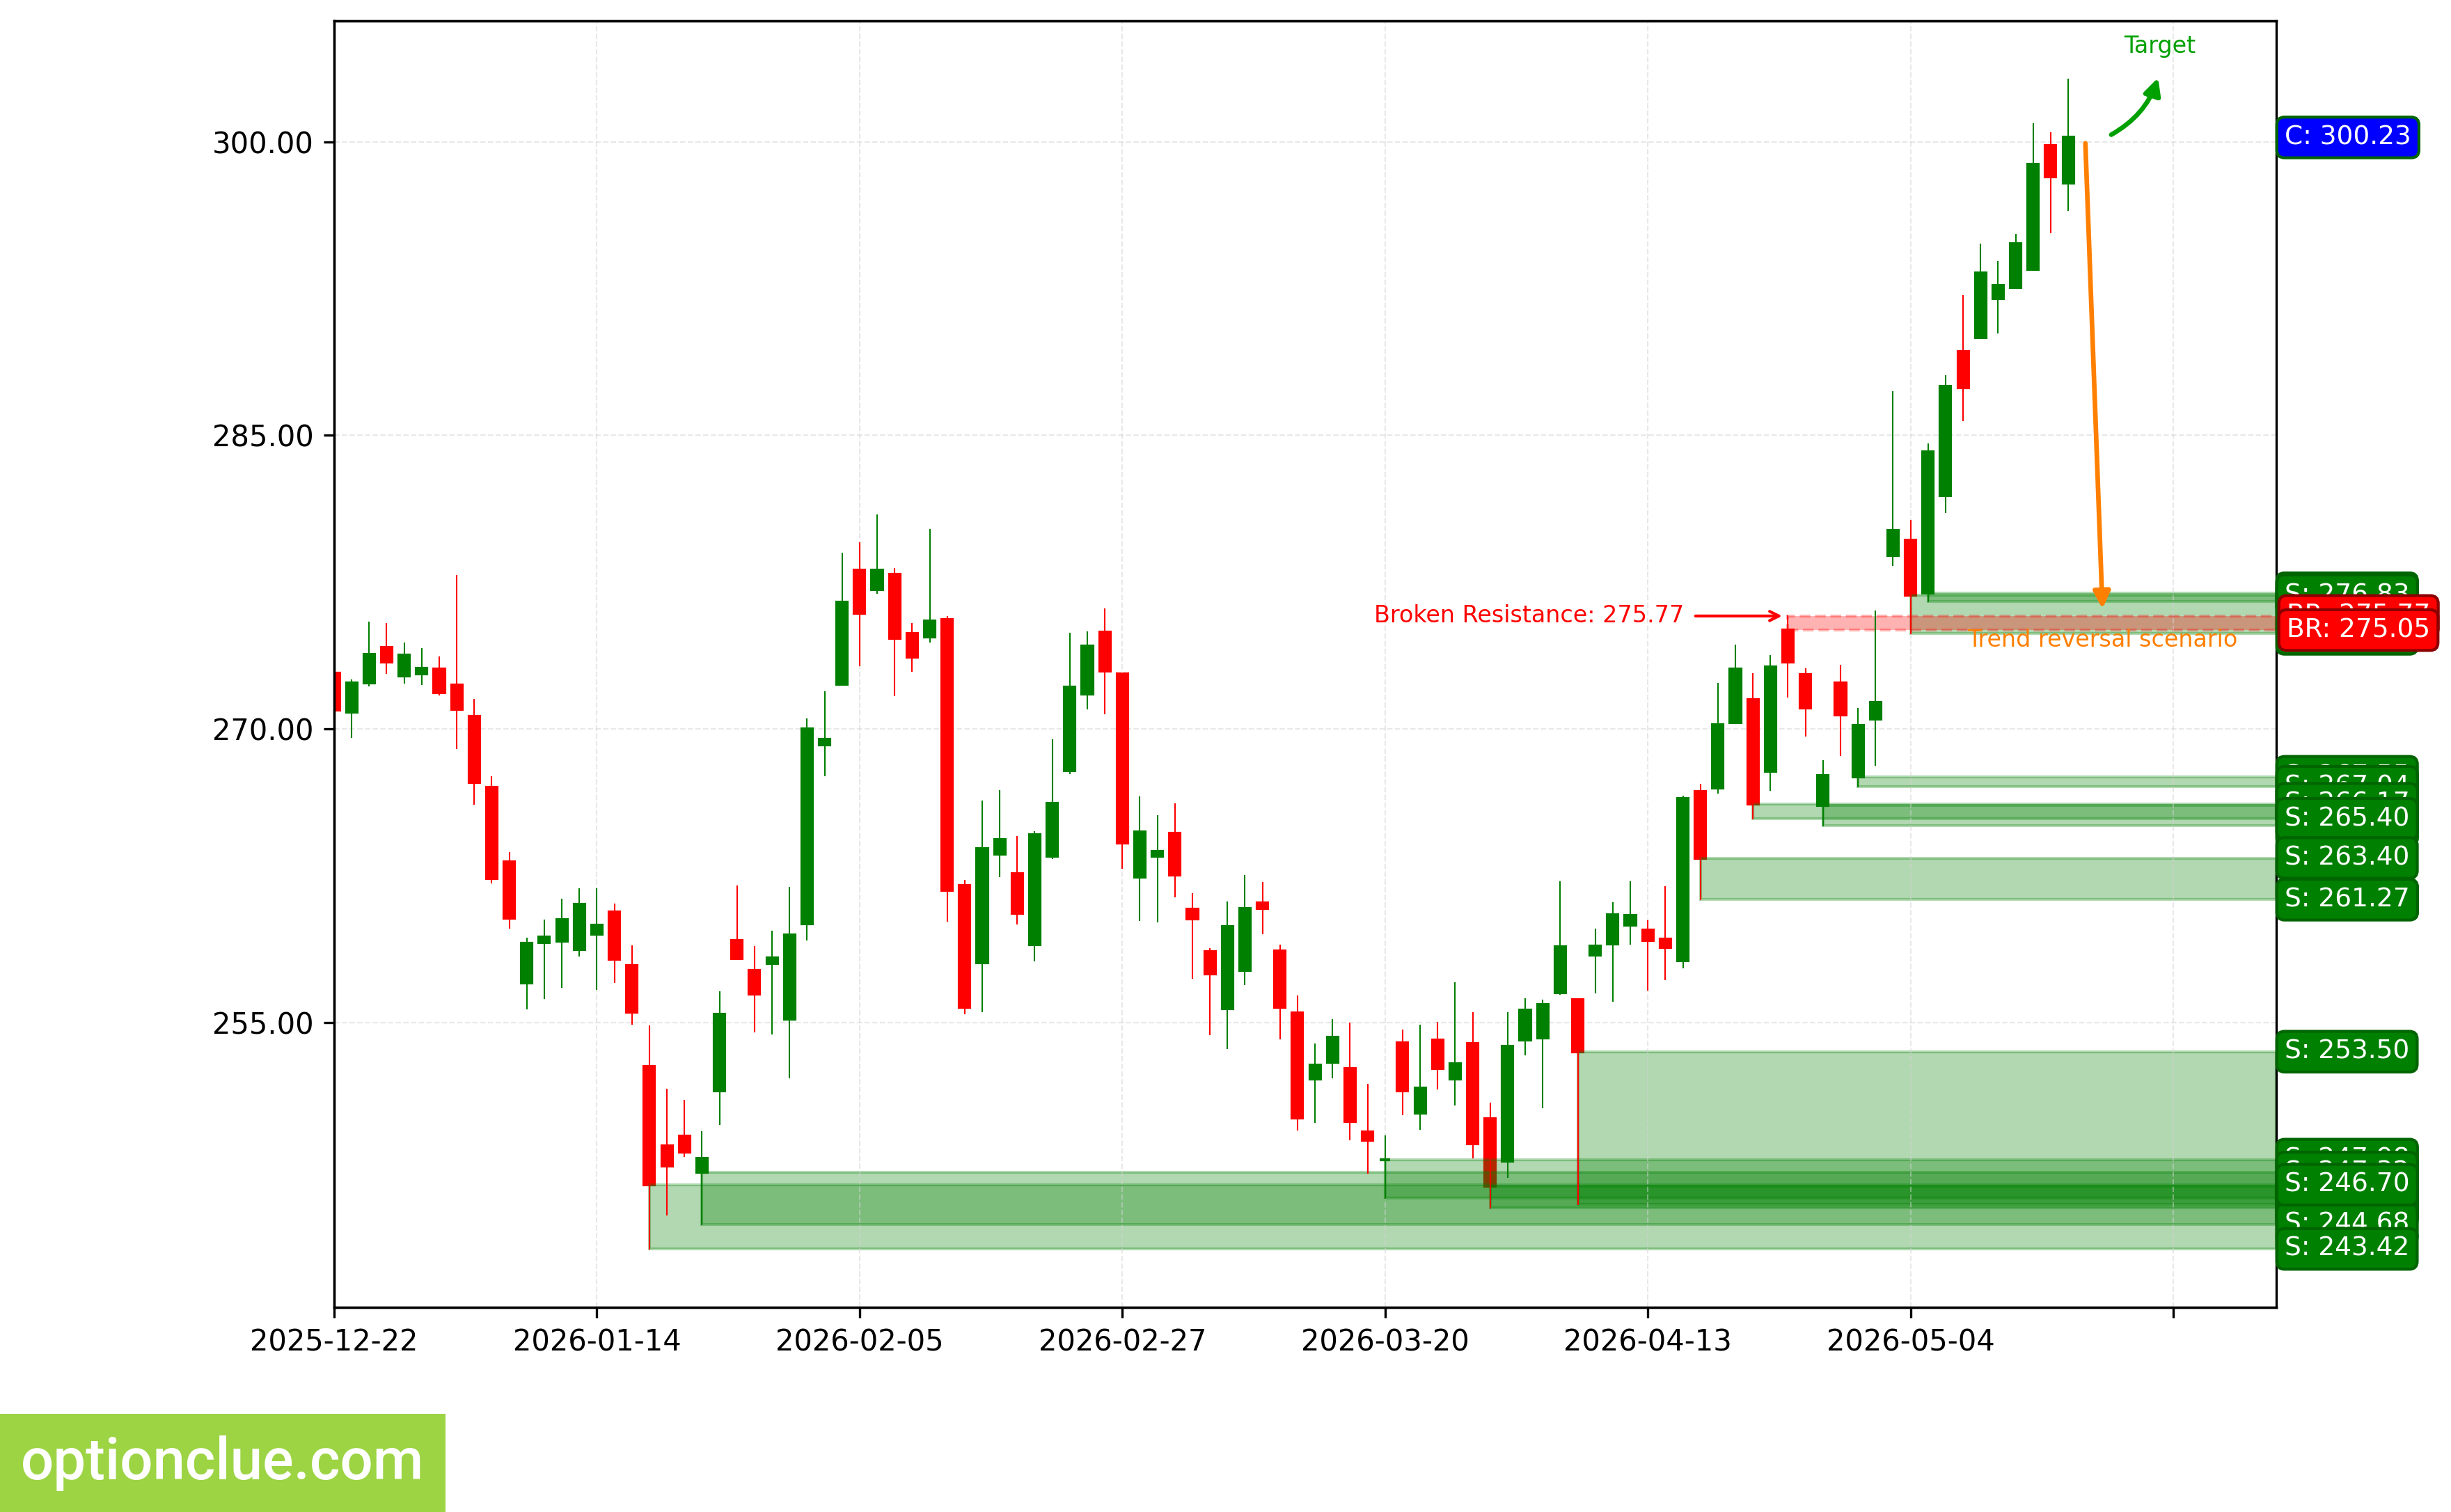
AAPL. Technical Analysis. D1.
Tesla Inc (TSLA)
The trend has changed to bearish 1 candlestick ago, when the support level (422.26 — 433.45) was broken. An impulse wave is developing. An entry point for selling on a rebound may form after a correction develops.
The intermediate target for the downward move is the support level with boundaries 416.80 — 422.16. If the trend develops successfully, a more distant target will be at the support level with boundaries 384.02 — 386.25.
If the correction ends near the resistance level (446.49 — 453.40), the potential reward/risk ratio may be around 1.3:1. When selecting the more distant target — around 3:1.
Short positions will remain relevant, as long as the market stays below the nearest resistance level with boundaries 446.49 — 453.40. If the market successfully consolidates above this nearest resistance, the trend will reverse to the opposite direction (bullish).
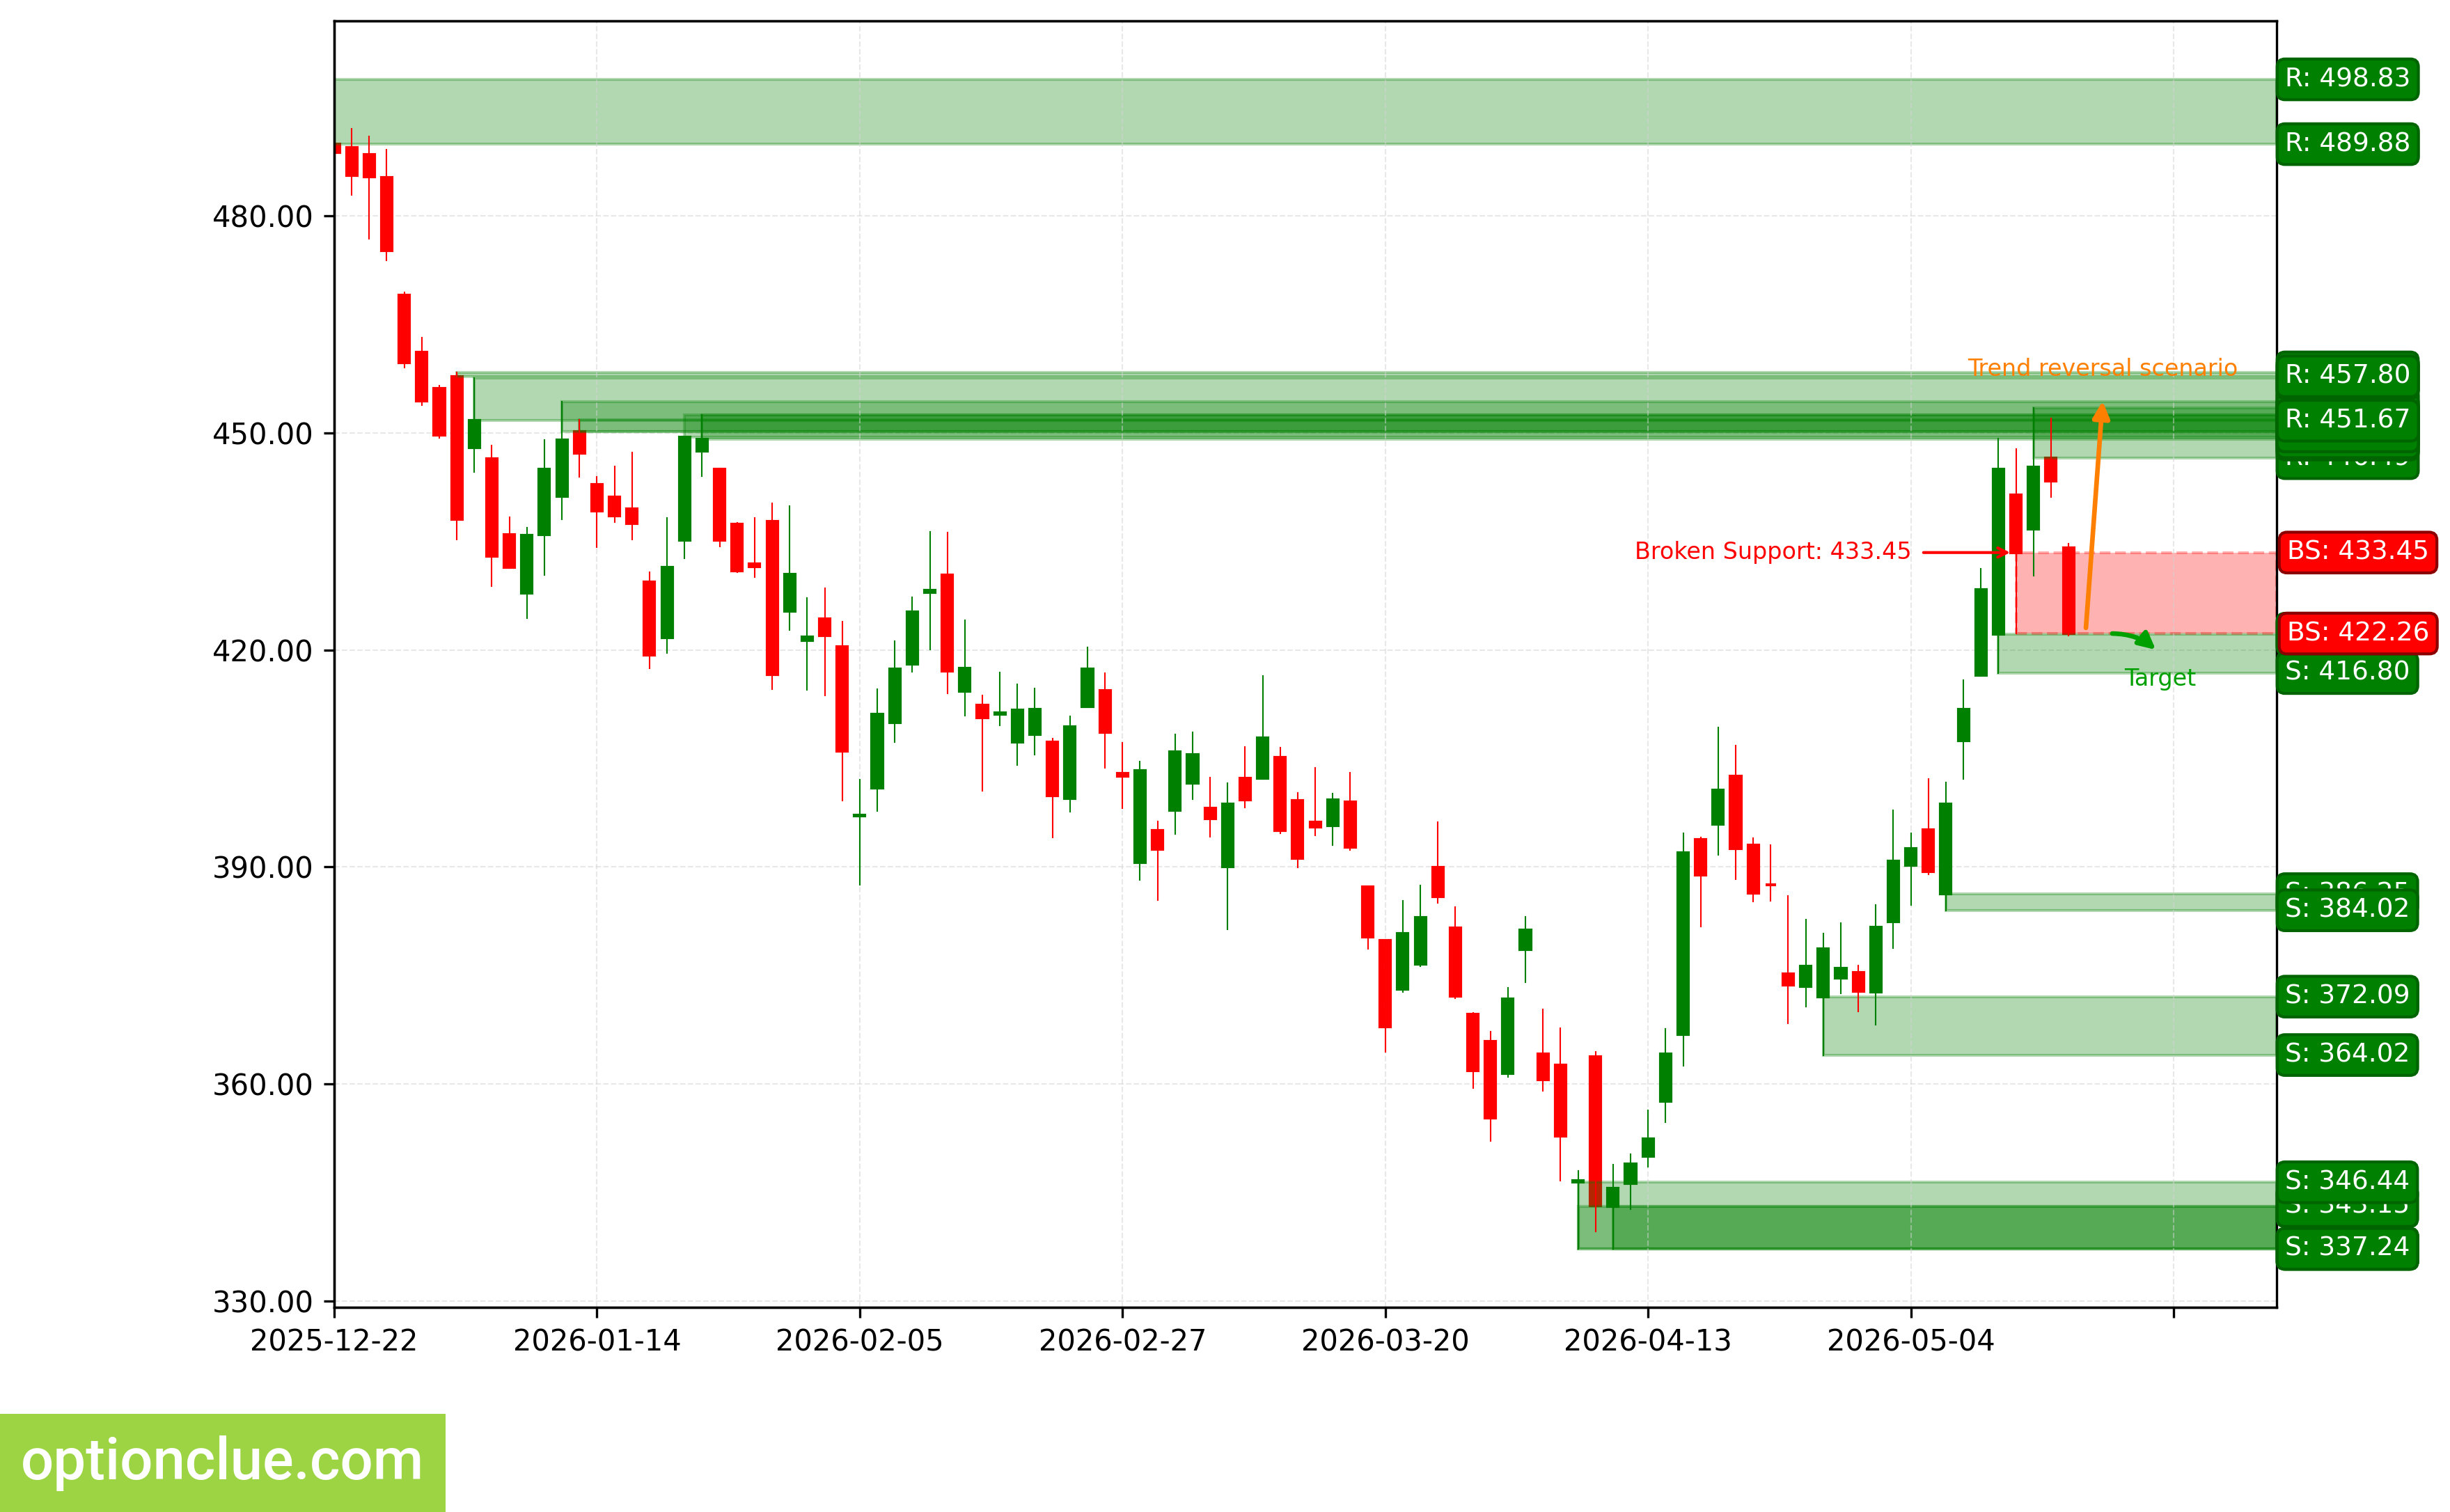
TSLA. Technical Analysis. D1.
Summary
In the near term, the following may be worthy of attention depending on the depth of market correction: AUDUSD, GBPUSD, USDCHF, EURUSD.
The remaining financial instruments from the trading list may also be of interest, but on these markets rebound signals on the Daily timeframe will likely not appear until at least a week from now.