
Weekly market checklist. Highlighting key support and resistance levels, potential price reactions, and actionable scenarios.
Key Topics
- Euro (EURUSD)
- British Pound (GBPUSD)
- Swiss Franc (USDCHF)
- Japanese Yen (USDJPY)
- Canadian Dollar (USDCAD)
- Australian Dollar (AUDUSD)
- New Zealand Dollar (NZDUSD)
- Bitcoin (BTC)
- Ethereum (ETH)
- Apple Inc (AAPL)
- NVIDIA Corp (NVDA)
- Tesla Inc (TSLA)
- Summary
Euro (EURUSD)
The bearish trend continues. The last level broken was support (1.1576 – 1.1598). The breakout occurred 12 candlesticks ago. On the last closed candlestick, the correction likely ended, and an impulse wave is developing.
The intermediate target for the downward movement is the support level with boundaries at 1.1468 – 1.1482. If the trend develops successfully, a more distant target will be at the support level with boundaries at 1.1389 – 1.1404.
The potential reward/risk ratio from current prices, when setting targets and managing risk based on daily timeframe levels, could be around 1:1 to the first target. For the more distant target, it is around 2:1.
Short positions will remain relevant as long as the market stays below the nearest resistance level with boundaries at 1.1650 – 1.1668. If the market successfully establishes itself above this nearest resistance, the trend will reverse to the opposite (bullish).
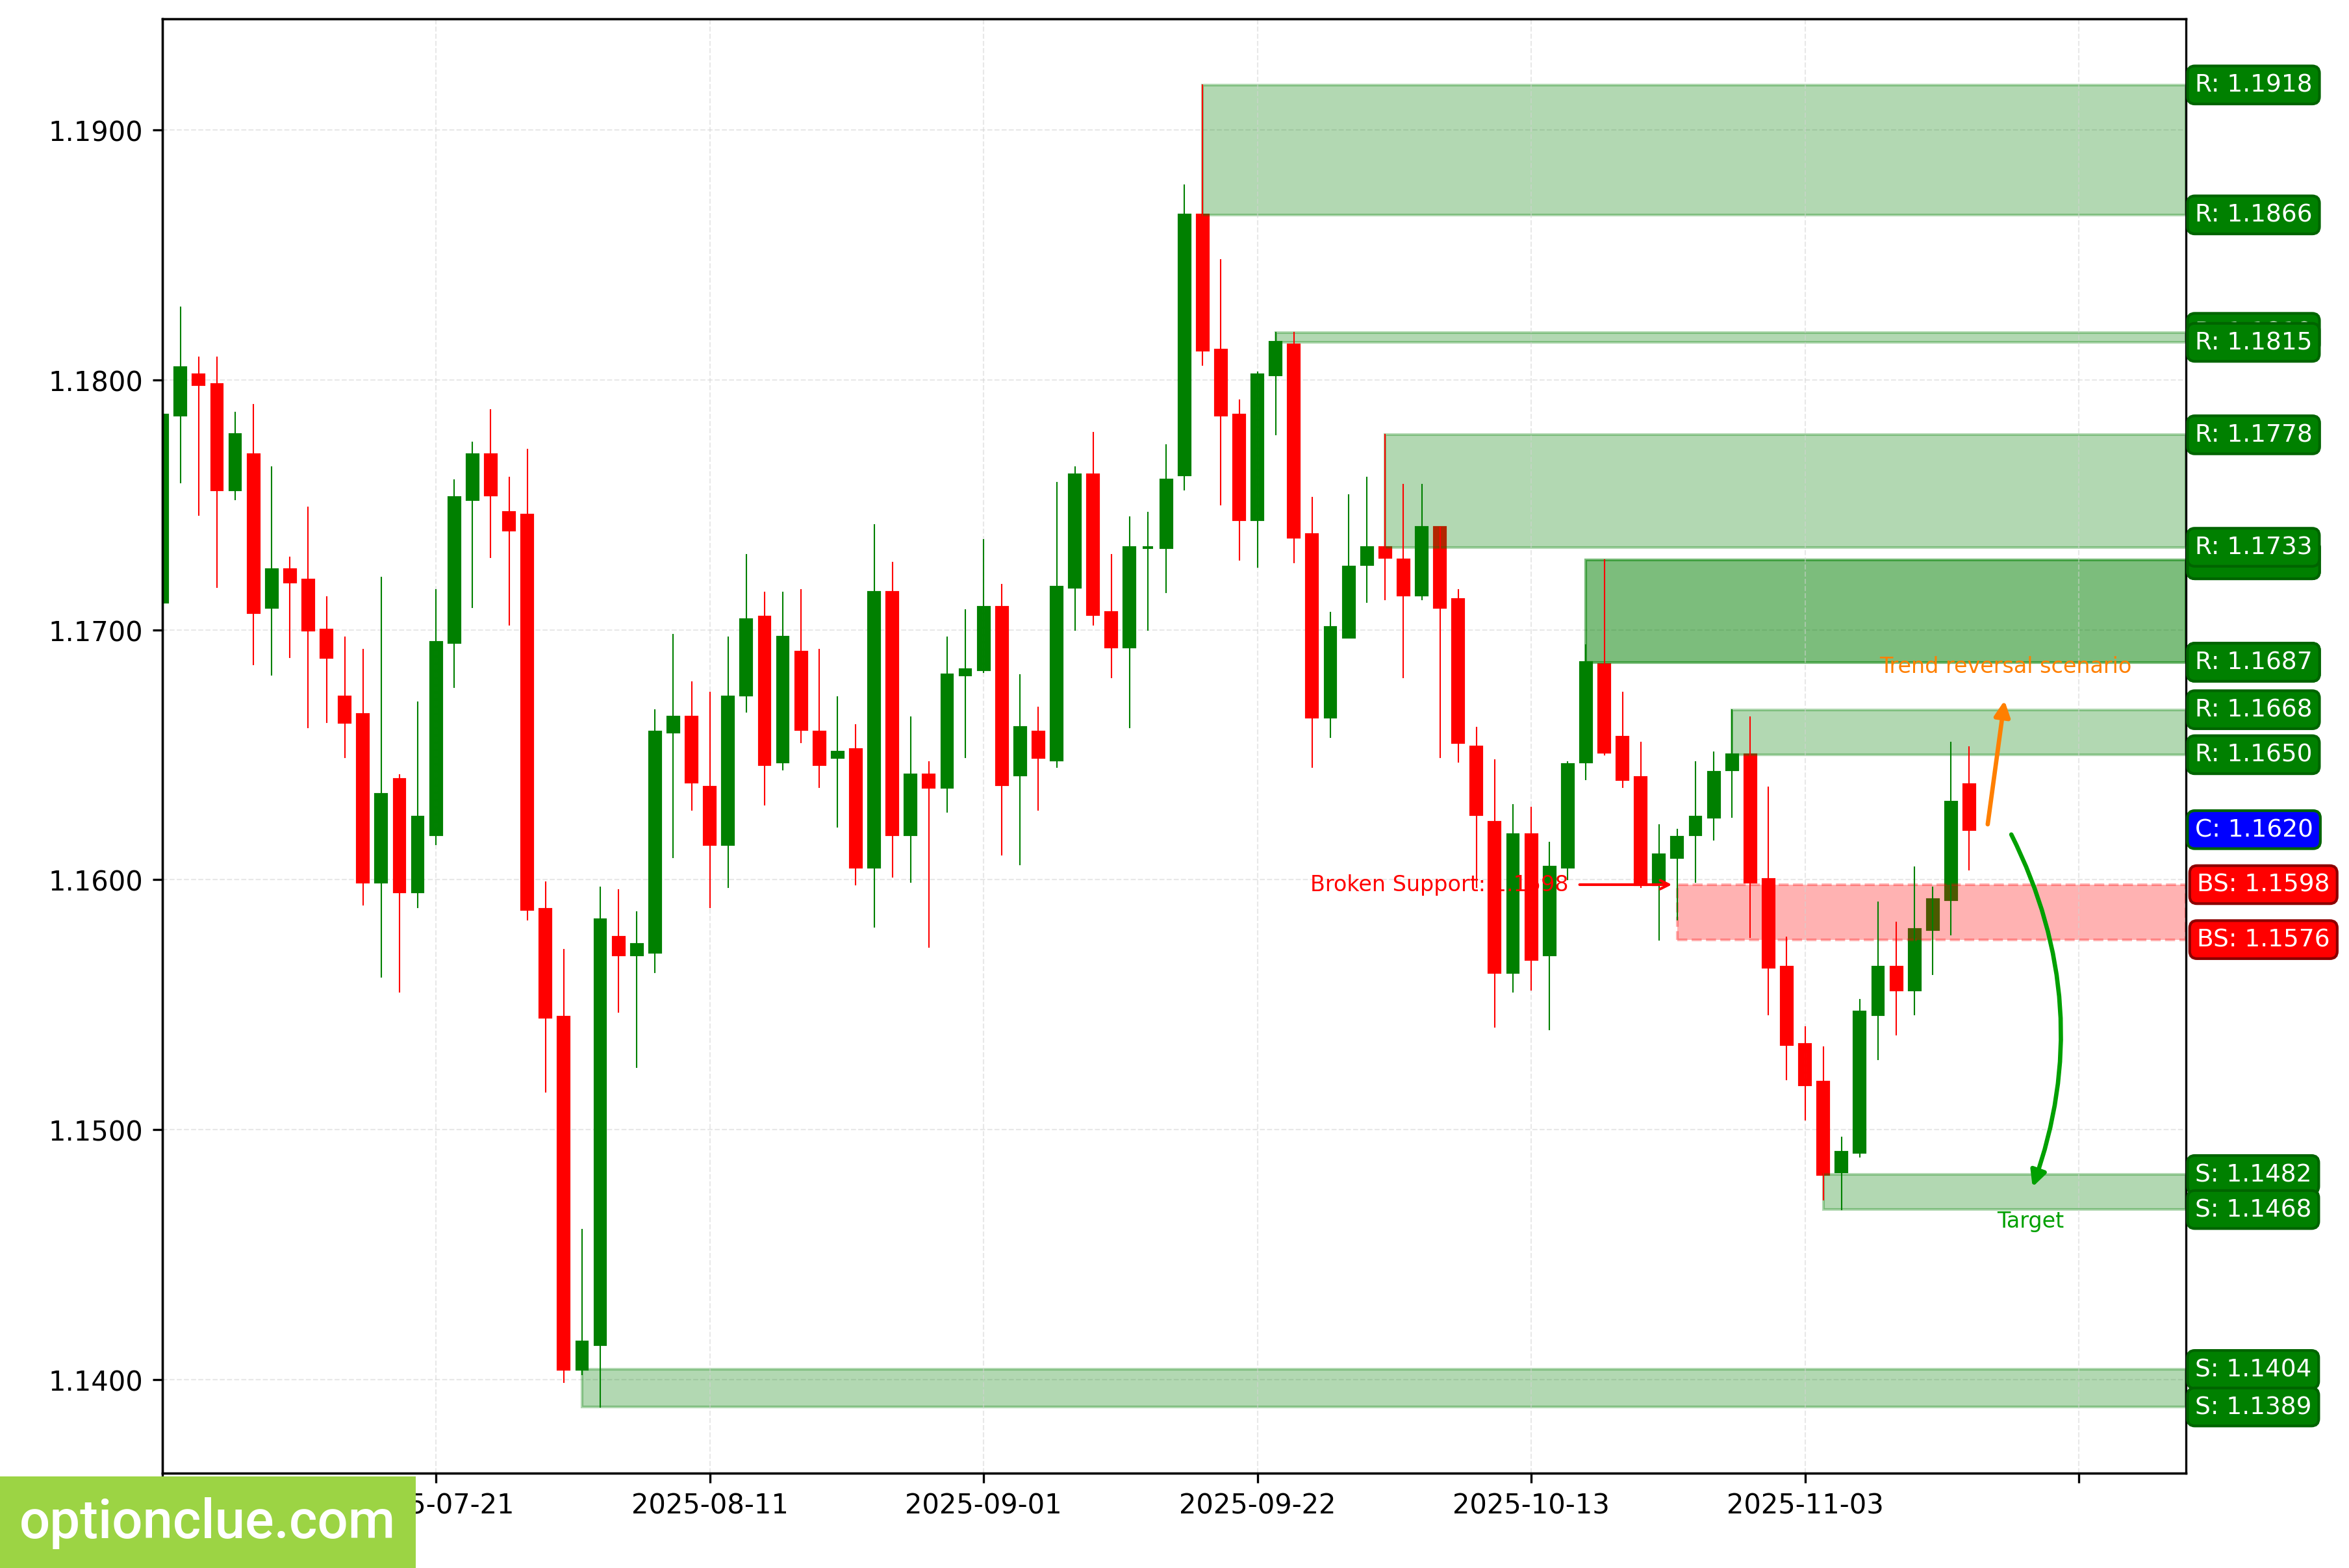
EURUSD. Technical analysis. D1.
British Pound (GBPUSD)
The bearish trend continues. The last level broken was support (1.3094 – 1.3138). The breakout occurred 9 candlesticks ago. On the last closed candlestick, the correction likely ended, and an impulse wave is developing.
The intermediate target for the downward movement is the support level with boundaries at 1.3007 – 1.3018. If the trend develops successfully, a more distant target will be at the support level with boundaries at 1.2708 – 1.2720.
The potential reward/risk ratio from the established entry point to the first target could be more than 3:1. For the more distant target, the ratio will be significantly better.
Short positions will remain relevant as long as the market stays below the nearest resistance level with boundaries at 1.3189 – 1.3215. If the market successfully establishes itself above this nearest resistance, the trend will reverse to the opposite (bullish).
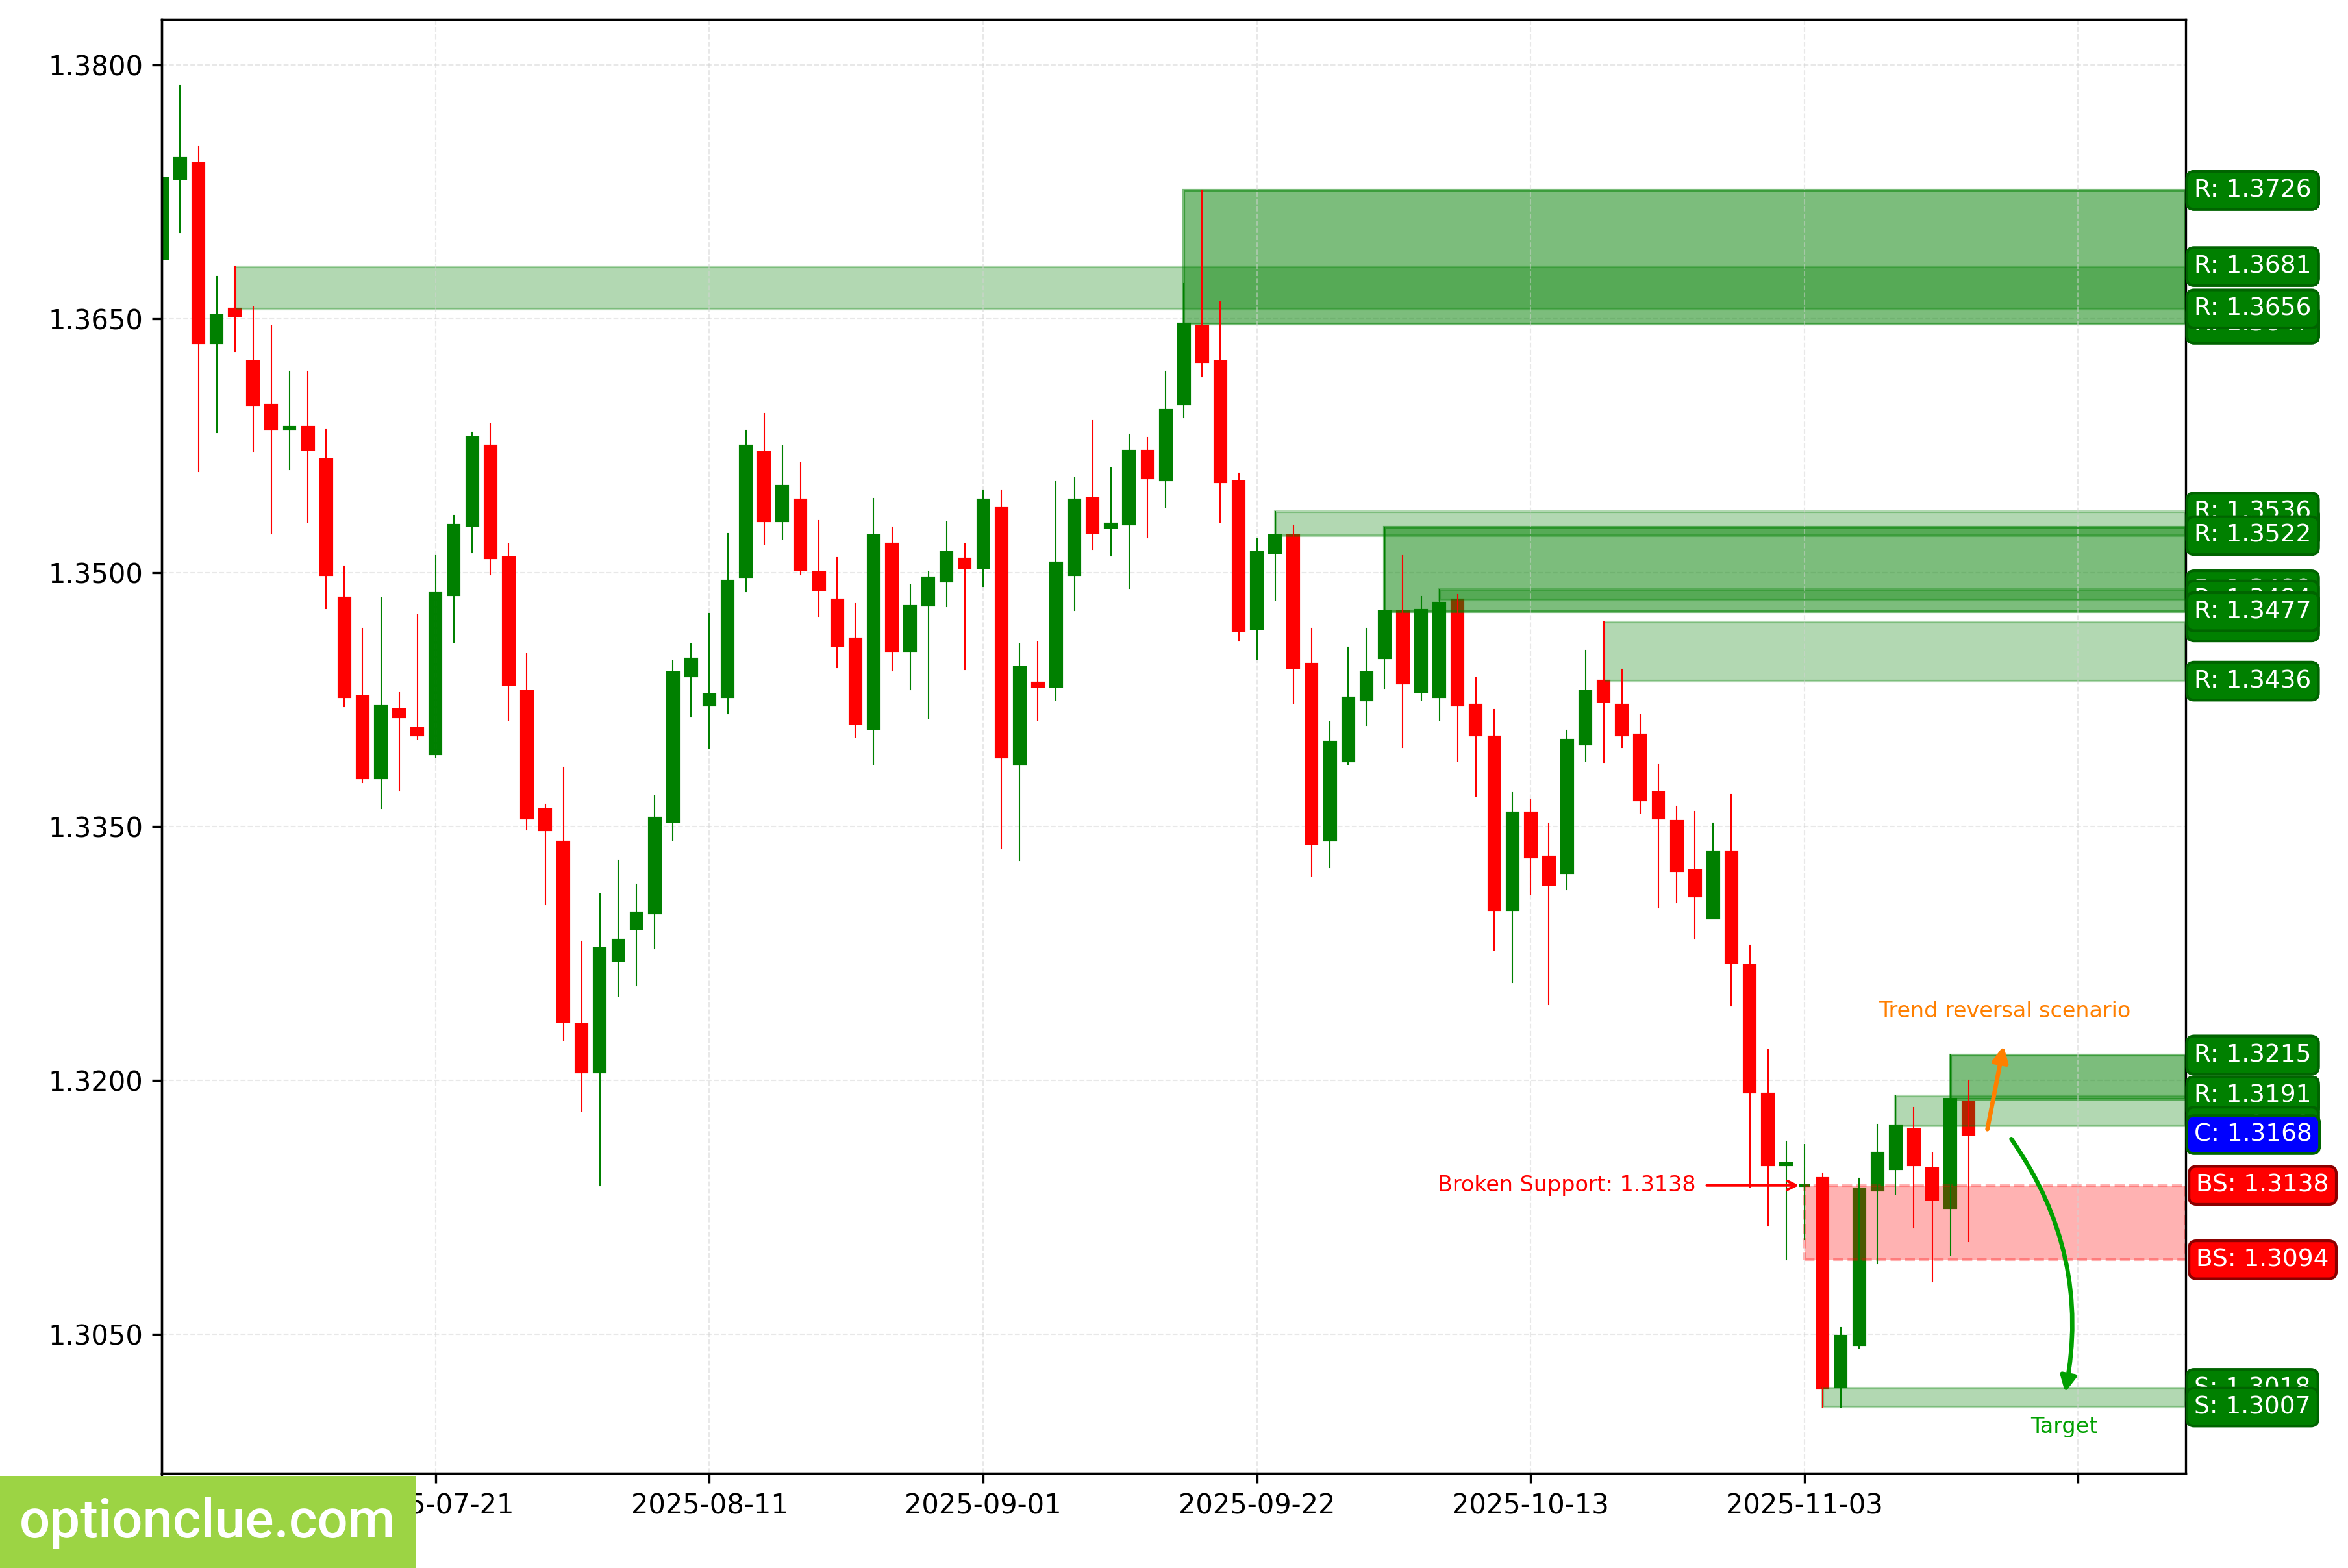
GBPUSD. Technical analysis. D1.
Swiss Franc (USDCHF)
The bullish trend continues; on the last closed candlestick, the correction likely ended, and an impulse wave is developing. The last level broken was resistance (0.7961 – 0.7986). The breakout occurred 13 candlesticks ago.
The intermediate target for the upward movement is the resistance level with boundaries at 0.8105 – 0.8124. If the market successfully establishes itself above this resistance, it will open the way for the price to move towards target #2 — the resistance level with boundaries at 0.8124 – 0.8131.
The potential reward/risk ratio from current prices, when setting targets and managing risk based on daily timeframe levels, could be slightly more than 1:1. For the more distant target, it is around 2:1.
Long positions will remain relevant as long as the market stays above the nearest support level with boundaries at 0.7923 – 0.7931. If the market successfully establishes itself below the nearest support (0.7923 – 0.7931), the trend will reverse to the opposite (bearish).
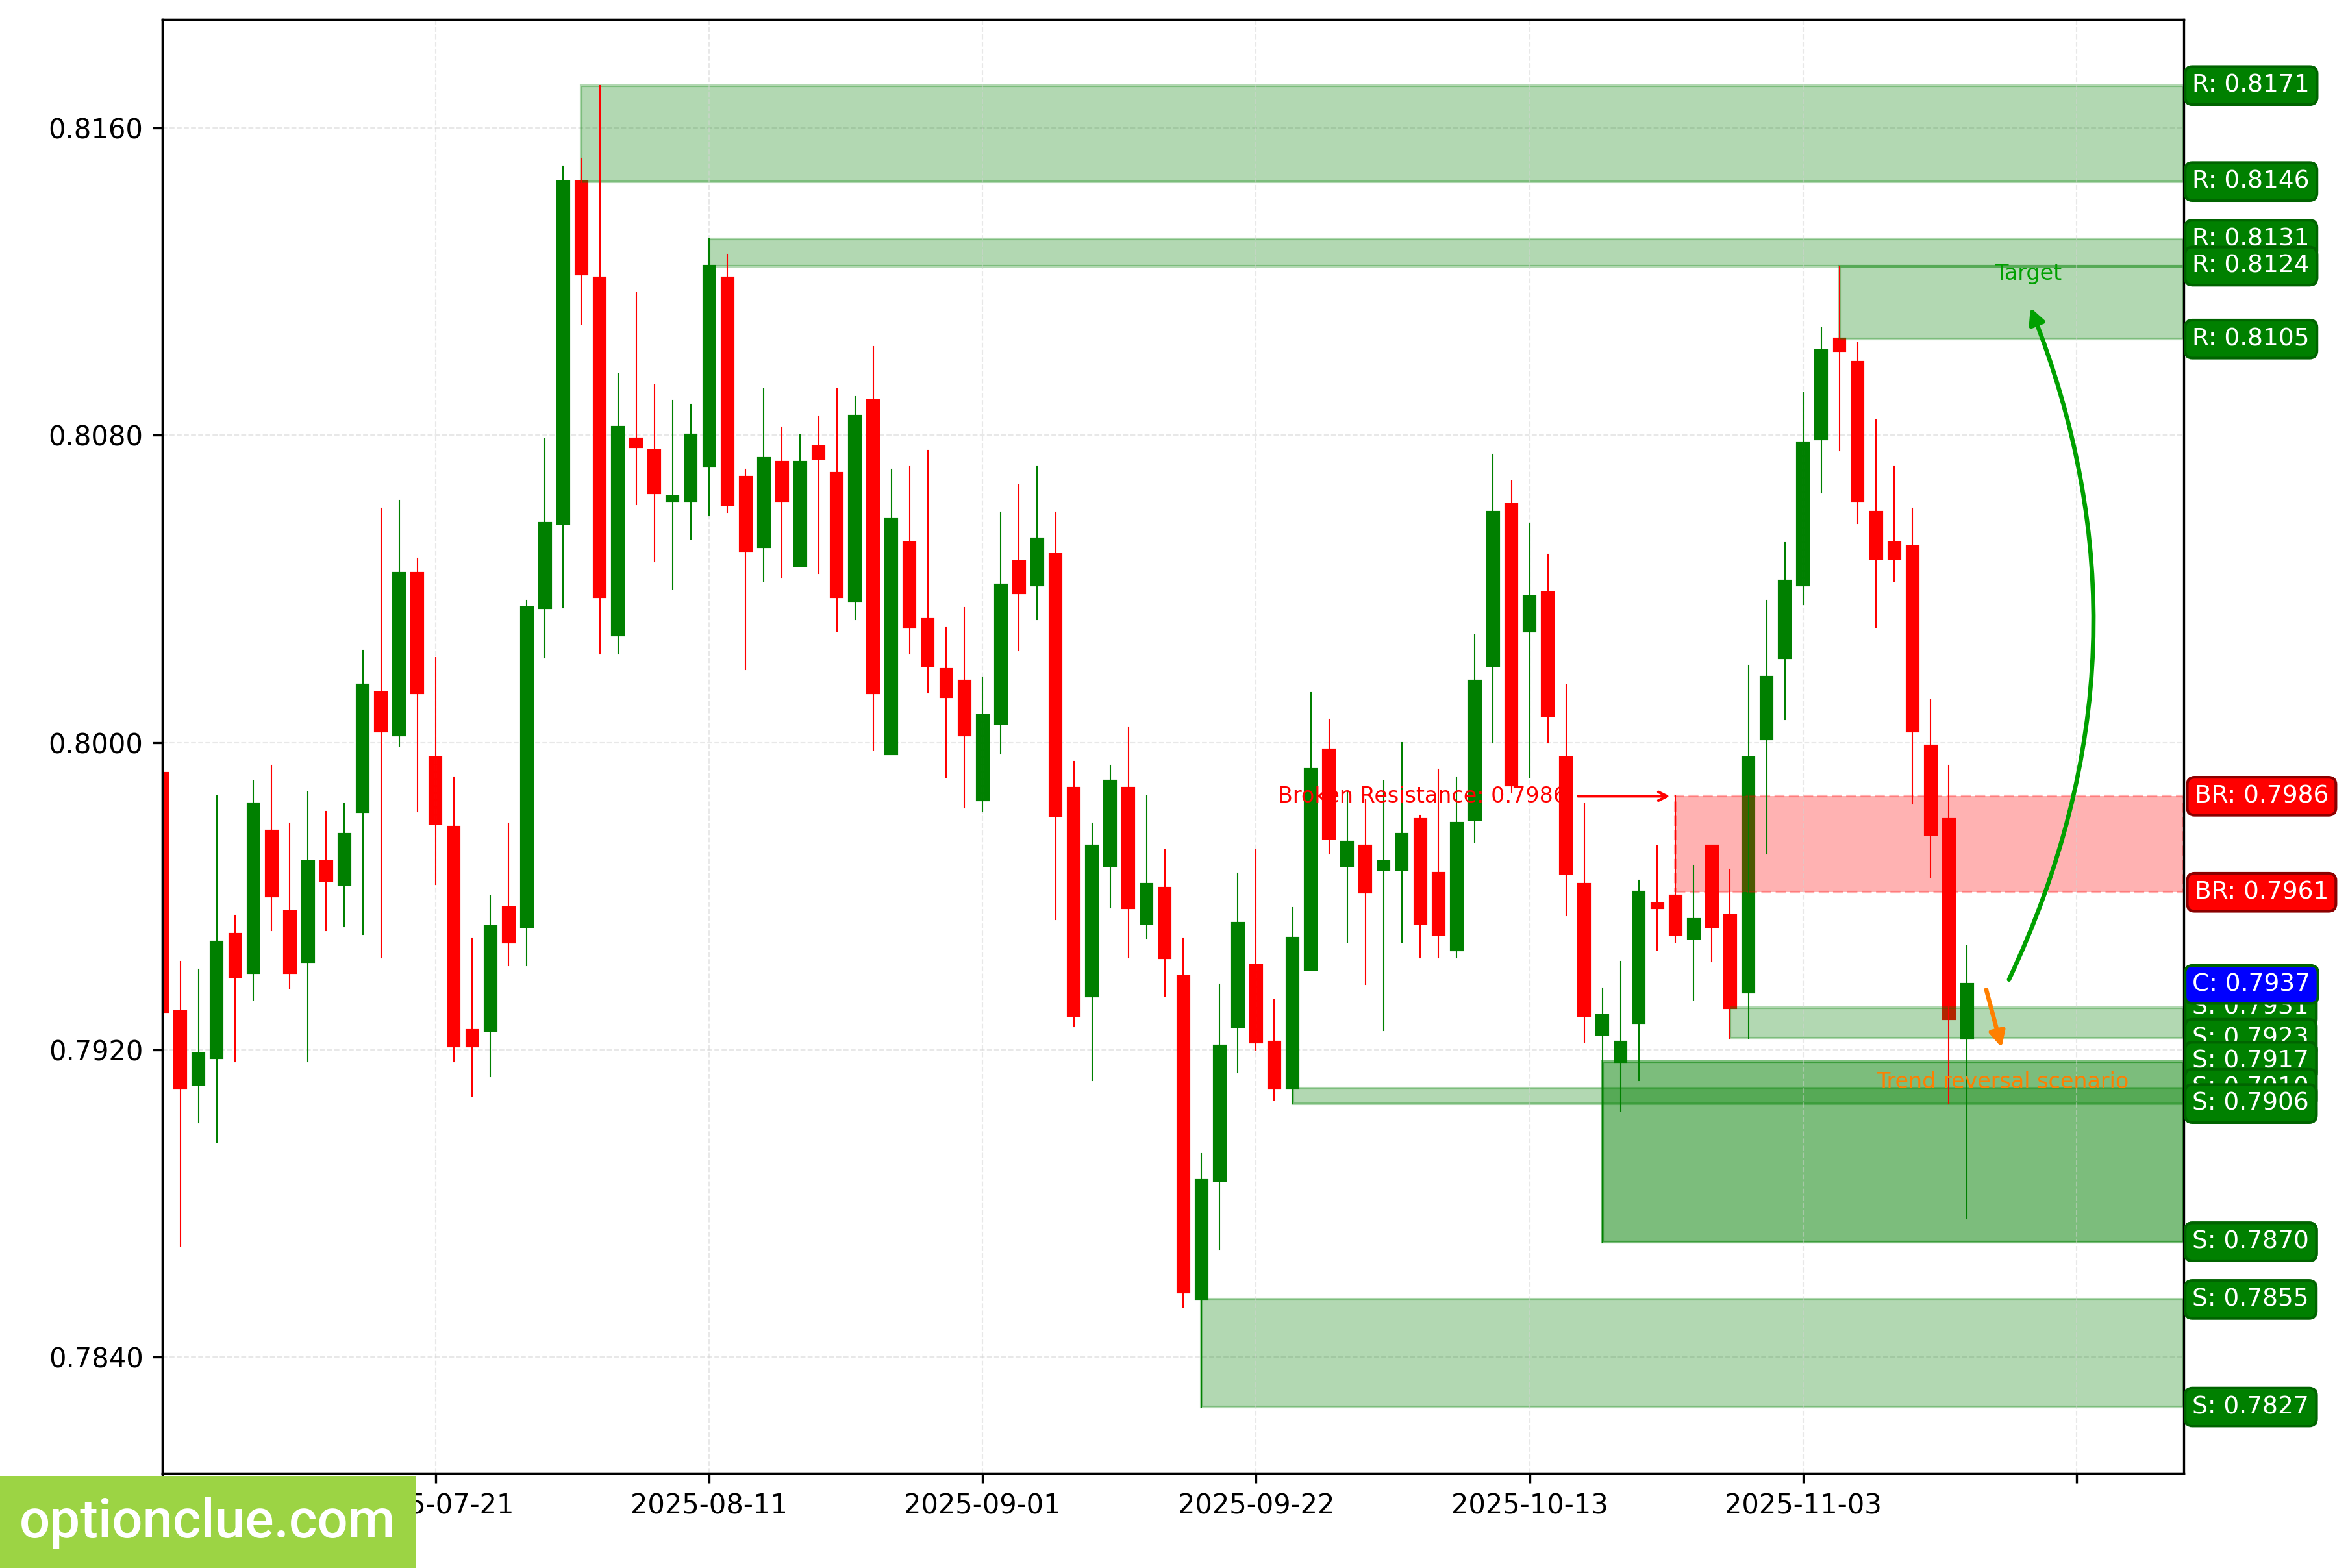
USDCHF. Technical analysis. D1.
Japanese Yen (USDJPY)
The bullish trend continues. The last level broken was resistance (154.21 – 154.48). The breakout occurred 3 candlesticks ago. On the last closed candlestick, the correction likely ended, and an impulse wave is developing.
The intermediate target for the upward movement is the resistance level with boundaries at 154.80 – 155.04. If the trend develops successfully, a more distant target will be at the resistance level with boundaries at 155.18 – 155.89.
The potential reward/risk ratio from current prices, when setting targets and managing risk based on daily timeframe levels, could be 0.2:1. For the more distant target — 0.4:1.
Long positions will remain relevant as long as the market stays above the nearest daily timeframe support level with boundaries at 152.80 – 153.06. If the market successfully establishes itself below this nearest support, the trend will reverse to the opposite (bearish).
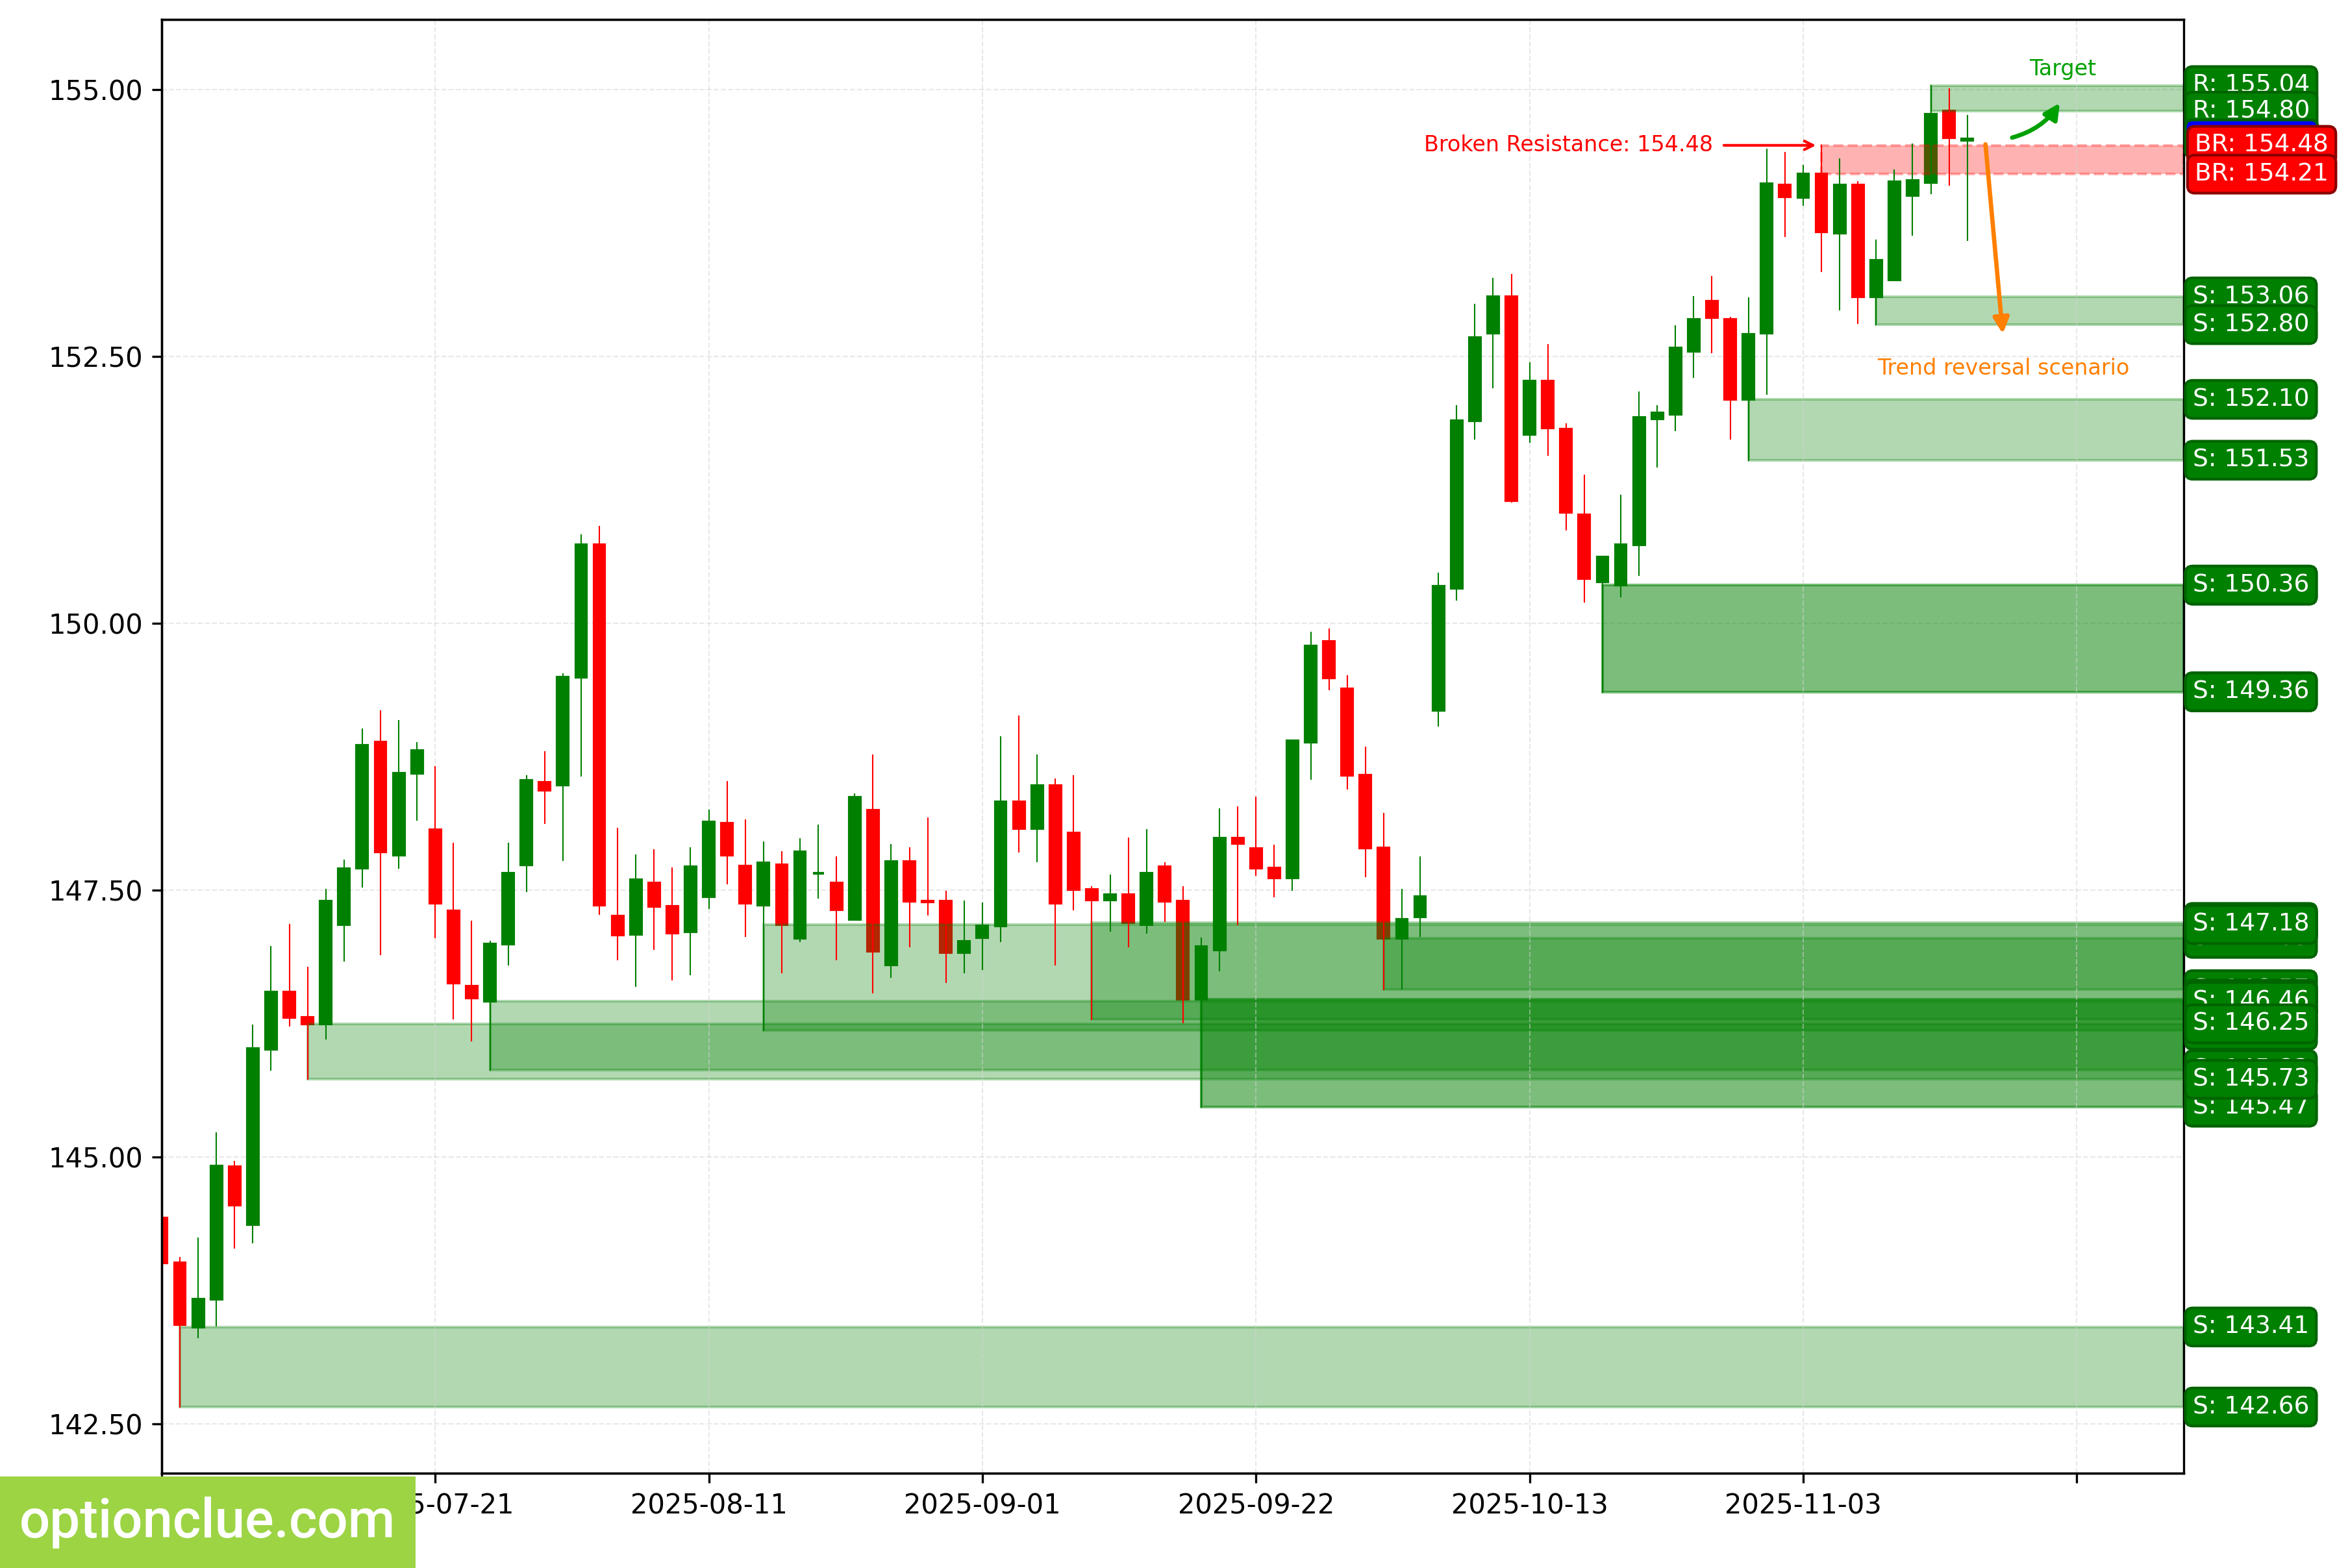
USDJPY. Technical analysis. D1.
Canadian Dollar (USDCAD)
The bullish trend continues; 2 candlesticks ago, the correction likely ended, and an impulse wave is developing. The last level broken was resistance (1.4036 – 1.4065). The breakout occurred 9 candlesticks ago.
The intermediate target for the upward movement is the resistance level with boundaries at 1.4116 – 1.4140. If the trend develops successfully, a more distant target will be at the resistance level with boundaries at 1.4385 – 1.4415.
The potential reward/risk ratio from current prices, when setting targets and managing risk based on daily timeframe levels, may be insignificant – less than 1:1.
Long positions will remain relevant as long as the market stays above the nearest support level with boundaries at 1.3885 – 1.3941. If the market successfully establishes itself below the nearest support (1.3885 – 1.3941), the trend will reverse to the opposite (bearish).
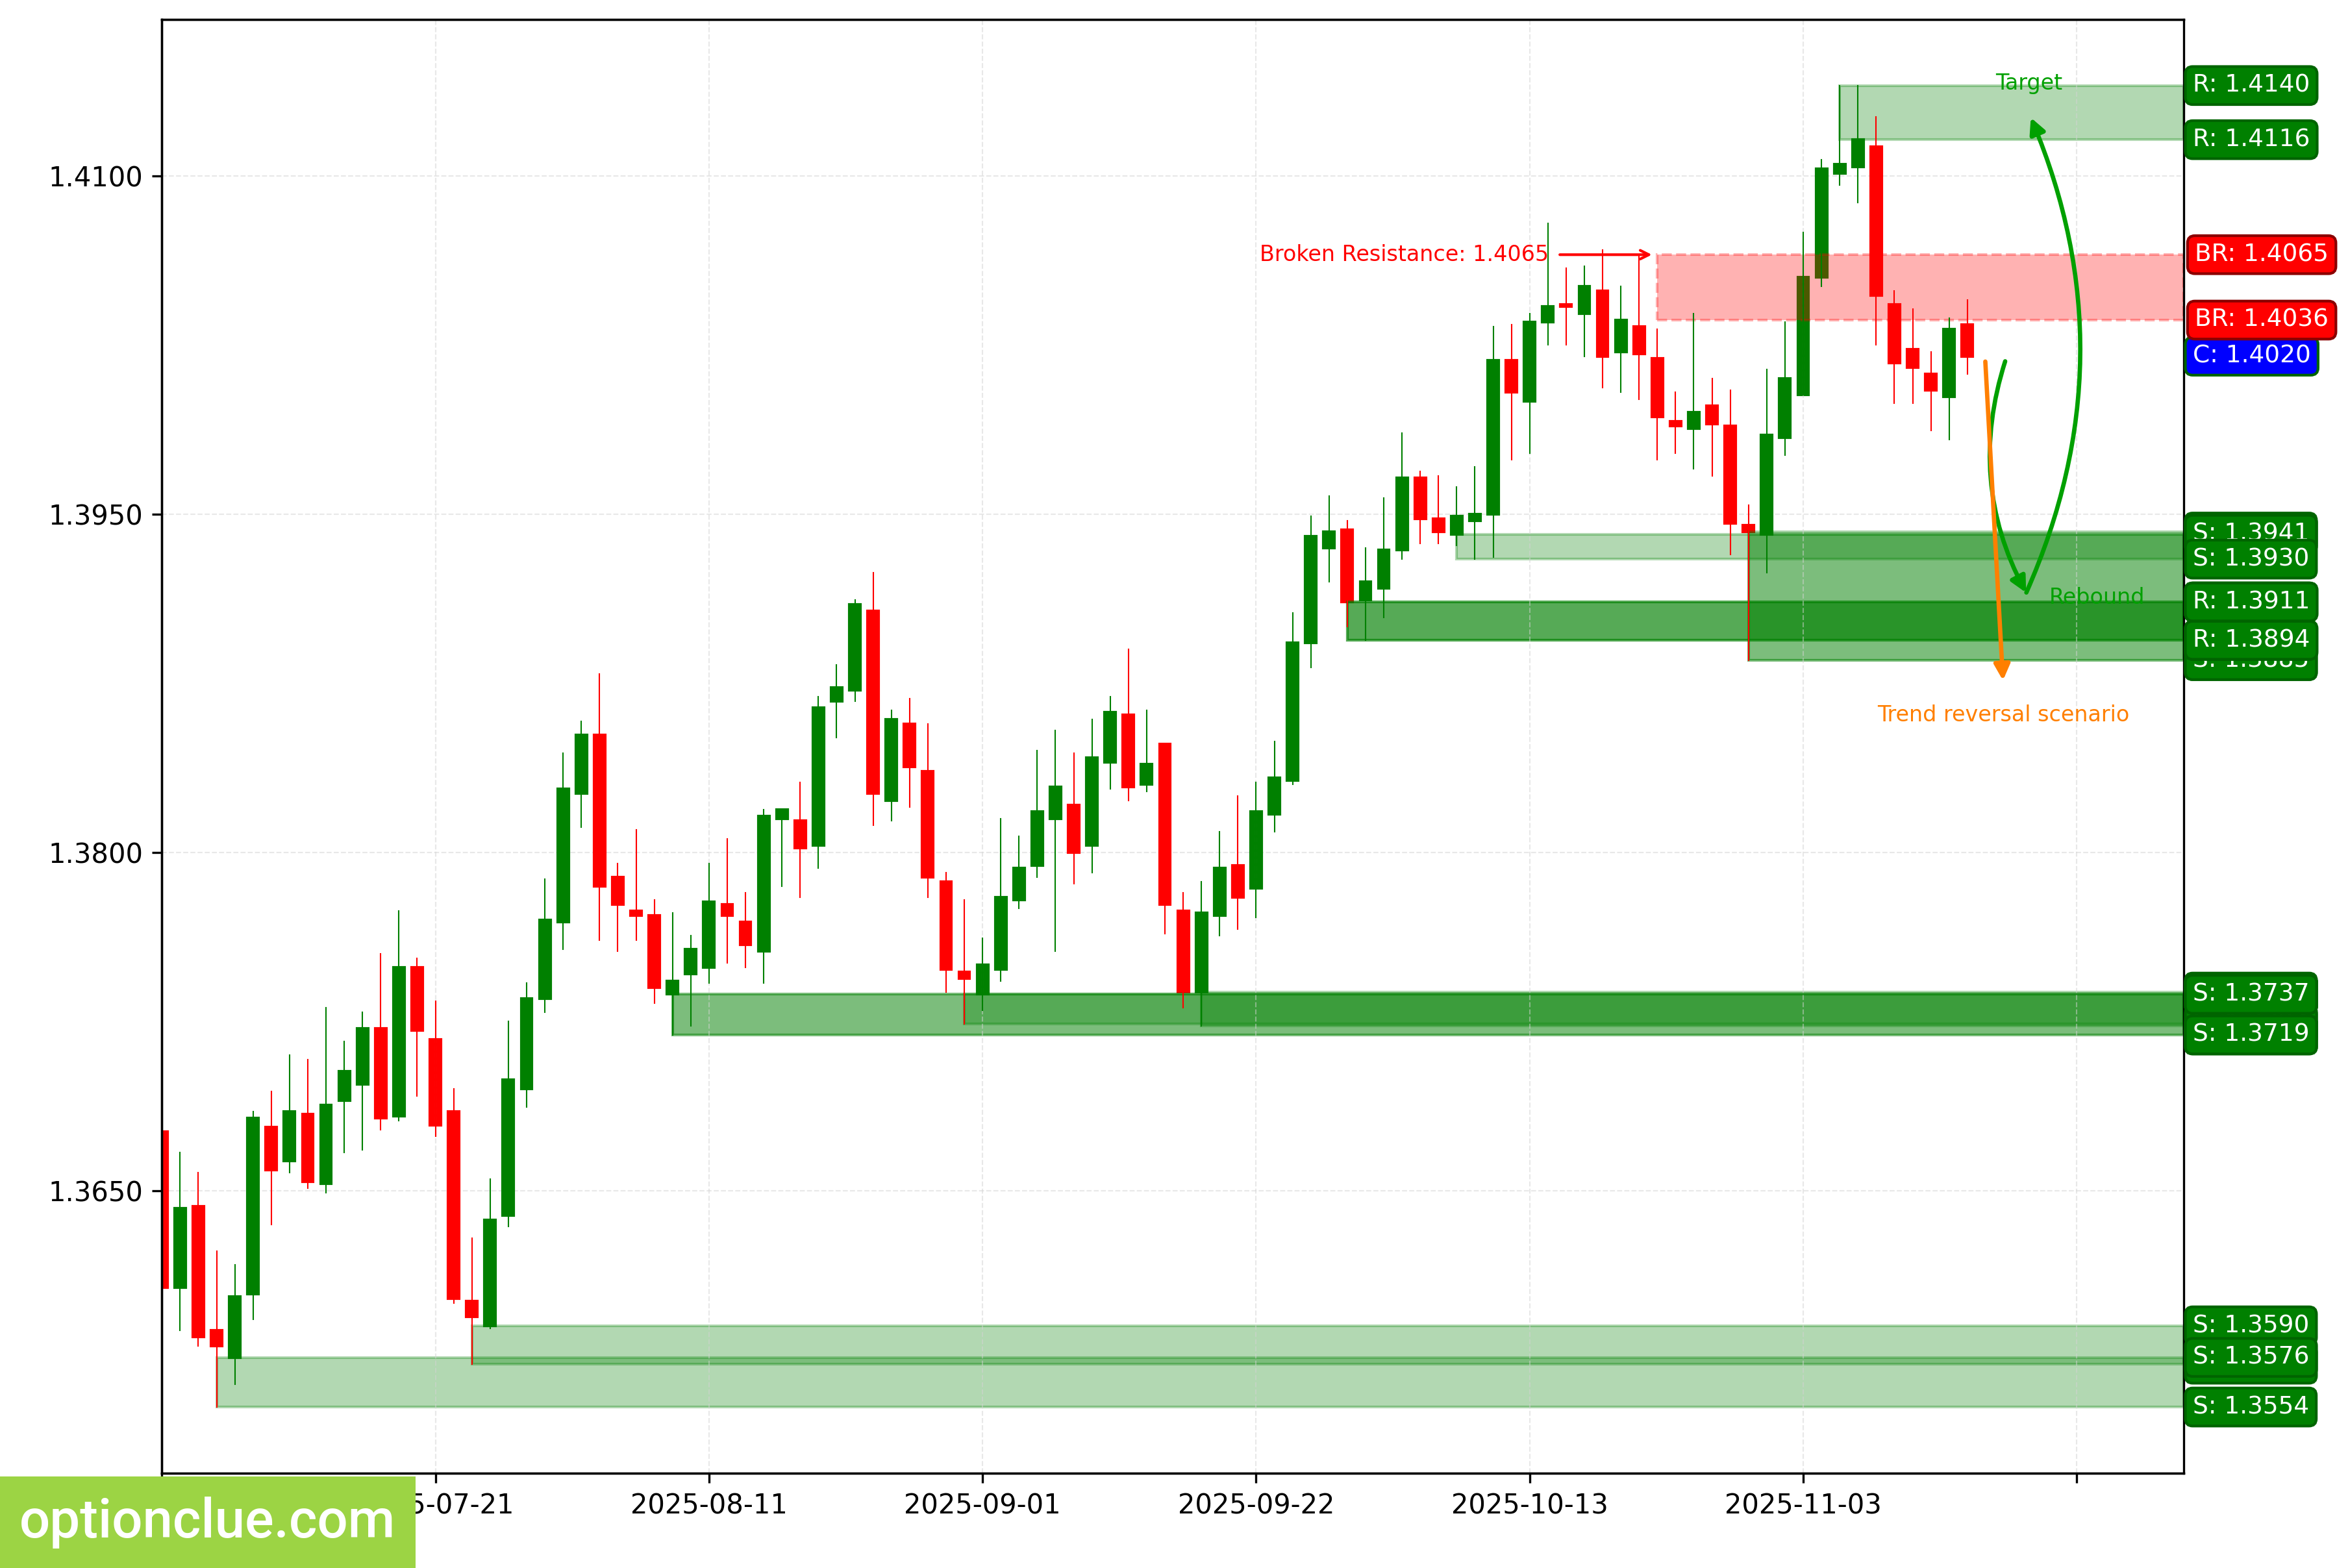
USDCAD. Technical analysis. D1.
Australian Dollar (AUDUSD)
The bullish trend continues, and an impulse wave is developing. The last level broken was resistance (0.6512 – 0.6525). The breakout occurred 15 candlesticks ago.
The intermediate target for the upward movement is the resistance level with boundaries at 0.6584 – 0.6617. If the market successfully establishes itself above this resistance, it will open the way for the price to move towards target #2 — the resistance level with boundaries at 0.6598 – 0.6628.
The potential reward/risk ratio from current prices, when setting targets and managing risk based on daily timeframe levels, may be small – less than 1:1.
Long positions will remain relevant as long as the market stays above the nearest support level with boundaries at 0.6461 – 0.6477. If the market successfully establishes itself below the nearest support (0.6461 – 0.6477), the trend will reverse to the opposite (bearish).
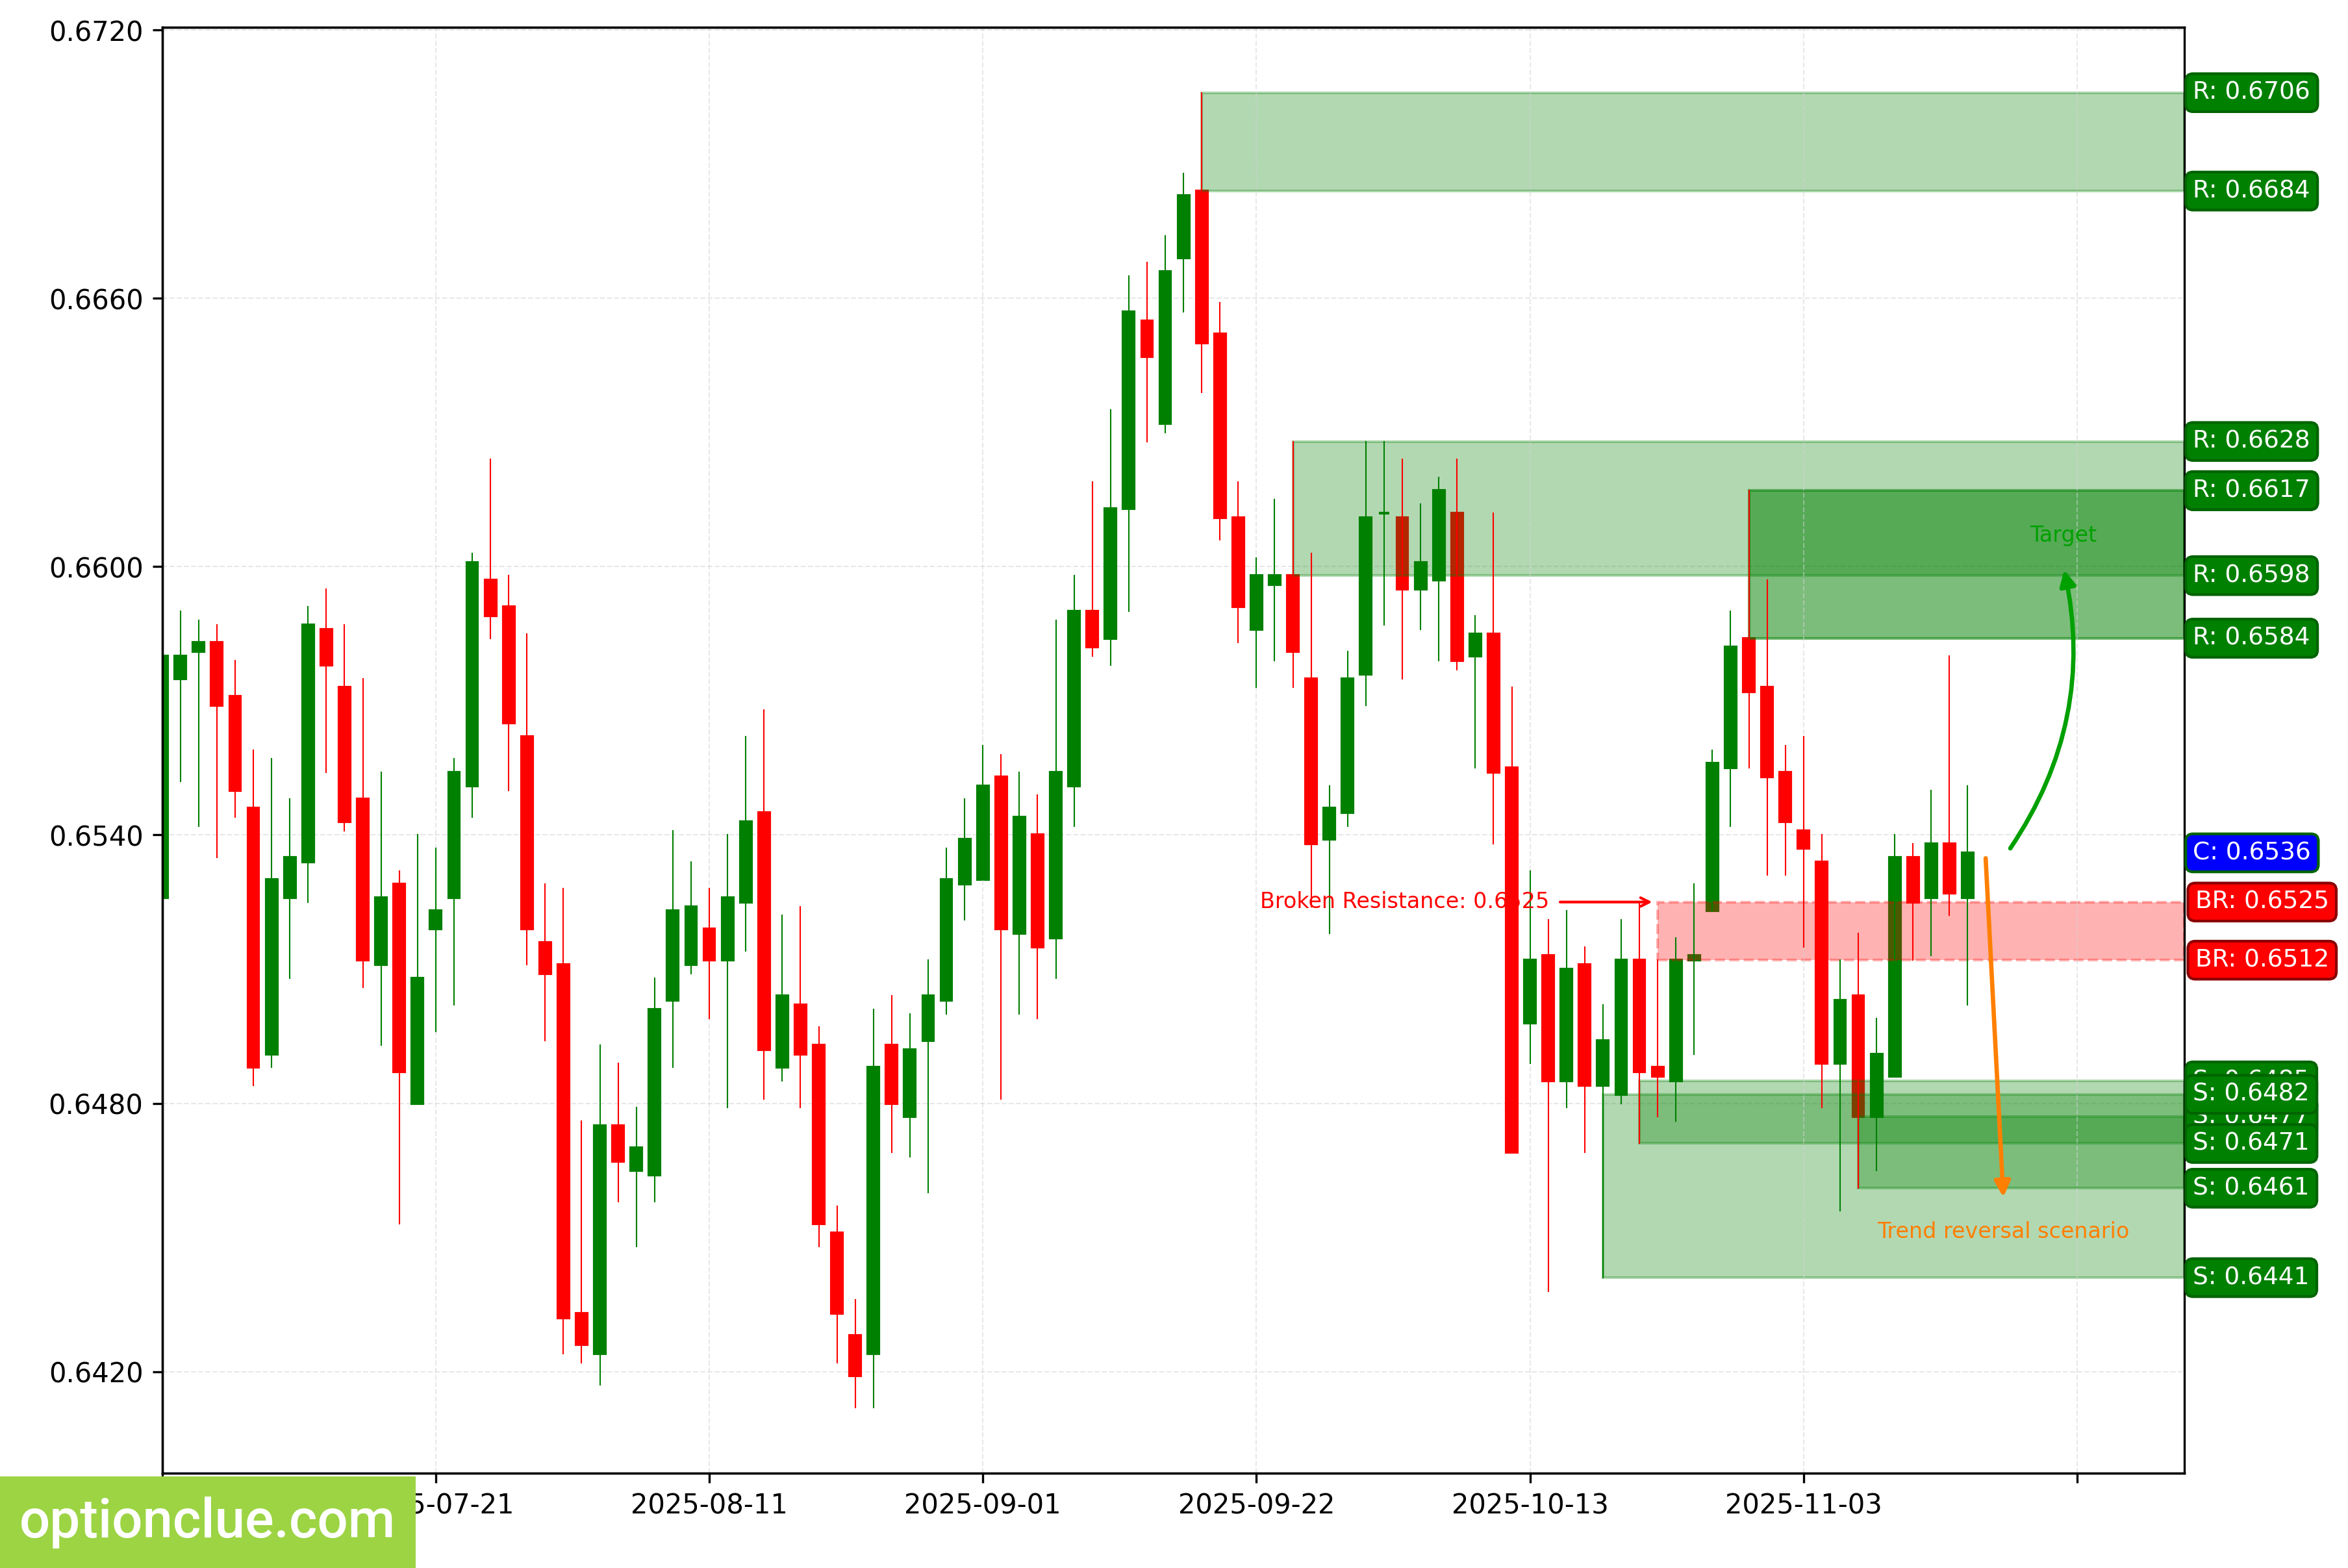
AUDUSD. Technical analysis. D1.
New Zealand Dollar (NZDUSD)
The bearish trend continues. The last level broken was support (0.5681 – 0.5713). The breakout occurred 9 candlesticks ago. 2 candlesticks ago, the correction likely ended, and an impulse wave is developing.
The intermediate target for the downward movement is the support level with boundaries at 0.5604 – 0.5626. If the trend develops successfully, a more distant target will be at the support level with boundaries at 0.5485 – 0.5528.
The potential reward/risk ratio to the first target may be low. To improve the ratio, it makes sense to consider the more distant support level as a target.
Short positions will remain relevant as long as the market stays below the nearest resistance level with boundaries at 0.5781 – 0.5801. If the market successfully establishes itself above this nearest resistance, the trend will reverse to the opposite (bullish).
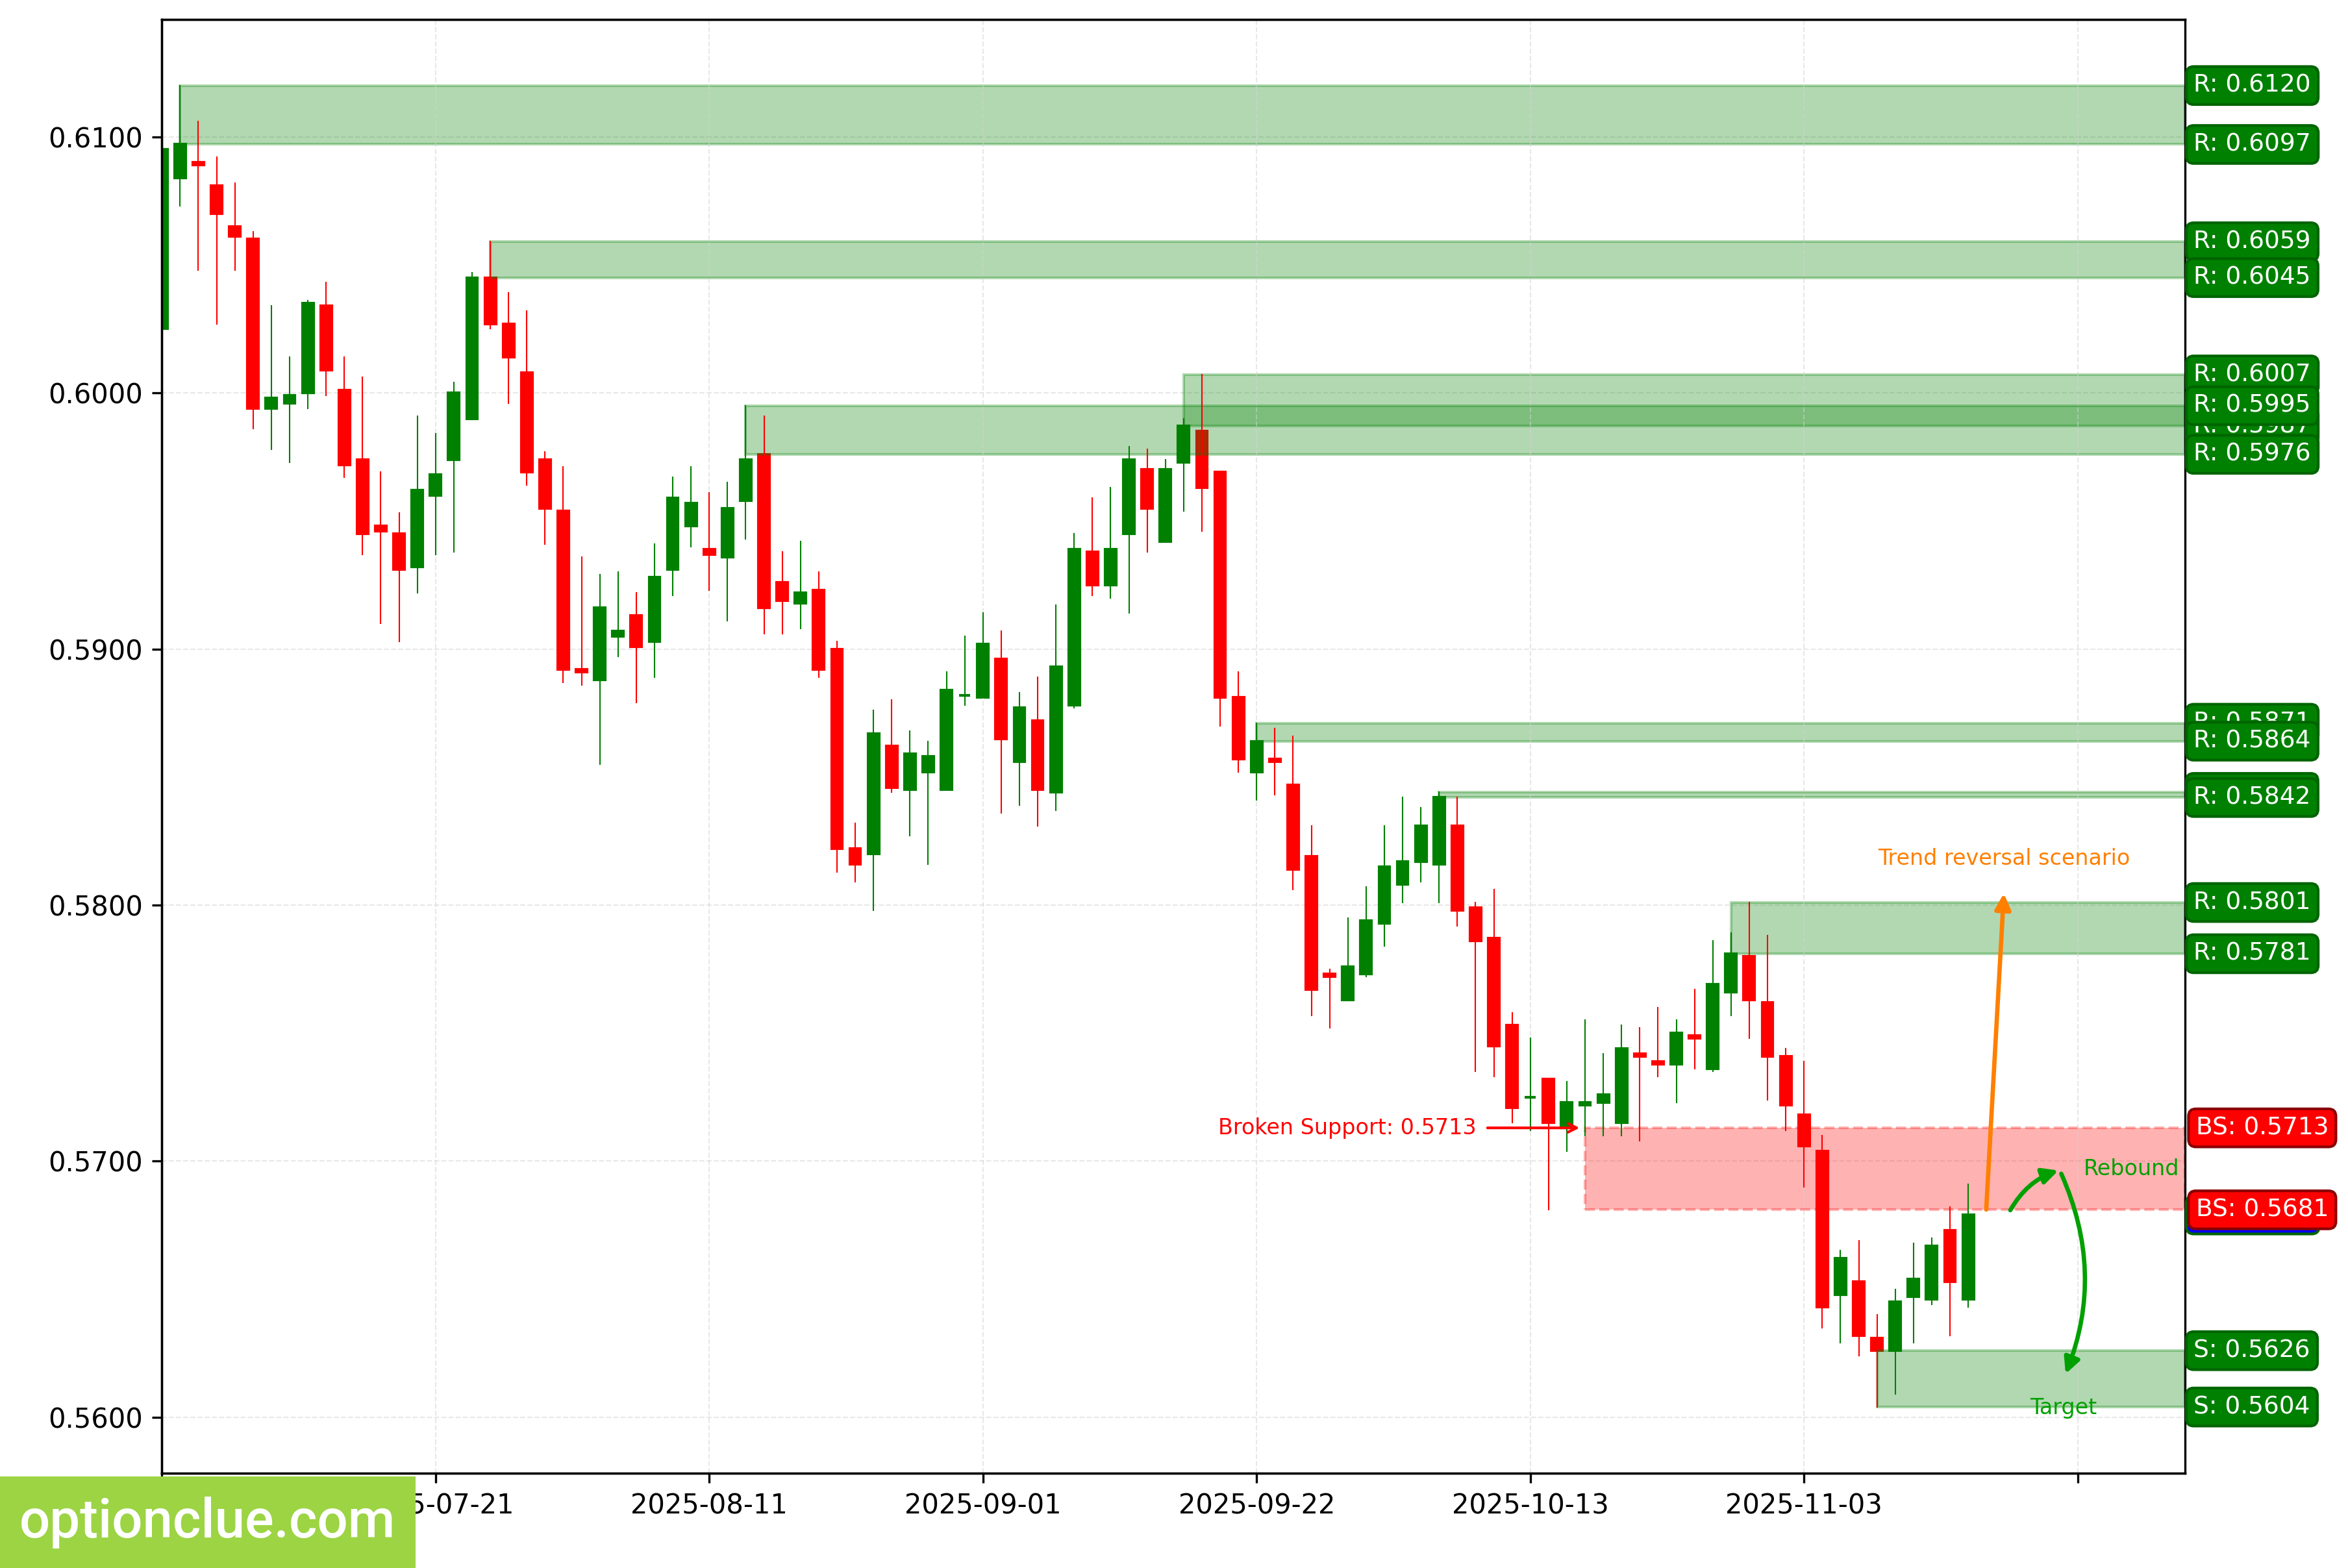
NZDUSD. Technical analysis. D1.
Bitcoin (BTC)
The bearish trend continues, and a corrective wave is developing. The last level broken was support (98950 – 101291). The breakout occurred 2 candlesticks ago. A short entry point on a rebound may form after the current correction is complete.
The intermediate target for the downward movement is the support level with boundaries at 93363 – 94273. If the trend develops successfully, a more distant target will be at the support level with boundaries at 92912 – 94183.
If the correction ends near the last broken level (98950 – 101291), the potential reward/risk ratio could be small (0.5:1). If a correction occurs to the resistance level (105979 – 107482), the potential reward/risk ratio could be approximately 2:1.
Short positions will remain relevant as long as the market stays below the nearest resistance level with boundaries at 105979 – 107482. If the market successfully establishes itself above this nearest resistance, the trend will reverse to the opposite (bullish).
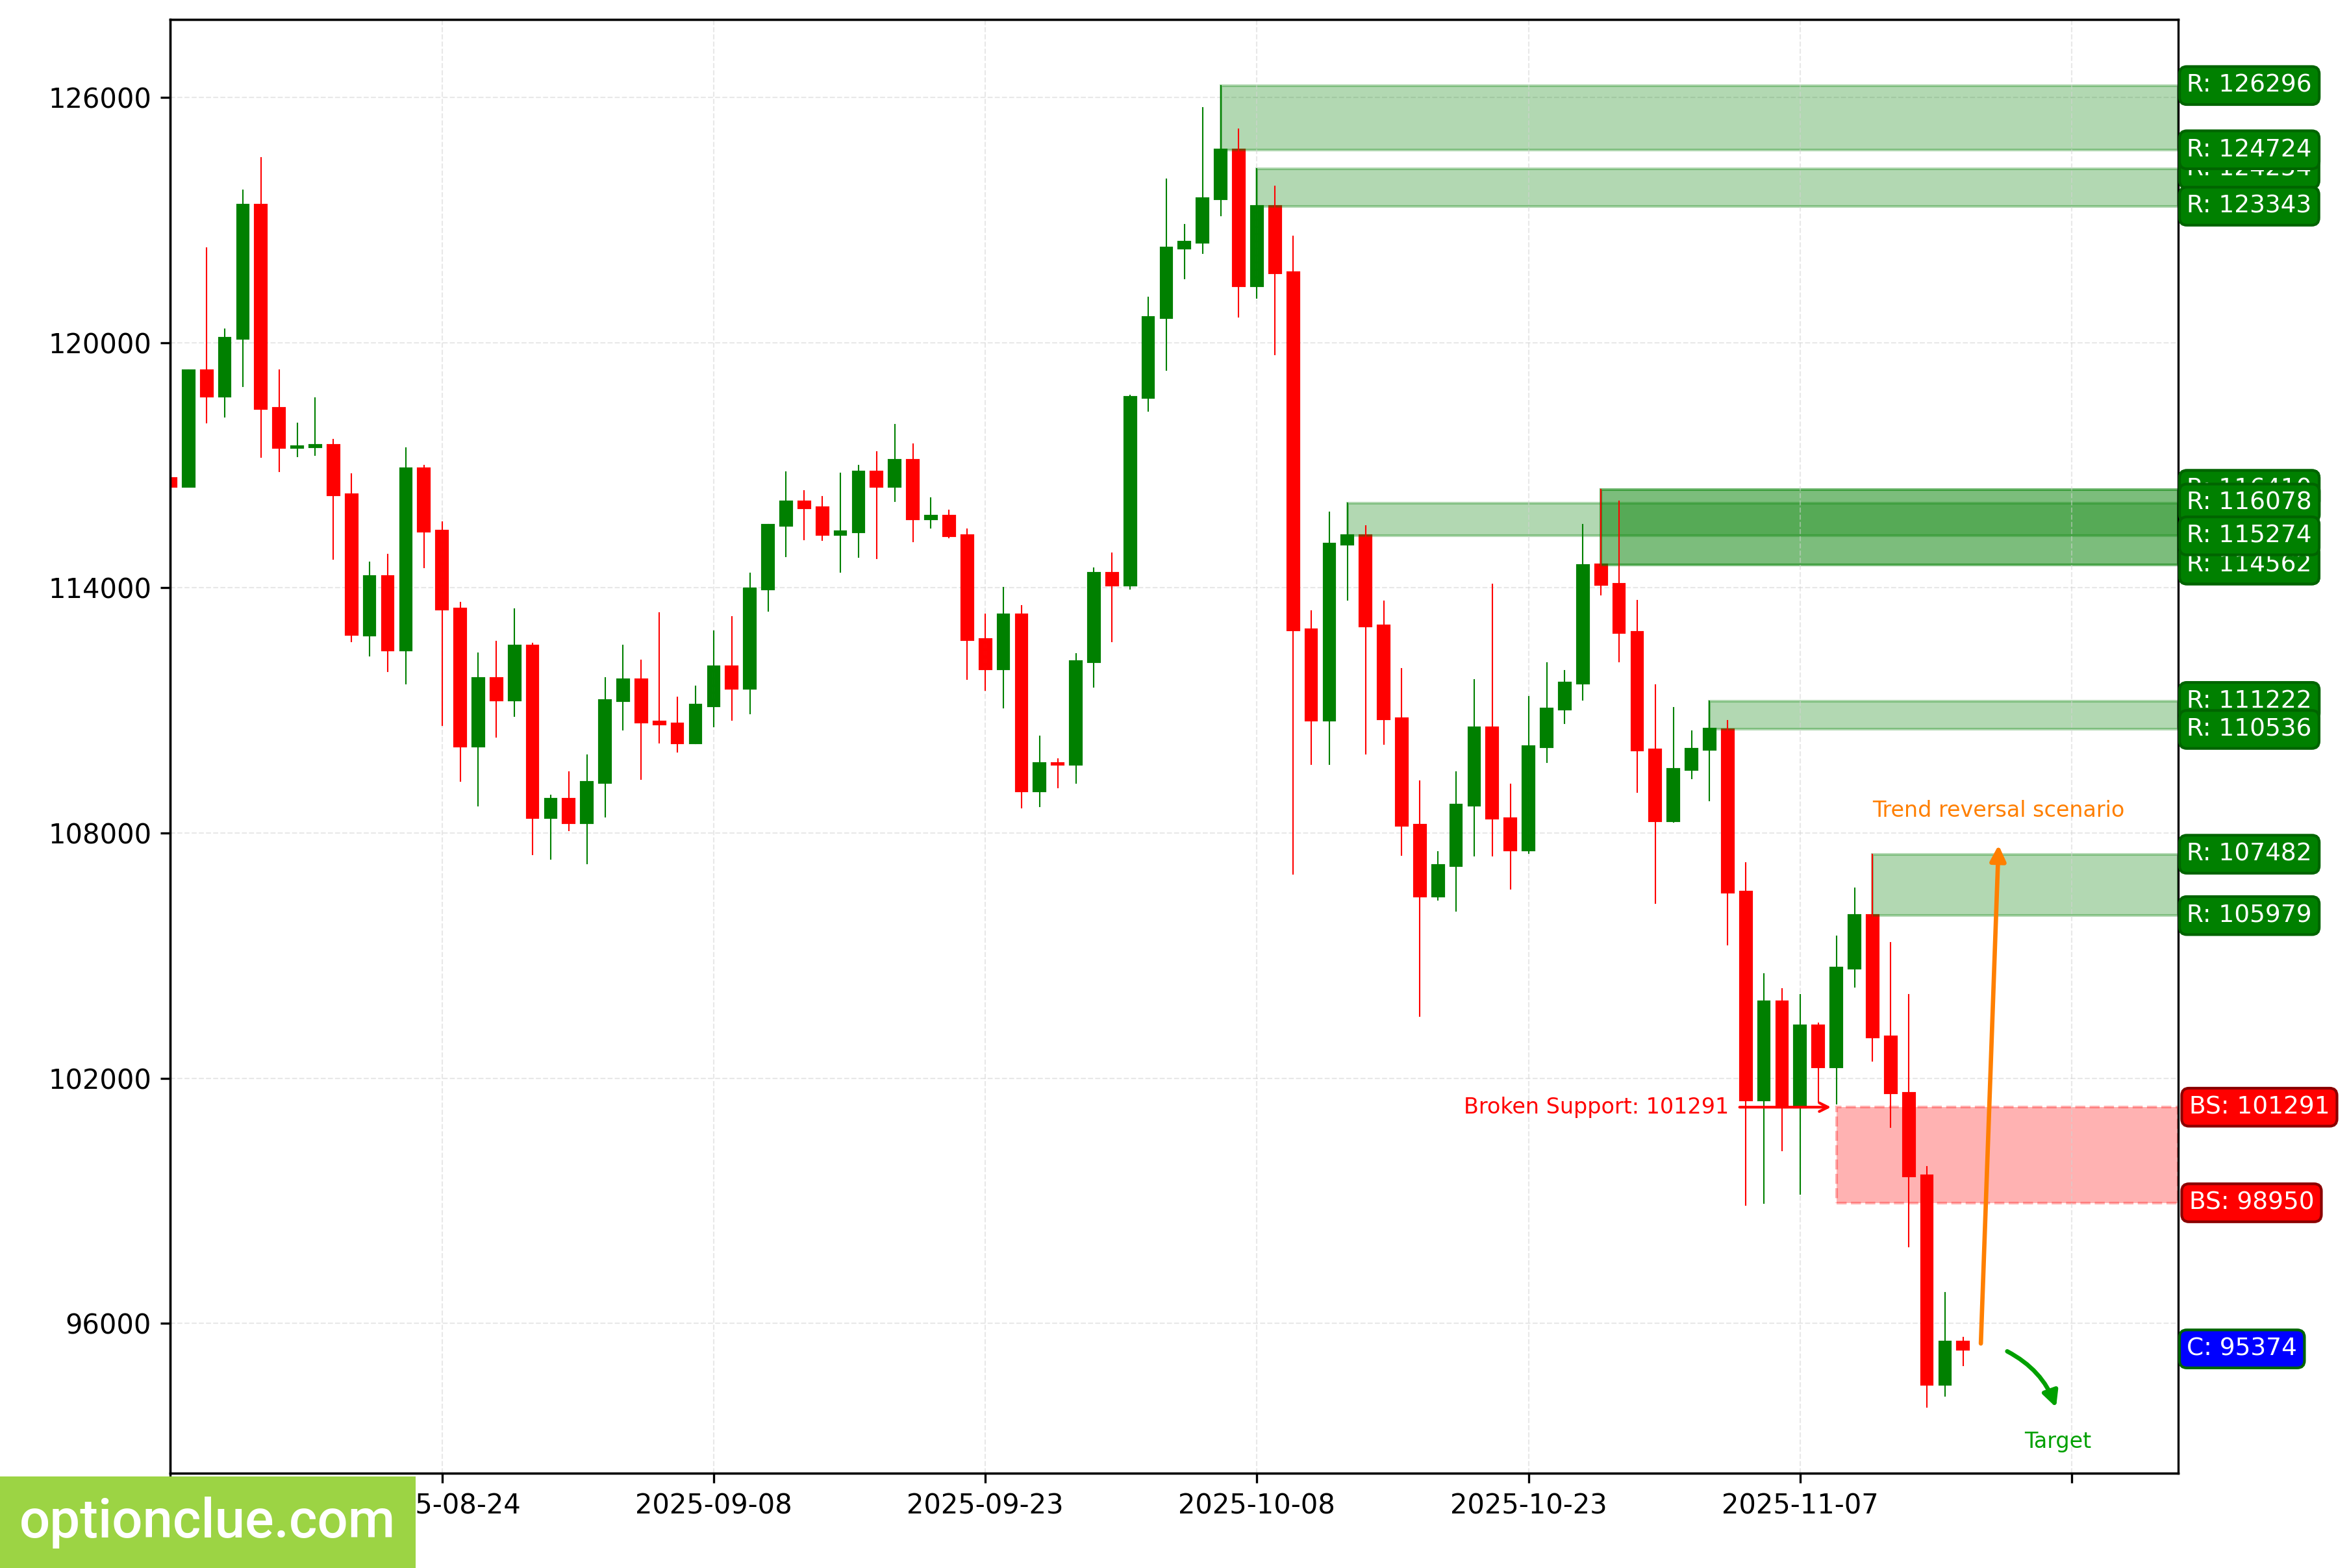
BTC. Technical analysis. D1.
Ethereum (ETH)
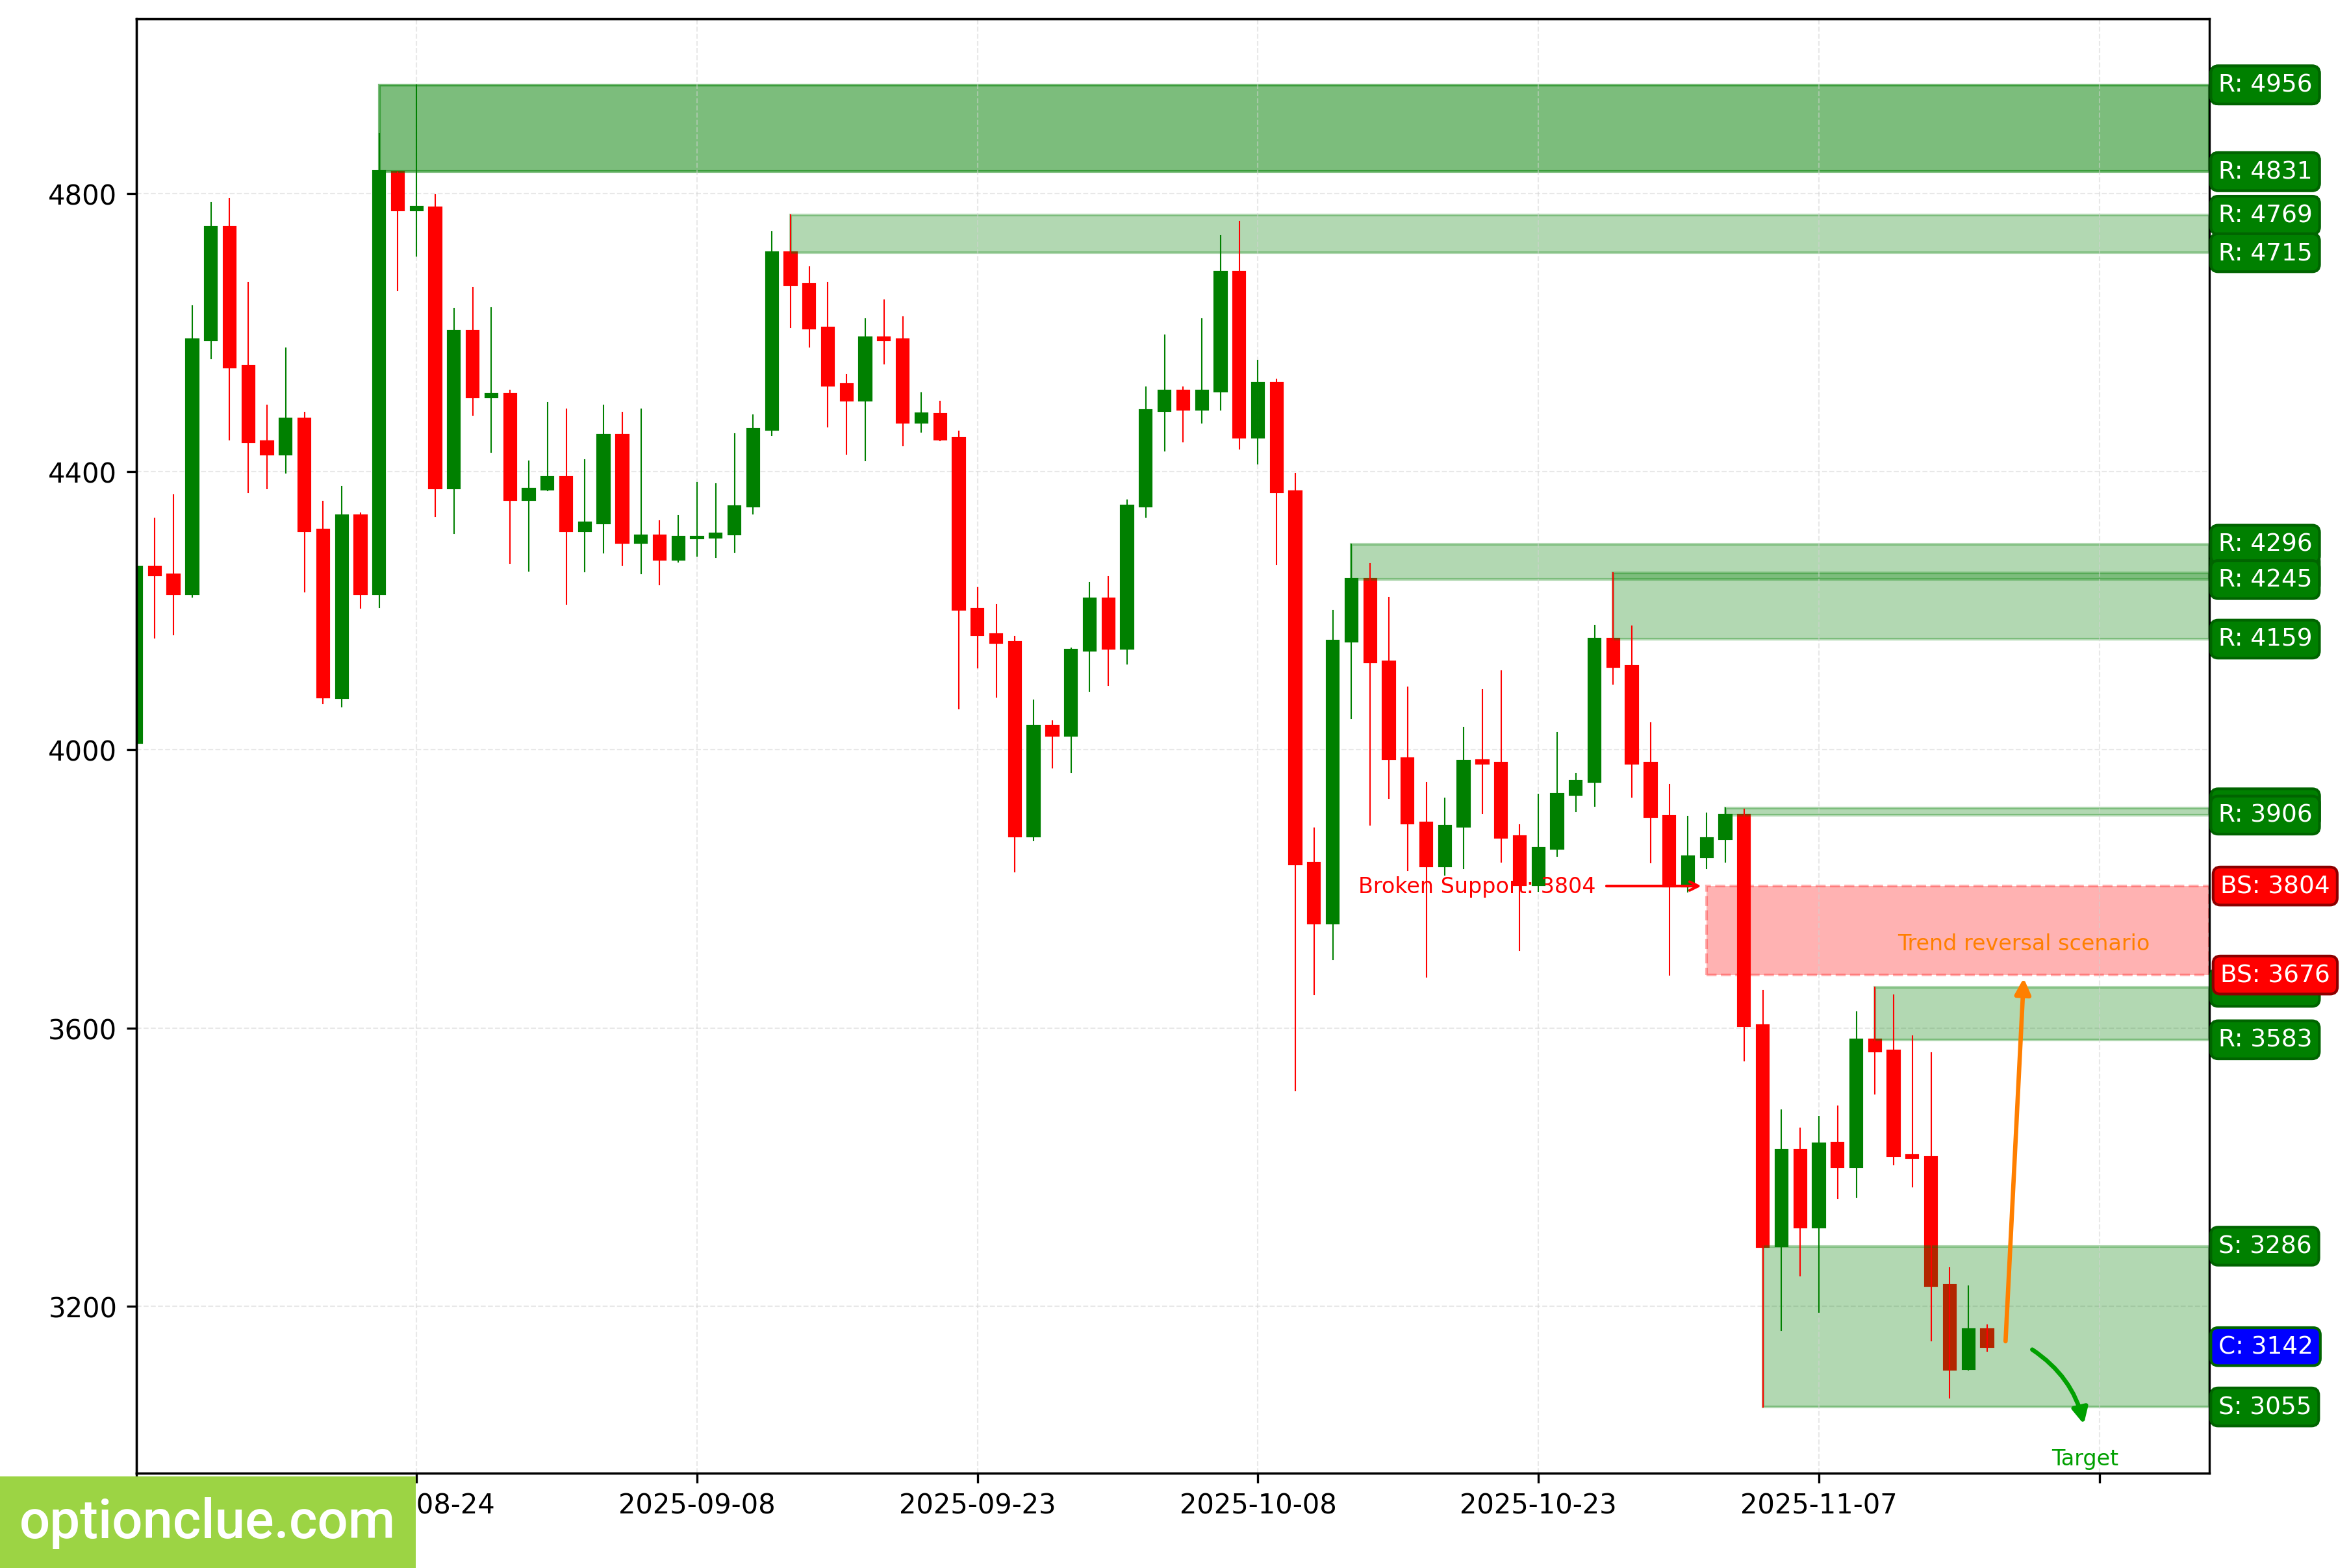
The bearish trend continues, and a corrective wave is developing. The last level broken was support (3676 – 3804). The breakout occurred 13 candlesticks ago. A short entry point on a rebound may form after the current correction is complete.
The intermediate target for the downward movement is the support level with boundaries at 2475 – 2509. If the trend develops successfully, a more distant target will be at the support level with boundaries at 2373 – 2405.
If the correction ends around the current prices, the potential reward/risk ratio, when setting targets and managing risk based on daily timeframe levels, could be slightly more than 1:1. For the more distant target, it is around 2:1.
Short positions will remain relevant as long as the market stays below the nearest resistance level with boundaries at 3583 – 3658. If the market successfully establishes itself above this nearest resistance, the trend will reverse to the opposite (bullish).
ETH. Technical analysis. D1.
Apple Inc (AAPL)
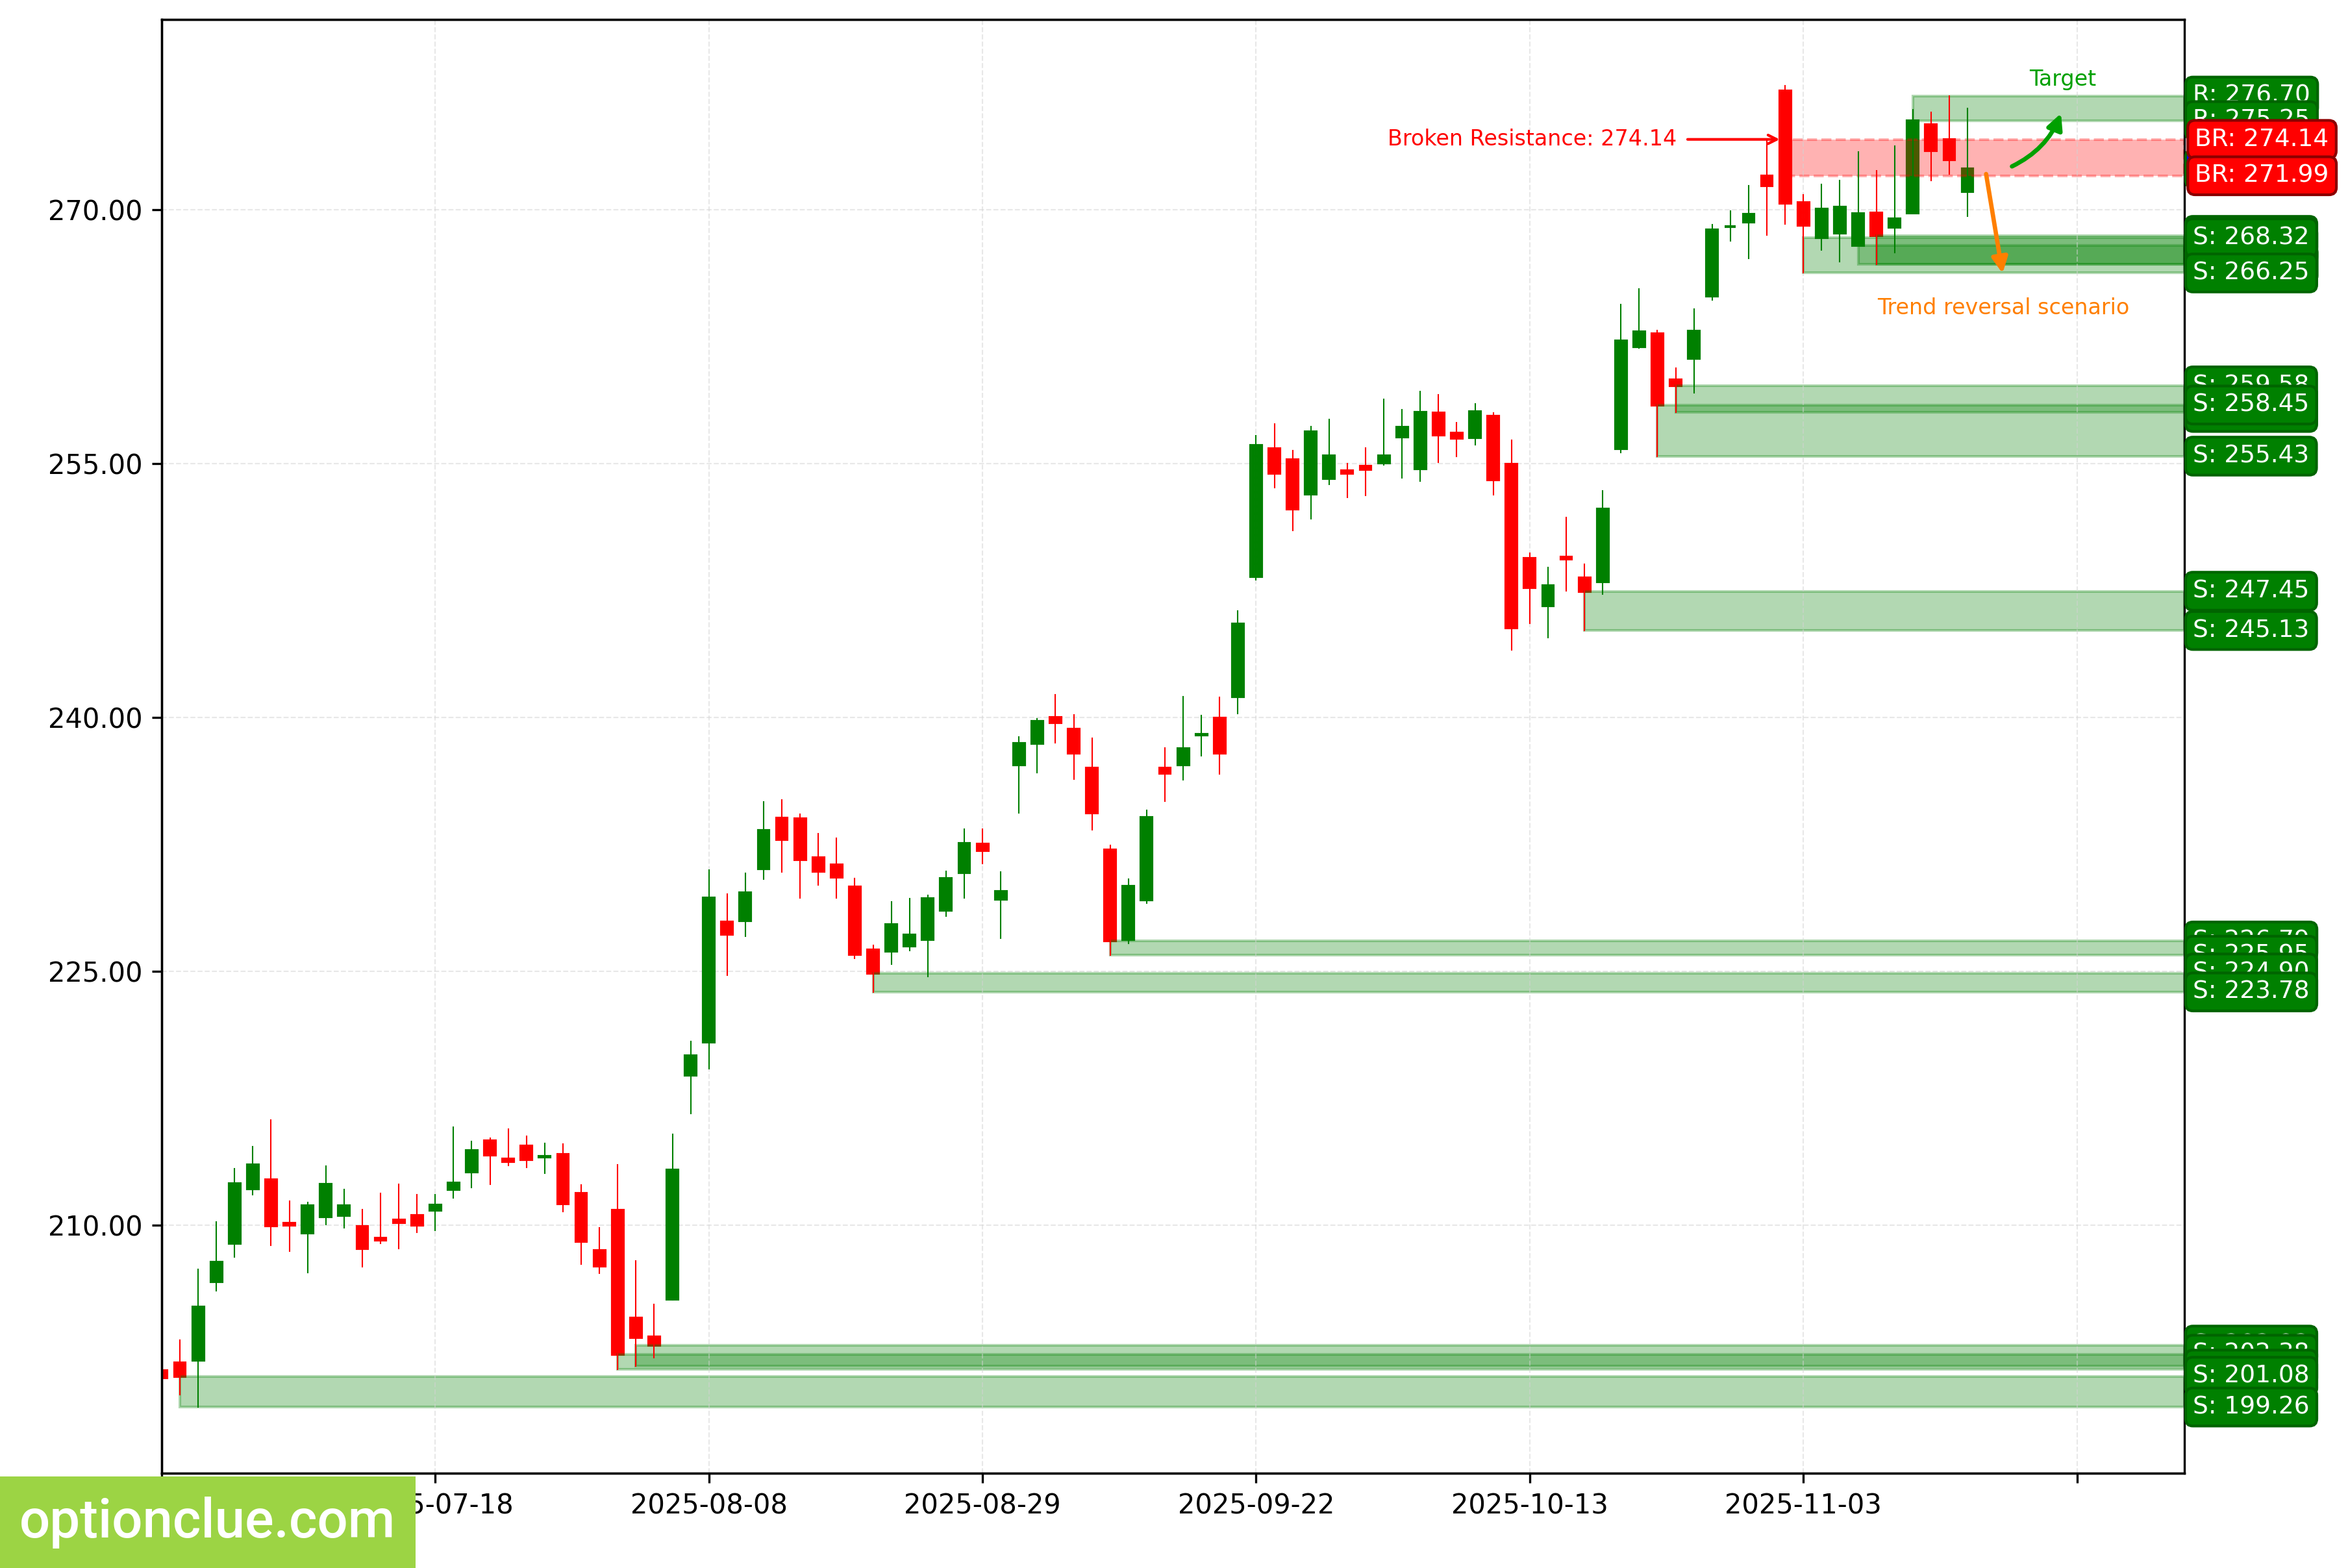
The bullish trend continues. The last level broken was resistance (271.99 – 274.14). The breakout occurred 4 candlesticks ago, and the price has returned to this last broken level. On the last closed candlestick, the correction likely ended, and an impulse wave is developing.
The intermediate target for the upward movement is the resistance level with boundaries at 275.25 – 276.70.
The potential reward/risk ratio from the established entry point to the first target is small. To improve the ratio, it makes sense to either consider more distant targets or wait for more favorable entry points.
Long positions will remain relevant as long as the market stays above the nearest daily timeframe support level with boundaries at 266.77 – 268.47. If the market successfully establishes itself below this nearest support, the trend will reverse to the opposite (bearish).
AAPL. Technical analysis. D1.
NVIDIA Corp (NVDA)
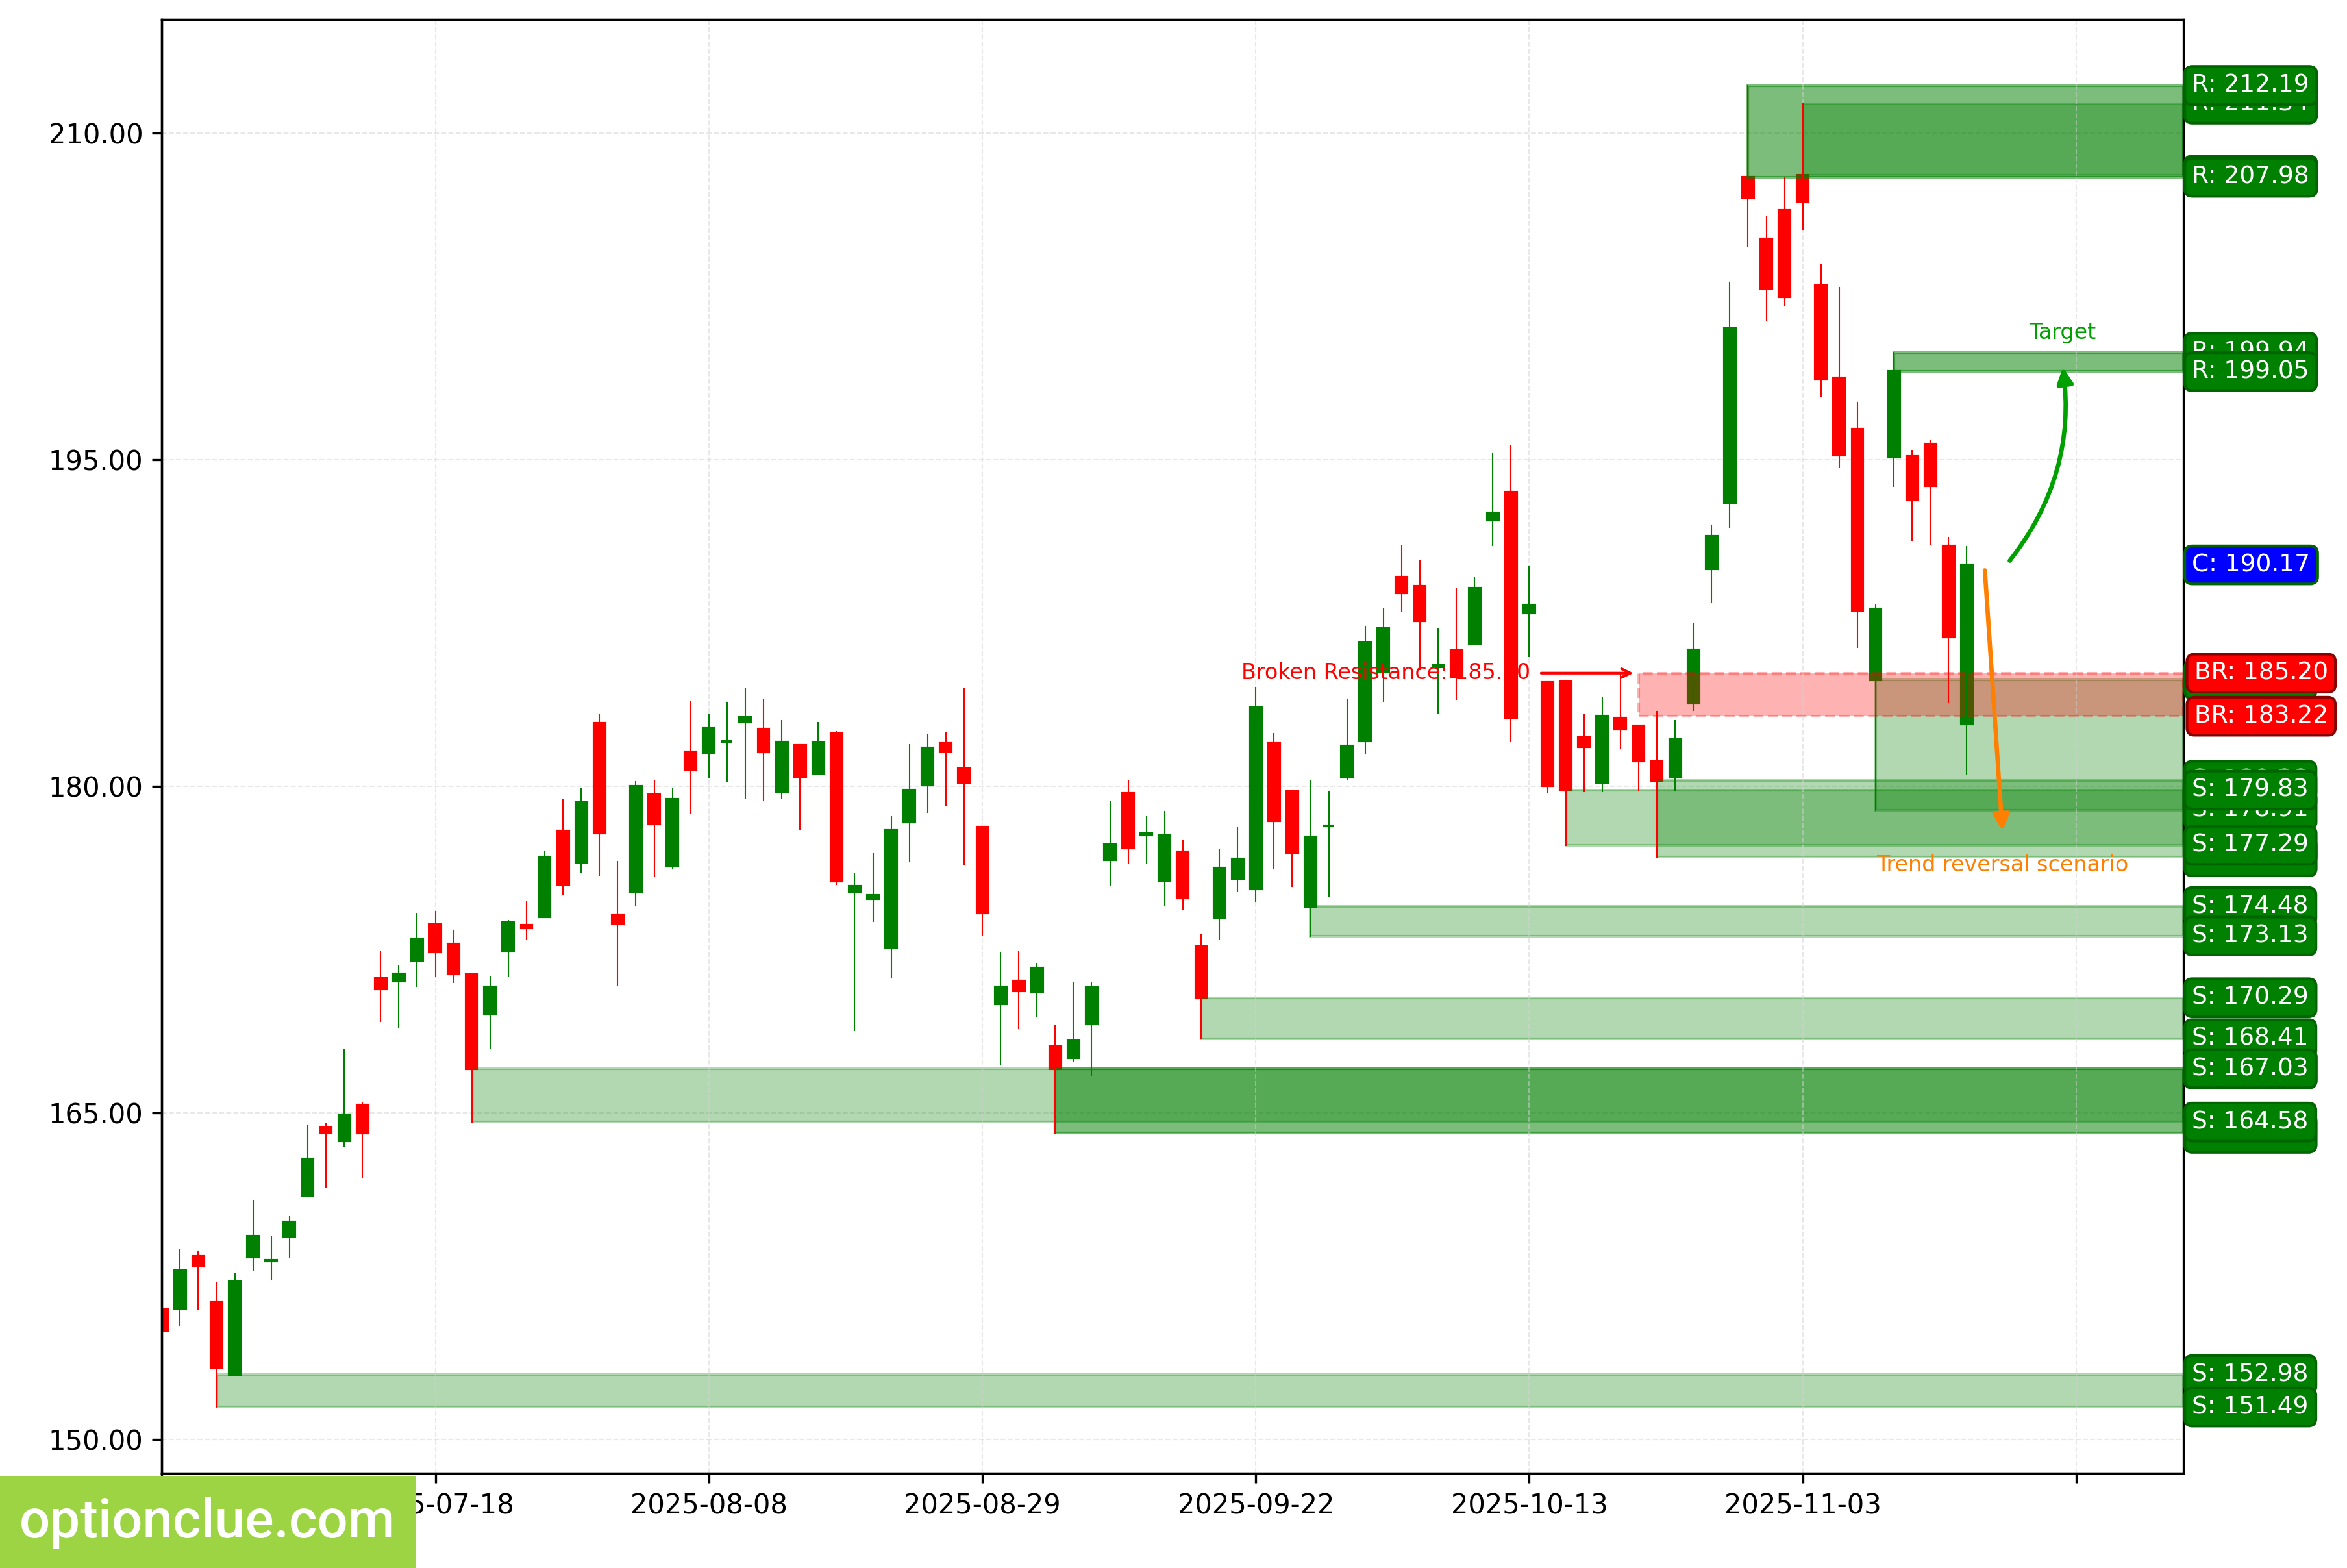
The bullish trend continues. On the last closed candlestick, the correction likely ended, and now an impulse wave is developing. The last level broken was resistance (183.22 – 185.20). The breakout occurred 16 candlesticks ago.
The intermediate target for the upward movement is the resistance level with boundaries at 199.05 – 199.94. If the market successfully establishes itself above this resistance, it will open the way for the price to move towards target #2 — the resistance level with boundaries at 208.08 – 211.34.
The potential reward/risk ratio from current prices, when setting targets and managing risk based on daily timeframe levels, could be slightly more than 1:1. For the more distant target, it is also slightly more than 1:1.
Long positions will remain relevant as long as the market stays above the nearest support level with boundaries at 178.91 – 184.90. If the market successfully establishes itself below this nearest support, the trend will reverse to the opposite (bearish).
NVDA. Technical analysis. D1.
Tesla Inc (TSLA)
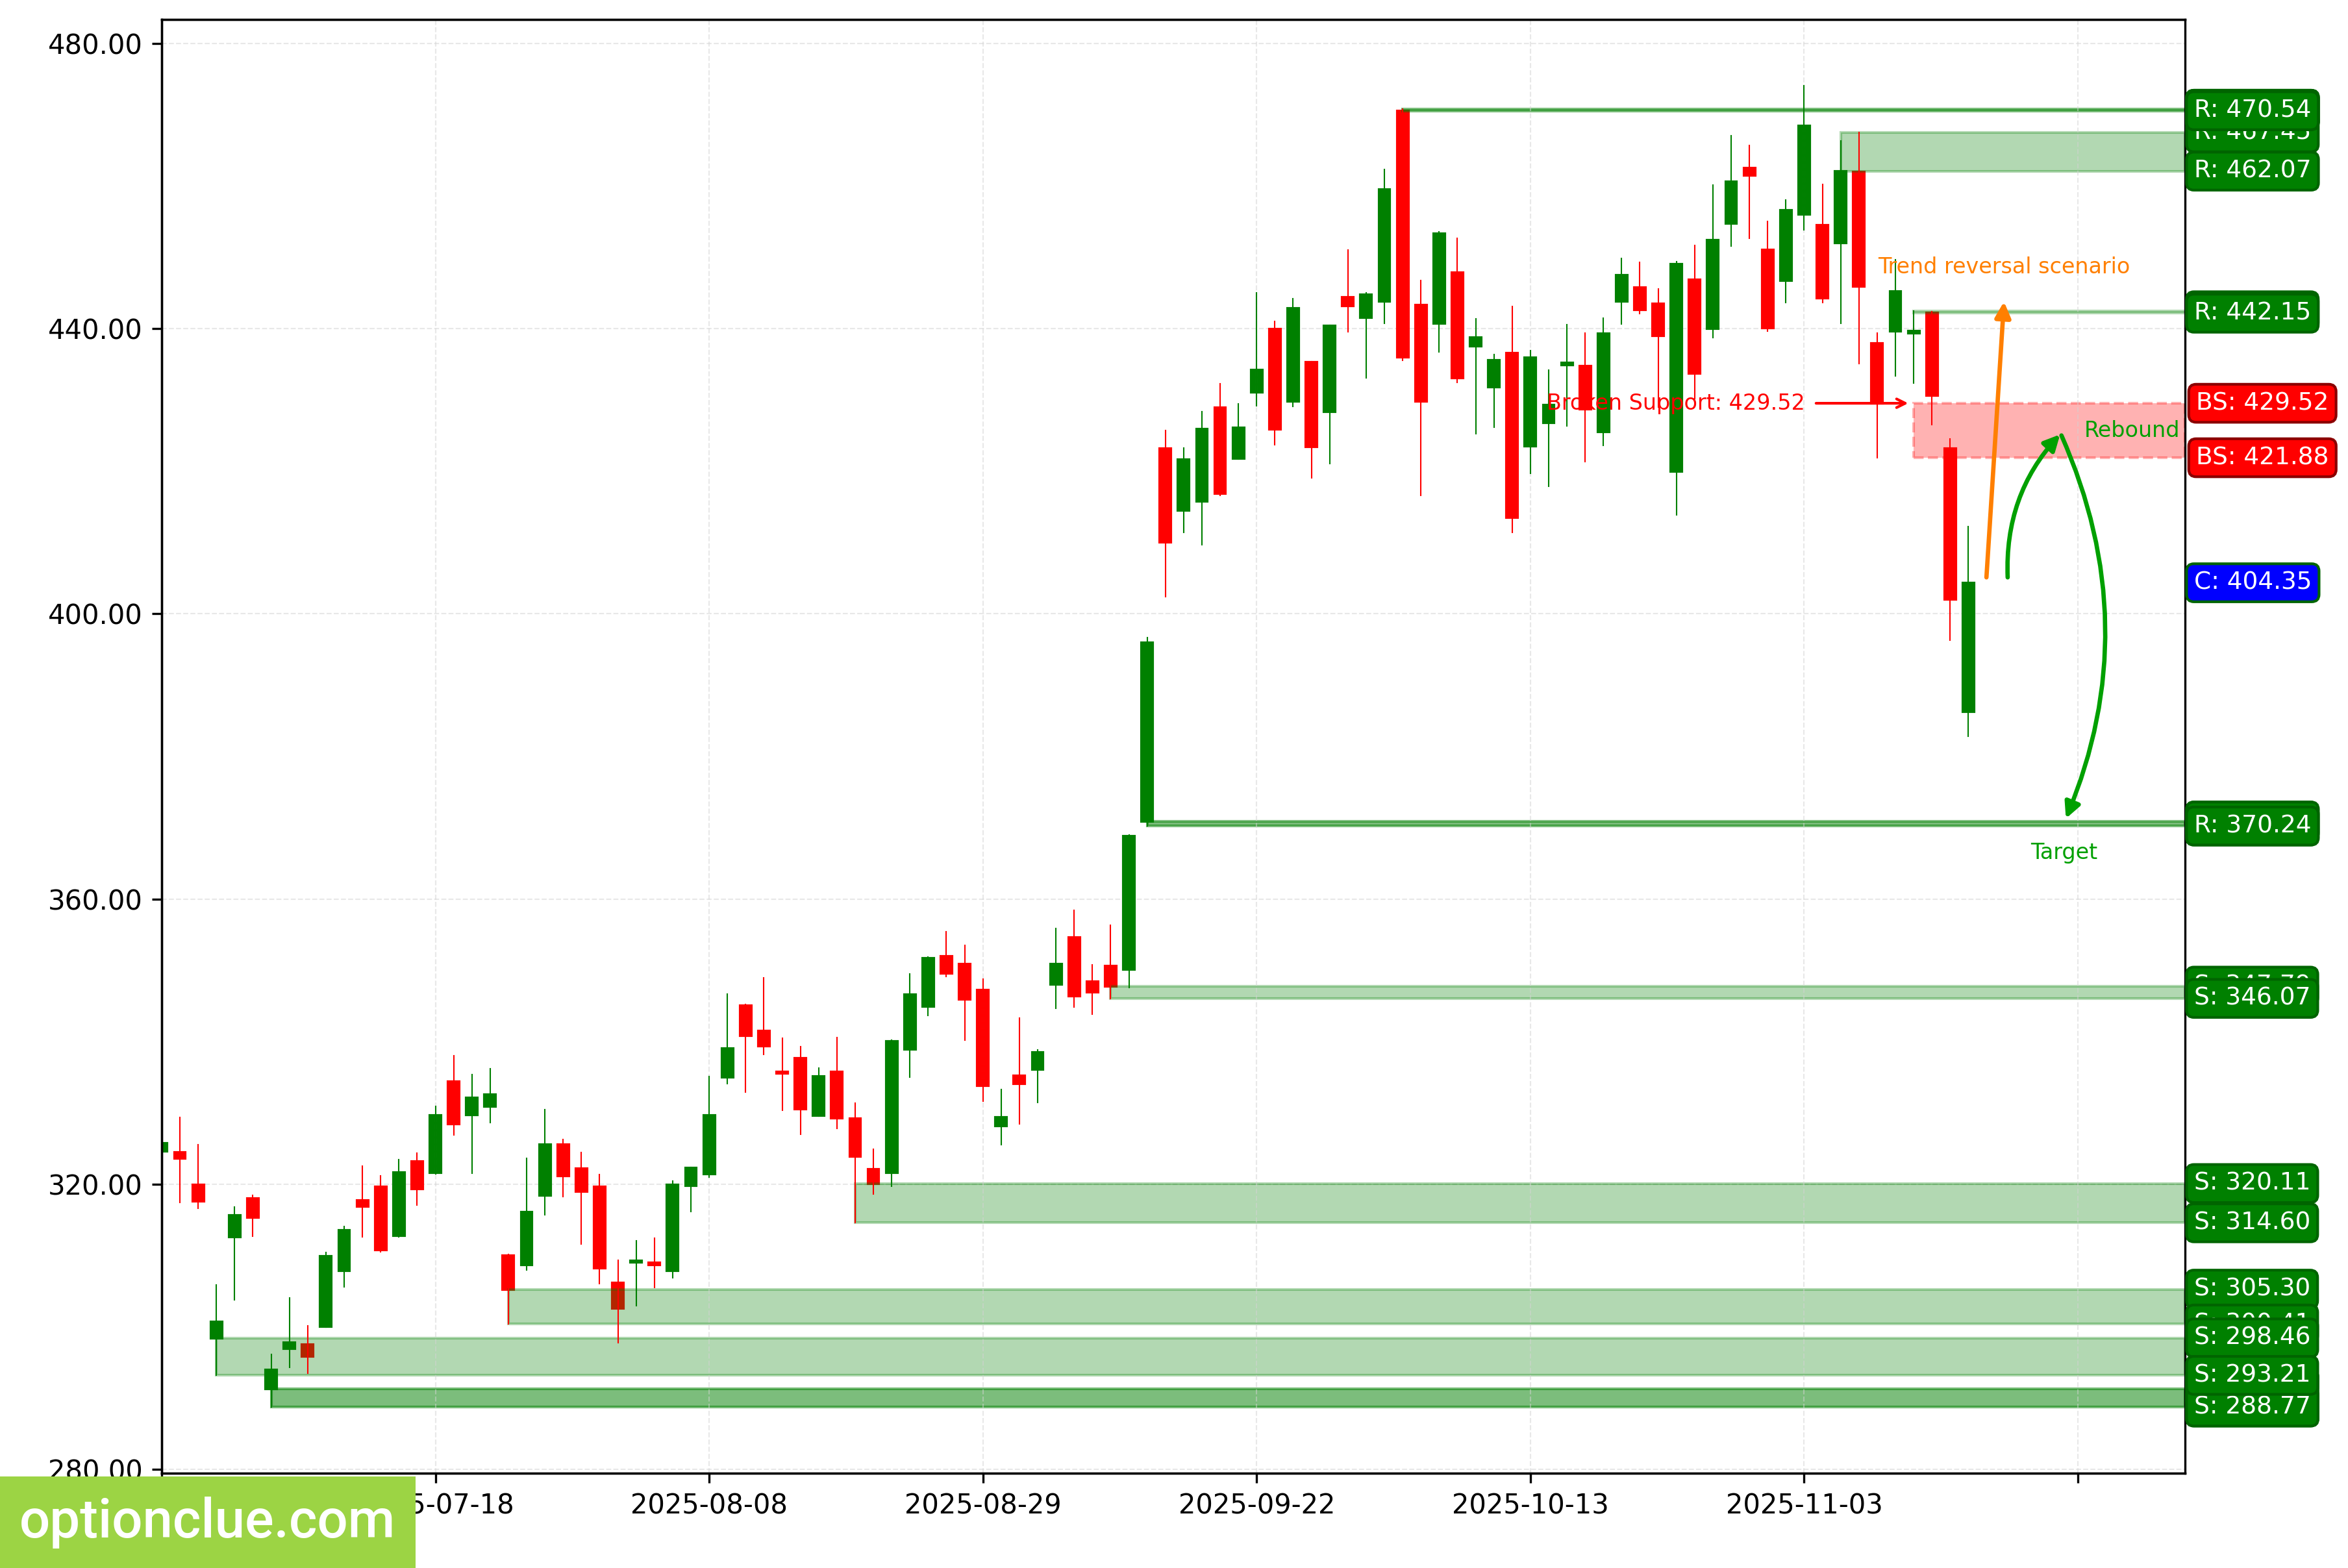
The bearish trend continues, and a corrective wave is developing. The last level broken was support (421.88 – 429.52). The breakout occurred 2 candlesticks ago. A short entry point on a rebound may form after the current correction is complete.
The intermediate target for the downward movement is the support level with boundaries at 370.24 – 370.94. If the trend develops successfully, a more distant target will be at the support level with boundaries at 346.07 – 347.79.
If the correction ends near the last broken level (421.88 – 429.52), the potential reward/risk ratio could be small (slightly more than 1:1). If a correction occurs to the resistance level (442.15 – 442.49), the potential reward/risk ratio could be 3:1.
Short positions will remain relevant as long as the market stays below the nearest resistance level with boundaries at 442.15 – 442.49. If the market successfully establishes itself above this nearest resistance, the trend will reverse to the opposite (bullish).
TSLA. Technical analysis. D1.
Summary
In the medium term, EURUSD, GBPUSD, USDCHF, USDJPY, USDCAD, NZDUSD, NVDA stand out with a correction that is nearing completion on the daily timeframe.
The other assets may be worth watching depending on the depth of the market correction.