
Considering the most important levels on key financial instruments and likely scenarios for developments.
Key Topics
- Euro (EURUSD)
- British Pound (GBPUSD)
- Swiss Franc (USDCHF)
- Japanese Yen (USDJPY)
- Canadian Dollar (USDCAD)
- Australian Dollar (AUDUSD)
- Bitcoin (BTC)
- Ether (ETH)
- Apple Inc (AAPL)
- NVIDIA Corp (NVDA)
- Tesla Inc (TSLA)
- Summary
Euro (EURUSD)
The bearish trend continues, an impulse wave is developing. The last broken level is support (1.1532 — 1.1611). The breakout occurred 2 candlesticks ago.
The intermediate target for the downward movement is the support level with boundaries 1.1392 — 1.1422. In case of successful trend development, a farther target will be at the support level with boundaries 1.1211 — 1.1229.
If the next correction completes near the resistance level (1.1619 — 1.1667), the potential profit/risk ratio may be approximately 1.7:1. When using a farther target — around 3.2:1. If the correction completes near the last broken level (1.1532 — 1.1611), the potential profit/risk ratio may be small (approximately 0.7:1). When selecting a farther target — approximately 1.7:1.
Short positions will remain relevant as long as the market stays below the nearest resistance level with boundaries 1.1619 — 1.1667. If the market successfully settles above this nearest resistance, the trend will reverse to the opposite (bullish).
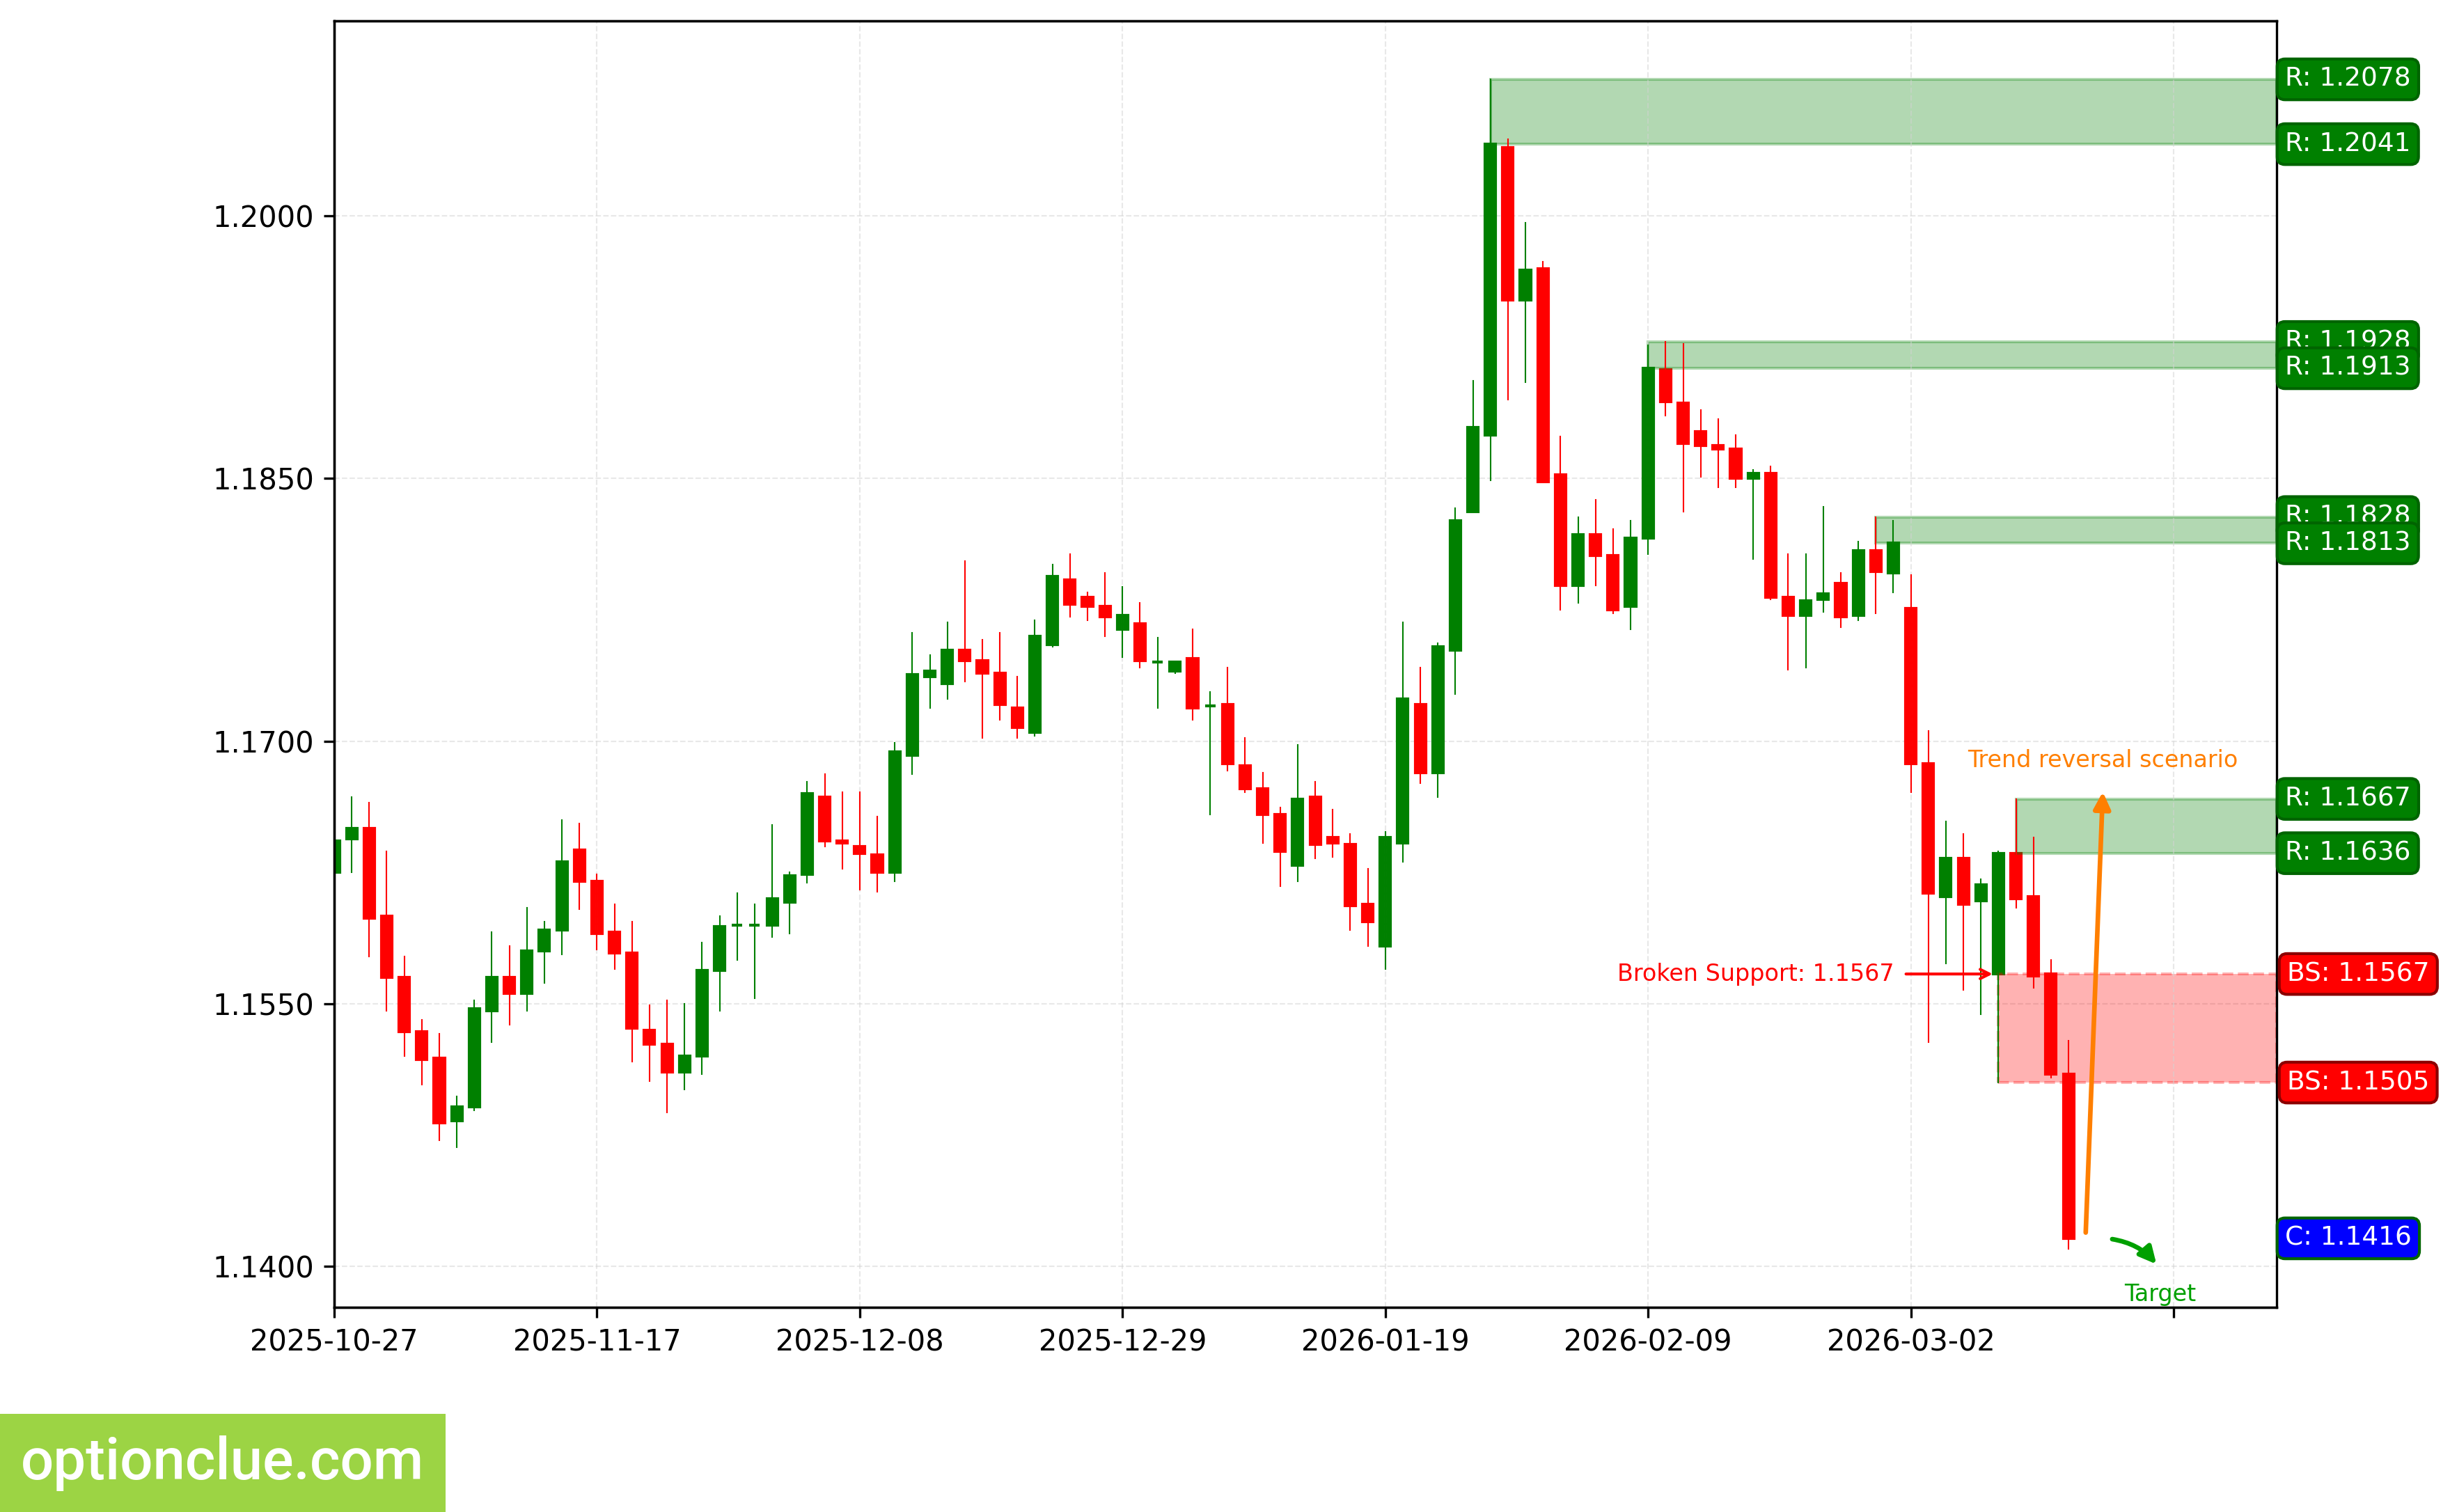
EURUSD. Technical analysis. D1.
British Pound (GBPUSD)
The bearish trend continues, the last broken level is support (1.3253 — 1.3352). The breakout occurred on the last closed candlestick, an impulse wave is developing.
The intermediate target for the downward movement is the support level with boundaries 1.3180 — 1.3209. In case of successful trend development, a farther target will be at the support level with boundaries 1.3010 — 1.3021.
If the new correction completes near the resistance level (1.3424 — 1.3483), the potential profit/risk ratio may be around 1.6:1. When using a farther target — around 2.8:1. If the next correction completes near the last broken level (1.3253 — 1.3352), the potential profit/risk ratio may be small (around 0.3:1). When selecting a farther target — also small (approximately 0.9:1).
Short positions will remain relevant as long as the market stays below the nearest resistance level with boundaries 1.3424 — 1.3483. If the market successfully settles above this nearest resistance, the trend will reverse to the opposite (bullish).
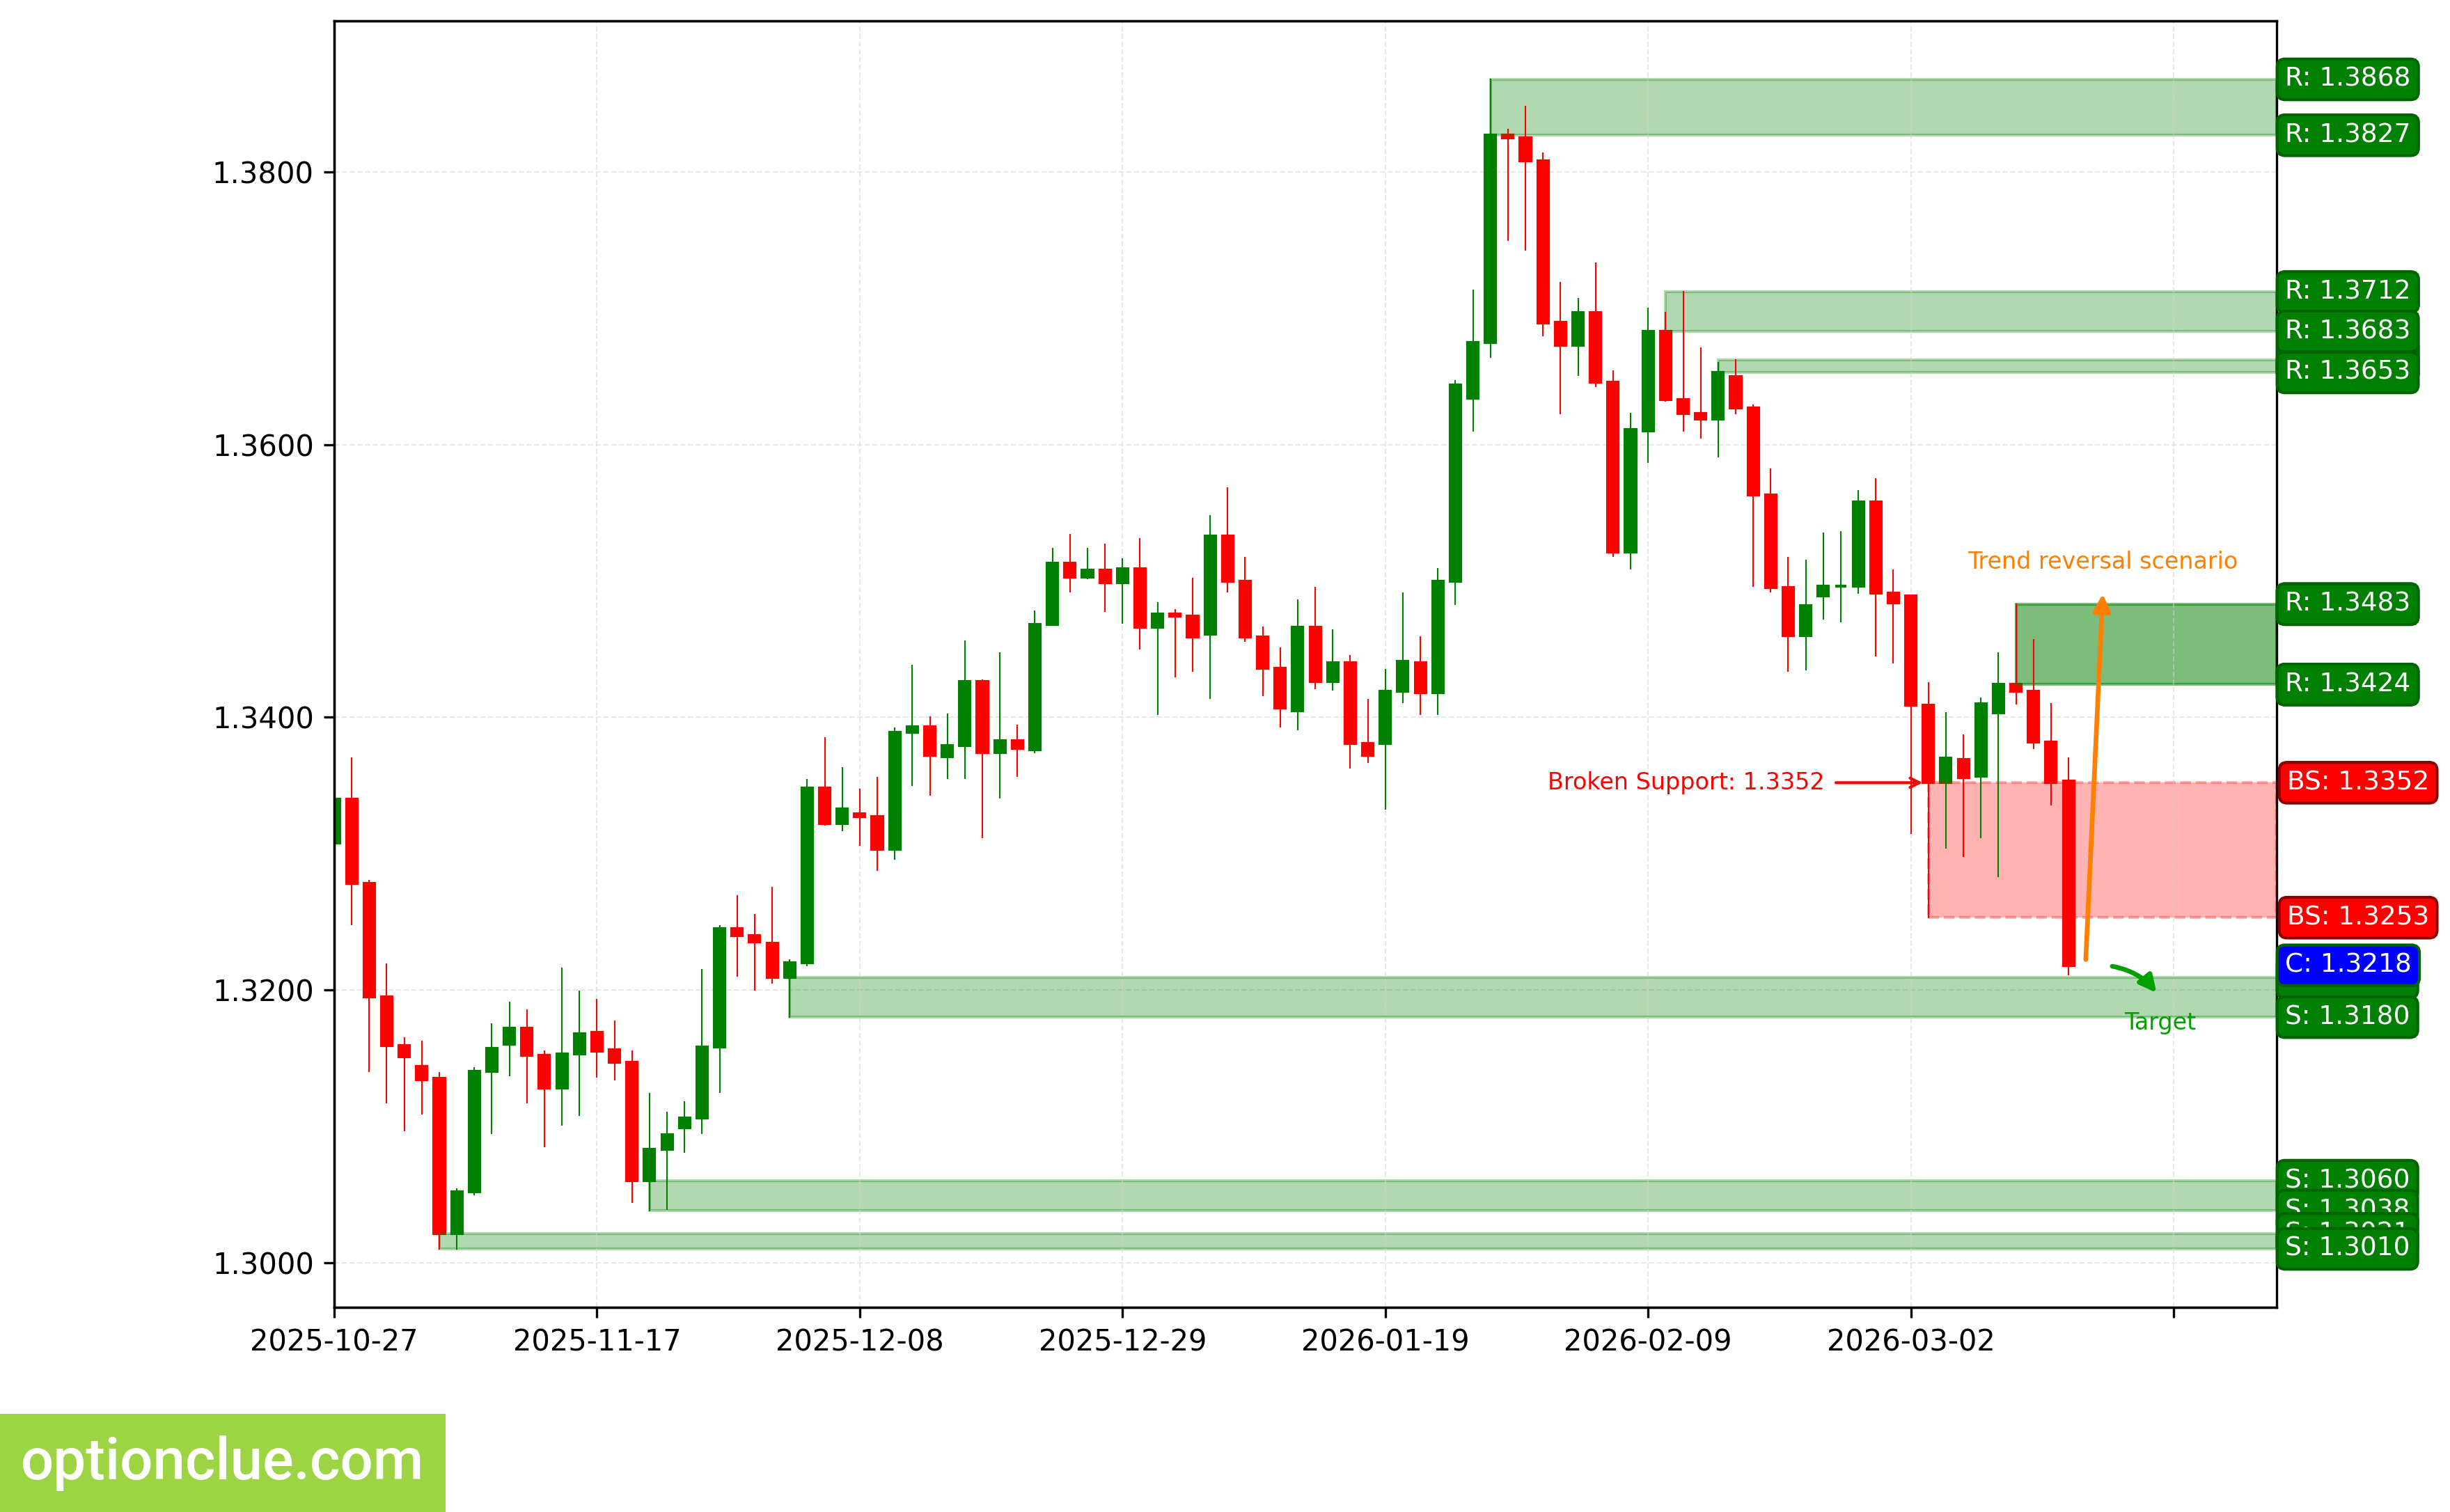
GBPUSD. Technical analysis. D1.
Swiss Franc (USDCHF)
The trend has changed to bullish when the resistance level (0.7748 — 0.7768) was broken 10 candlesticks ago. 4 candlesticks ago, the correction completed and a buy entry point formed on bounce, an impulse wave is developing.
The intermediate target for the upward movement is the resistance level (0.8033 — 0.8040). In case of successful trend development, a farther target will be at the resistance level (0.8087 — 0.8101).
The potential profit/risk ratio from current prices when setting targets and fixing risks based on daily timeframe levels may be small (approximately 0.5:1). When using a farther target — also small (around 0.7:1).
Long positions will remain relevant as long as the market is above the nearest support level (0.7746 — 0.7772). If the market successfully settles below this support, the trend will reverse to the opposite (bearish).
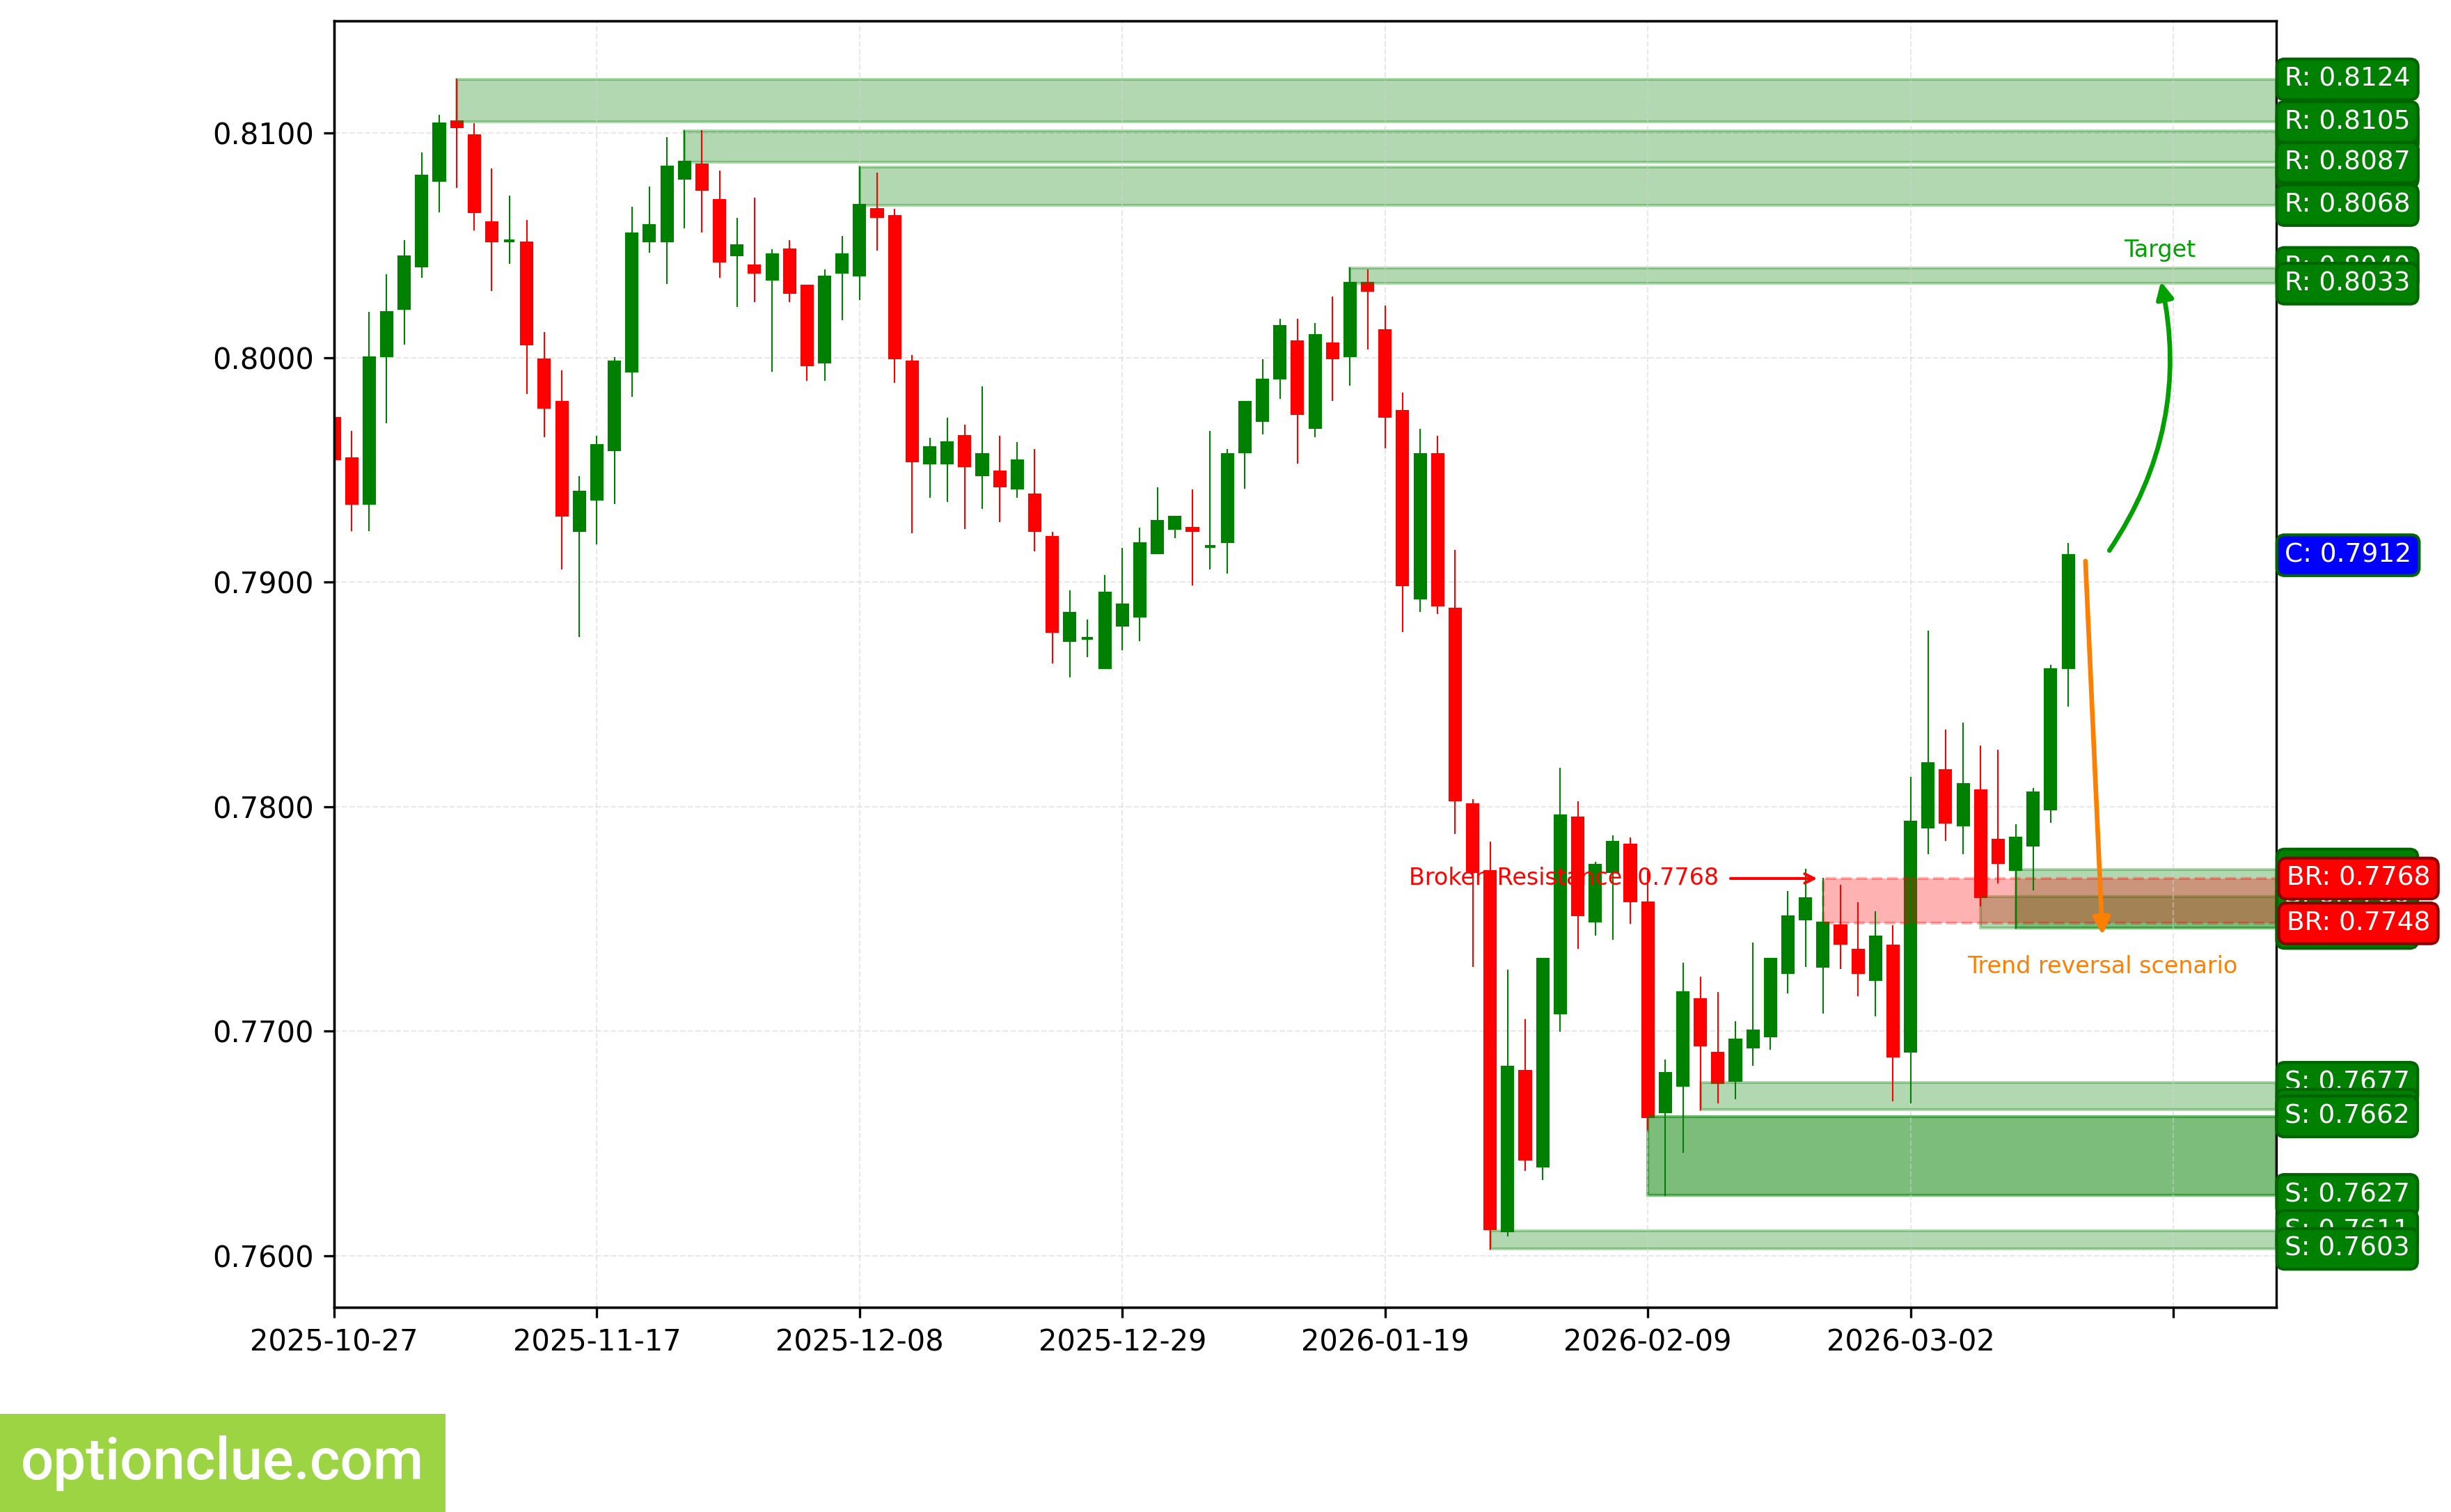
USDCHF. Technical analysis. D1.
Japanese Yen (USDJPY)
The bullish trend continues, 7 candlesticks ago the correction completed and a buy entry point formed on bounce, an impulse wave is developing. The last broken level is resistance (156.19 — 156.82). The breakout occurred 10 candlesticks ago.
No intermediate target for the upward movement on the current timeframe.
Long positions will remain relevant as long as the market stays above the nearest support level with boundaries 156.47 — 156.98. If the market successfully settles below this support, the trend will reverse to the opposite (bearish).
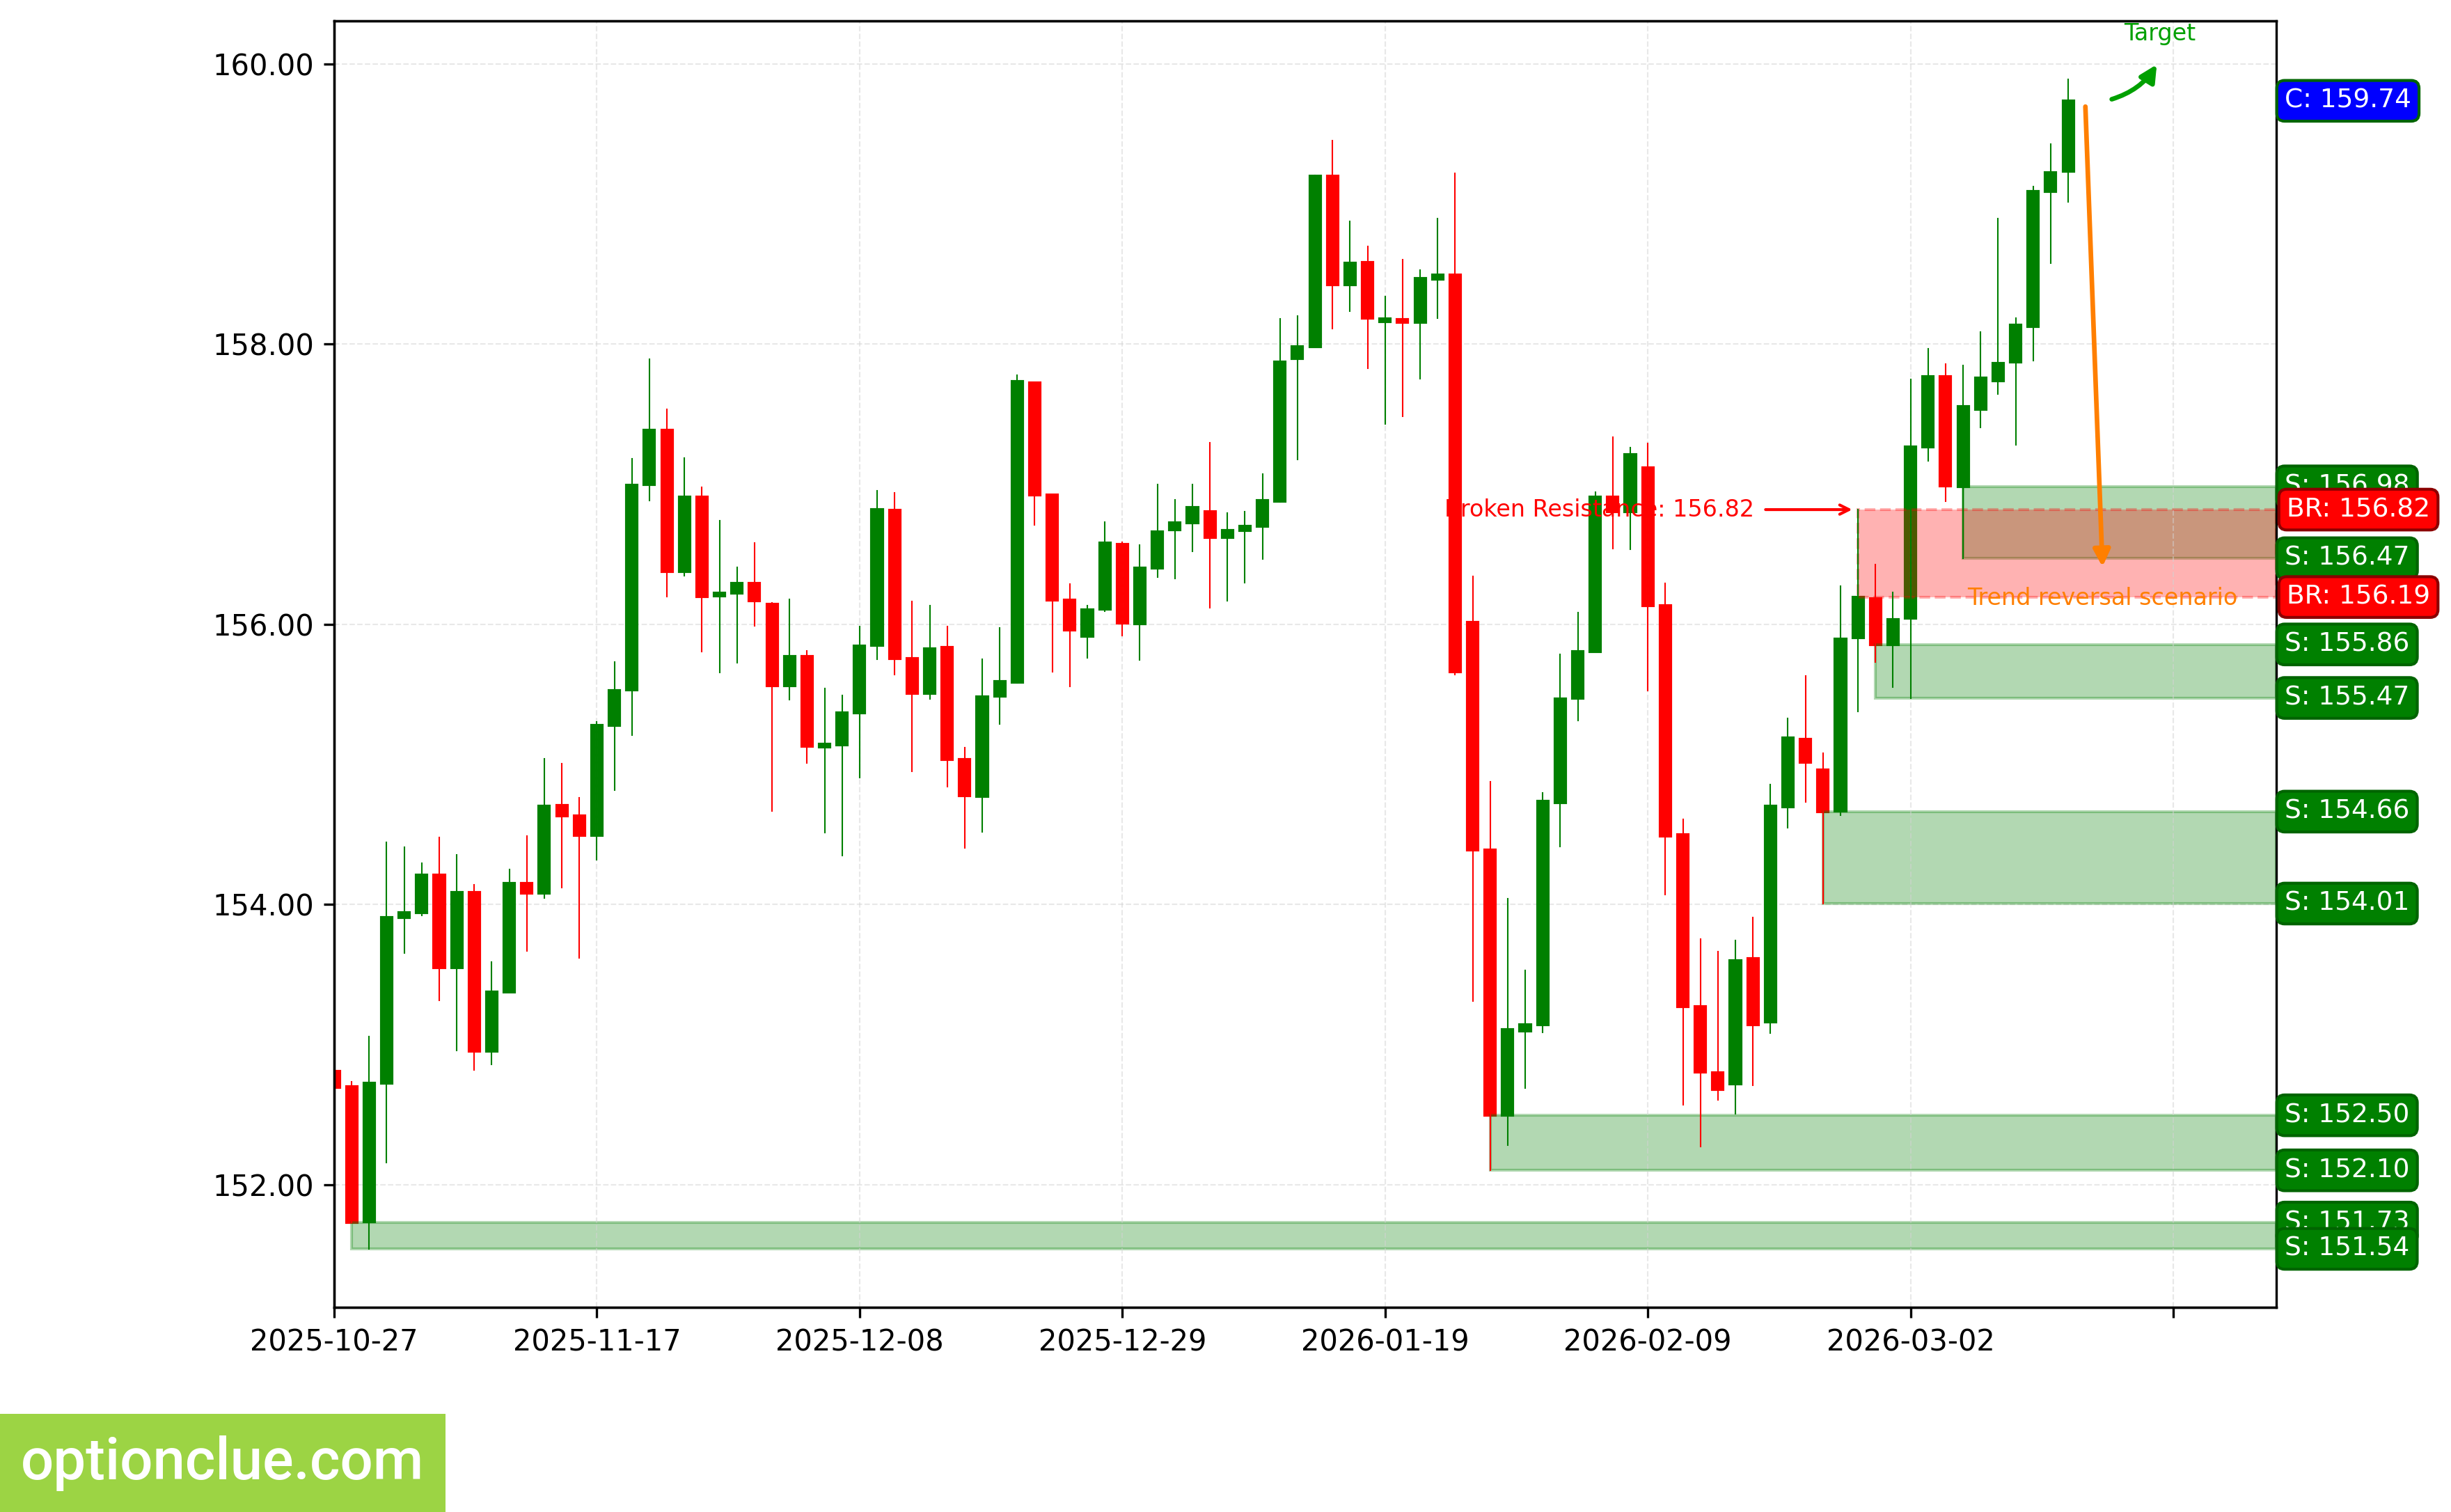
USDJPY. Technical analysis. D1.
Canadian Dollar (USDCAD)
The bearish trend continues, a corrective wave is developing. Price has reached the resistance zone (1.3712 — 1.3724), confirmation is expected. A sell entry point may form after the current correction completes. The last broken level is support (1.3646 — 1.3678). The breakout occurred 11 candlesticks ago.
The intermediate target for the downward movement is the support level with boundaries 1.3523 — 1.3578.
If the correction completes near the resistance level (1.3712 — 1.3724), the potential profit/risk ratio may be around 1.5:1.
Short positions will remain relevant as long as the market stays below the nearest resistance level with boundaries 1.3712 — 1.3724. If the market successfully settles above this nearest resistance, the trend will reverse to the opposite (bullish).
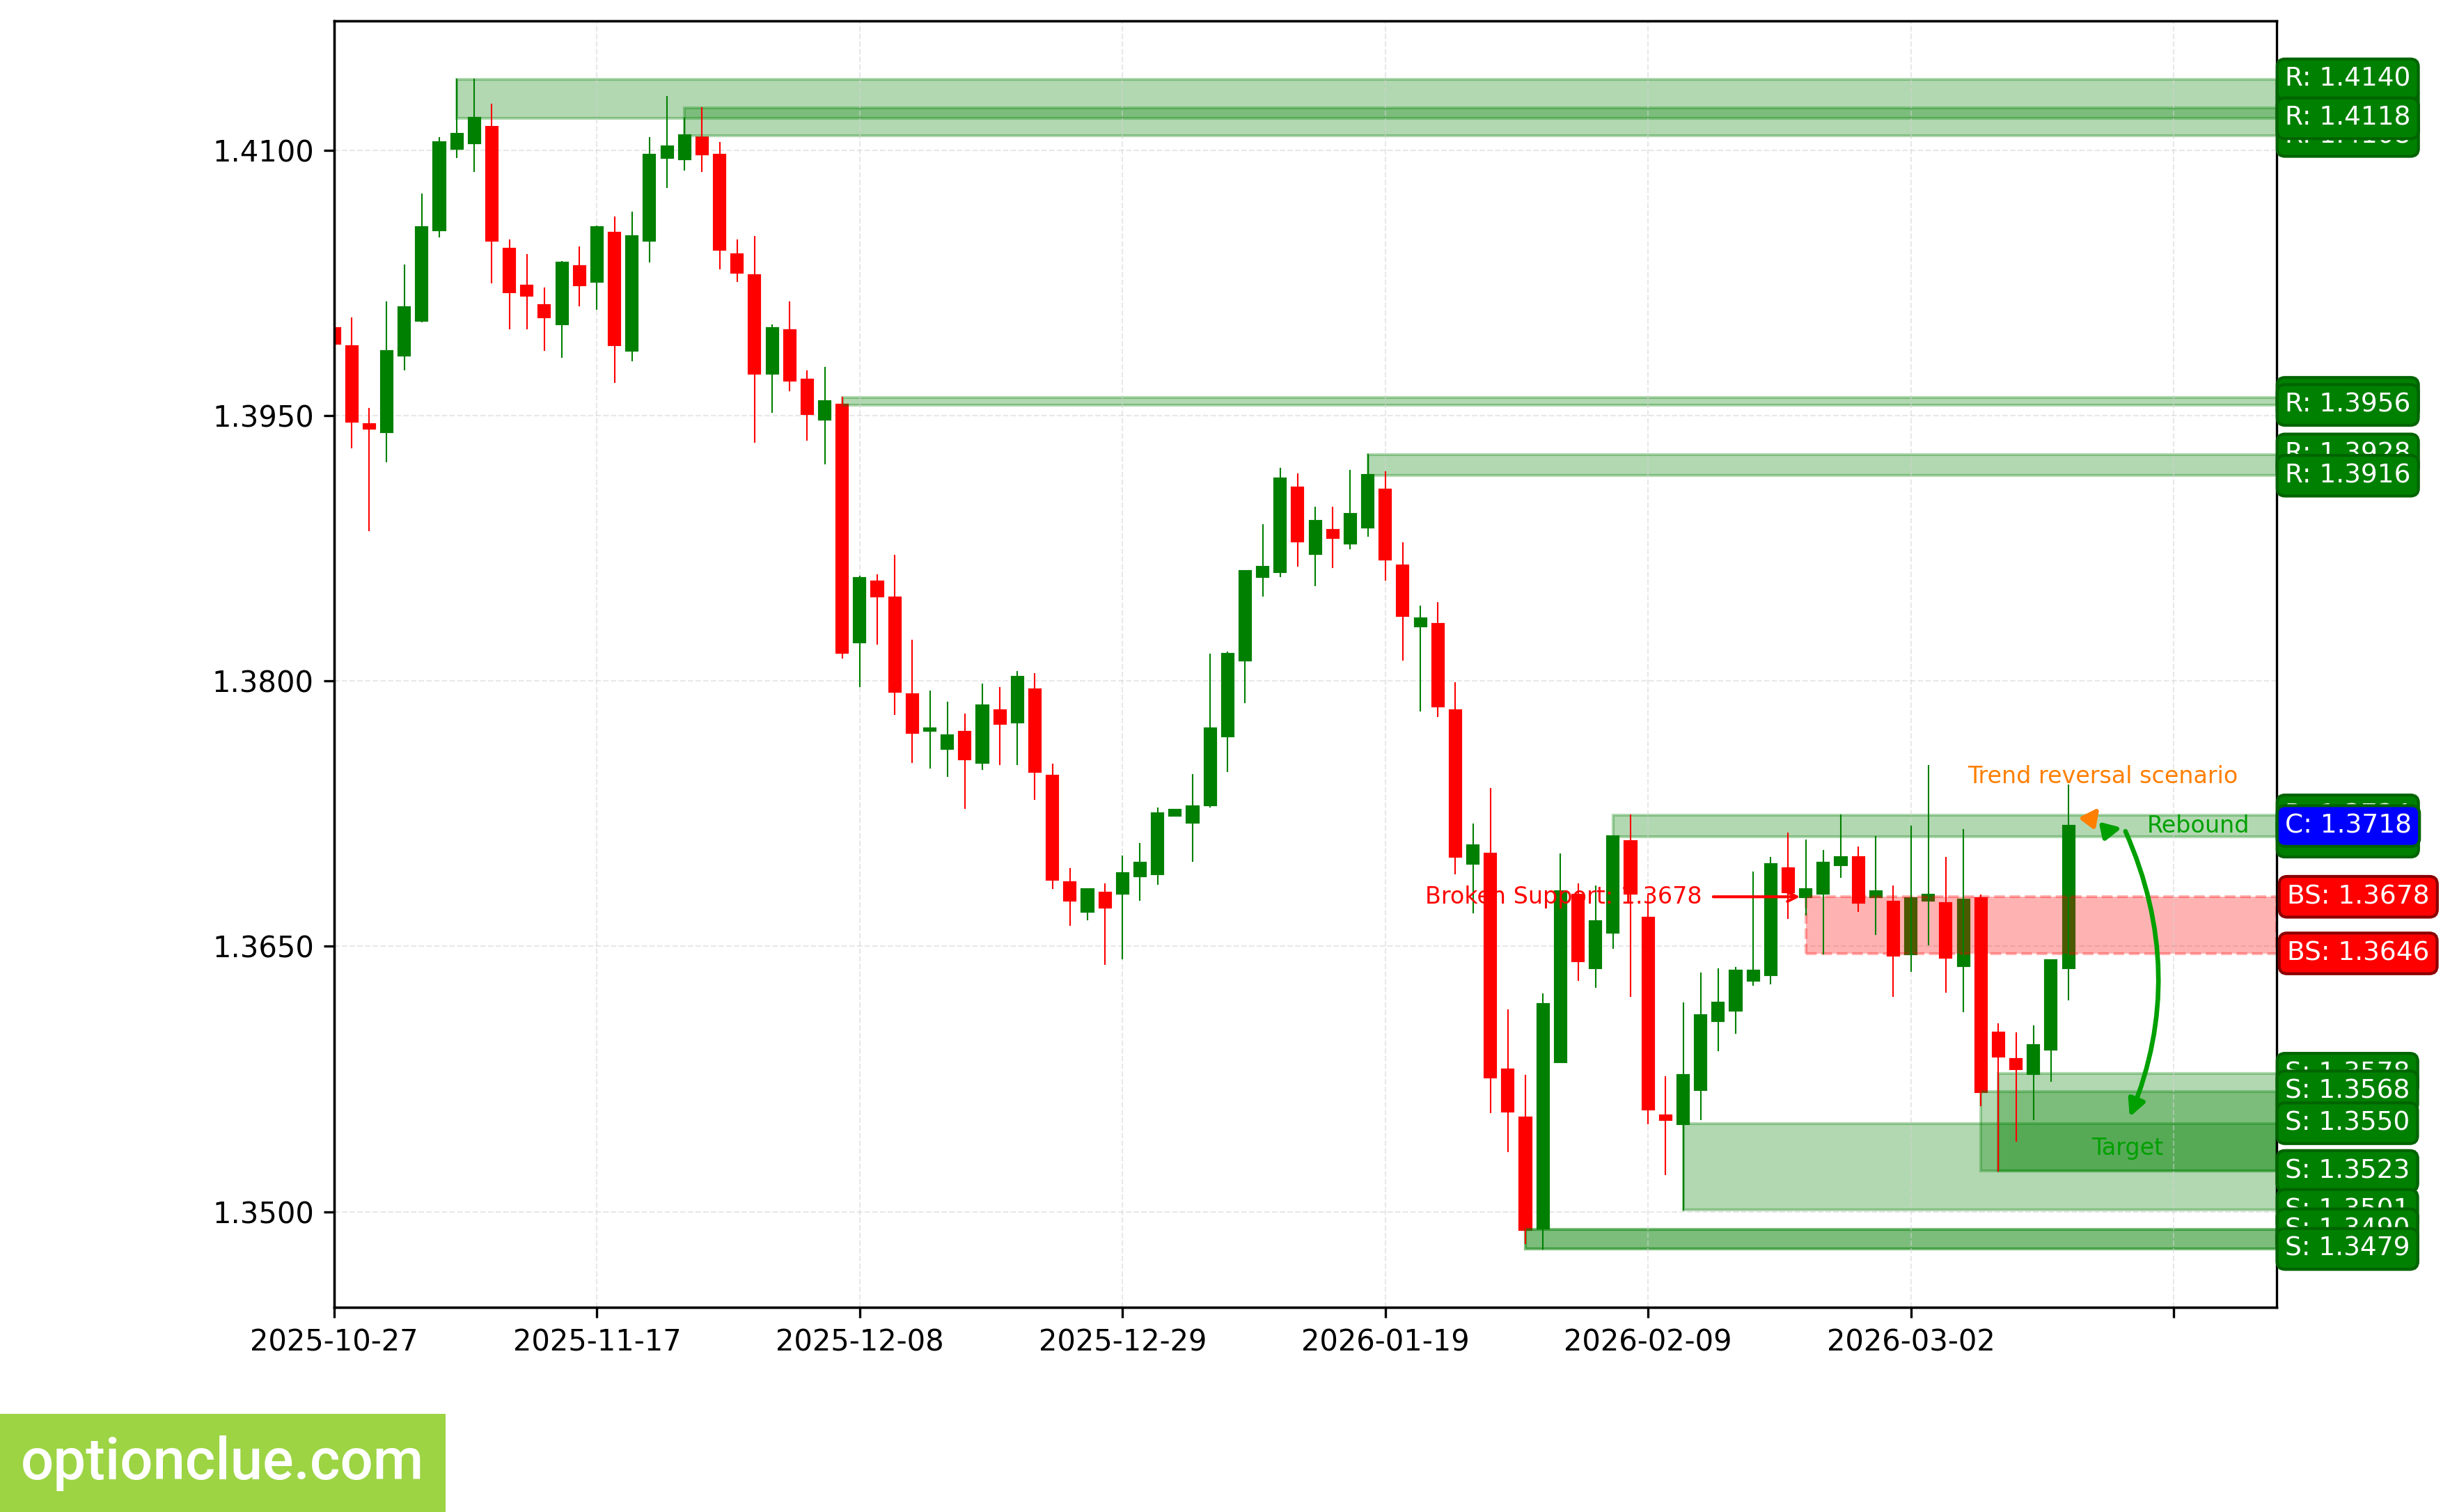
USDCAD. Technical analysis. D1.
Australian Dollar (AUDUSD)
The trend has changed to bullish when the resistance level (0.7124 — 0.7138) was broken 3 candlesticks ago. A corrective wave is developing. A buy entry point on bounce may form after the current correction completes.
The intermediate target for the upward movement is the resistance level with boundaries 0.7152 — 0.7189.
The potential profit/risk ratio from current prices when setting targets and fixing risks based on daily timeframe levels may be around 1.3:1. If the correction completes near the support level (0.6954 — 0.6998), the potential profit/risk ratio may be around 1.3:1.
Long positions will remain relevant as long as the market is above the nearest support level with boundaries 0.6954 — 0.6998. If the market successfully settles below this support, the trend will reverse to the opposite (bearish).
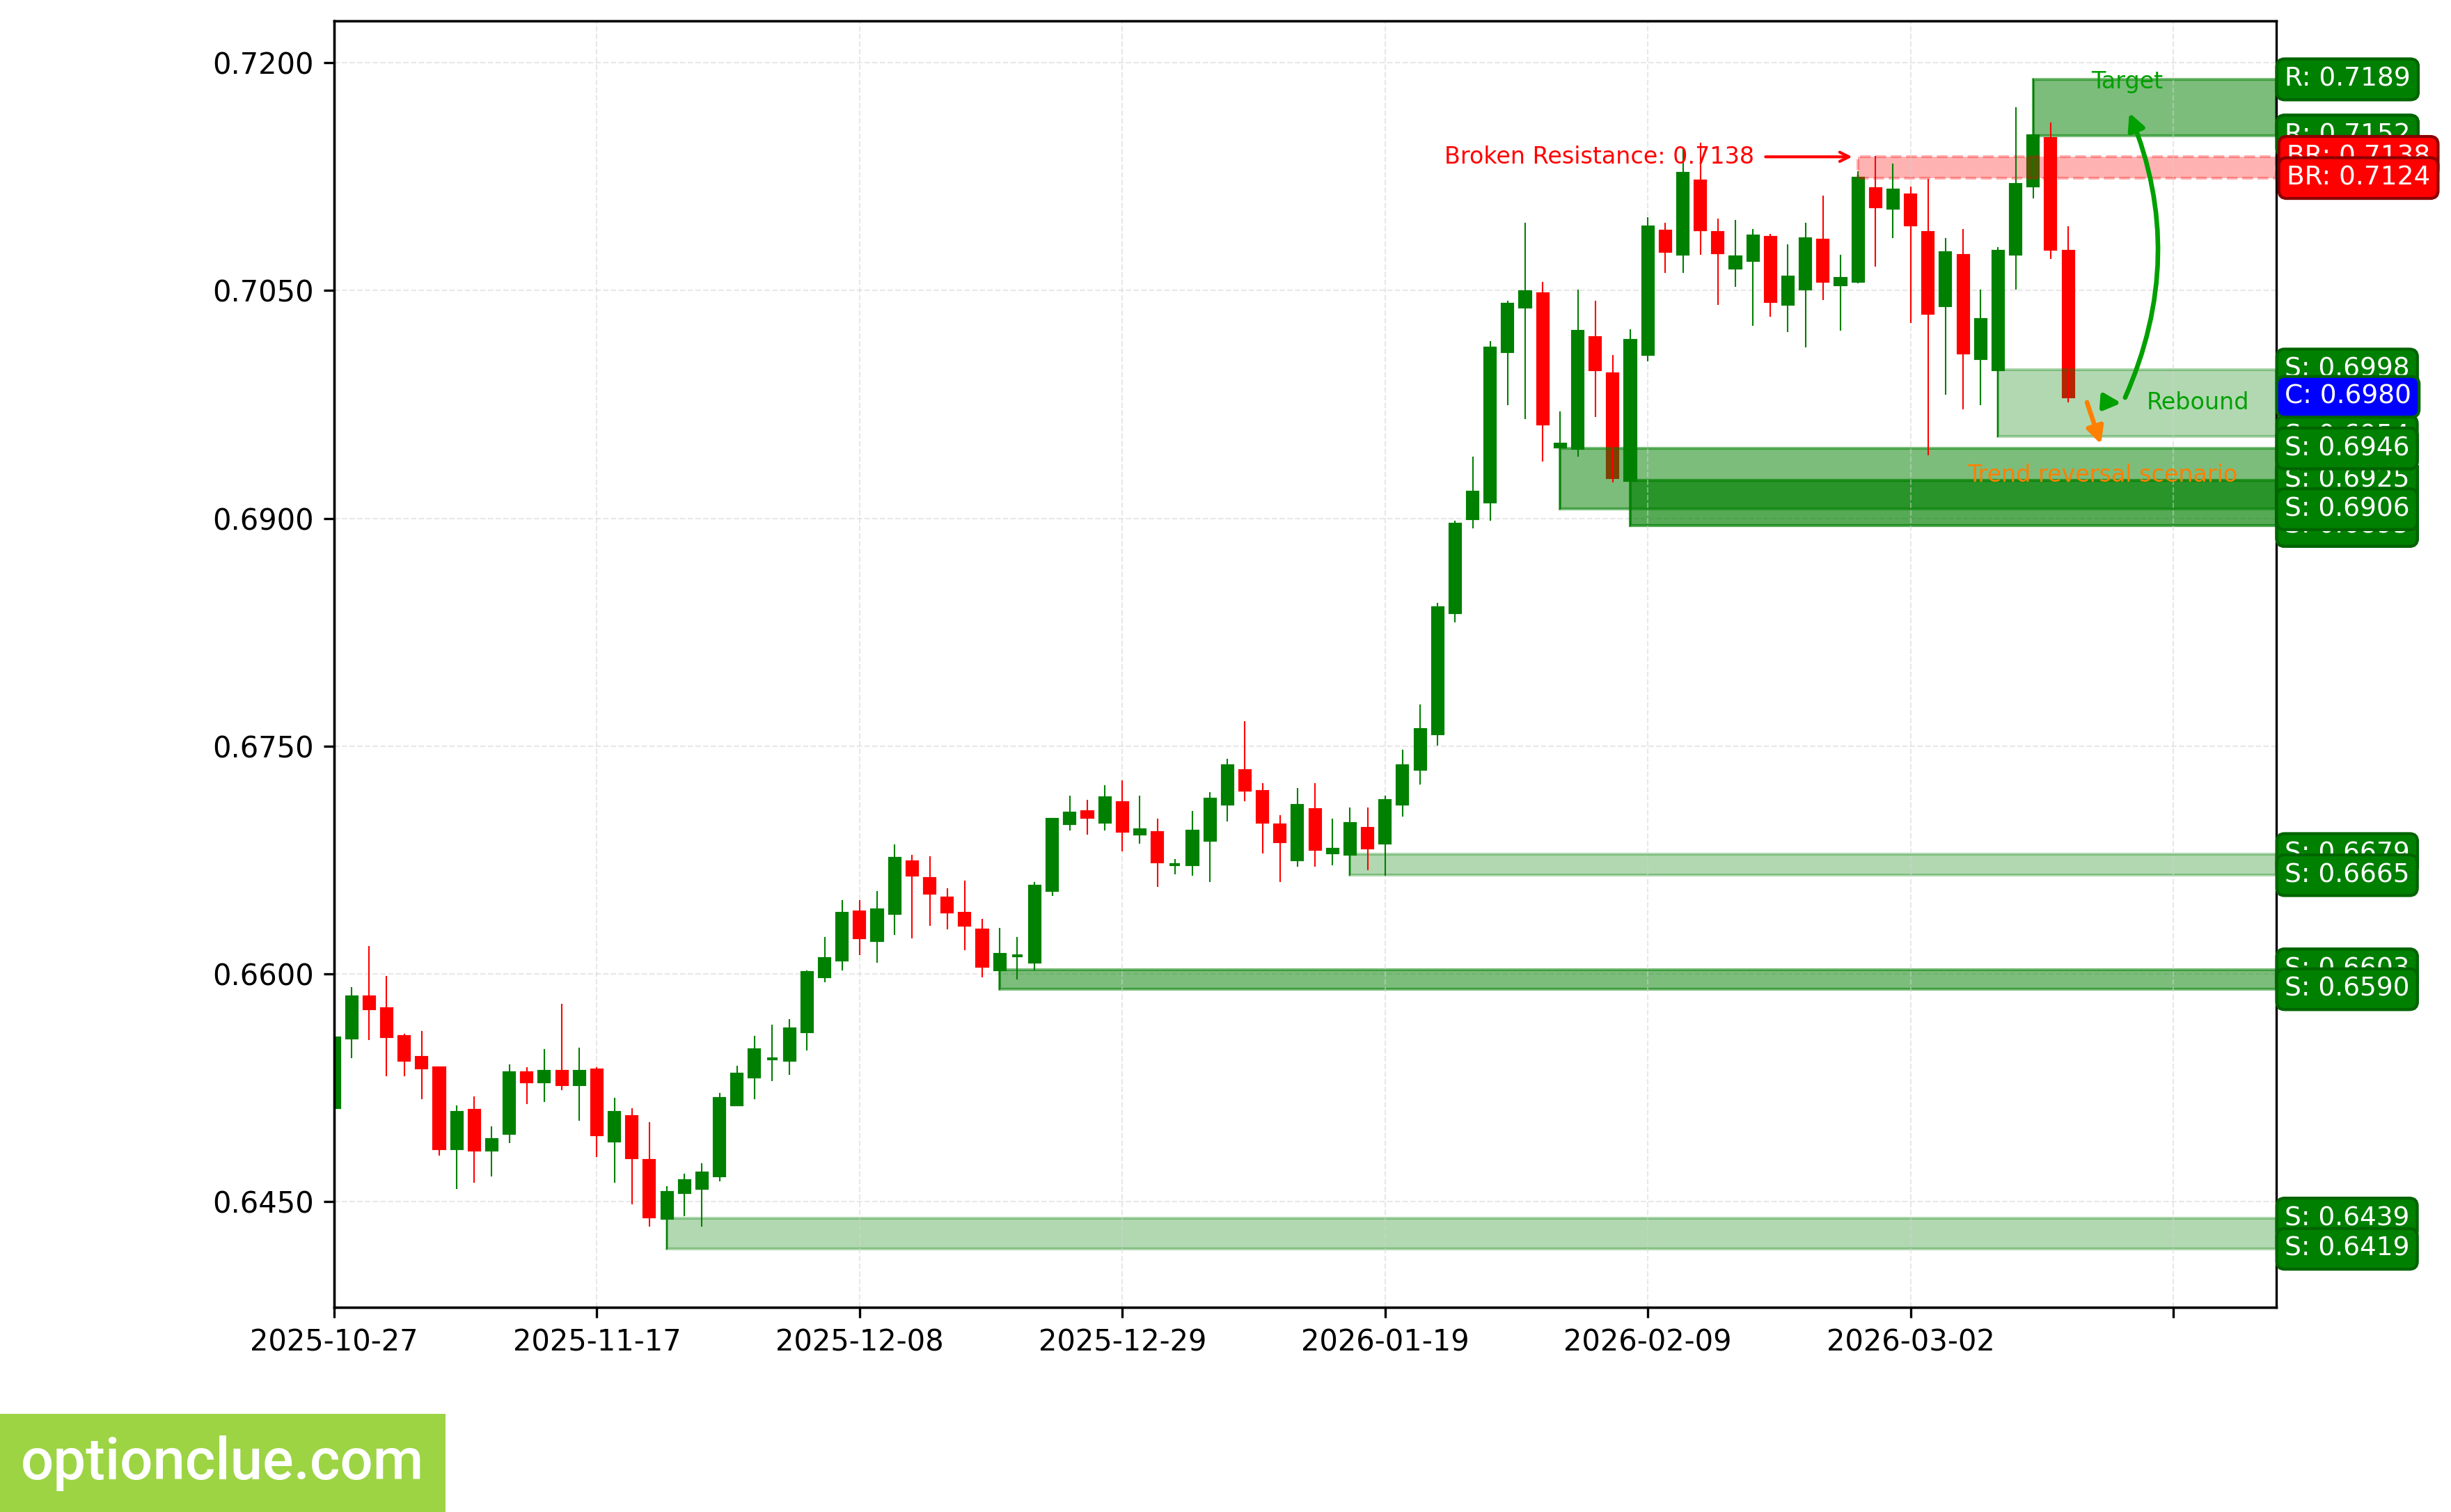
AUDUSD. Technical analysis. D1.
Bitcoin (BTC)
The bullish trend continues, 4 candlesticks ago the correction completed and a buy entry point formed on bounce, an impulse wave is developing. The last broken level is resistance (67960 — 69954). The breakout occurred 9 candlesticks ago.
The intermediate target for the upward movement is the resistance level with boundaries 72713 — 74052. In case of successful trend development, a farther target will be at the resistance level with boundaries 89185 — 90439.
The potential profit/risk ratio from current prices when setting targets and fixing risks based on daily timeframe levels may be small (approximately 0.3:1). When using a farther target — approximately 2:1.
Long positions will remain relevant as long as the market is above the nearest support level with boundaries 65639 — 65970. If the market successfully settles below this support, the trend will reverse to the opposite (bearish).
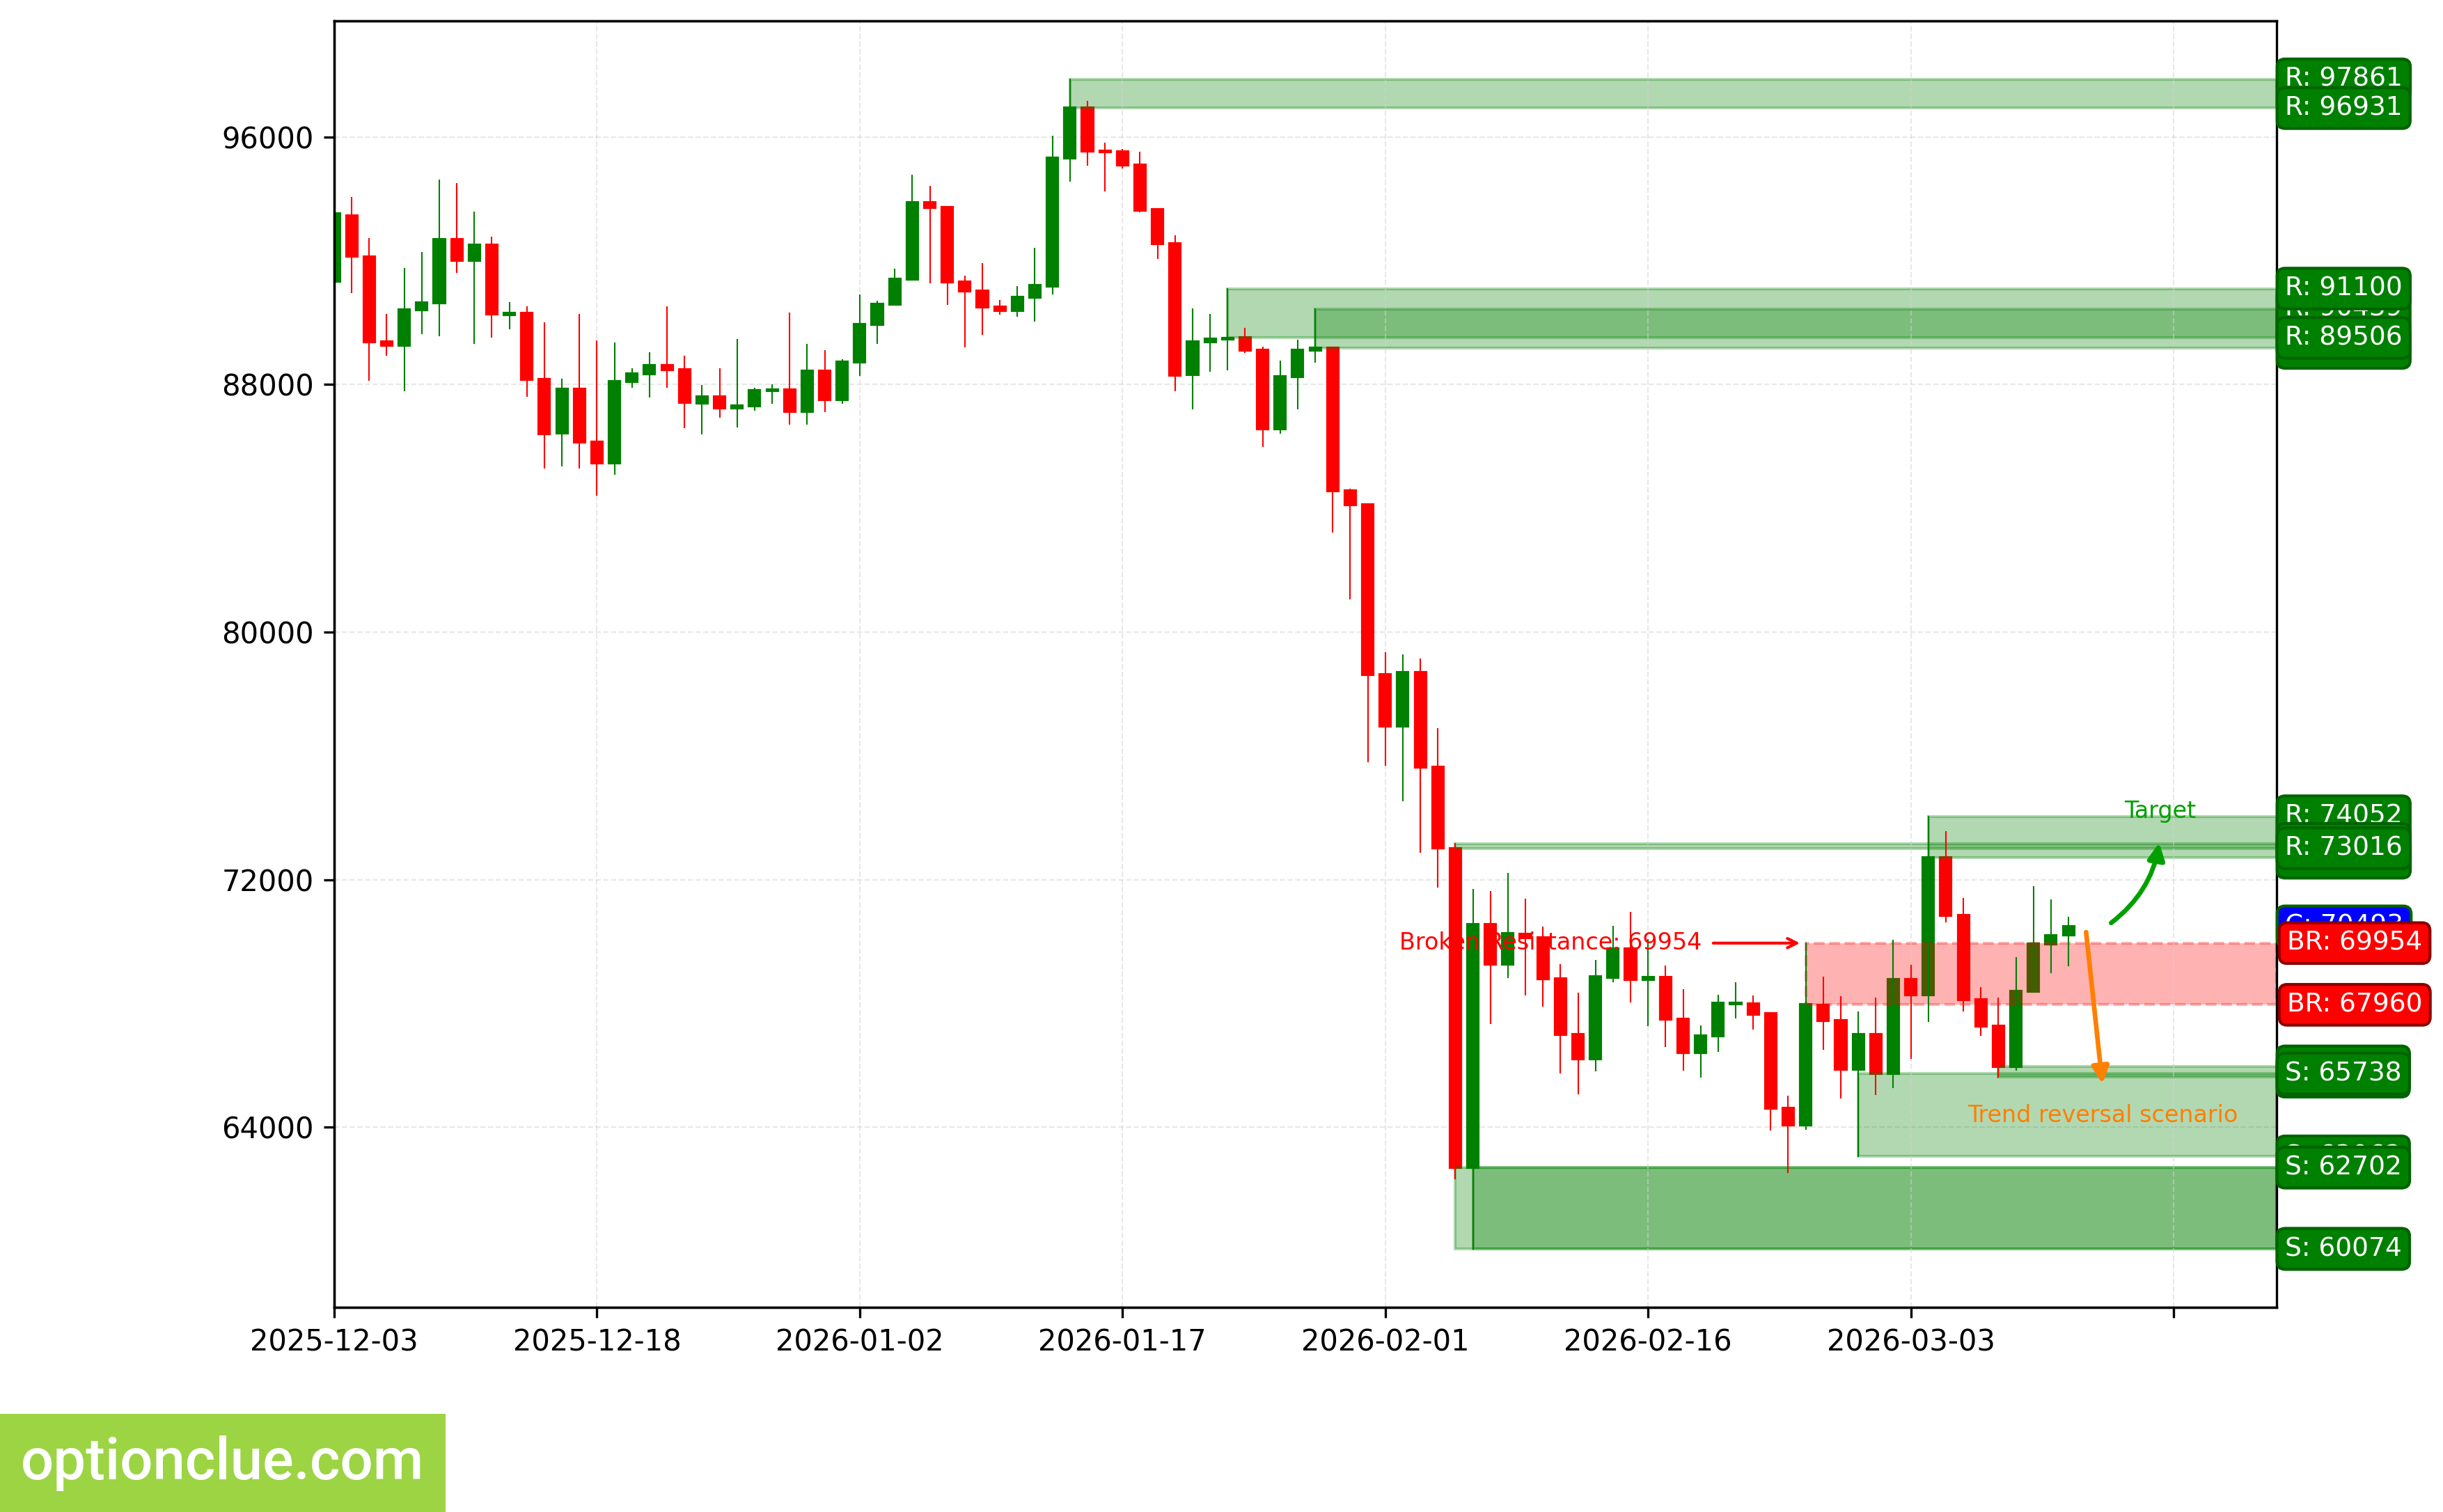
BTC. Technical analysis. D1.
Ether (ETH)
The bullish trend continues, 4 candlesticks ago the correction completed and a buy entry point formed on bounce, an impulse wave is developing. The last broken level is resistance (1974 — 1995). The breakout occurred 16 candlesticks ago.
The intermediate target for the upward movement is the resistance level with boundaries 2127 — 2199. In case of successful trend development, a farther target will be at the resistance level with boundaries 3022 — 3041.
The potential profit/risk ratio from current prices when setting targets and fixing risks based on daily timeframe levels may be small (around 0.2:1). When using a farther target — around 3:1.
Long positions will remain relevant as long as the market is above the nearest support level with boundaries 1915 — 1937. If the market successfully settles below this nearest support, the trend will reverse to the opposite (bearish).
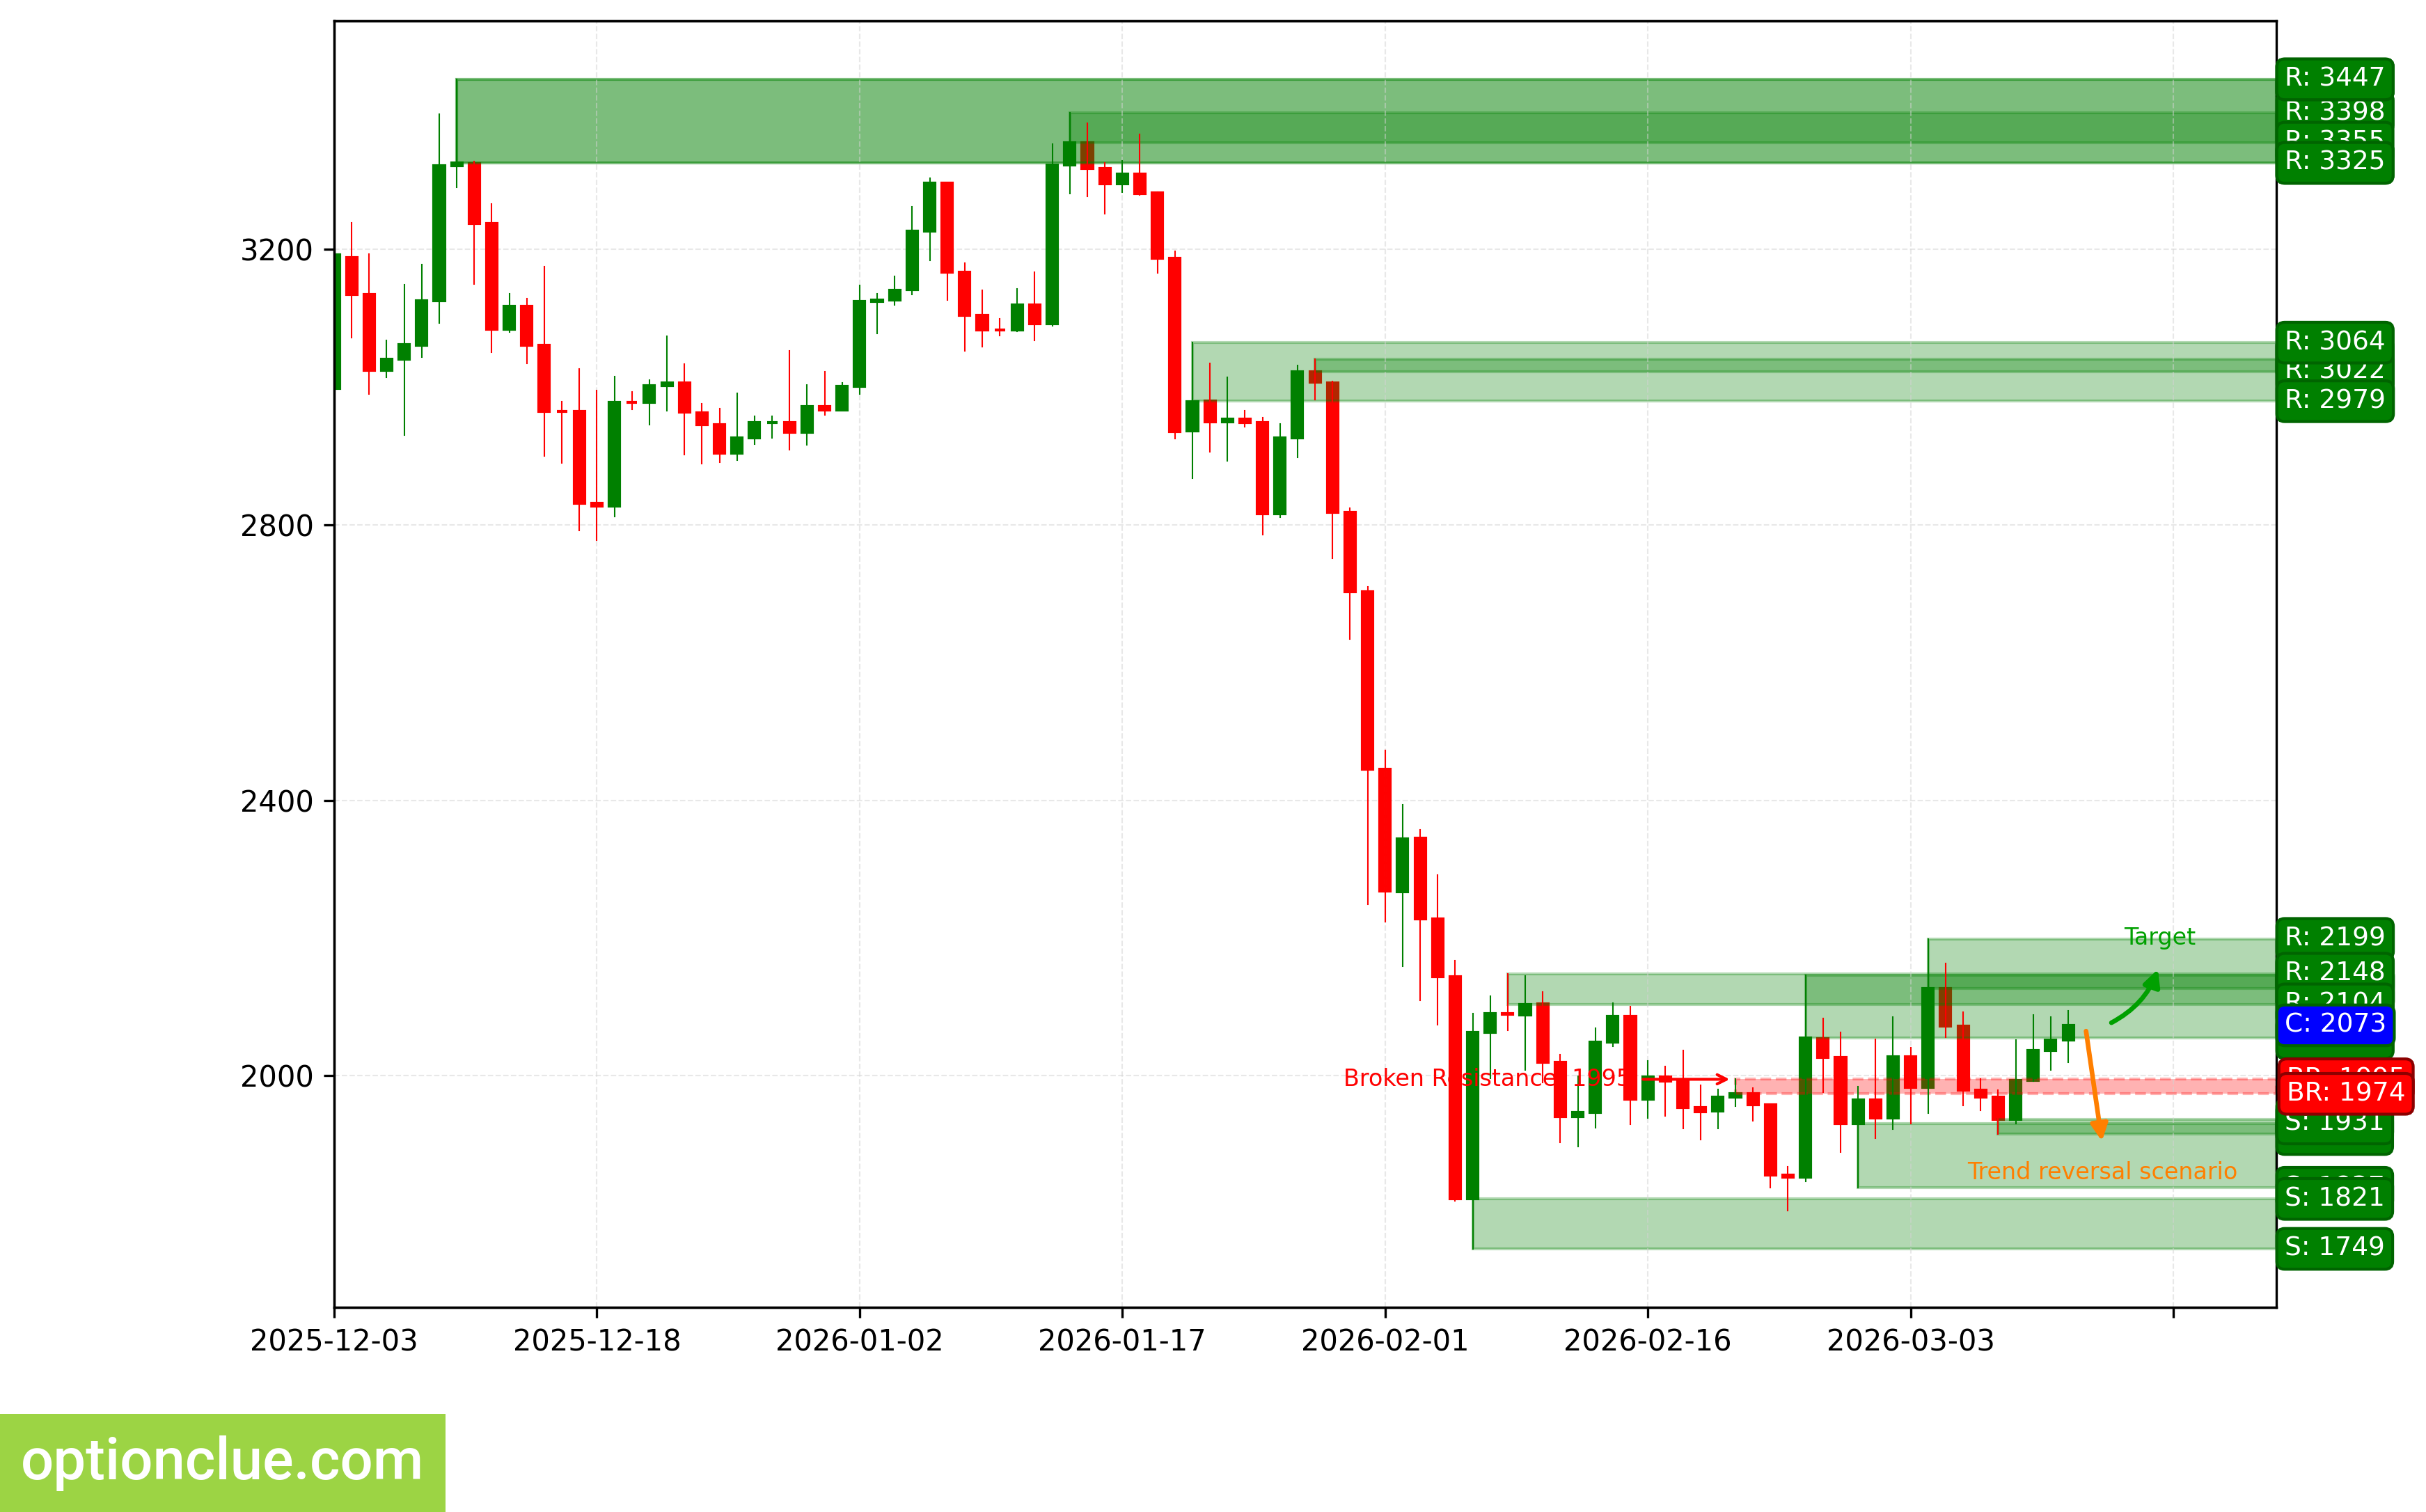
ETH. Technical analysis. D1.
Apple Inc (AAPL)
The bearish trend continues, an impulse wave is developing after the support level breakout. The last broken level is support (253.68 — 255.69). The breakout occurred on the last closed candlestick.
The intermediate target for the downward movement is the support level with boundaries 244.68 — 247.32. In case of successful trend development, a farther target will be at the support level with boundaries 225.95 — 226.79.
If the new correction completes near the resistance level (261.09 — 262.48), the potential profit/risk ratio may be approximately 2:1. When using a farther target — around 5:1. If the next correction completes near the last broken level (253.68 — 255.69), the potential profit/risk ratio may be small (approximately 0.5:1). When selecting a farther target — around 2:1.
Short positions will remain relevant as long as the market stays below the nearest resistance level with boundaries 261.09 — 262.48. If the market successfully settles above this nearest resistance, the trend will reverse to the opposite (bullish).
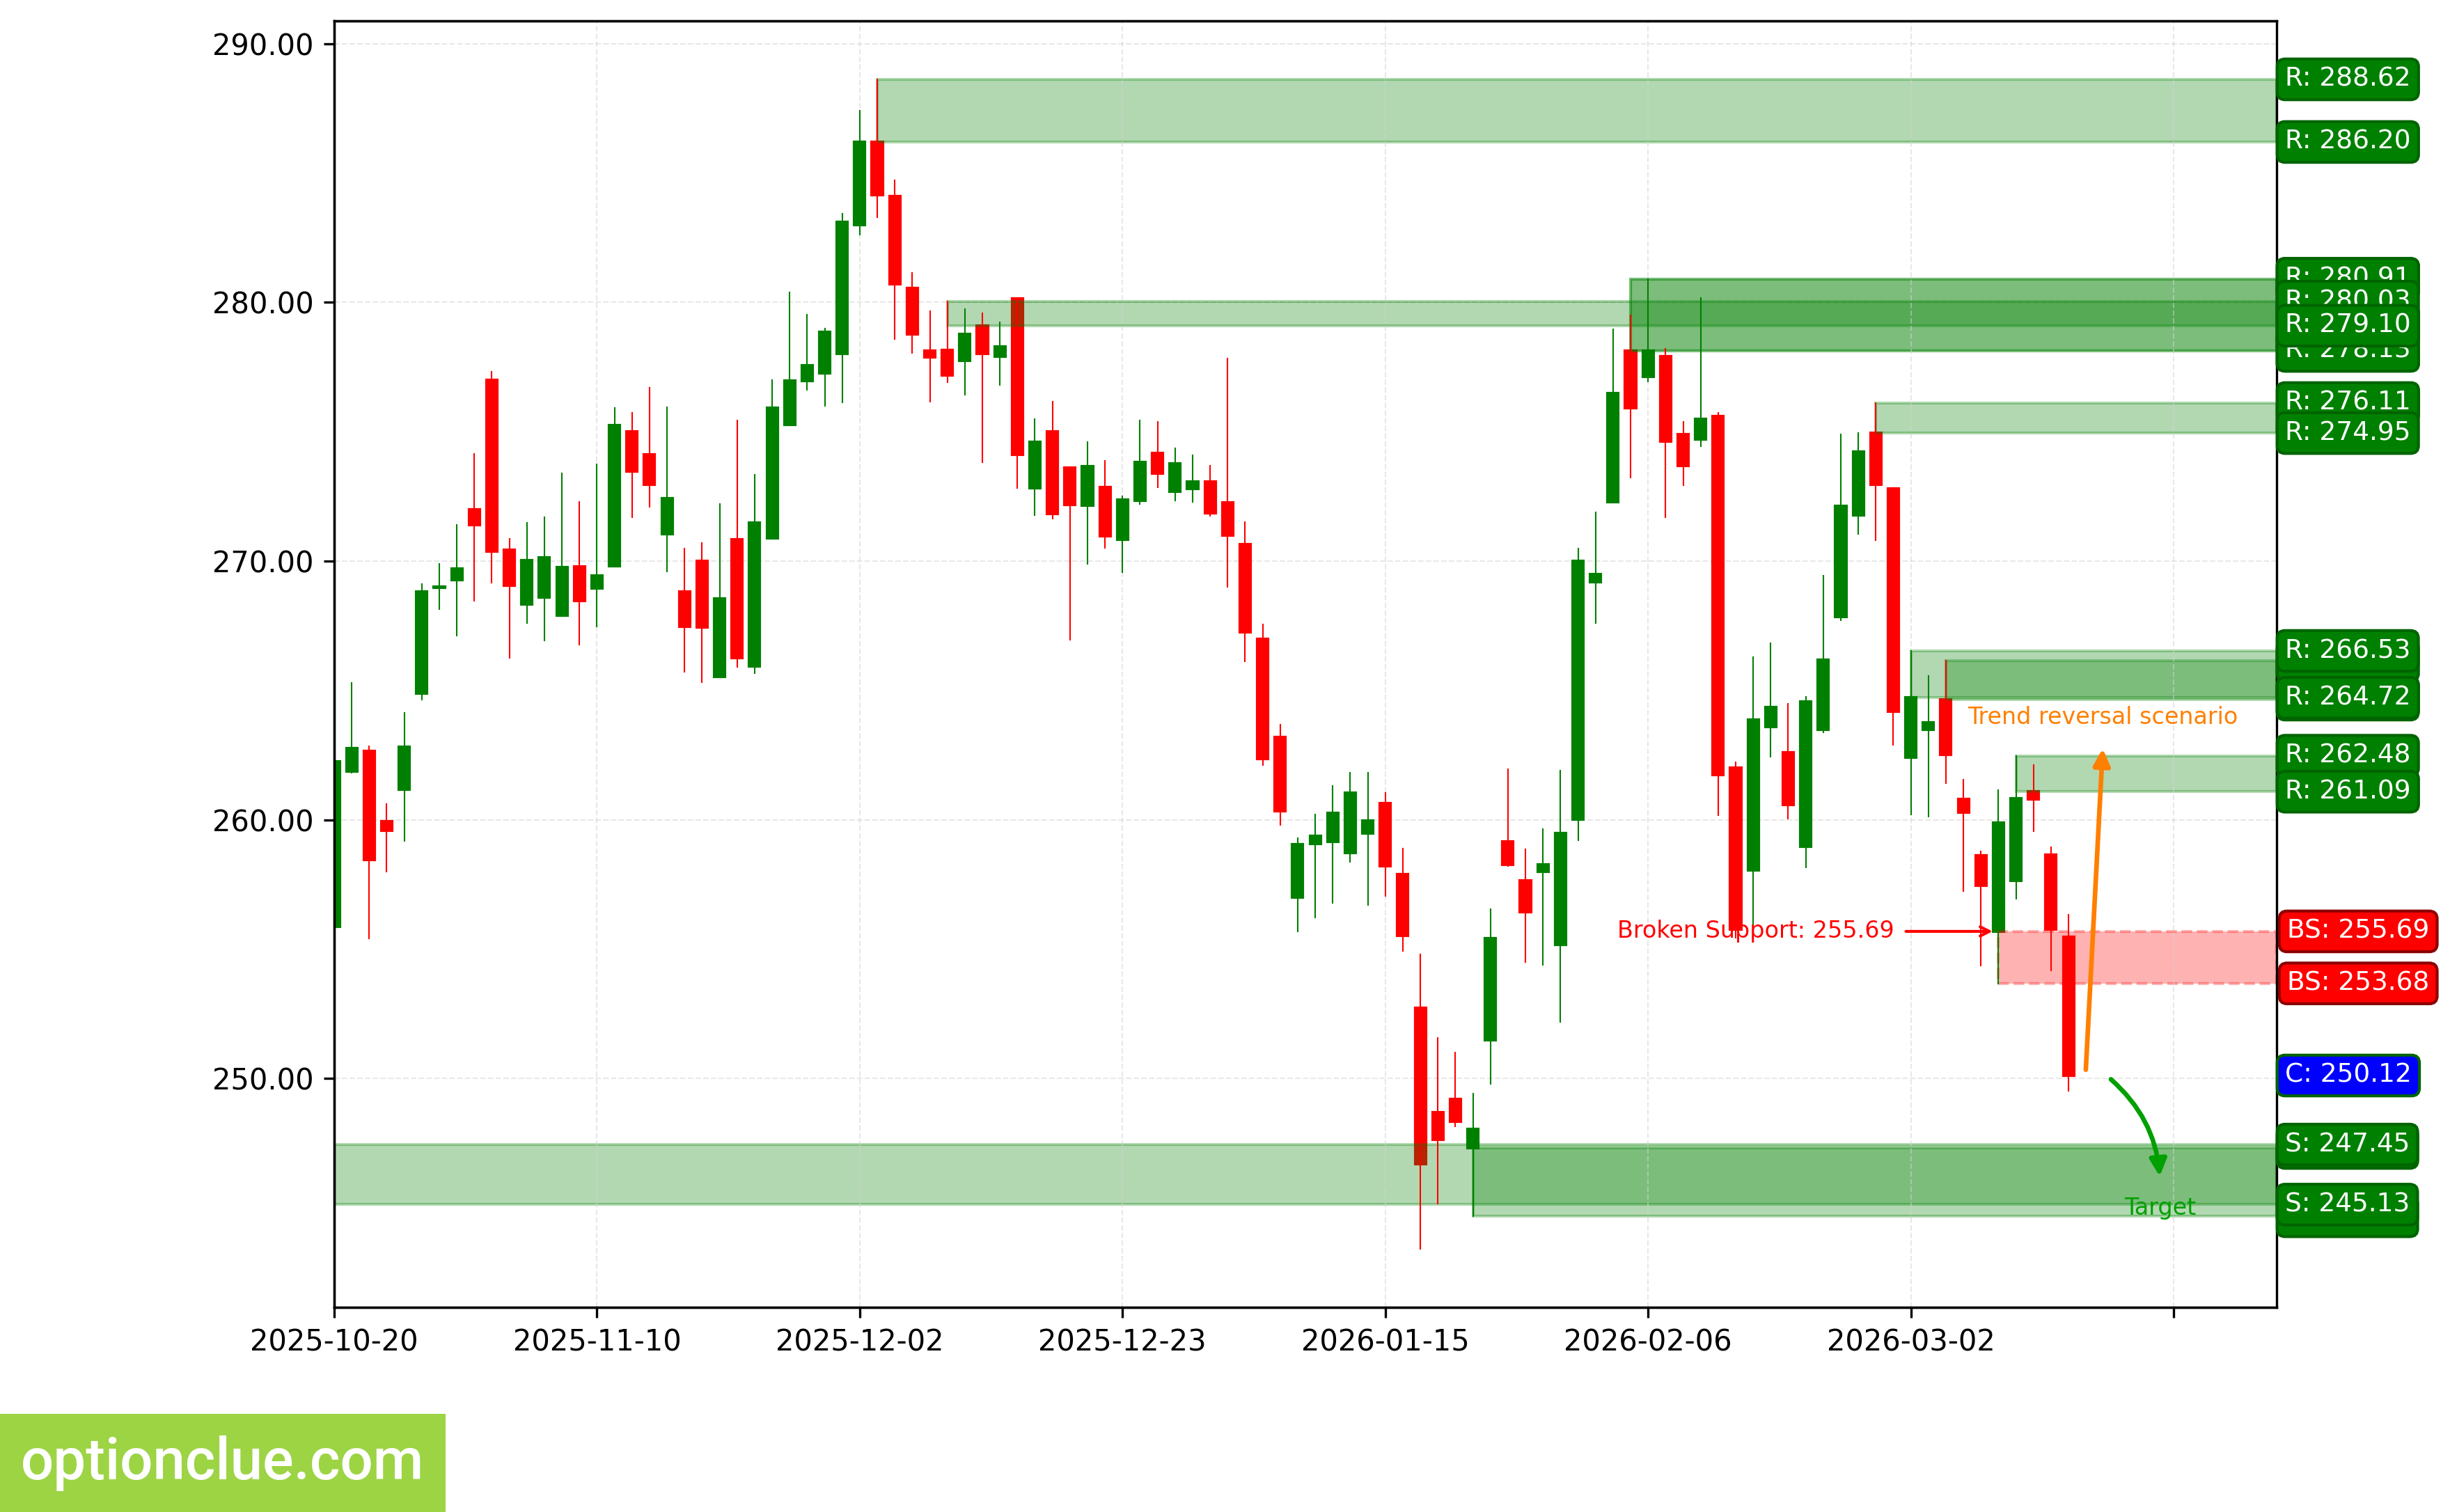
AAPL. Technical analysis. D1.
NVIDIA Corp (NVDA)
The bullish trend continues, a corrective wave is developing again. A buy entry point on bounce may form after the current correction completes. The last broken level is resistance (192.45 — 193.66). The breakout occurred 13 candlesticks ago.
The intermediate target for the upward movement is the resistance level with boundaries 186.03 — 187.62. In case of successful trend development, a farther target will be at the resistance level with boundaries 195.56 — 197.63.
If the new correction completes near the support level (174.64 — 175.01), the potential profit/risk ratio may be approximately 1.7:1. When using a farther target — around 3:1.
Long positions will remain relevant as long as the market is above the nearest support level with boundaries 174.64 — 175.01. If the market successfully settles below this support, the trend will reverse to the opposite (bearish).
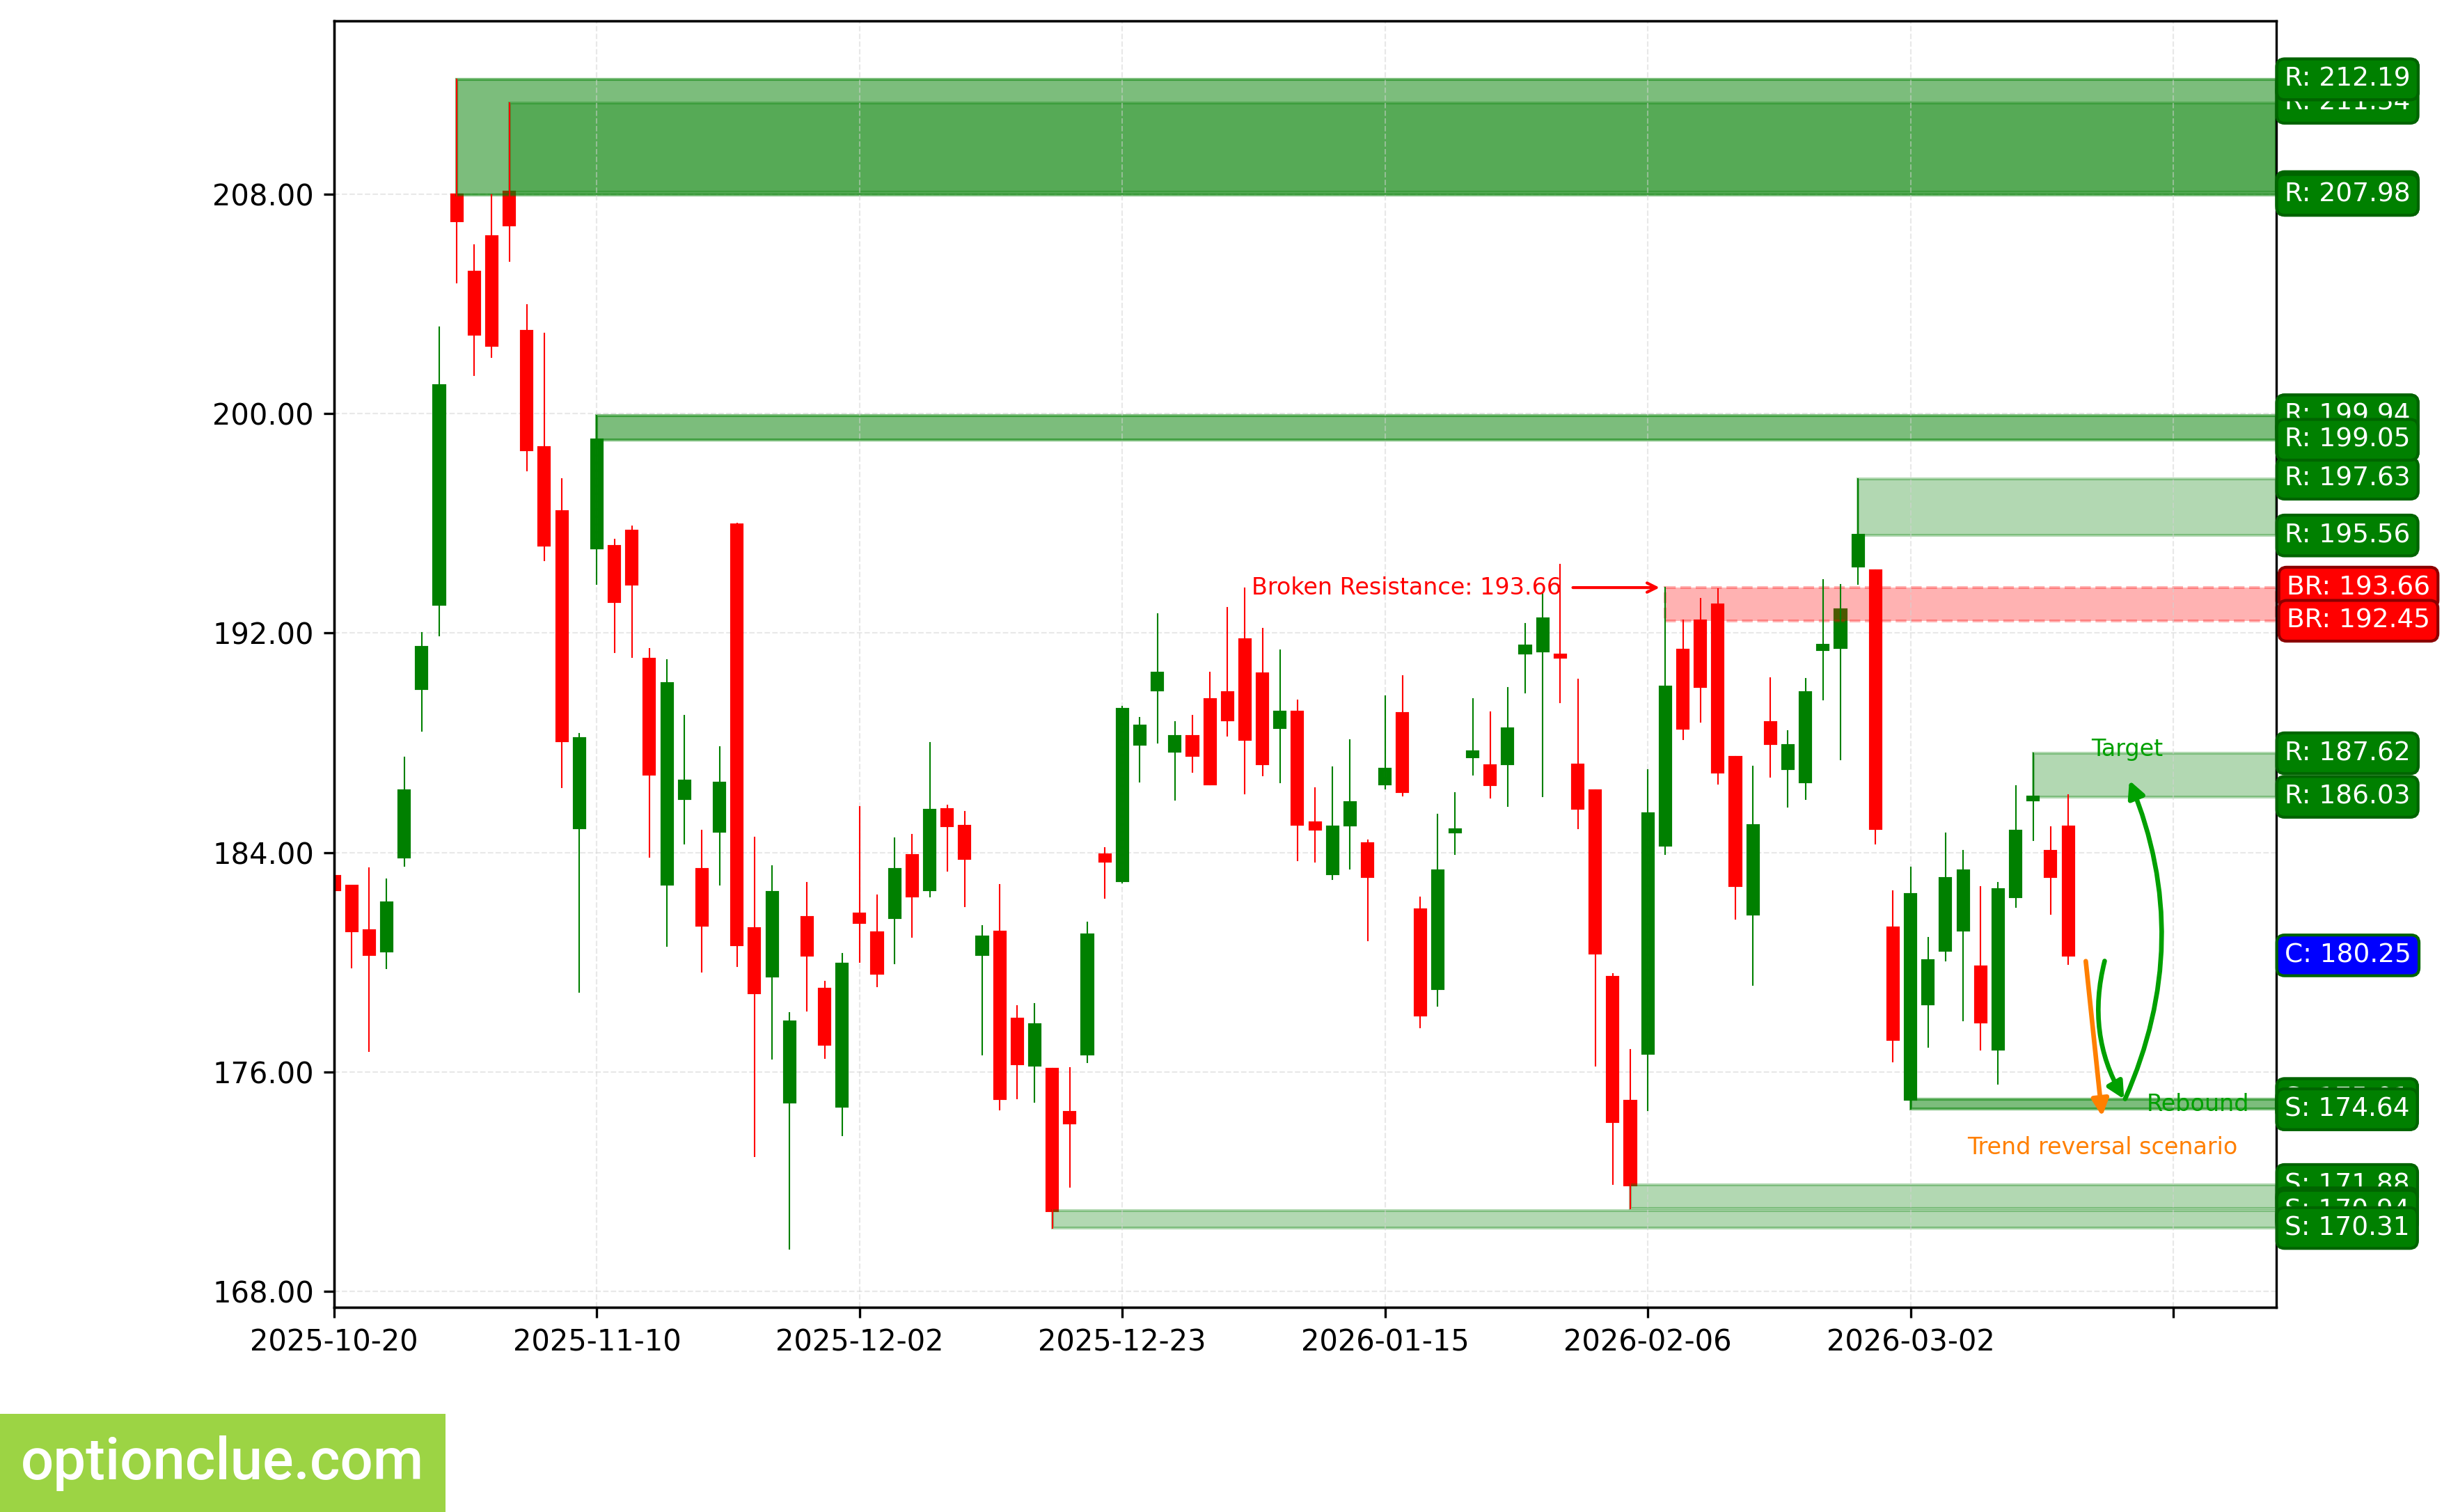
NVDA. Technical analysis. D1.
Tesla Inc (TSLA)
The bearish trend continues, 2 candlesticks ago the correction likely completed and a sell entry point formed on bounce, an impulse wave is developing. The last broken level is support (414.50 — 416.56). The breakout occurred 27 candlesticks ago.
The intermediate target for the downward movement is the support level with boundaries 381.40 — 390.05. In case of successful trend development, a farther target will be at the support level with boundaries 346.07 — 347.79.
The potential profit/risk ratio from current prices when setting targets and fixing risks based on daily timeframe levels may be less than 0.1:1. When using a farther target — around 1.1:1.
Short positions will remain relevant as long as the market stays below the nearest resistance level with boundaries 407.82 — 416.38. If the market successfully settles above this nearest resistance, the trend will reverse to the opposite (bullish).
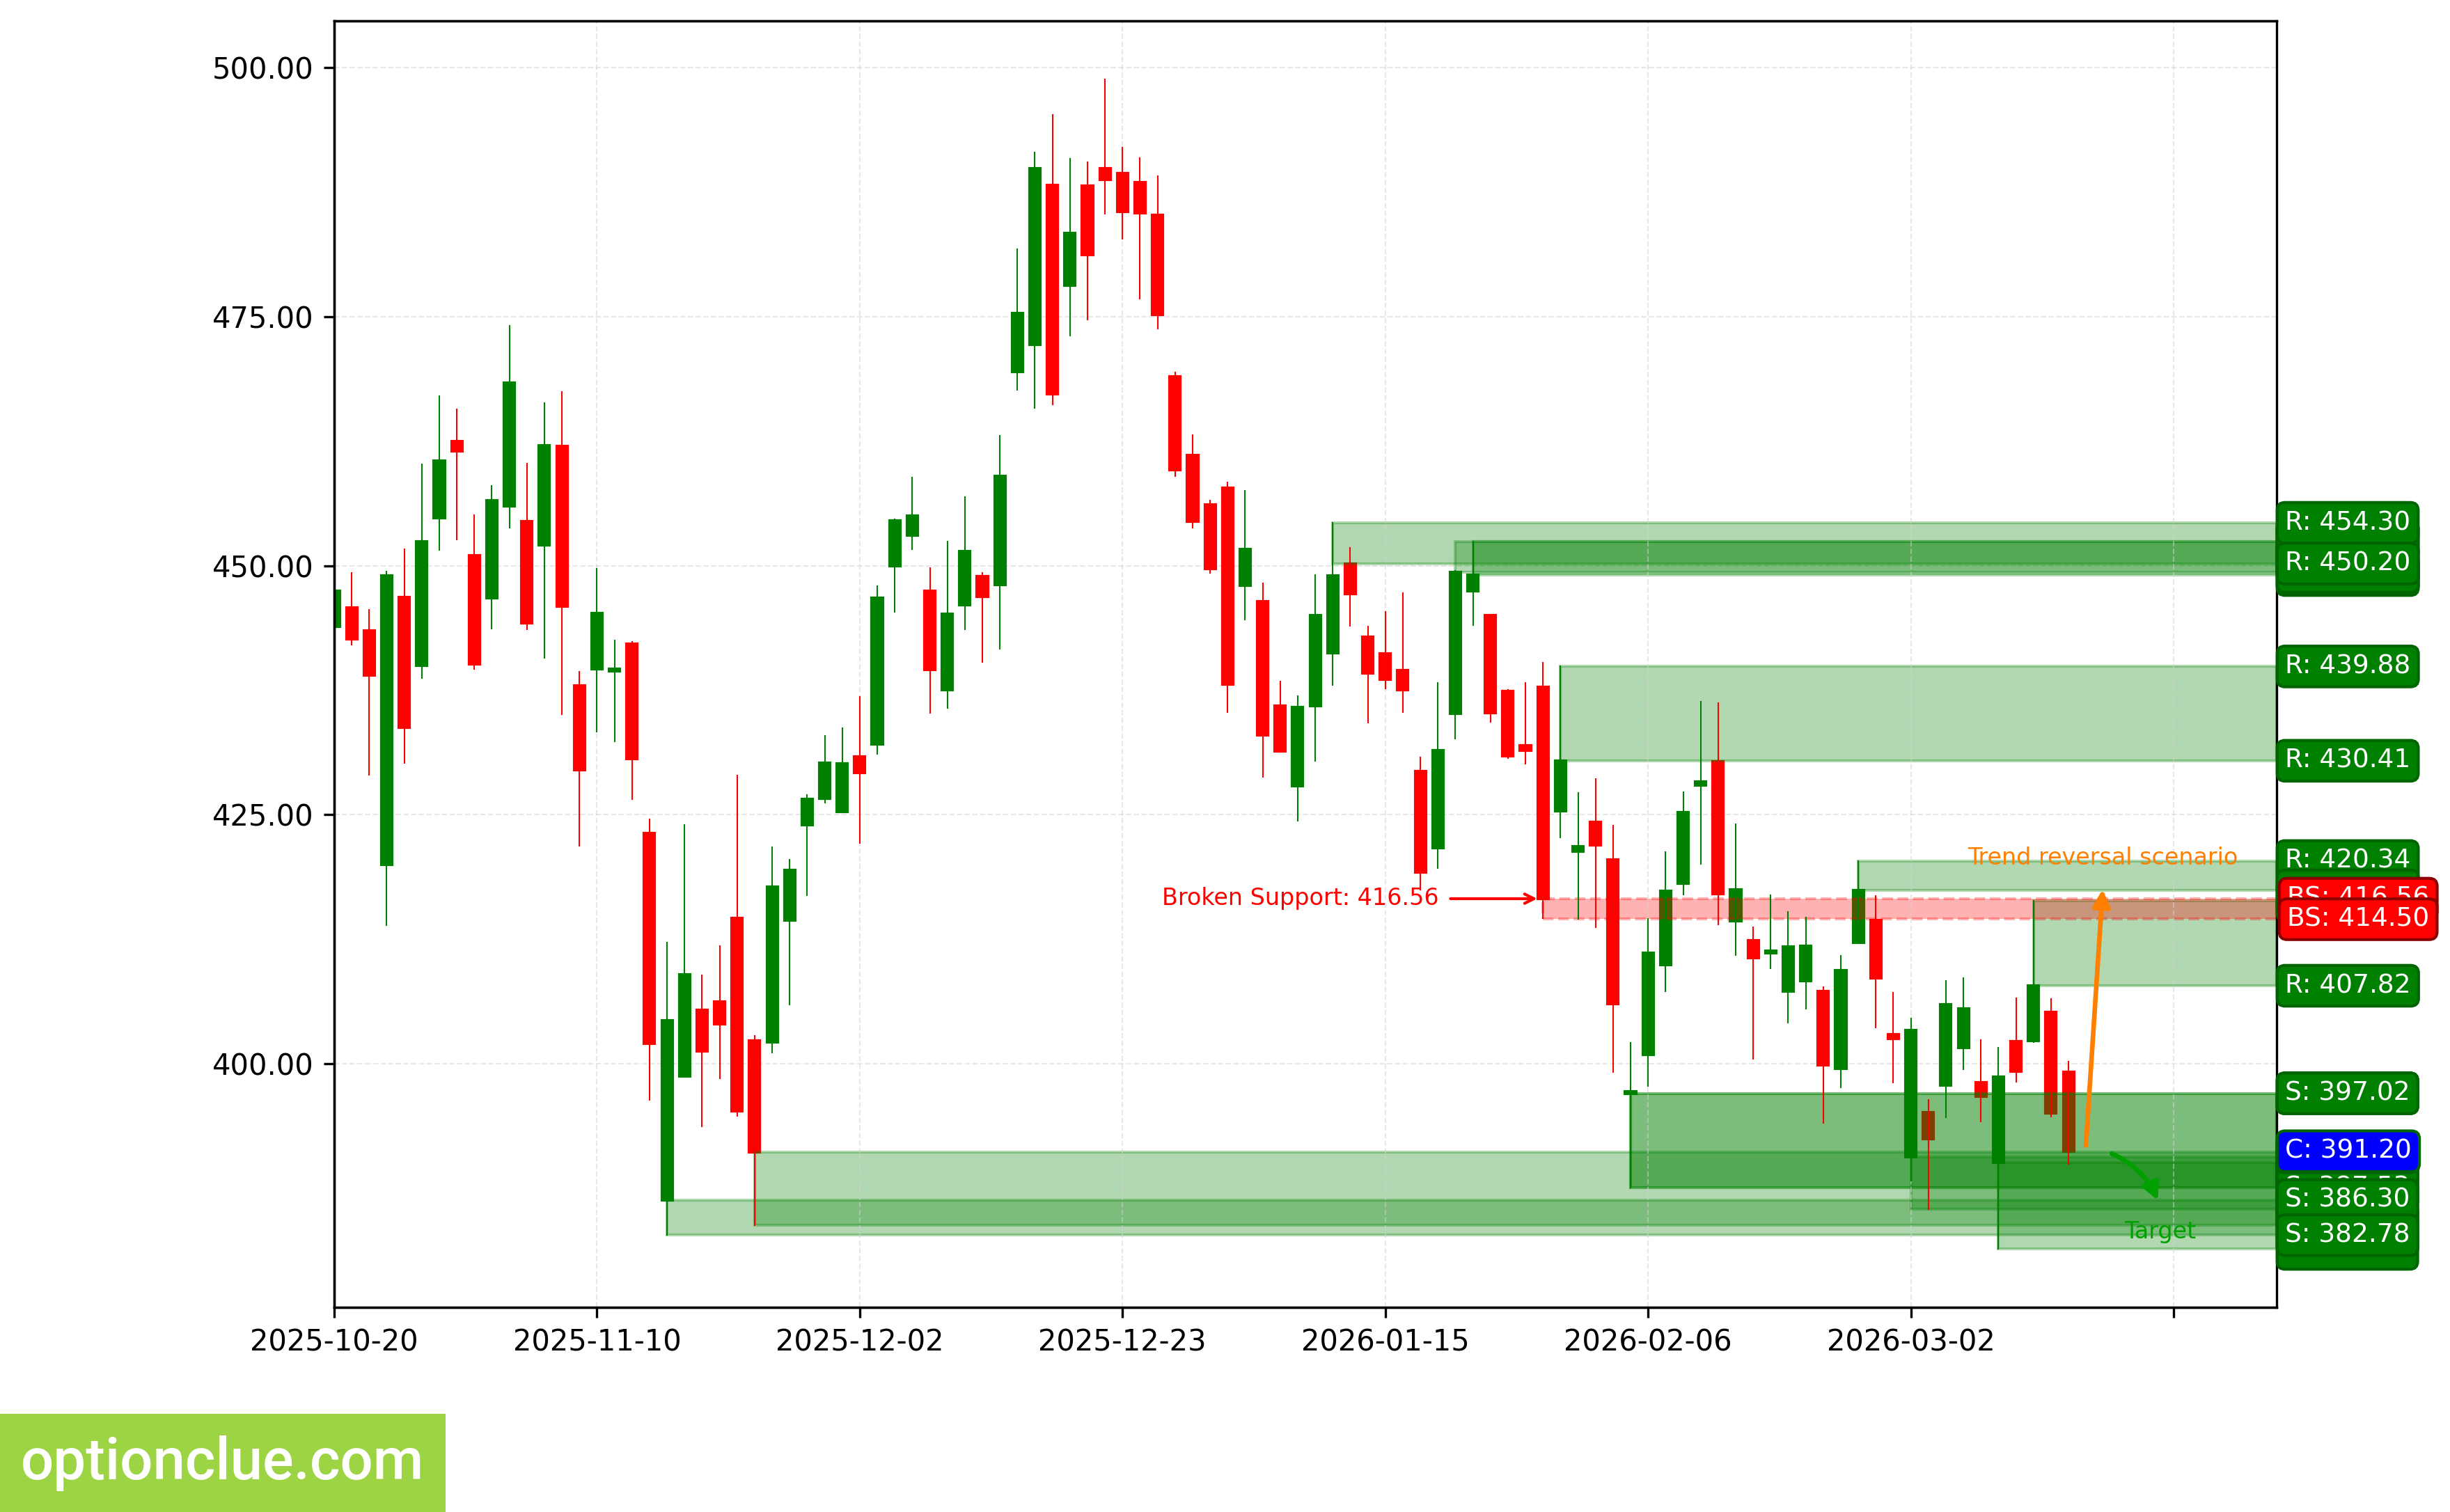
TSLA. Technical analysis. D1.
Summary
From the perspective of medium-term trading, financial instruments with correction close to completion on the daily timeframe and/or potentially the most promising profit-to-risk ratios include: AUDUSD, USDCAD. Soon they may be worth attention depending on the depth of the market correction: NVDA.
The remaining financial instruments on the trading list may also be interesting, but on these markets bounce signals on the daily timeframe are likely to appear no earlier than in a week.