
Analyzing the current market situation using technical analysis, focusing on key horizontal levels and the most popular financial instruments.
Key Topics
- Euro (EURUSD)
- British Pound (GBPUSD)
- Swiss Franc (USDCHF)
- Japanese Yen (USDJPY)
- Canadian Dollar (USDCAD)
- Australian Dollar (AUDUSD)
- New Zealand Dollar (NZDUSD)
- Bitcoin (BTC)
- Ethereum (ETH)
- Apple Inc (AAPL)
- NVIDIA Corp (NVDA)
- Tesla Inc (TSLA)
- Summary
Euro (EURUSD)
The trend remains bullish, with each new low higher than the previous one. The price is testing the nearest resistance, and a new entry point for buying on a bounce will appear after a correction on the daily timeframe.
The next target is the resistance level with boundaries 1.1770 — 1.1788. If the trend develops successfully, a more distant target will be at the next resistance level with boundaries 1.1805 — 1.1829.
Buy signals will remain relevant as long as the market is above the nearest support level with boundaries 1.1606 — 1.1638.
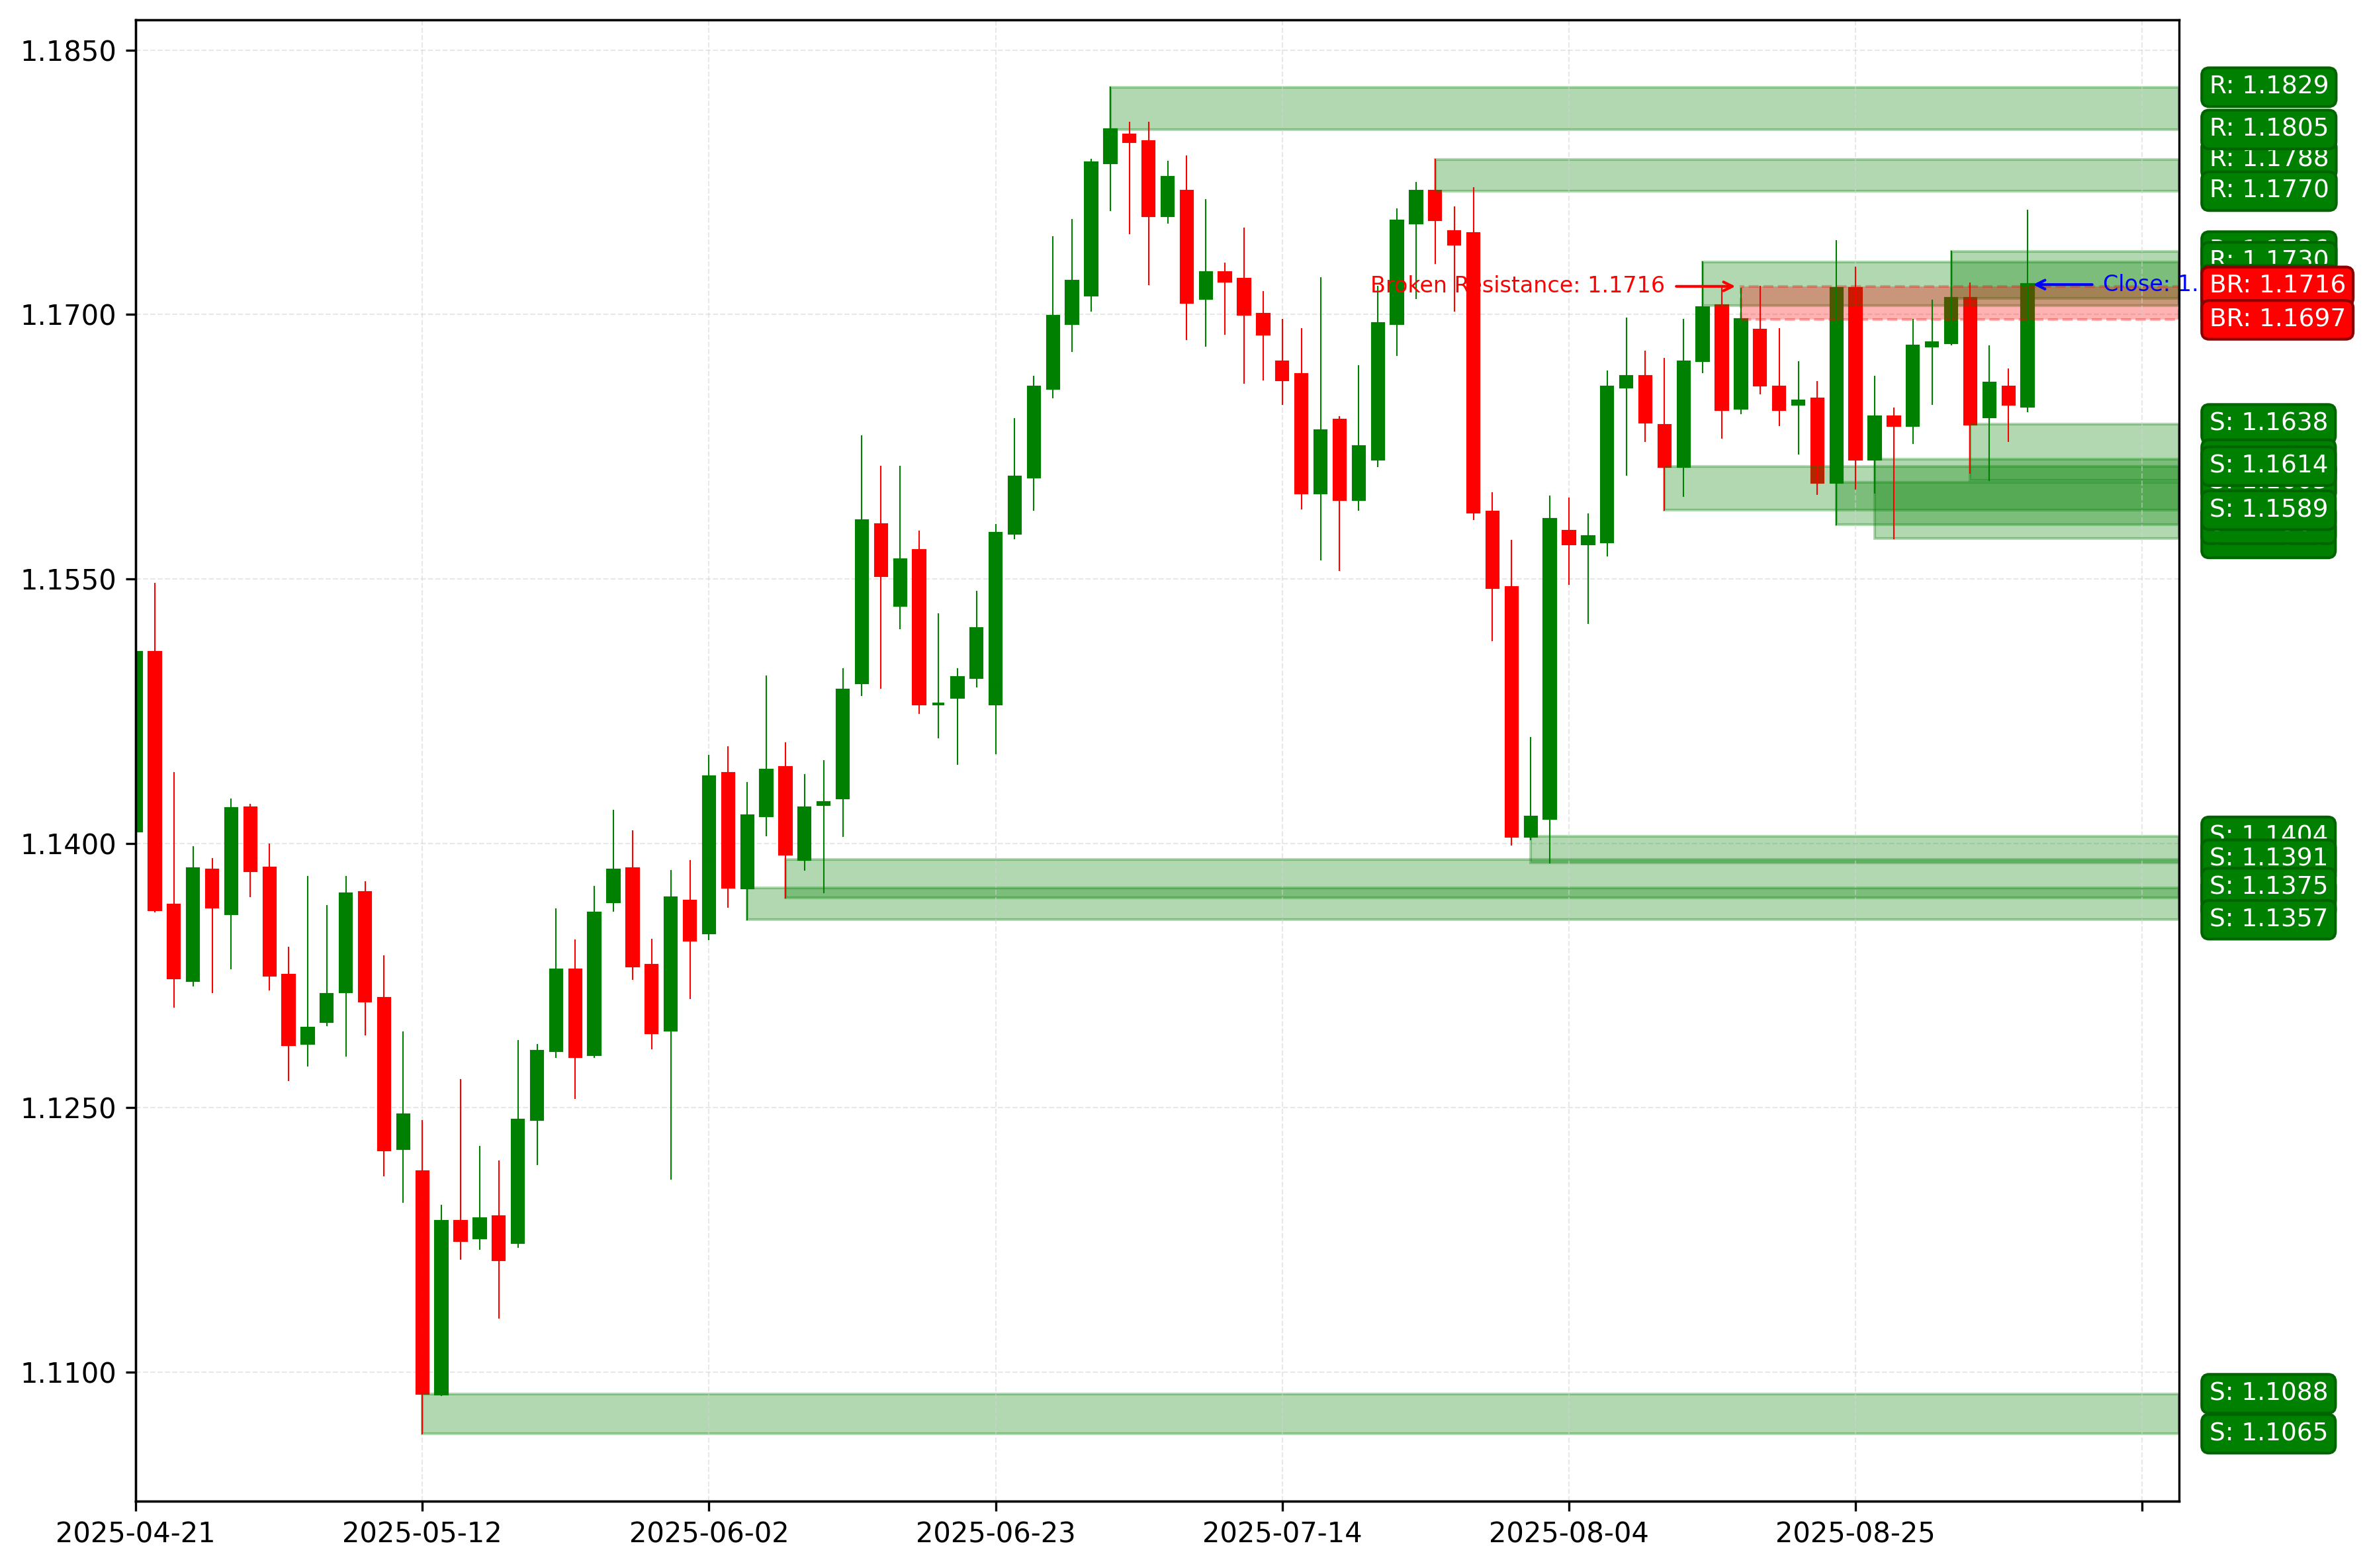
EURUSD. Technical Analysis. D1.
British Pound (GBPUSD)
The trend remains bearish, the last broken level is support (1.3414 — 1.3454). The breakout occurred 4 days ago; a correction wave is developing.
The intermediate target for the downward movement is the support level with boundaries 1.3330 — 1.3387.
If the correction completes around the resistance level (1.3543 — 1.3549), the potential profit/risk ratio could be high – around 4.
If the market successfully holds below the nearest support, this will open the way for price movement to target #2 – the support level with boundaries 1.3138 — 1.3205. Short positions will remain relevant as long as the market stays below the nearest resistance level with boundaries 1.3543 — 1.3549.
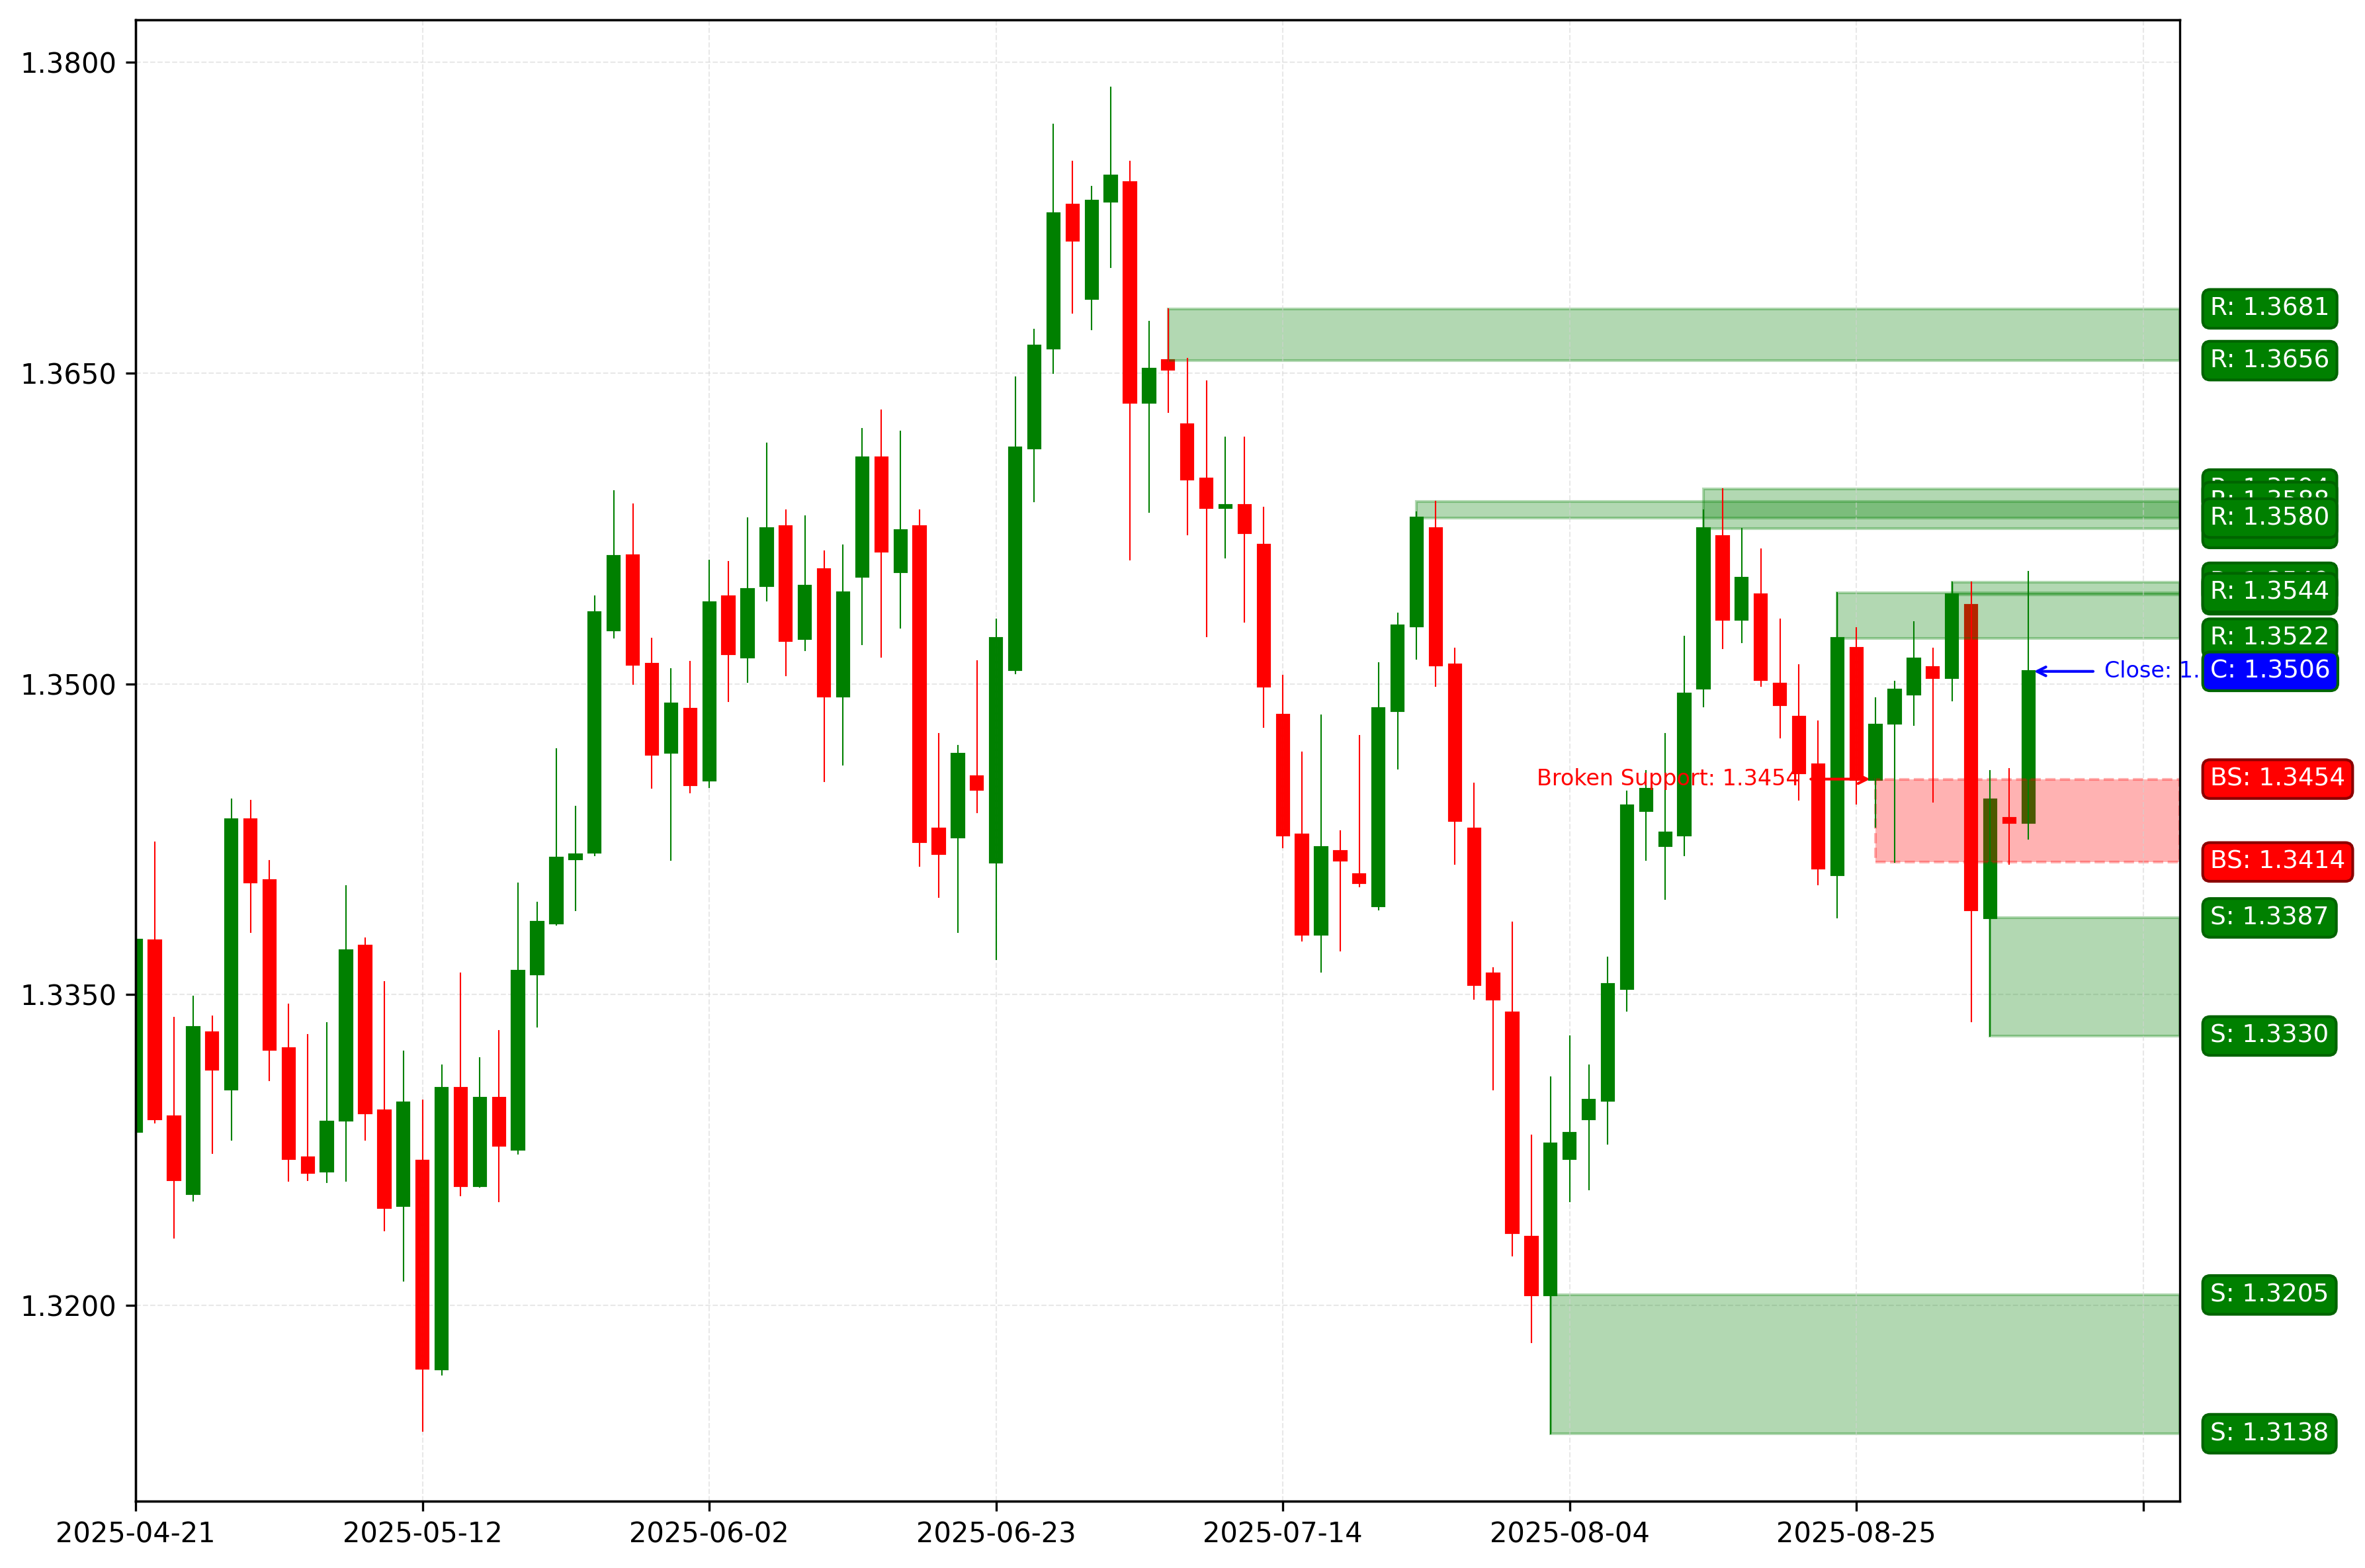
GBPUSD. Technical Analysis. D1.
Swiss Franc (USDCHF)
The market remains in a bearish trend; 2 days ago, another correction completed, and an entry point for selling on a bounce formed. An impulse wave is developing.
The last broken level is support (0.7982 — 0.7985). The breakout occurred 1 day ago.
A sell entry point on a bounce on the daily timeframe will appear after a correction.
The nearest target is the support level with boundaries 0.7869 — 0.7910. Short positions will remain relevant as long as the market is below the nearest resistance level with boundaries 0.8053 — 0.8072.
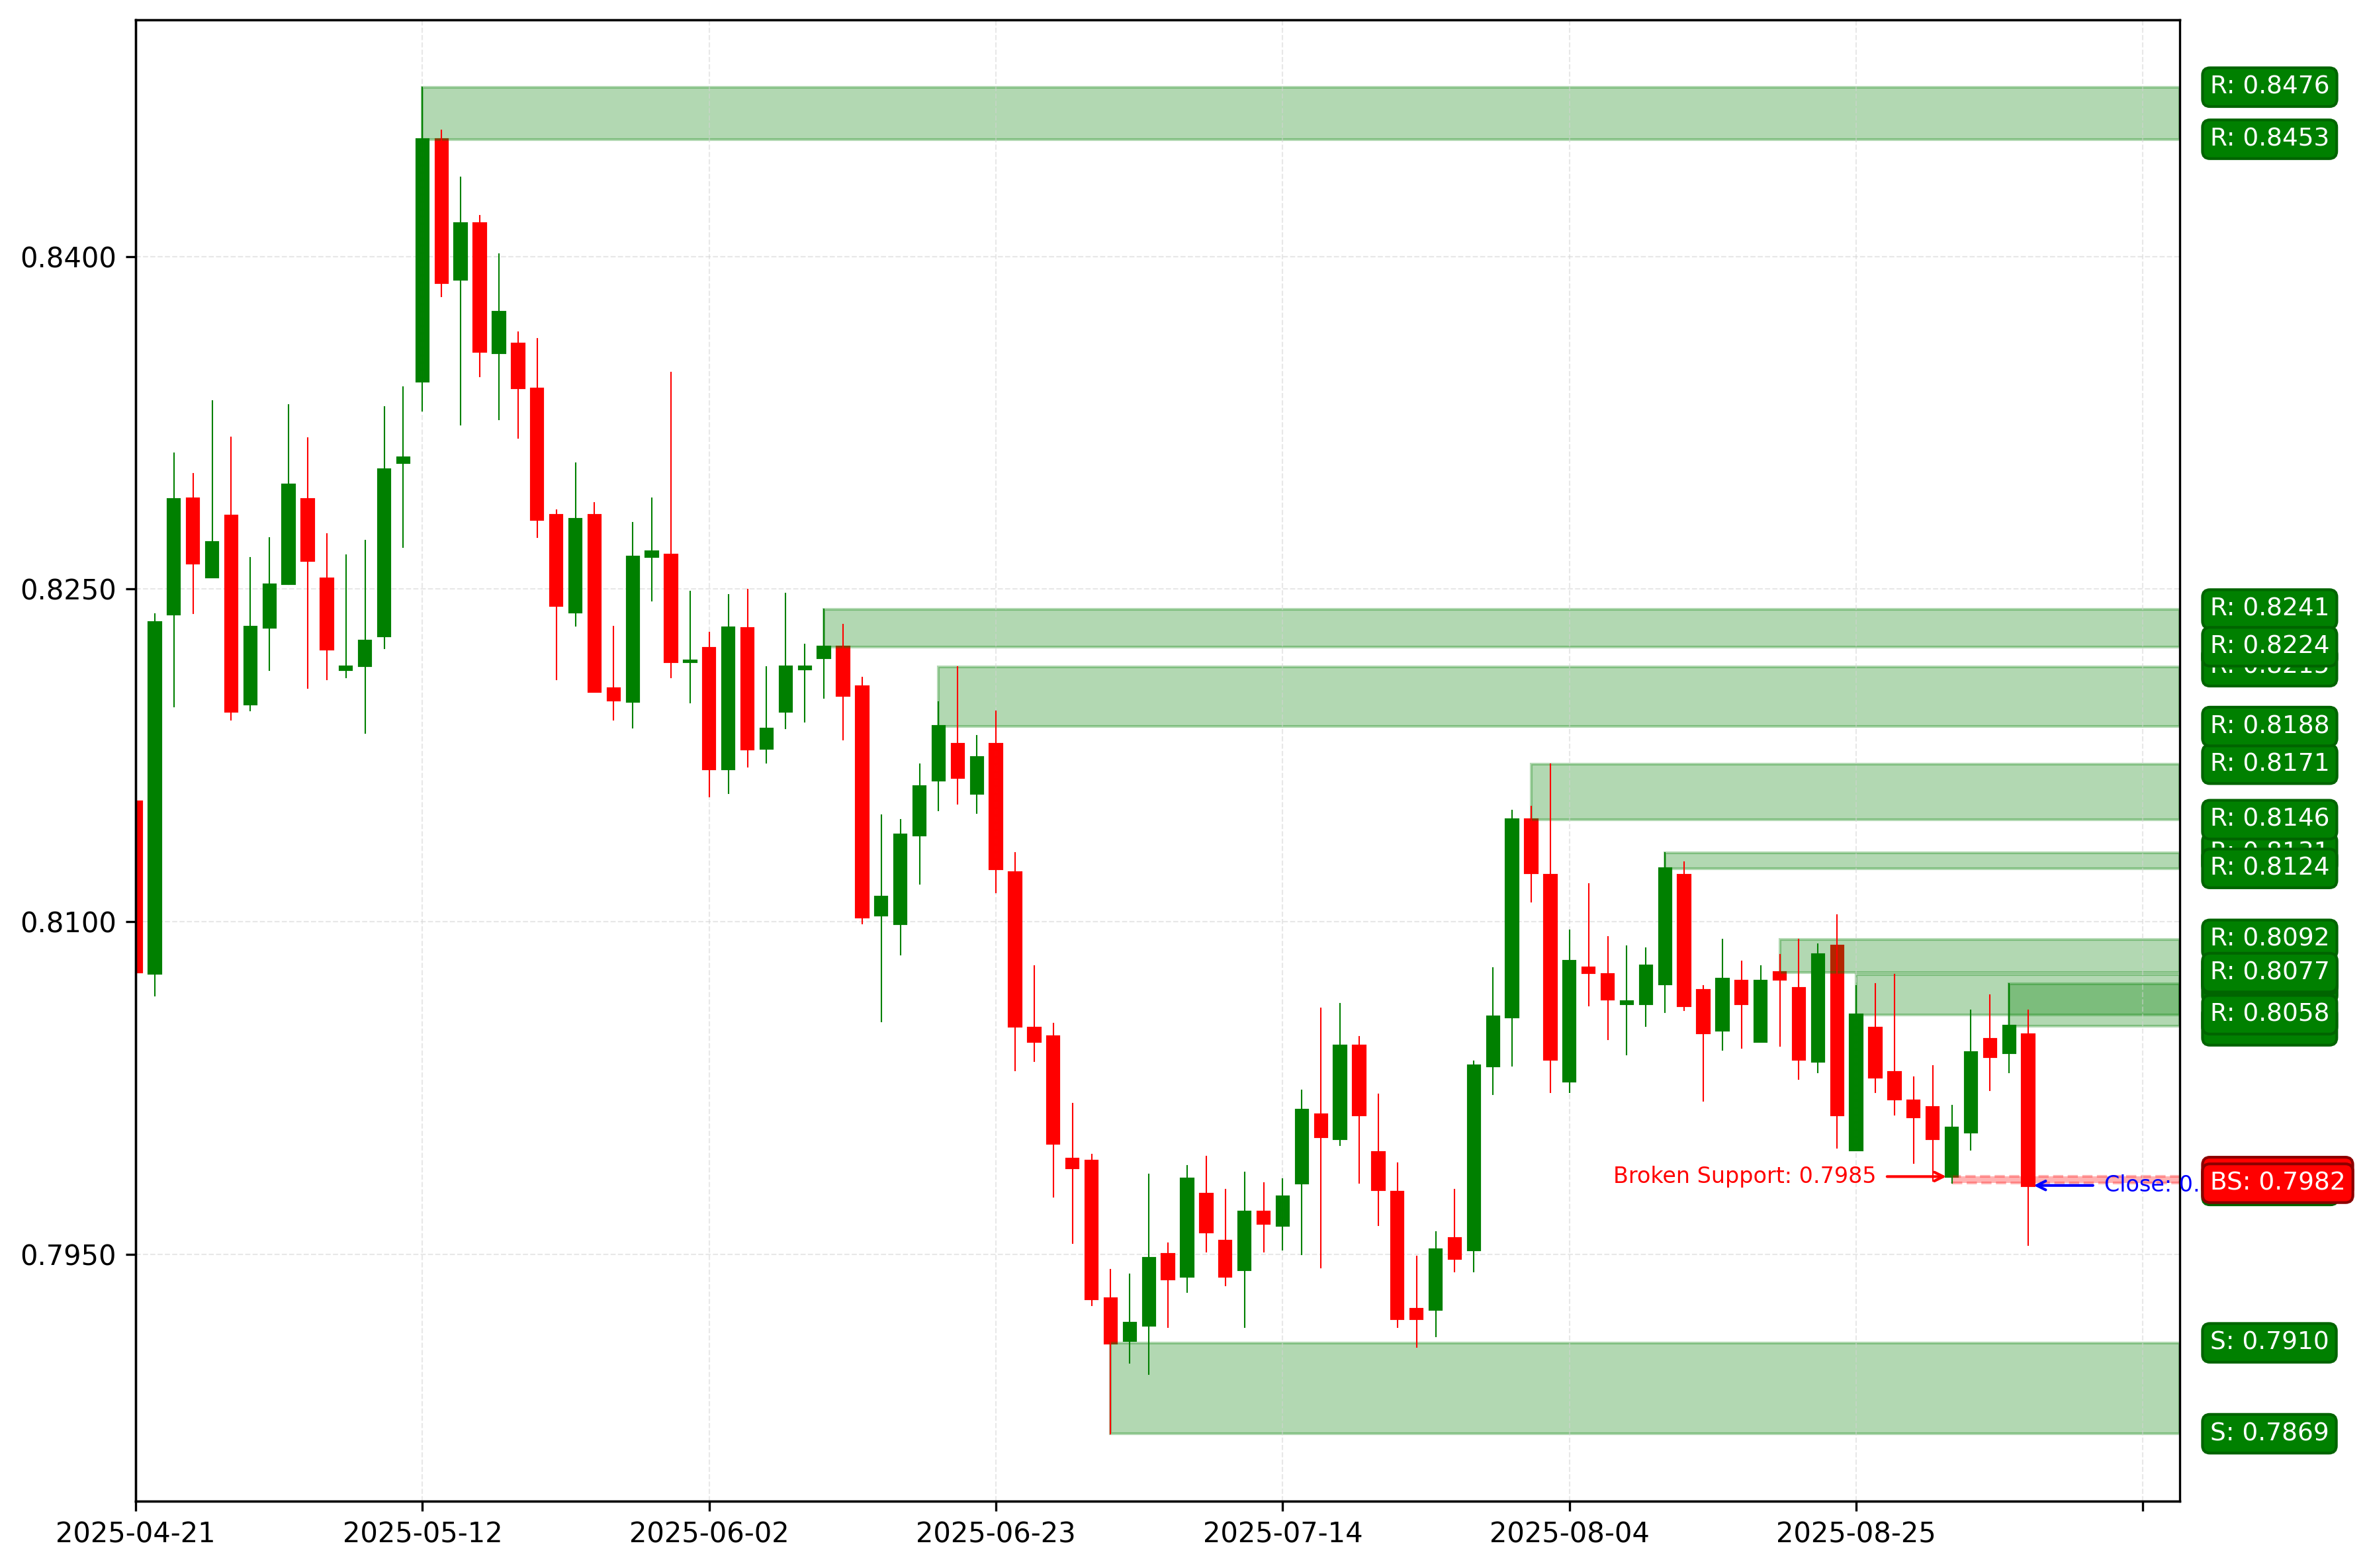
USDCHF. Technical Analysis. D1.
Japanese Yen (USDJPY)
The market remains in a bullish trend; 4 days ago, another breakout occurred in the direction of the trend. The last broken level is resistance (147.77 — 148.18). An impulse wave is developing.
The intermediate target for the upward movement is the resistance level with boundaries 148.48 — 149.13. If the market successfully holds above this resistance, this will open the way for price movement to target #2 – the resistance level with boundaries 150.74 — 150.91.
If the correction completes around the support level (146.64 — 146.92), the potential profit/risk ratio could be around 2.
Long positions will remain relevant as long as the market is above the nearest daily timeframe support level with boundaries 146.64 — 146.92.
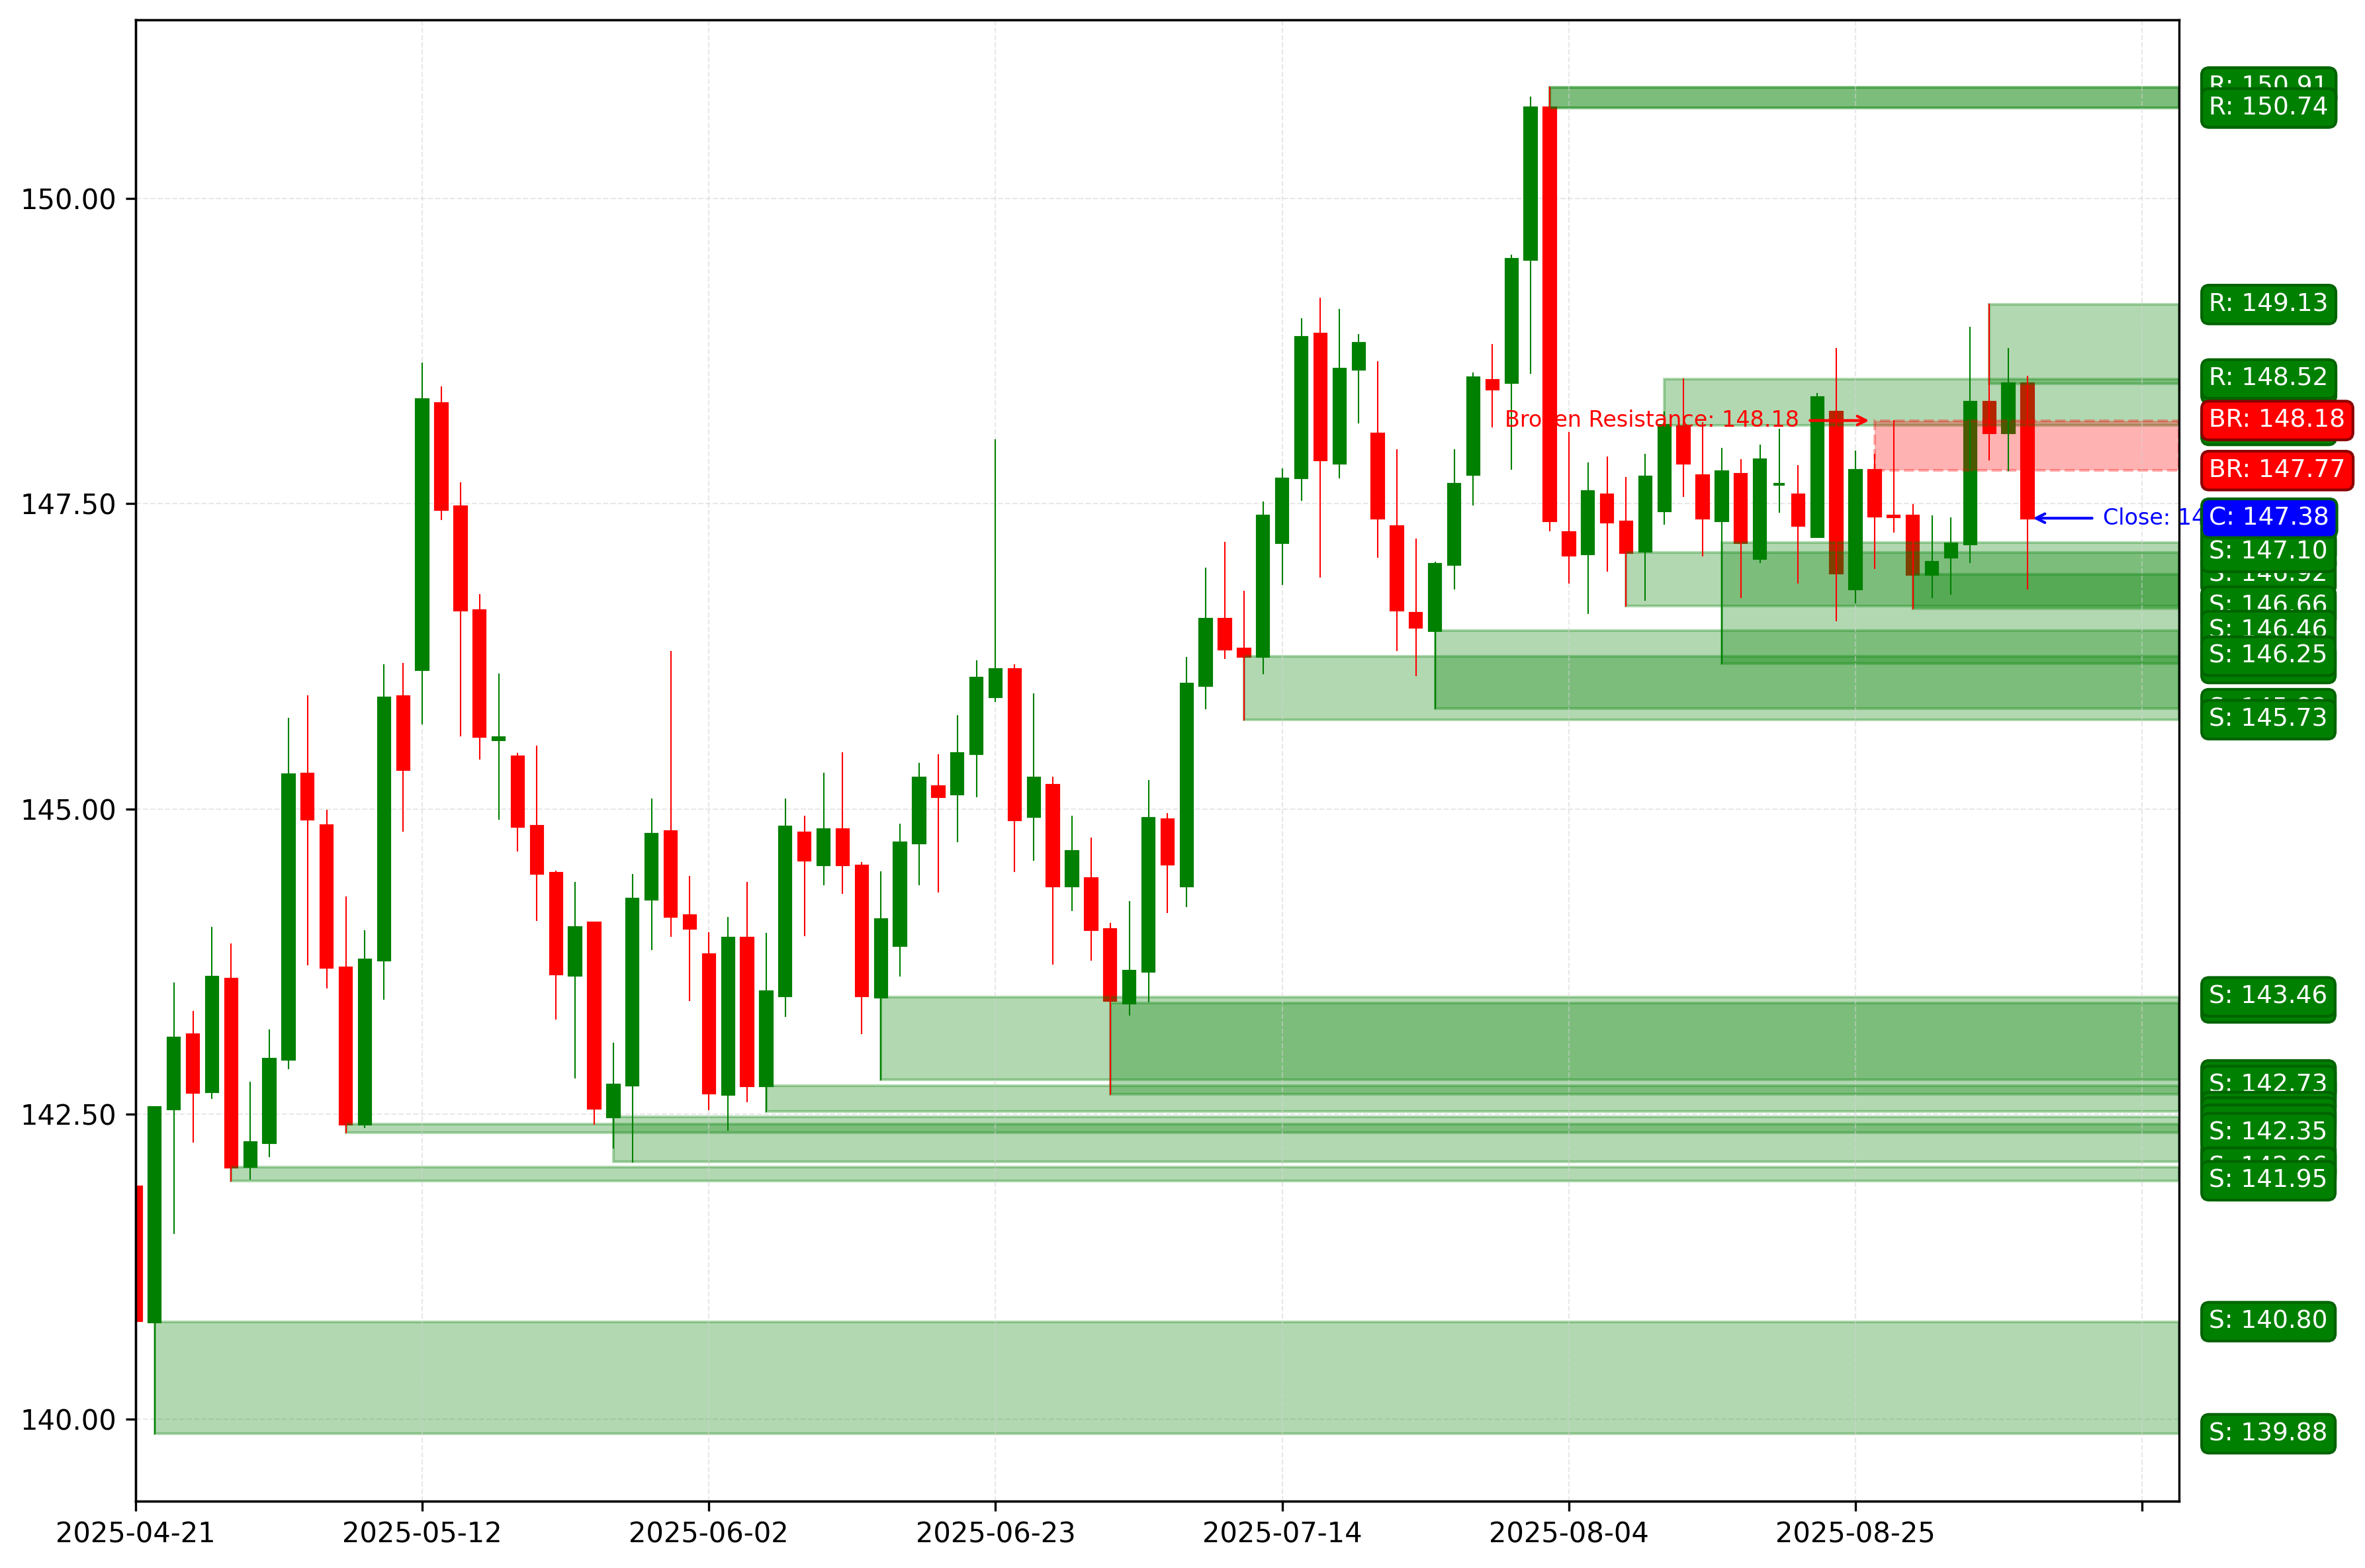
USDJPY. Technical Analysis. D1.
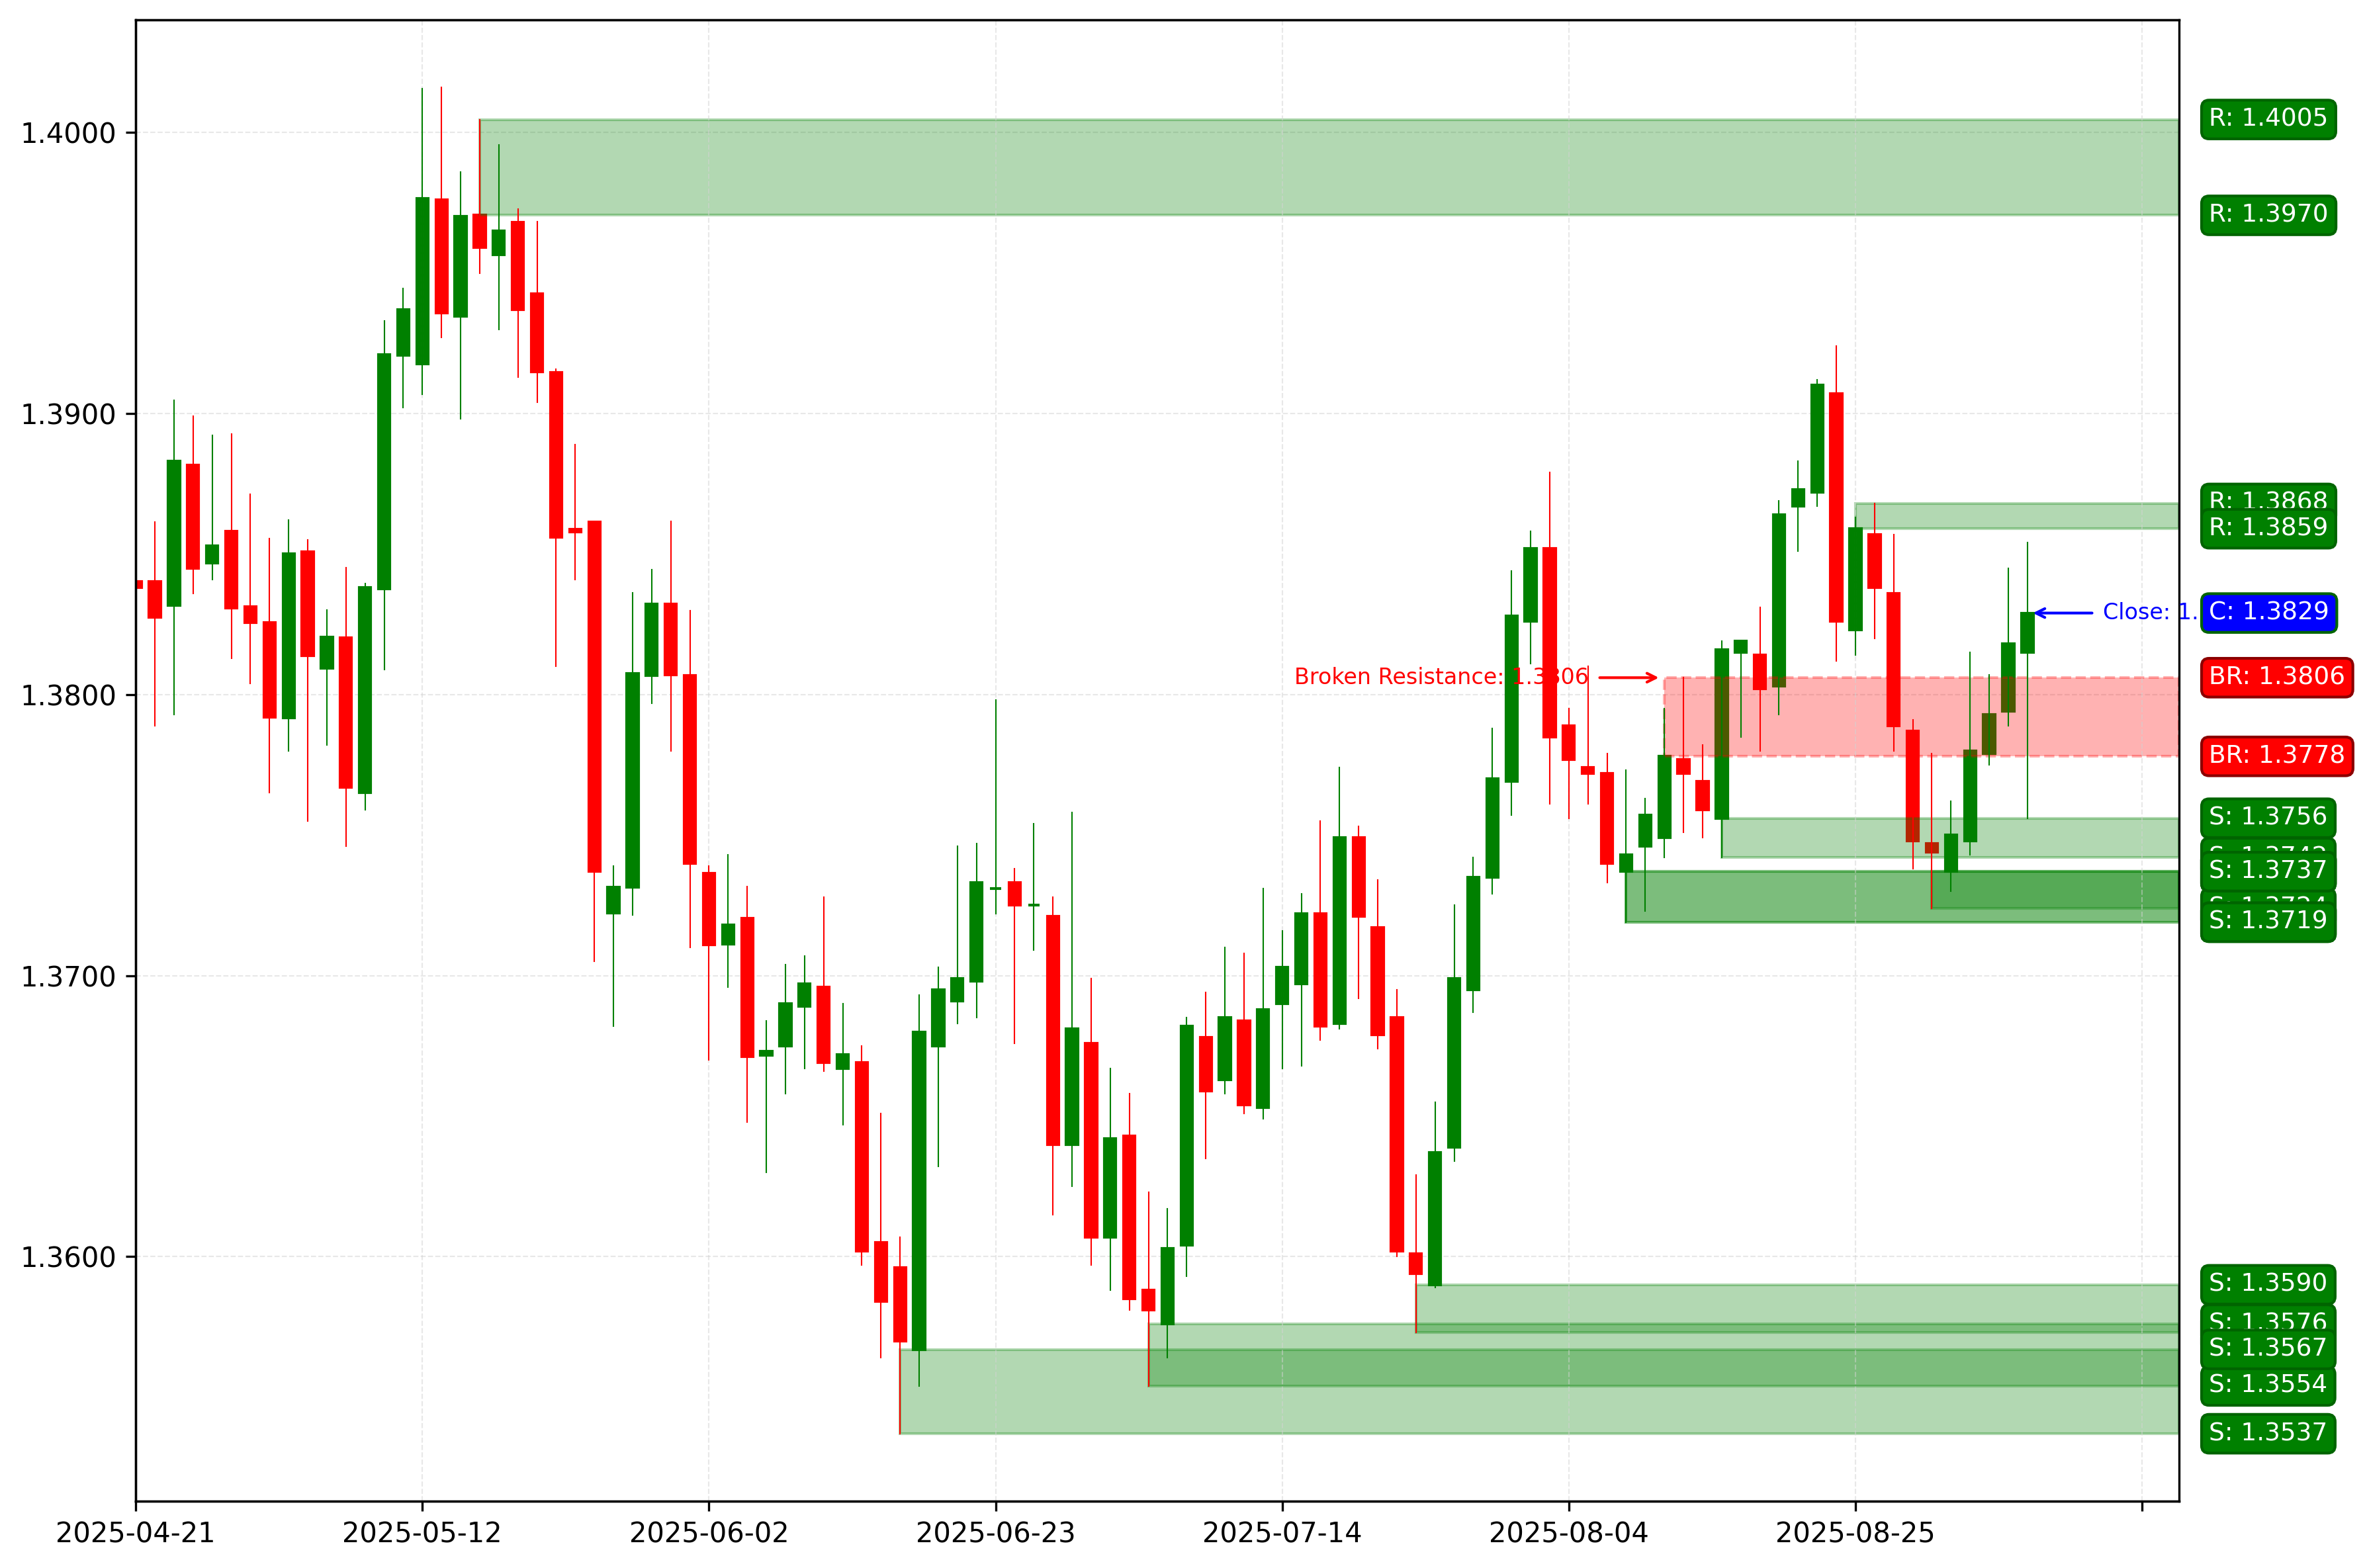
Canadian Dollar (USDCAD)
The market on the daily timeframe remains in a bullish trend. 5 days ago, the correction completed, and an entry point for buying on a bounce formed; an impulse wave is developing. The intermediate target for the upward movement is the resistance level with boundaries 1.3859 — 1.3868.
If the market successfully holds above this resistance, this will open the way for price movement to target #2 – the resistance level with boundaries 1.3971 — 1.4005.
Long positions will remain relevant as long as the market is above the nearest daily timeframe support level with boundaries 1.3724 — 1.3737. If the price closes below, the trend will change to bearish.
USDCAD. Technical Analysis. D1.
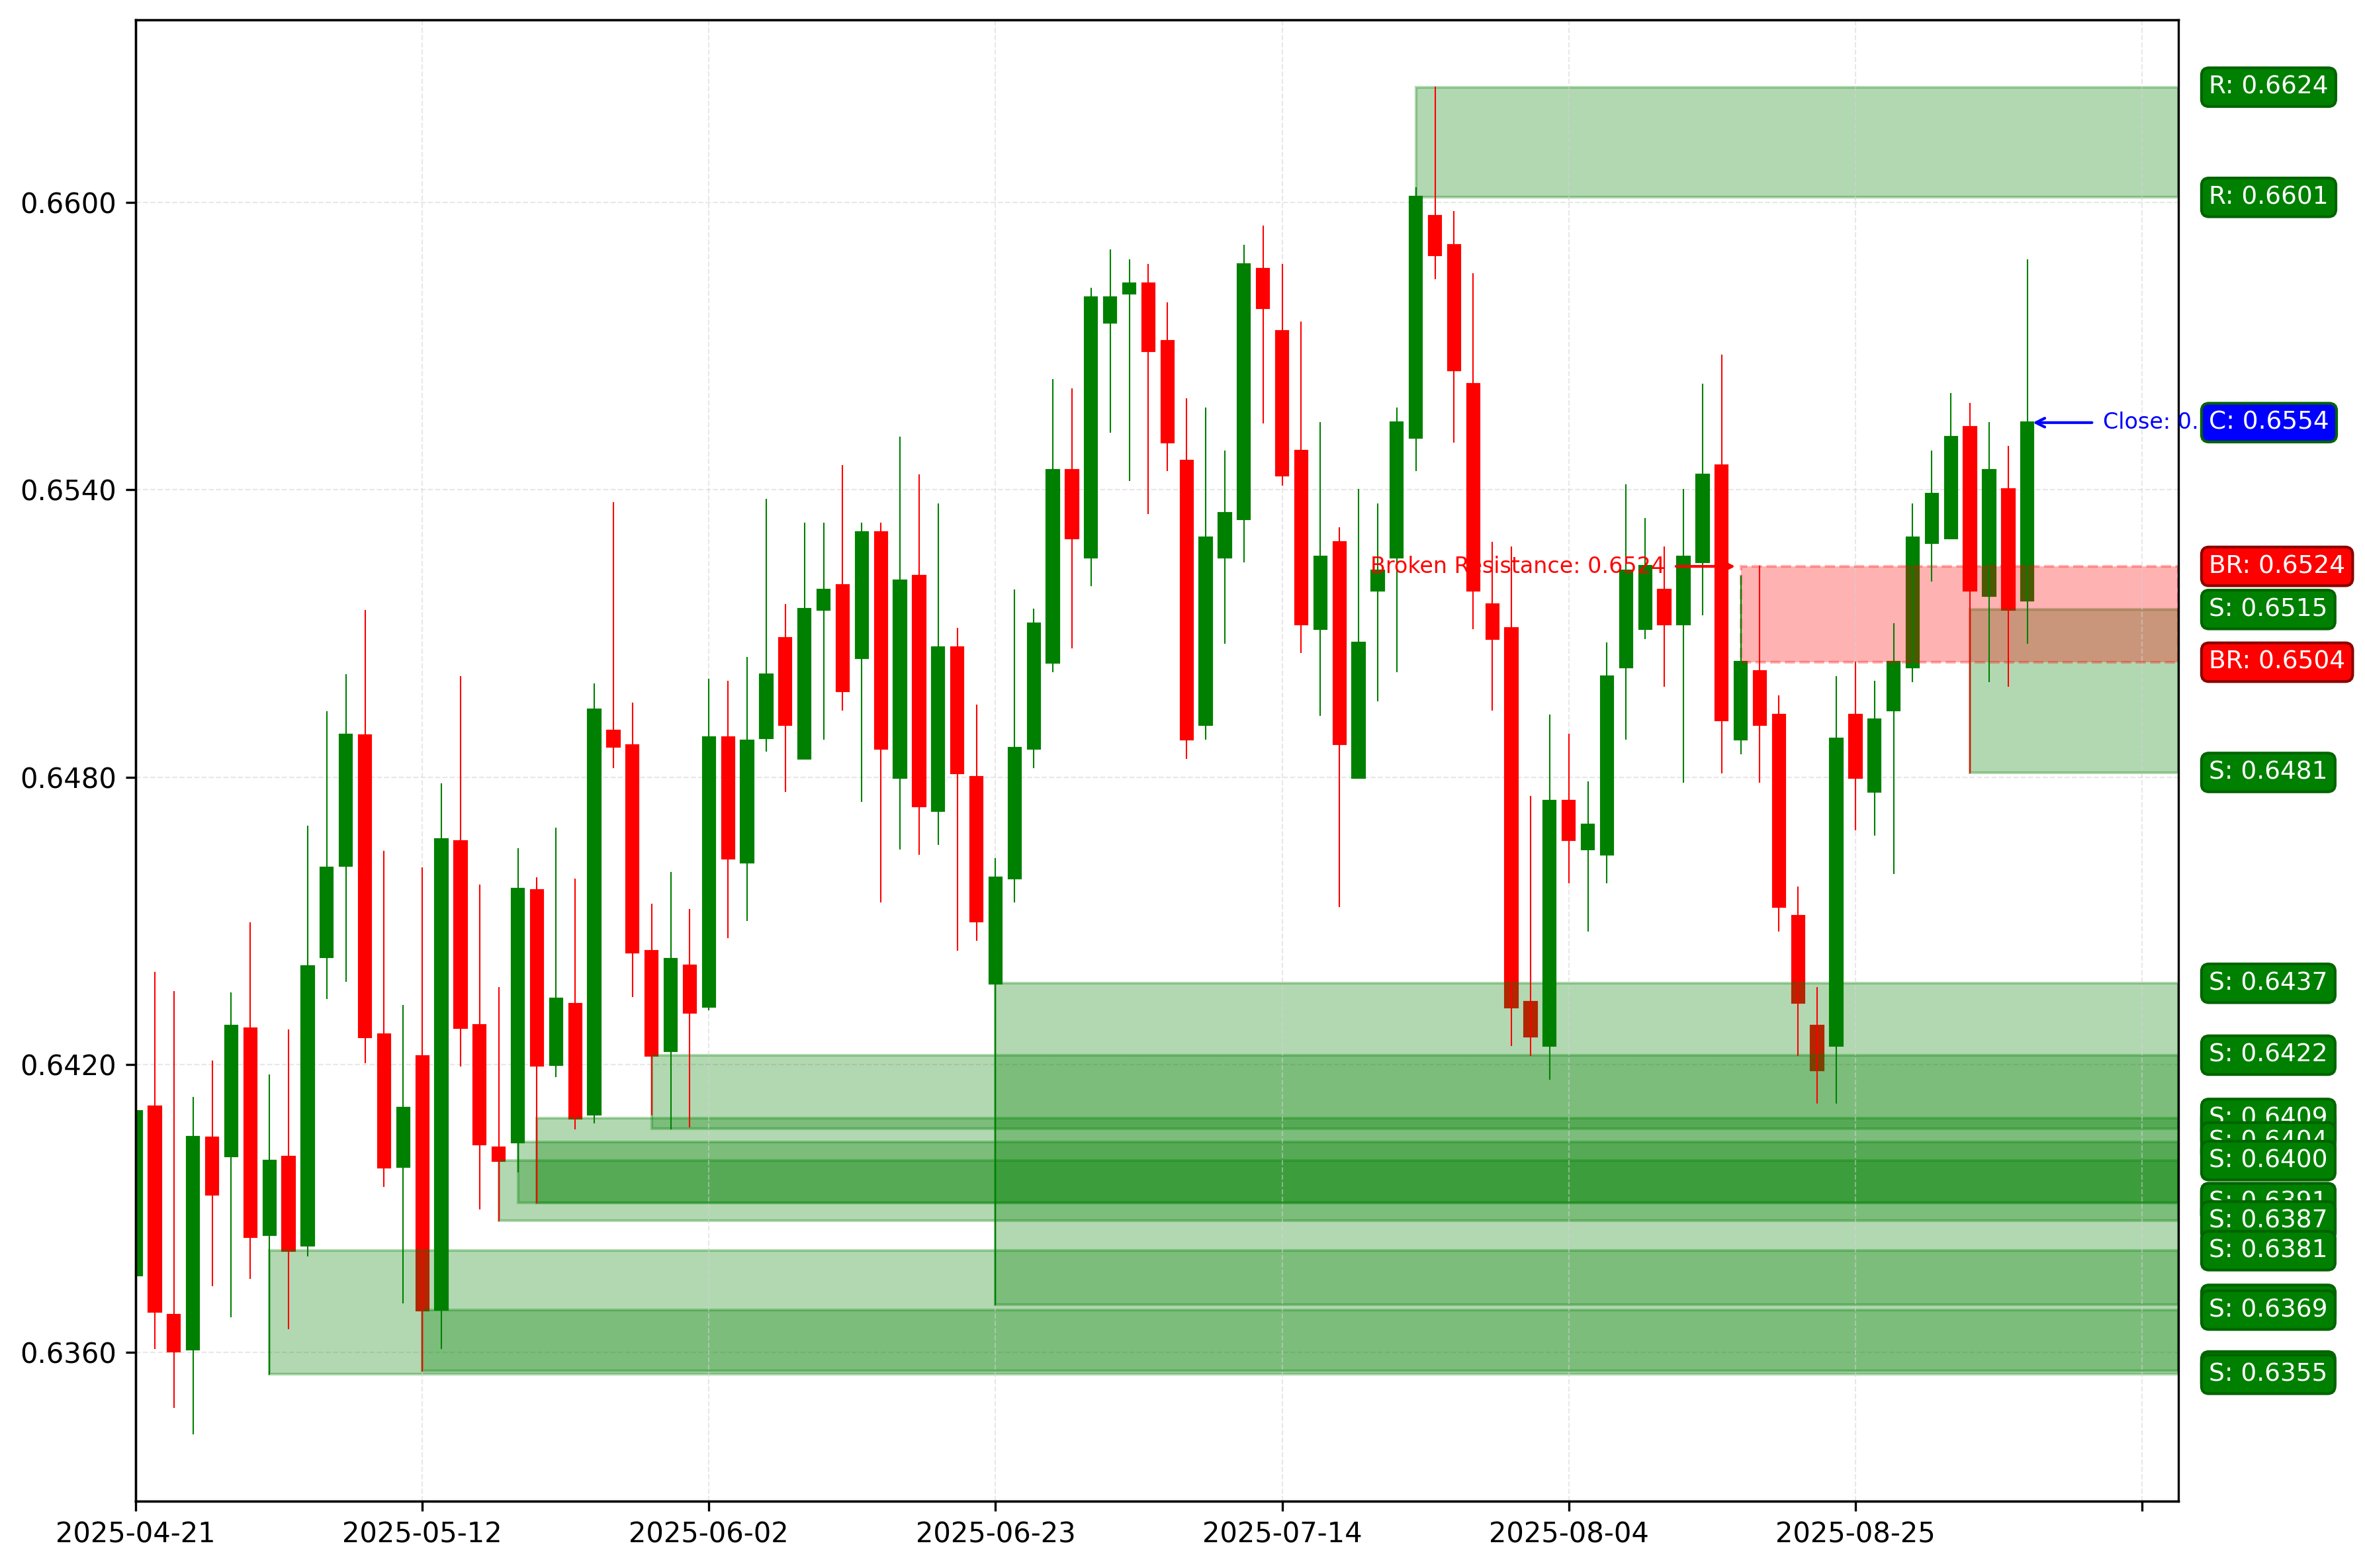
Australian Dollar (AUDUSD)
The market remains in a bullish trend. The last broken level is resistance (0.6504 — 0.6524). The breakout occurred 7 days ago. An impulse wave is developing.
The intermediate target for the upward movement is the resistance level with boundaries 0.6601 — 0.6624. Long positions will remain relevant as long as the market is above the nearest daily timeframe support level with boundaries 0.6481 — 0.6515.
AUDUSD. Technical Analysis. D1.
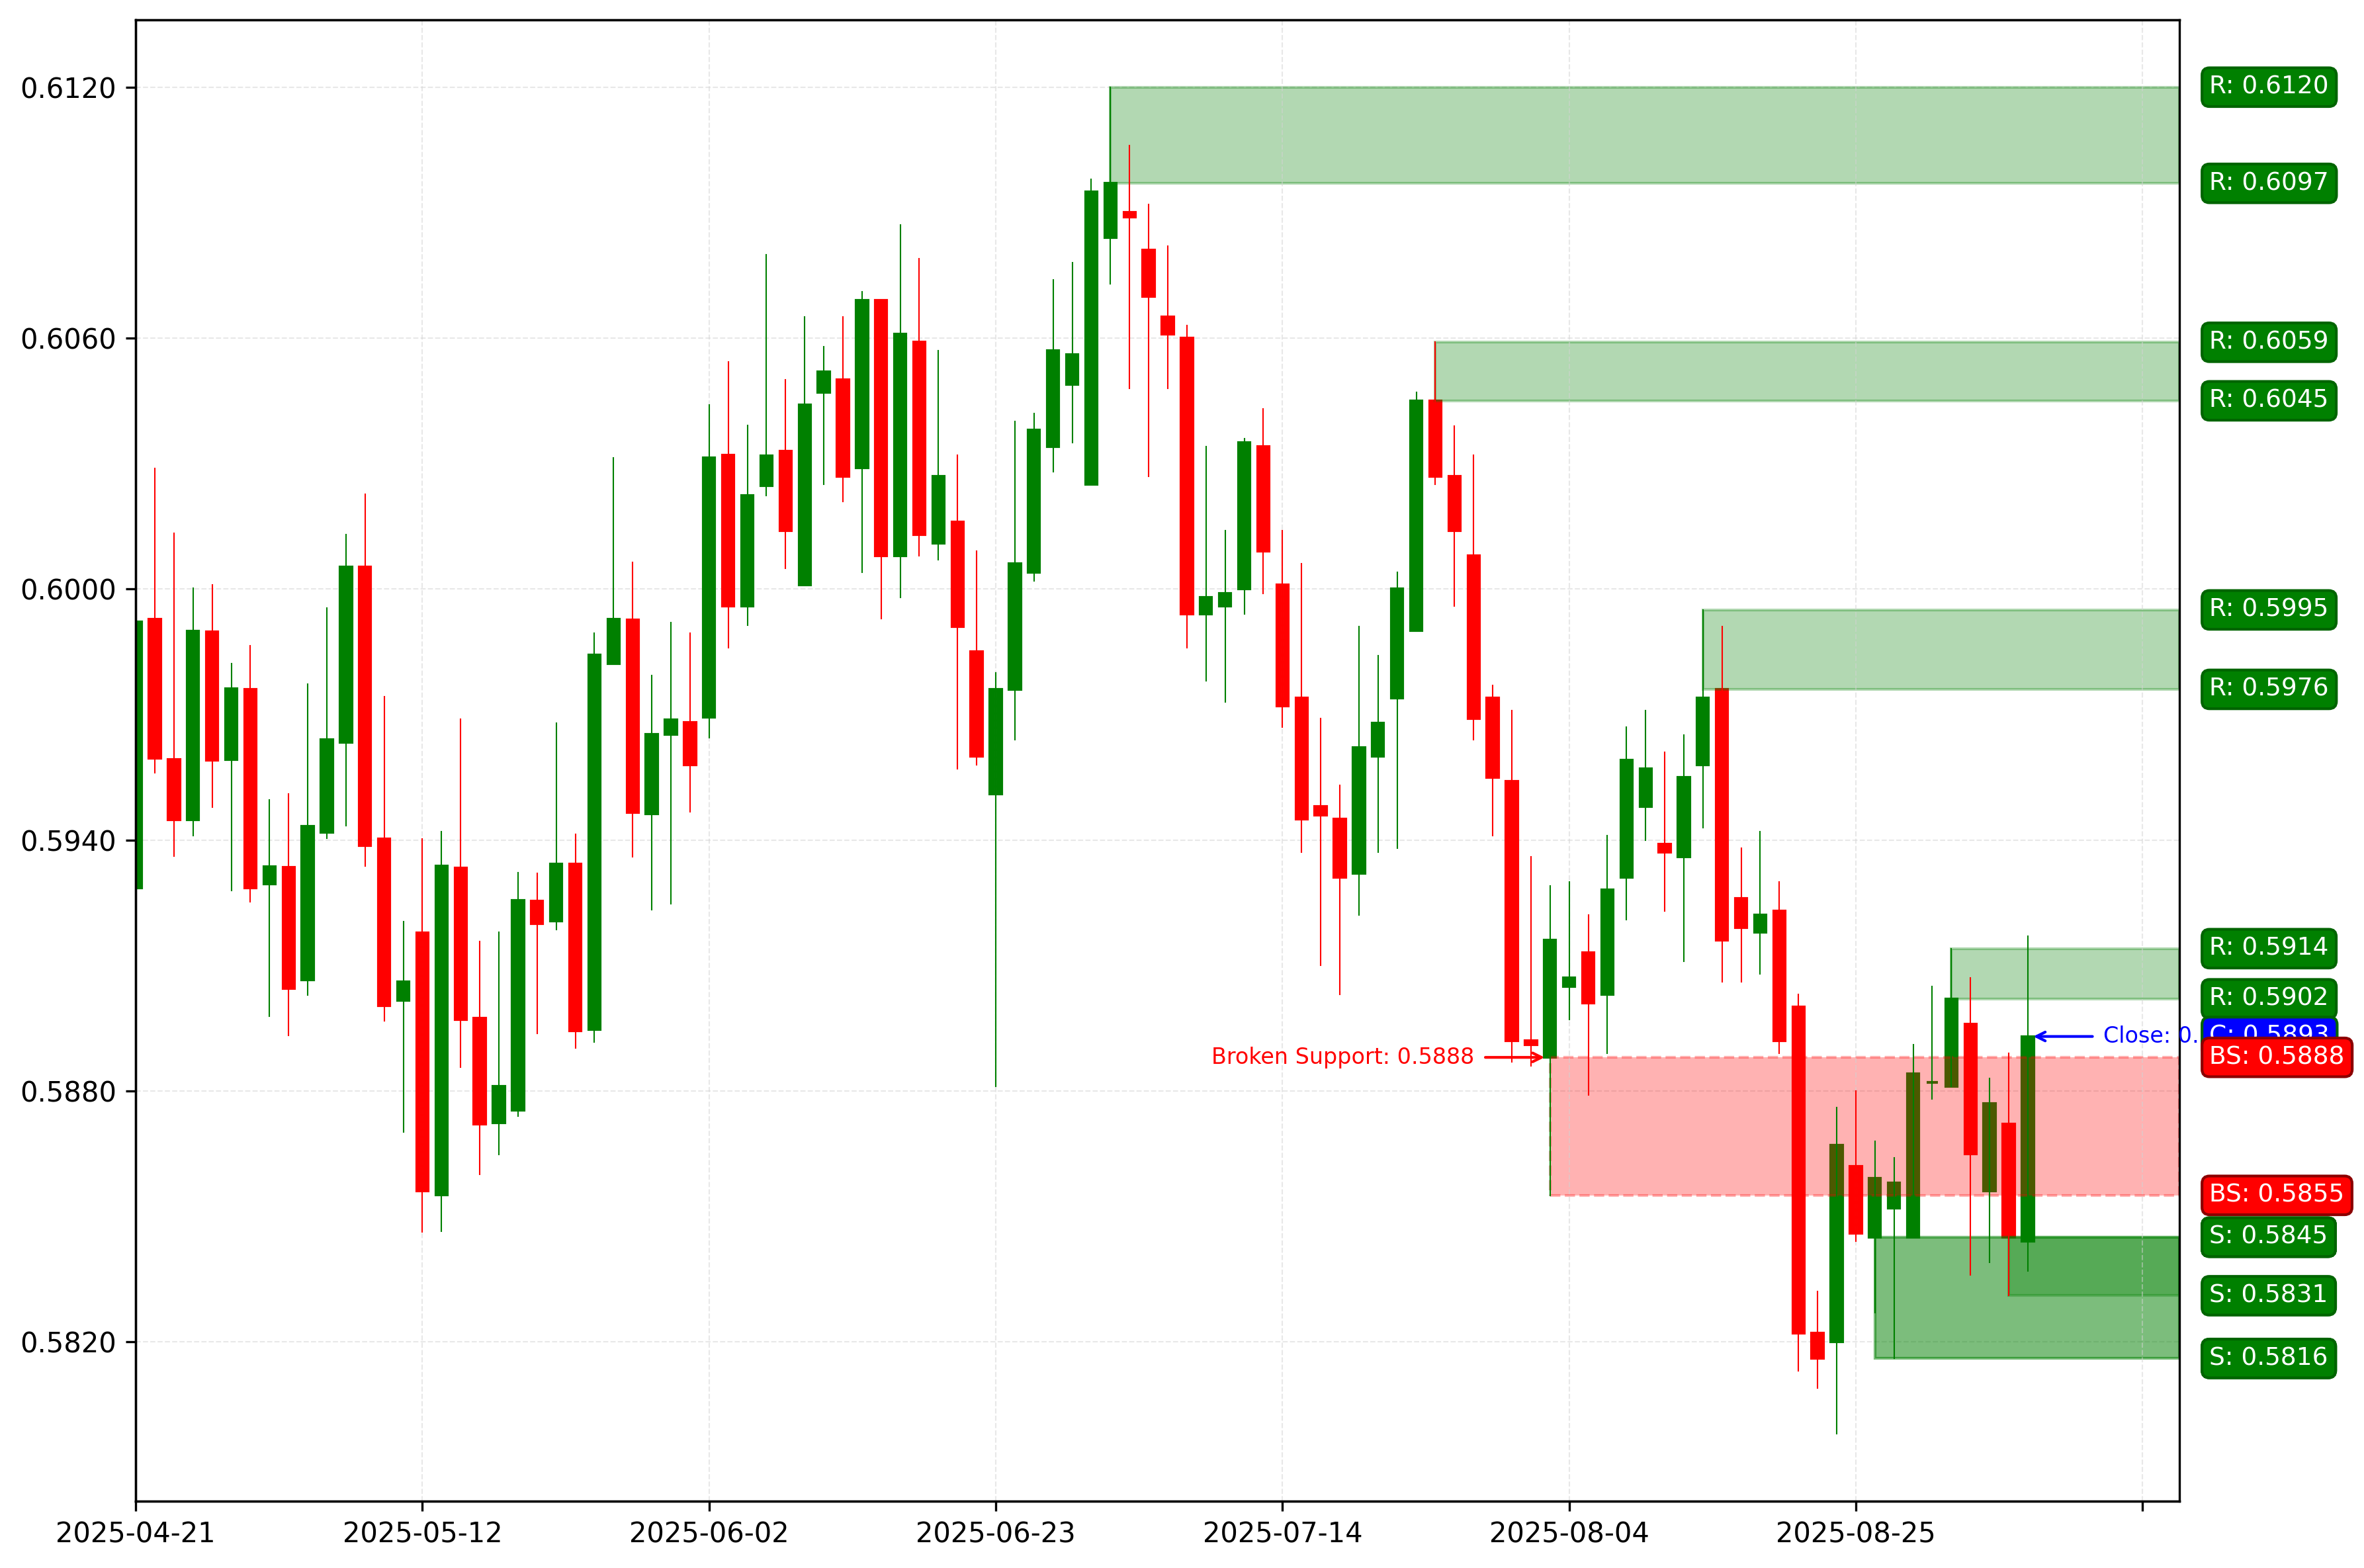
New Zealand Dollar (NZDUSD)
The market remains in a medium-term bearish trend; an impulse wave is developing.
The intermediate target for the downward movement is the support level with boundaries 0.5831 — 0.5845. If the market successfully holds below this support, this will open the way for price movement to target #2 – the support level with boundaries 0.5816 — 0.5845.
Short positions will remain relevant as long as the market stays below the nearest daily timeframe resistance level with boundaries 0.5902 — 0.5914.
NZDUSD. Technical Analysis. D1.
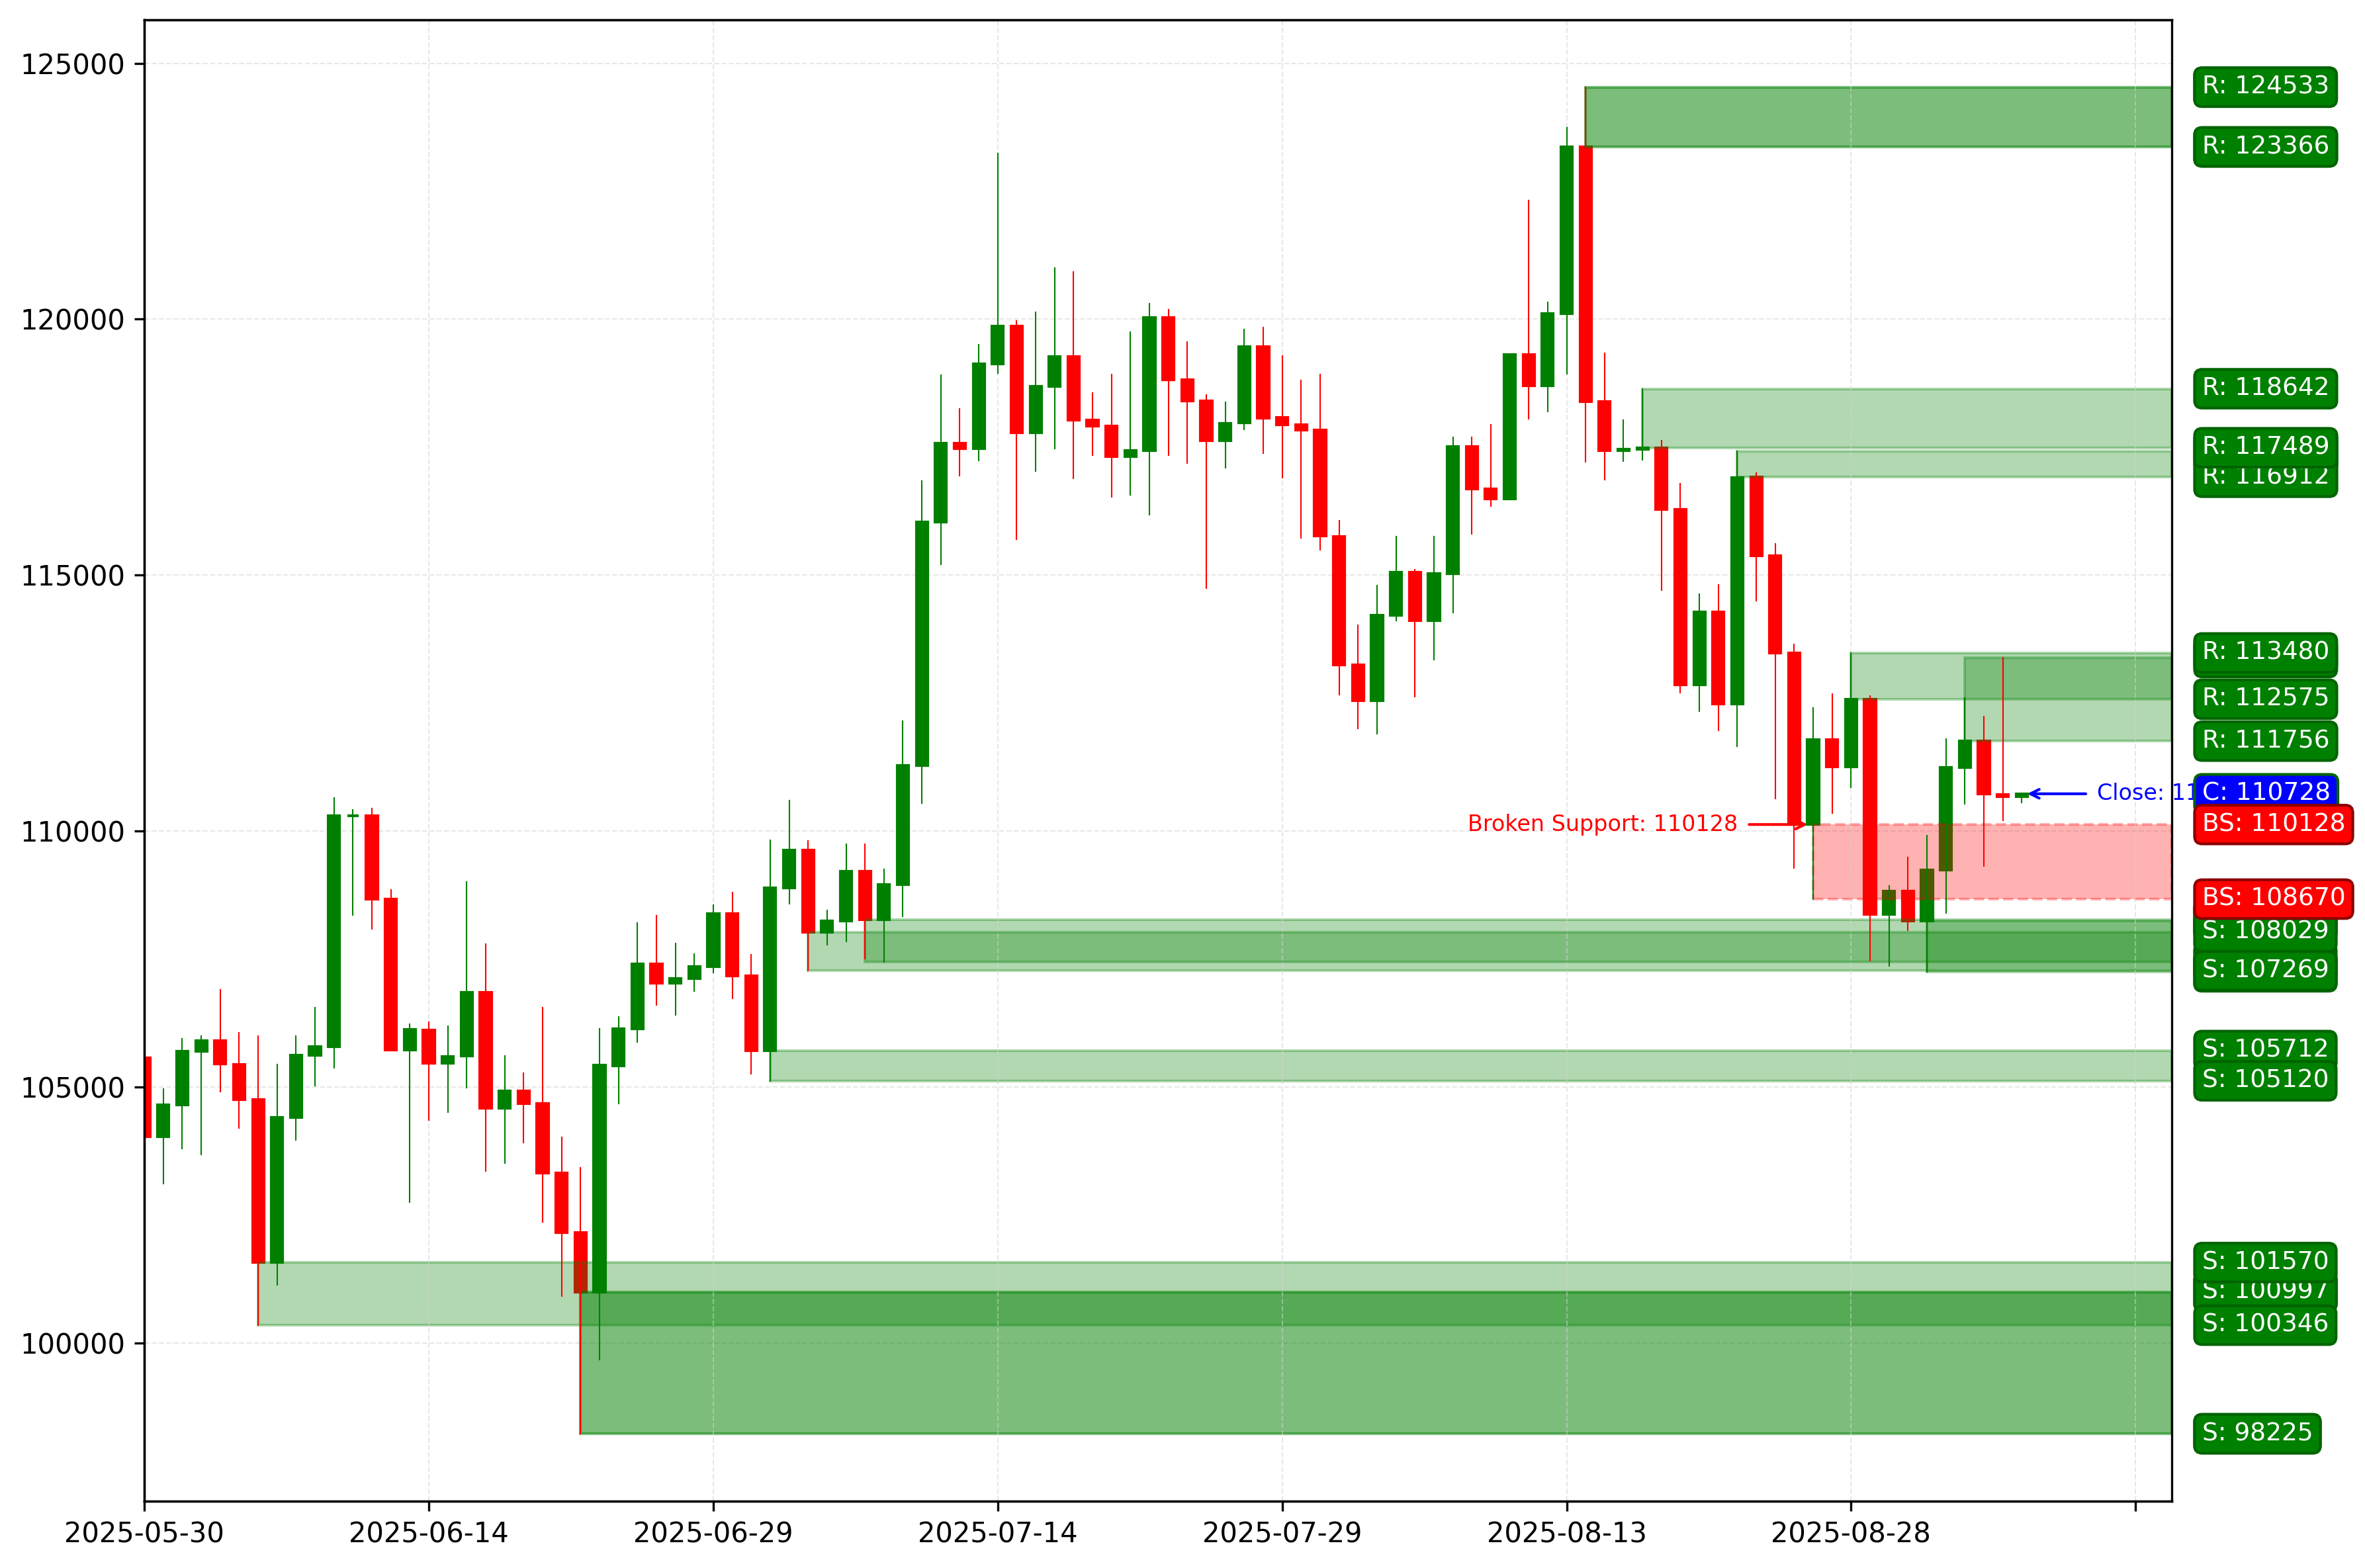
Bitcoin (BTC)
The trend is bearish. The last broken level is support (108670 — 110128). The breakout occurred 9 days ago.
3 days ago, the correction completed, and an entry point for selling on a bounce formed; an impulse wave is developing. The intermediate target for the downward movement is the support level with boundaries 107250 — 108248.
If the market successfully holds below this support, this will open the way for price movement to target #2 – the support level with boundaries 107438 — 108270. Short positions will remain relevant as long as the market is below the nearest daily timeframe resistance level with boundaries 111756 — 113390.
BTC. Technical Analysis. D1.
Ethereum (ETH)
The market remains in a bullish trend; 2 days ago, the correction completed, and an entry point for buying on a bounce formed; an impulse wave is developing. Currently, the price is near the support level with boundaries 4257 — 4360.
The intermediate target for the upward movement is the resistance level with boundaries 4602 — 4664. If the market successfully holds above this resistance, this will open the way for price movement to target #2 – the resistance level with boundaries 4831 — 4956.
Long positions will remain relevant as long as the market is above the nearest daily timeframe support level with boundaries 4257 — 4360.
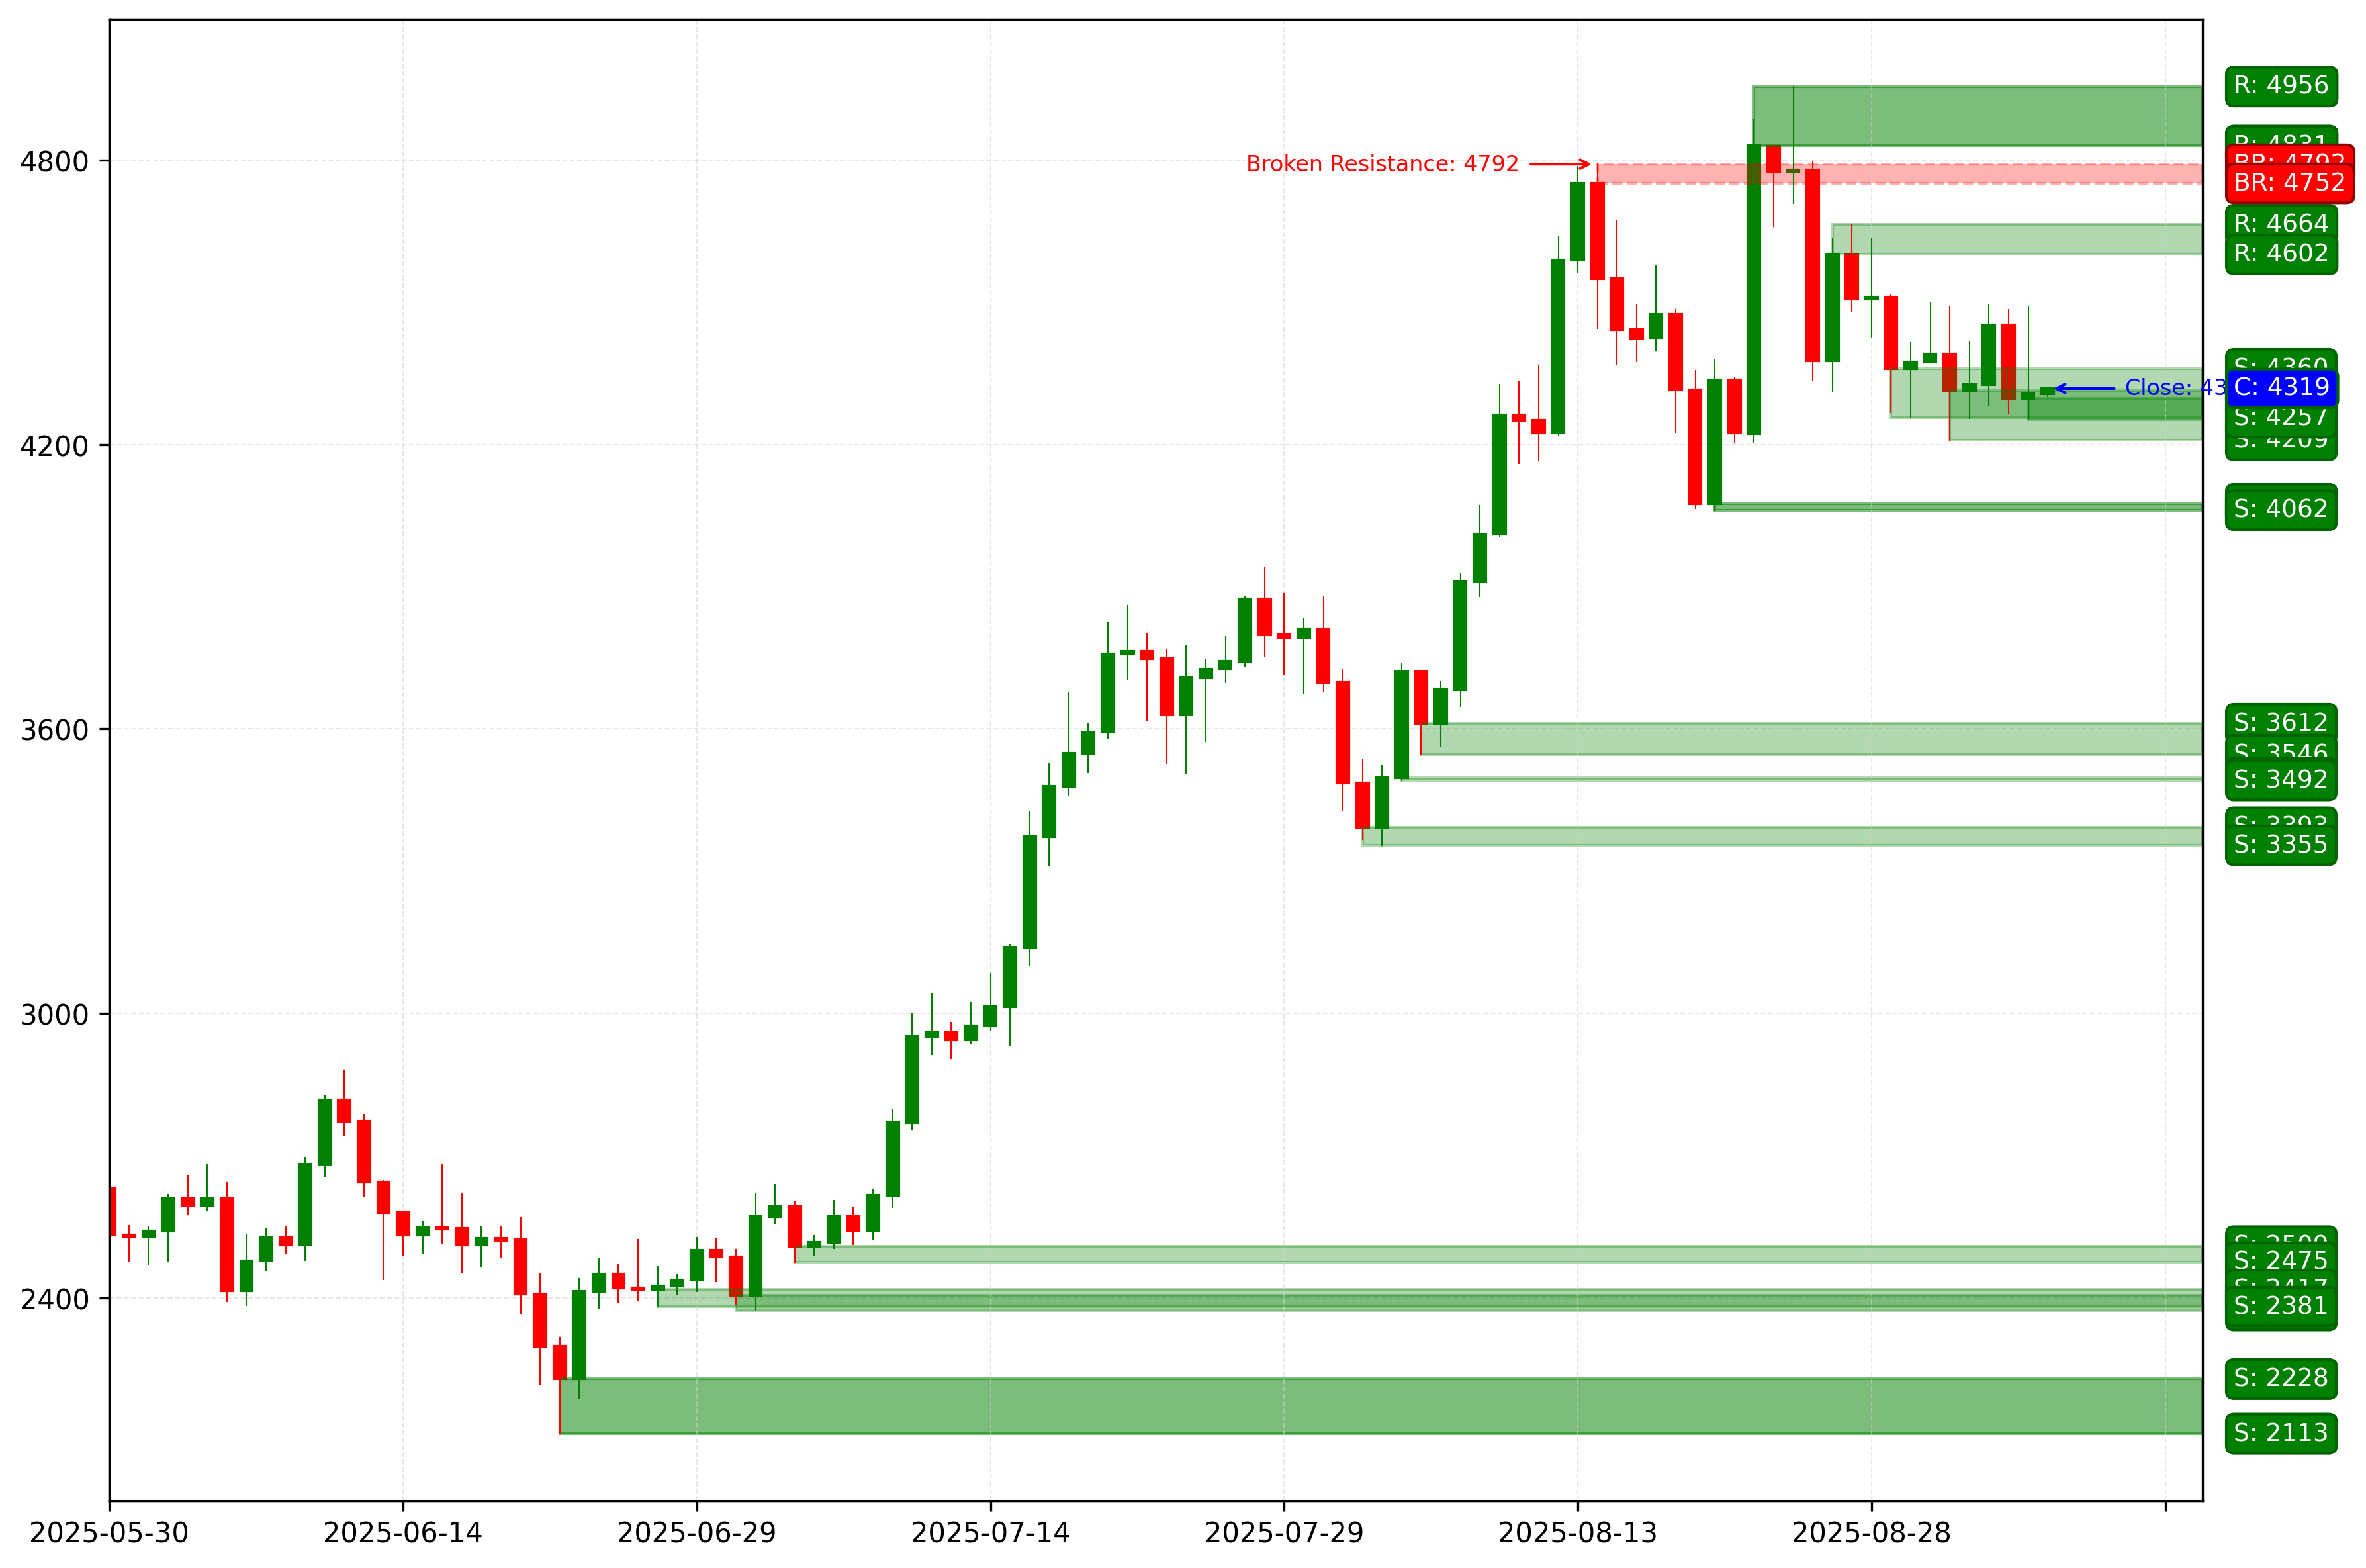
ETH. Technical Analysis. D1.
Apple Inc (AAPL)
The trend remains bullish. The last broken level is resistance (234.06 — 235.12). The breakout occurred 3 days ago.
A correction wave is developing. An entry point for buying on a bounce will appear after this correction completes.
Long positions will remain relevant as long as the market is above the nearest support level with boundaries 223.78 — 224.90.
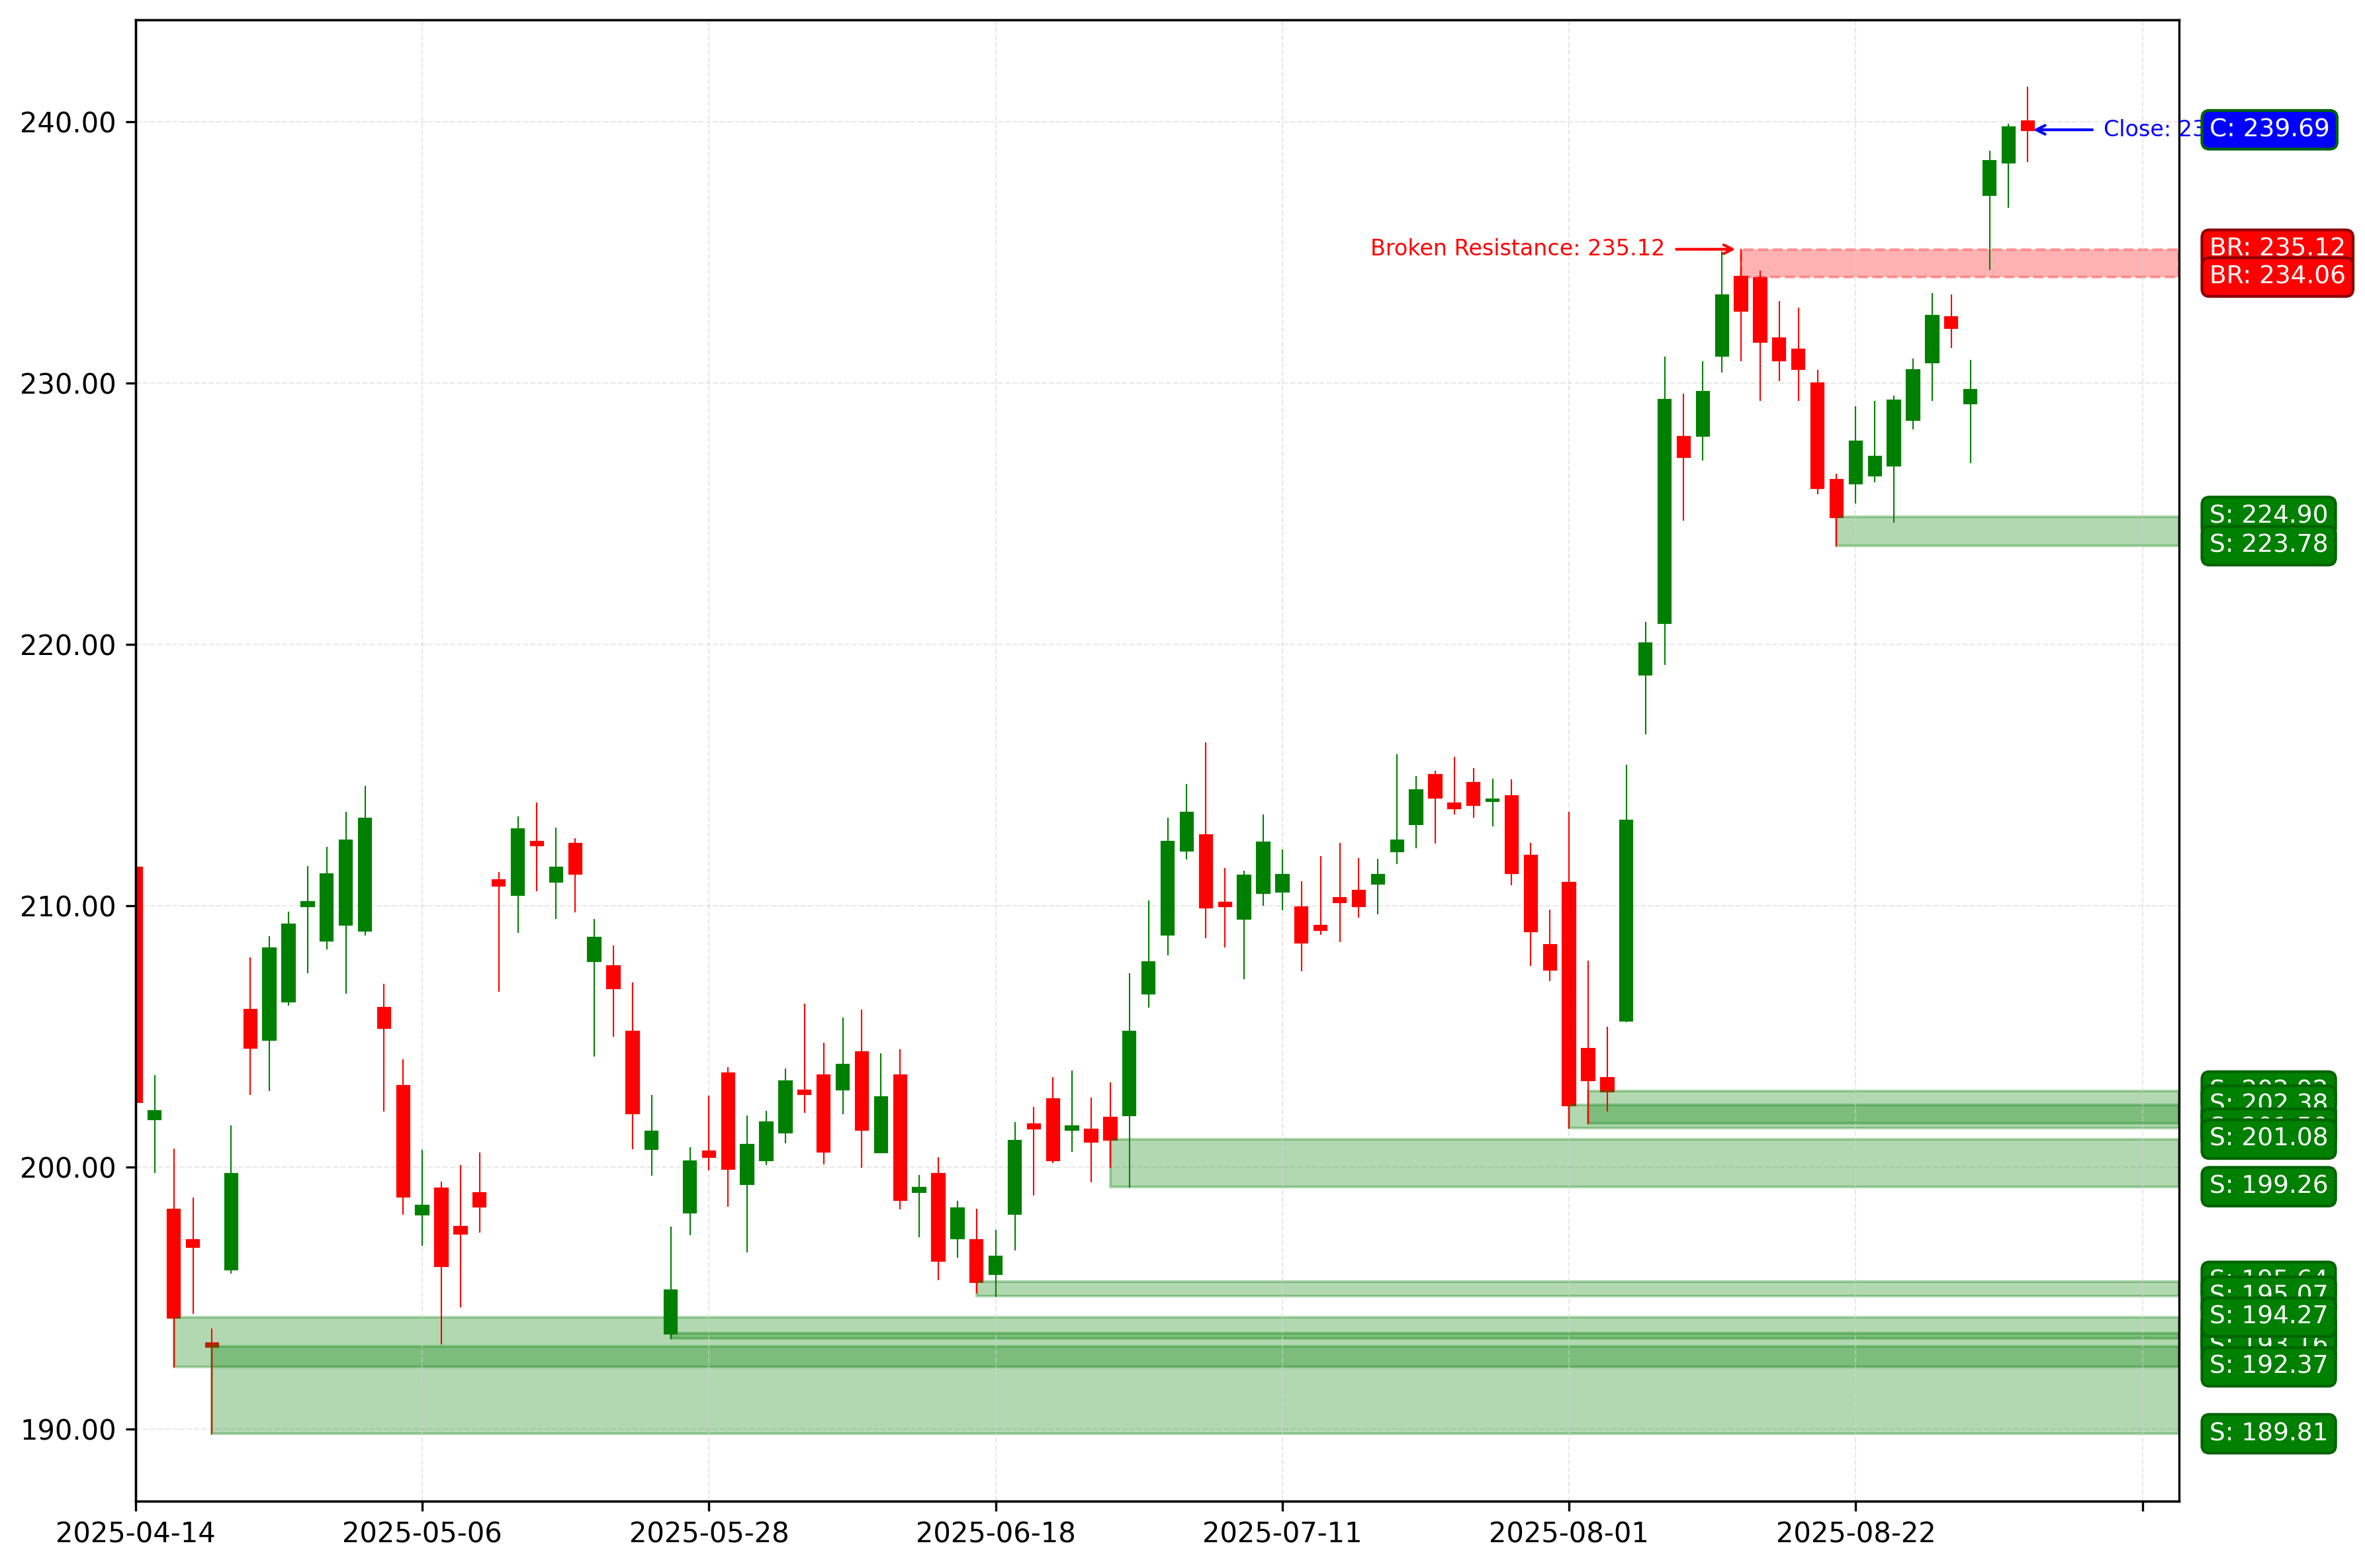
AAPL. Technical Analysis. D1.
NVIDIA Corp (NVDA)
The market remains in a downtrend; an impulse wave is developing. The last broken level is support (167.22 — 170.00). The breakout occurred 1 day ago. New entry points for selling on a bounce on the daily timeframe will appear after a correction forms.
The intermediate target for the downward movement is the support level with boundaries 151.49 — 152.98. If the trend develops successfully, a more distant target will be at the support level 140.86 — 141.97.
Short positions will remain relevant as long as the market is below the nearest resistance level with boundaries 181.98 — 184.47.
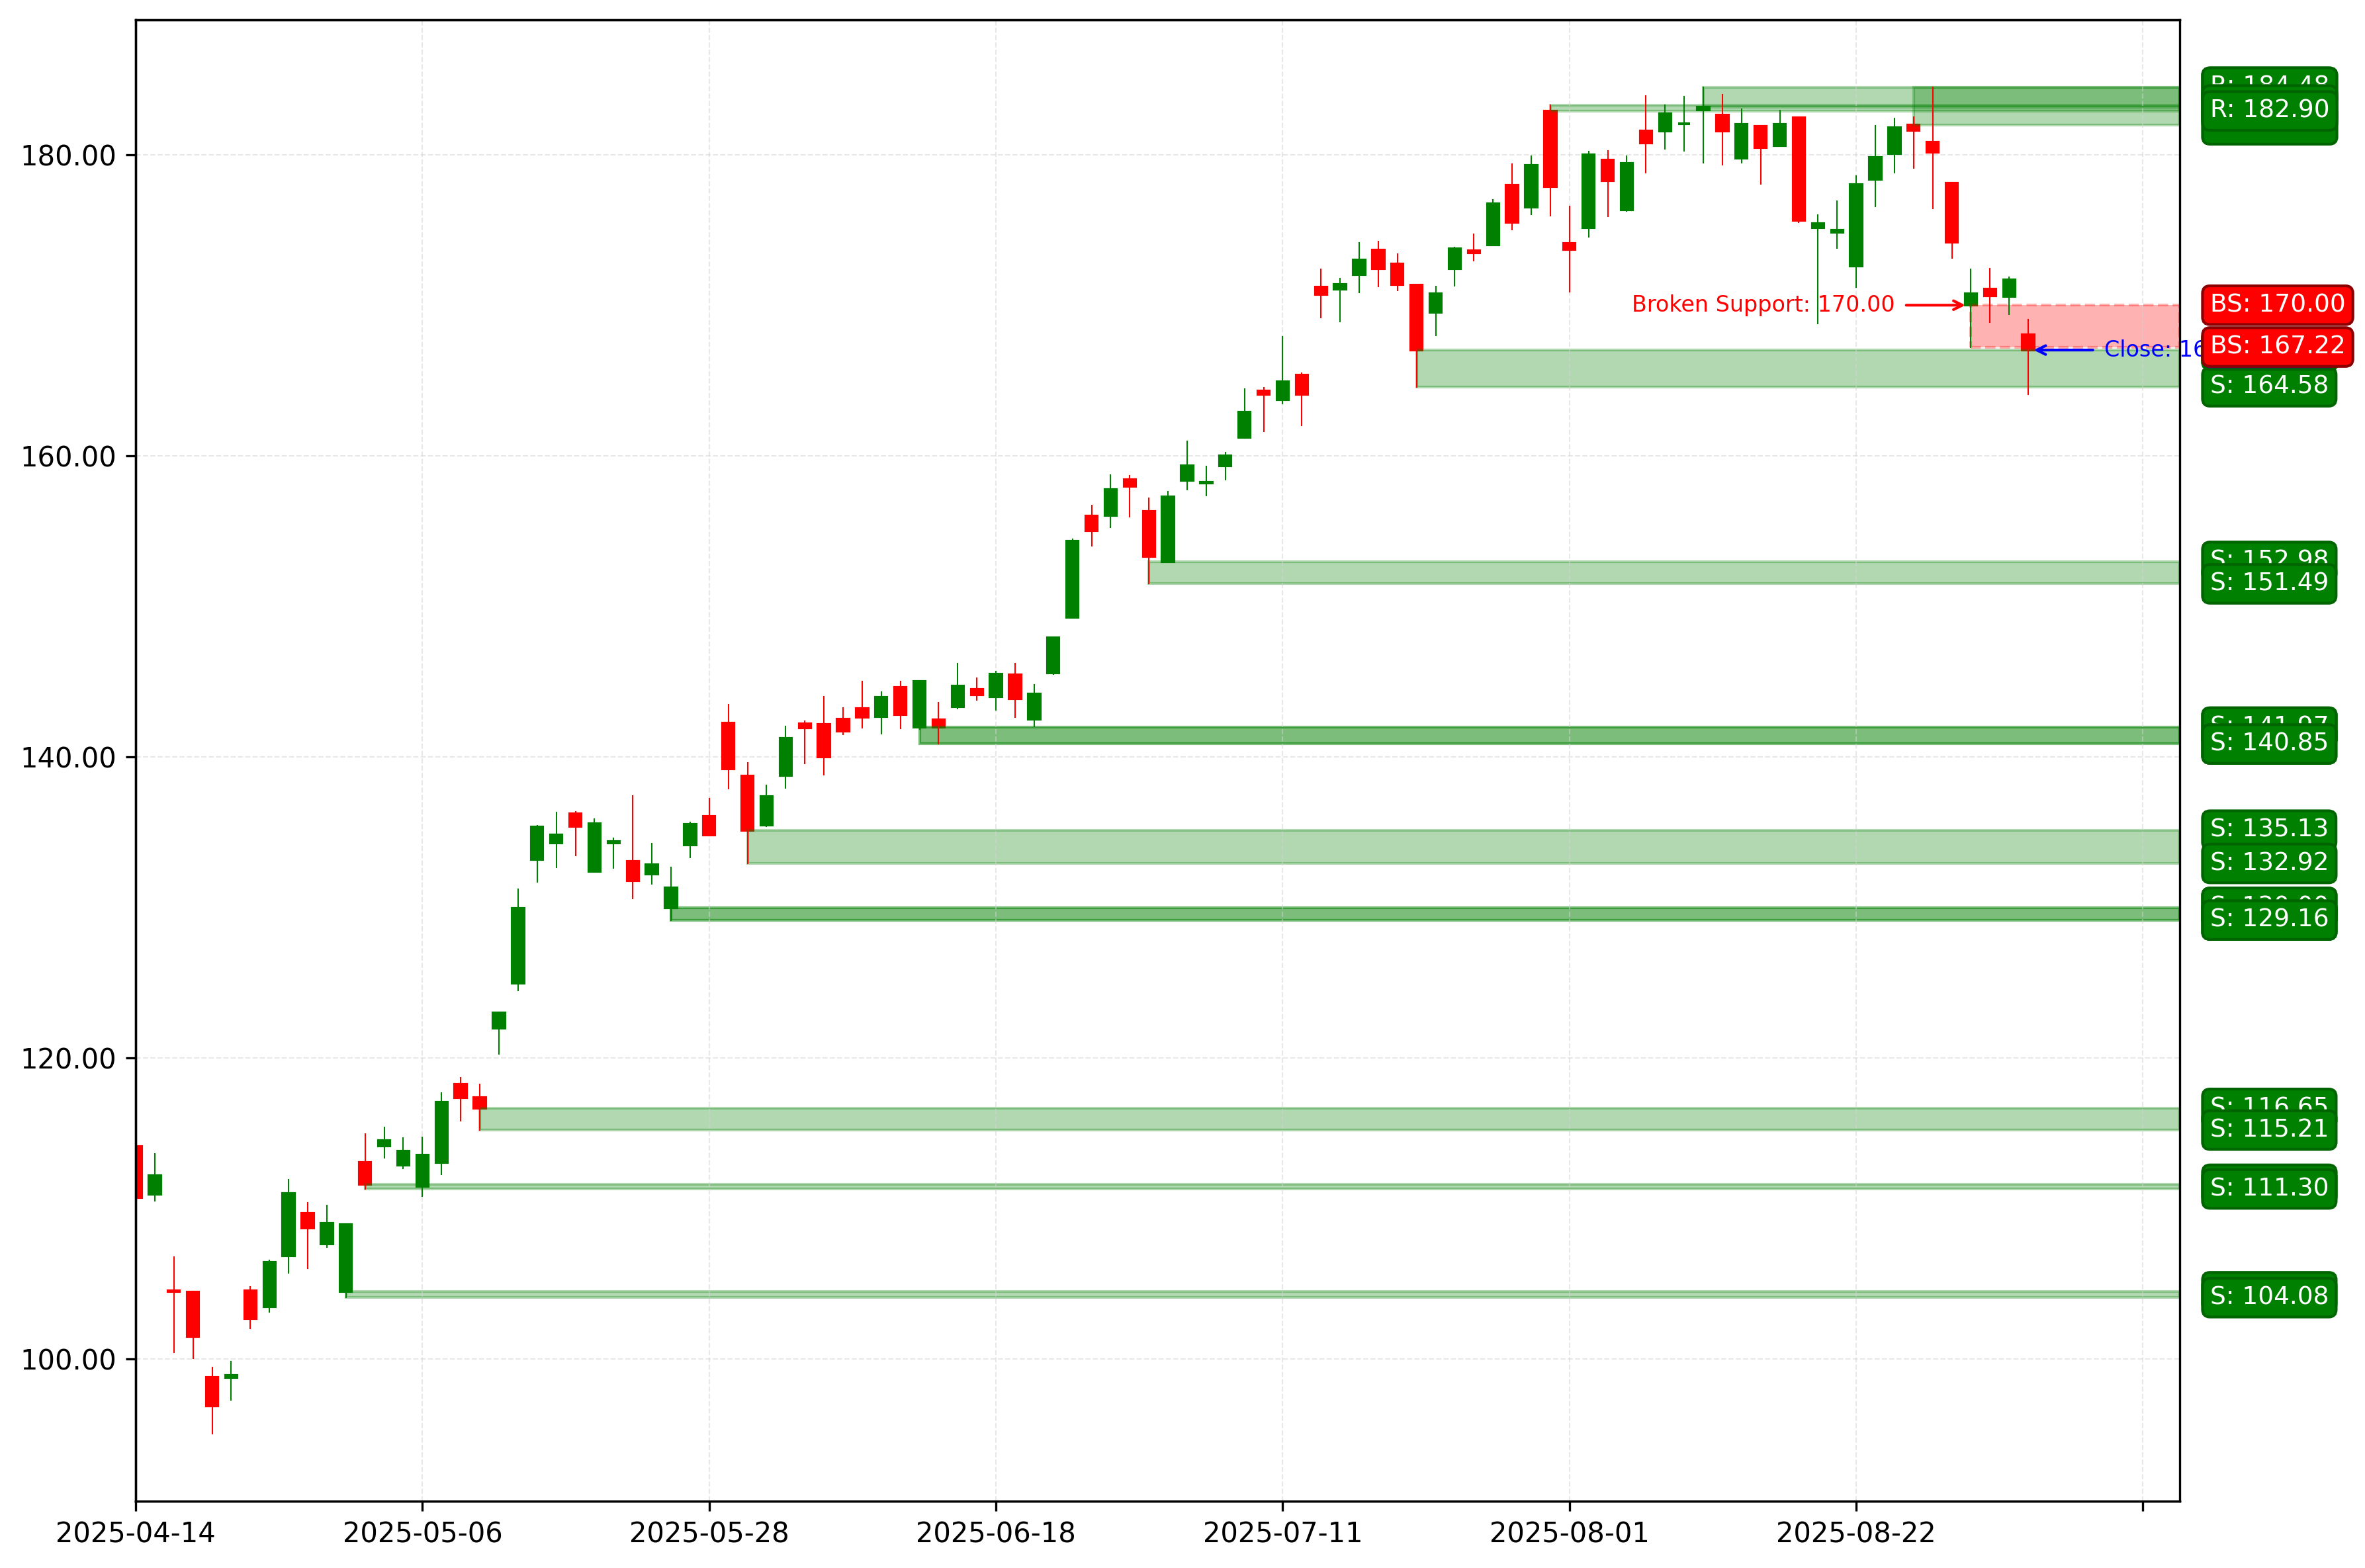
NVDA. Technical Analysis. D1.
Tesla Inc (TSLA)
The market remains in a bullish trend; 2 days ago, the correction completed, and an entry point for buying on a bounce formed; an impulse wave is developing. The intermediate target for the upward movement is the resistance level with boundaries 351.94 — 355.39.
If the market successfully holds above this resistance, this will open the way for price movement to target #2 – the resistance level with boundaries 356.17 — 357.54. Long positions will remain relevant as long as the market is above the nearest support level with boundaries 314.60 — 320.11. A breakout will signal a change in the medium-term trend.
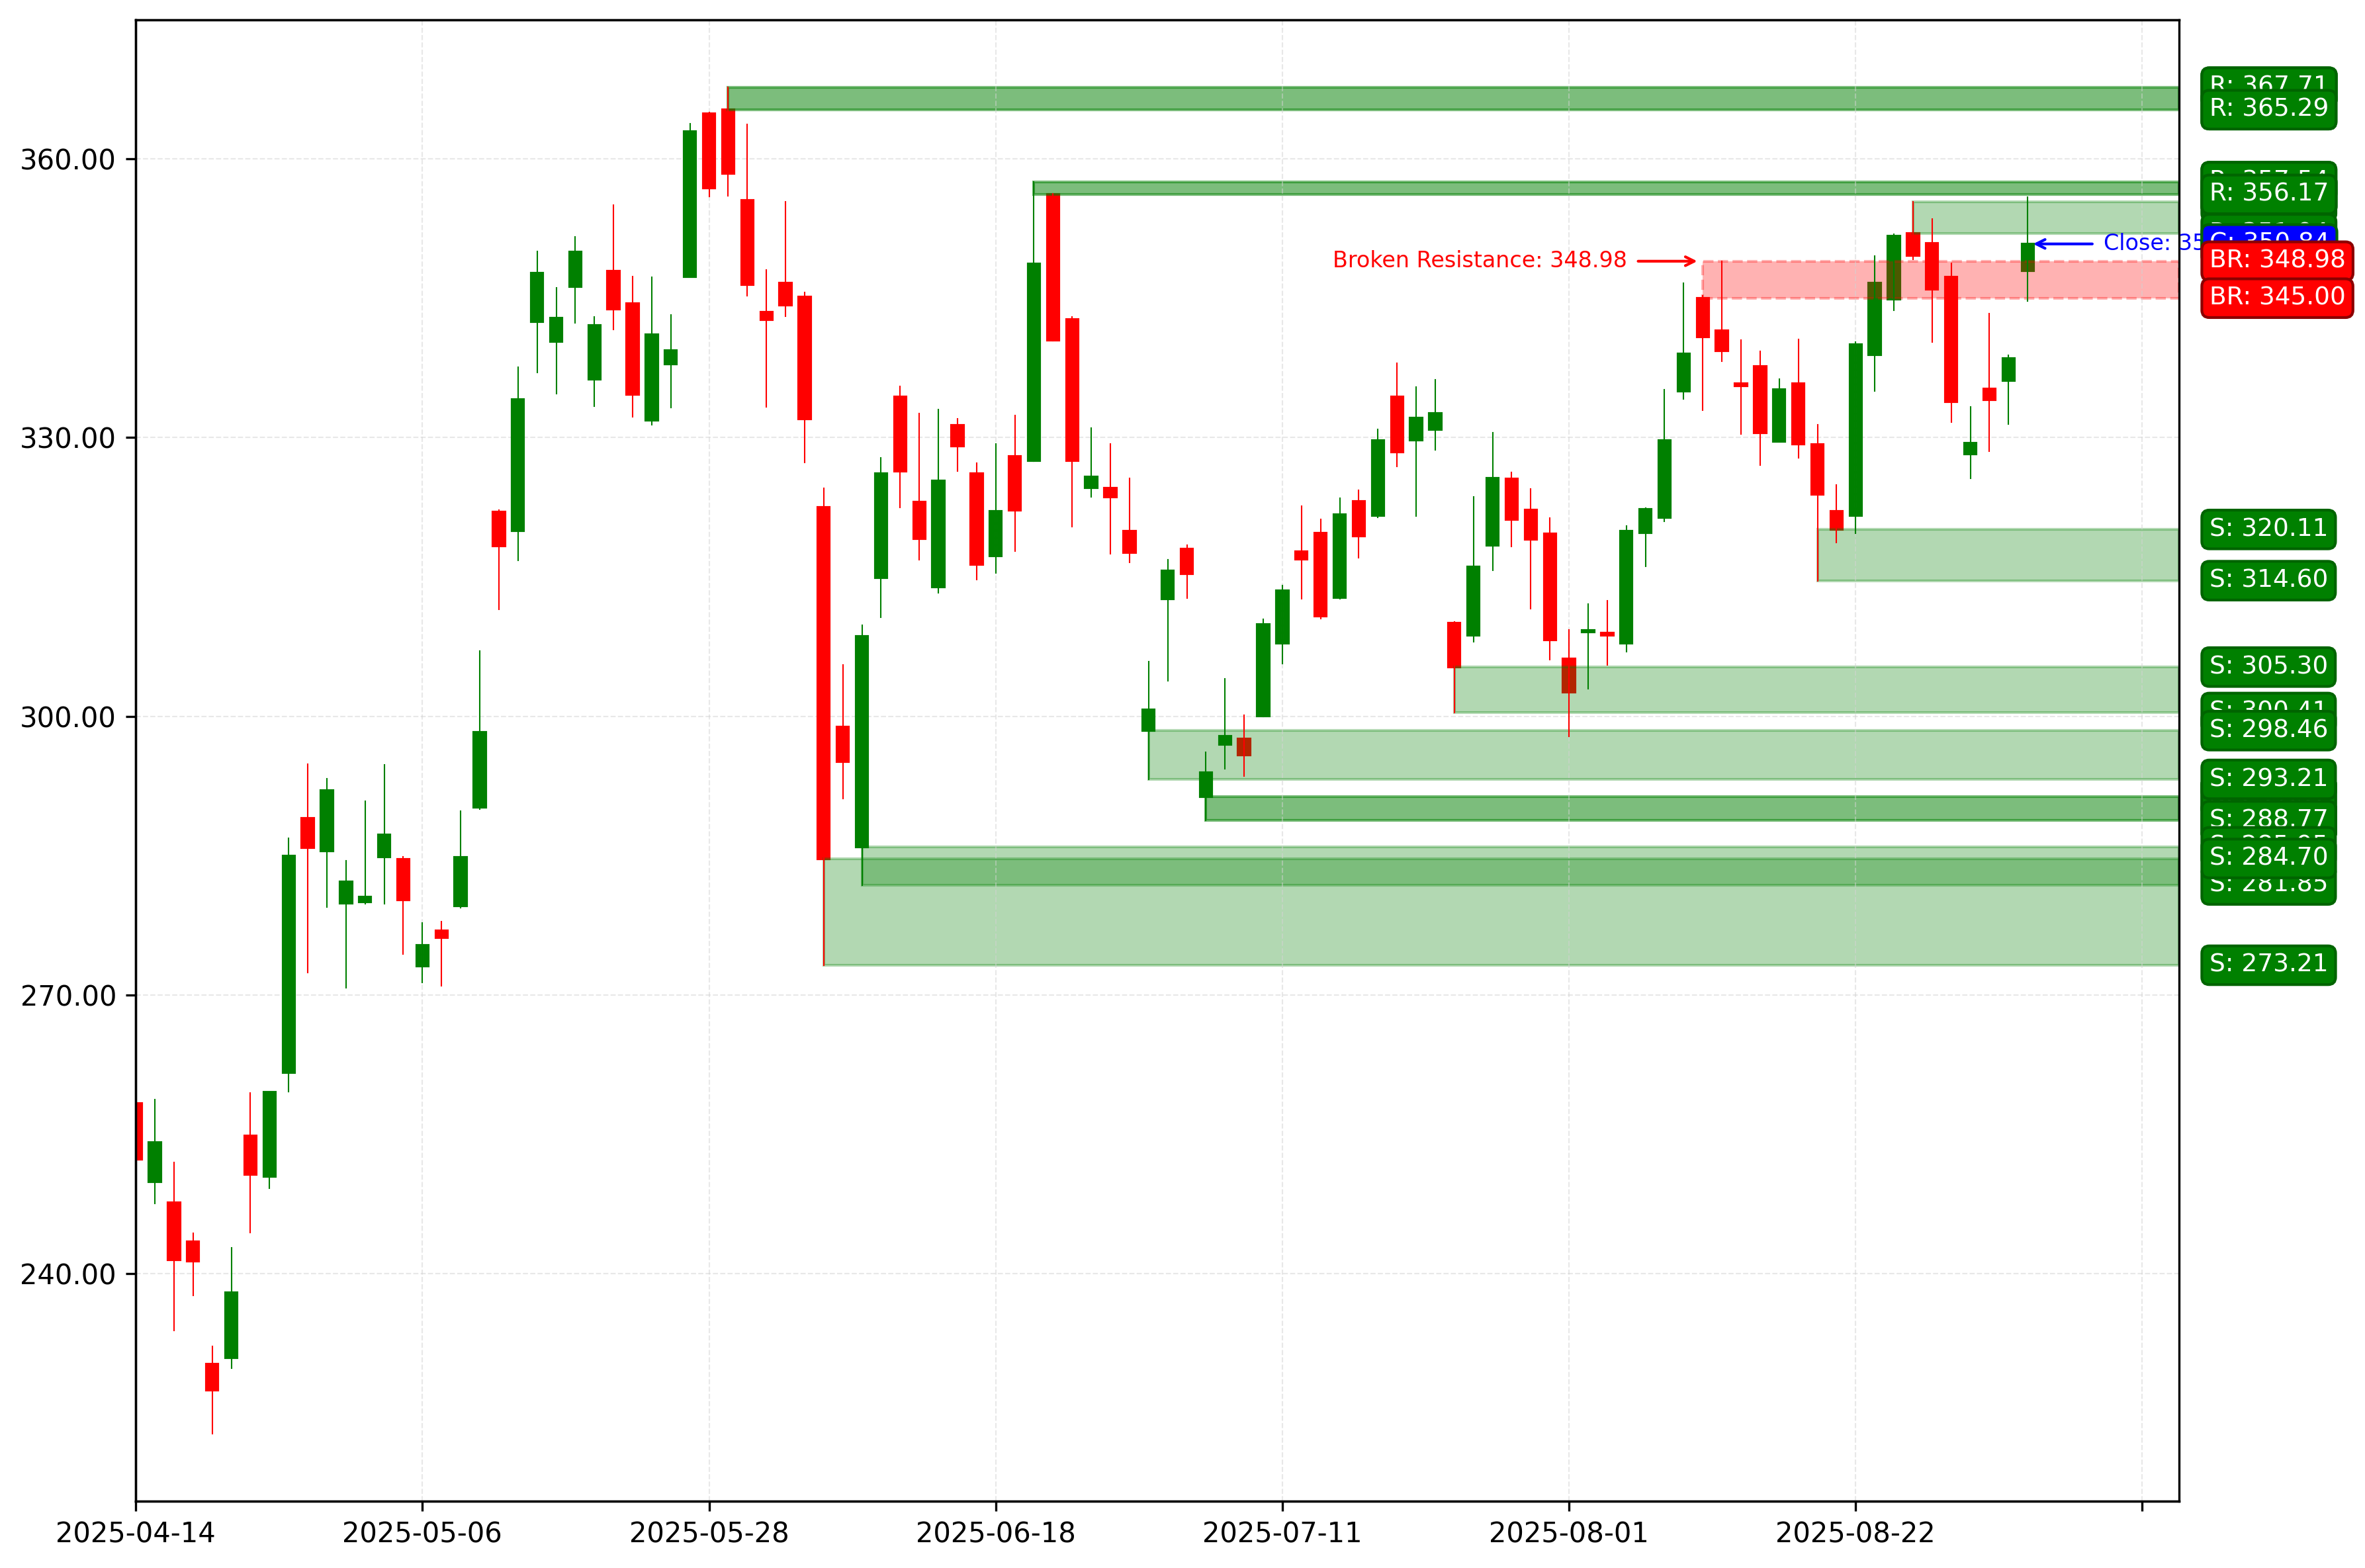
TSLA. Technical Analysis. D1.
Summary
In the medium term, GBPUSD, USDJPY, and BTC show the most attractive profit-to-risk ratio and a nearly completed correction on the daily timeframe.
Soon, EURUSD, USDCHF, USDCAD, AAPL, and TSLA may be worthy of attention depending on the depth of the market correction.