
We examine the most important levels for key financial instruments and likely scenarios for developments.
Key Topics
- Euro (EURUSD)
- British Pound (GBPUSD)
- Swiss Franc (USDCHF)
- Japanese Yen (USDJPY)
- Canadian Dollar (USDCAD)
- Australian Dollar (AUDUSD)
- New Zealand Dollar (NZDUSD)
- Bitcoin (BTC)
- Ether (ETH)
- Apple Inc (AAPL)
- NVIDIA Corp (NVDA)
- Tesla Inc (TSLA)
- Summary
Euro (EURUSD)
Bullish trend continues, a corrective wave is developing again. An entry point for buying on rebound may form after the current correction completes. The last broken level is resistance (1.1539 — 1.1555). The breakout occurred 11 candlesticks ago.
Intermediate target for the upward movement is the resistance level with boundaries 1.1588 — 1.1627. In case of successful trend development, a further target will be at the resistance level with boundaries 1.1813 — 1.1828.
If the correction completes near the support level (1.1442 — 1.1465), the potential profit/risk ratio may be approximately 1.2:1. When using a further target — around 3:1.
Long positions will remain relevant, as long as the market is above the nearest support level with boundaries 1.1442 — 1.1465. If the market successfully closes below this support, the trend will reverse to the opposite (bearish).
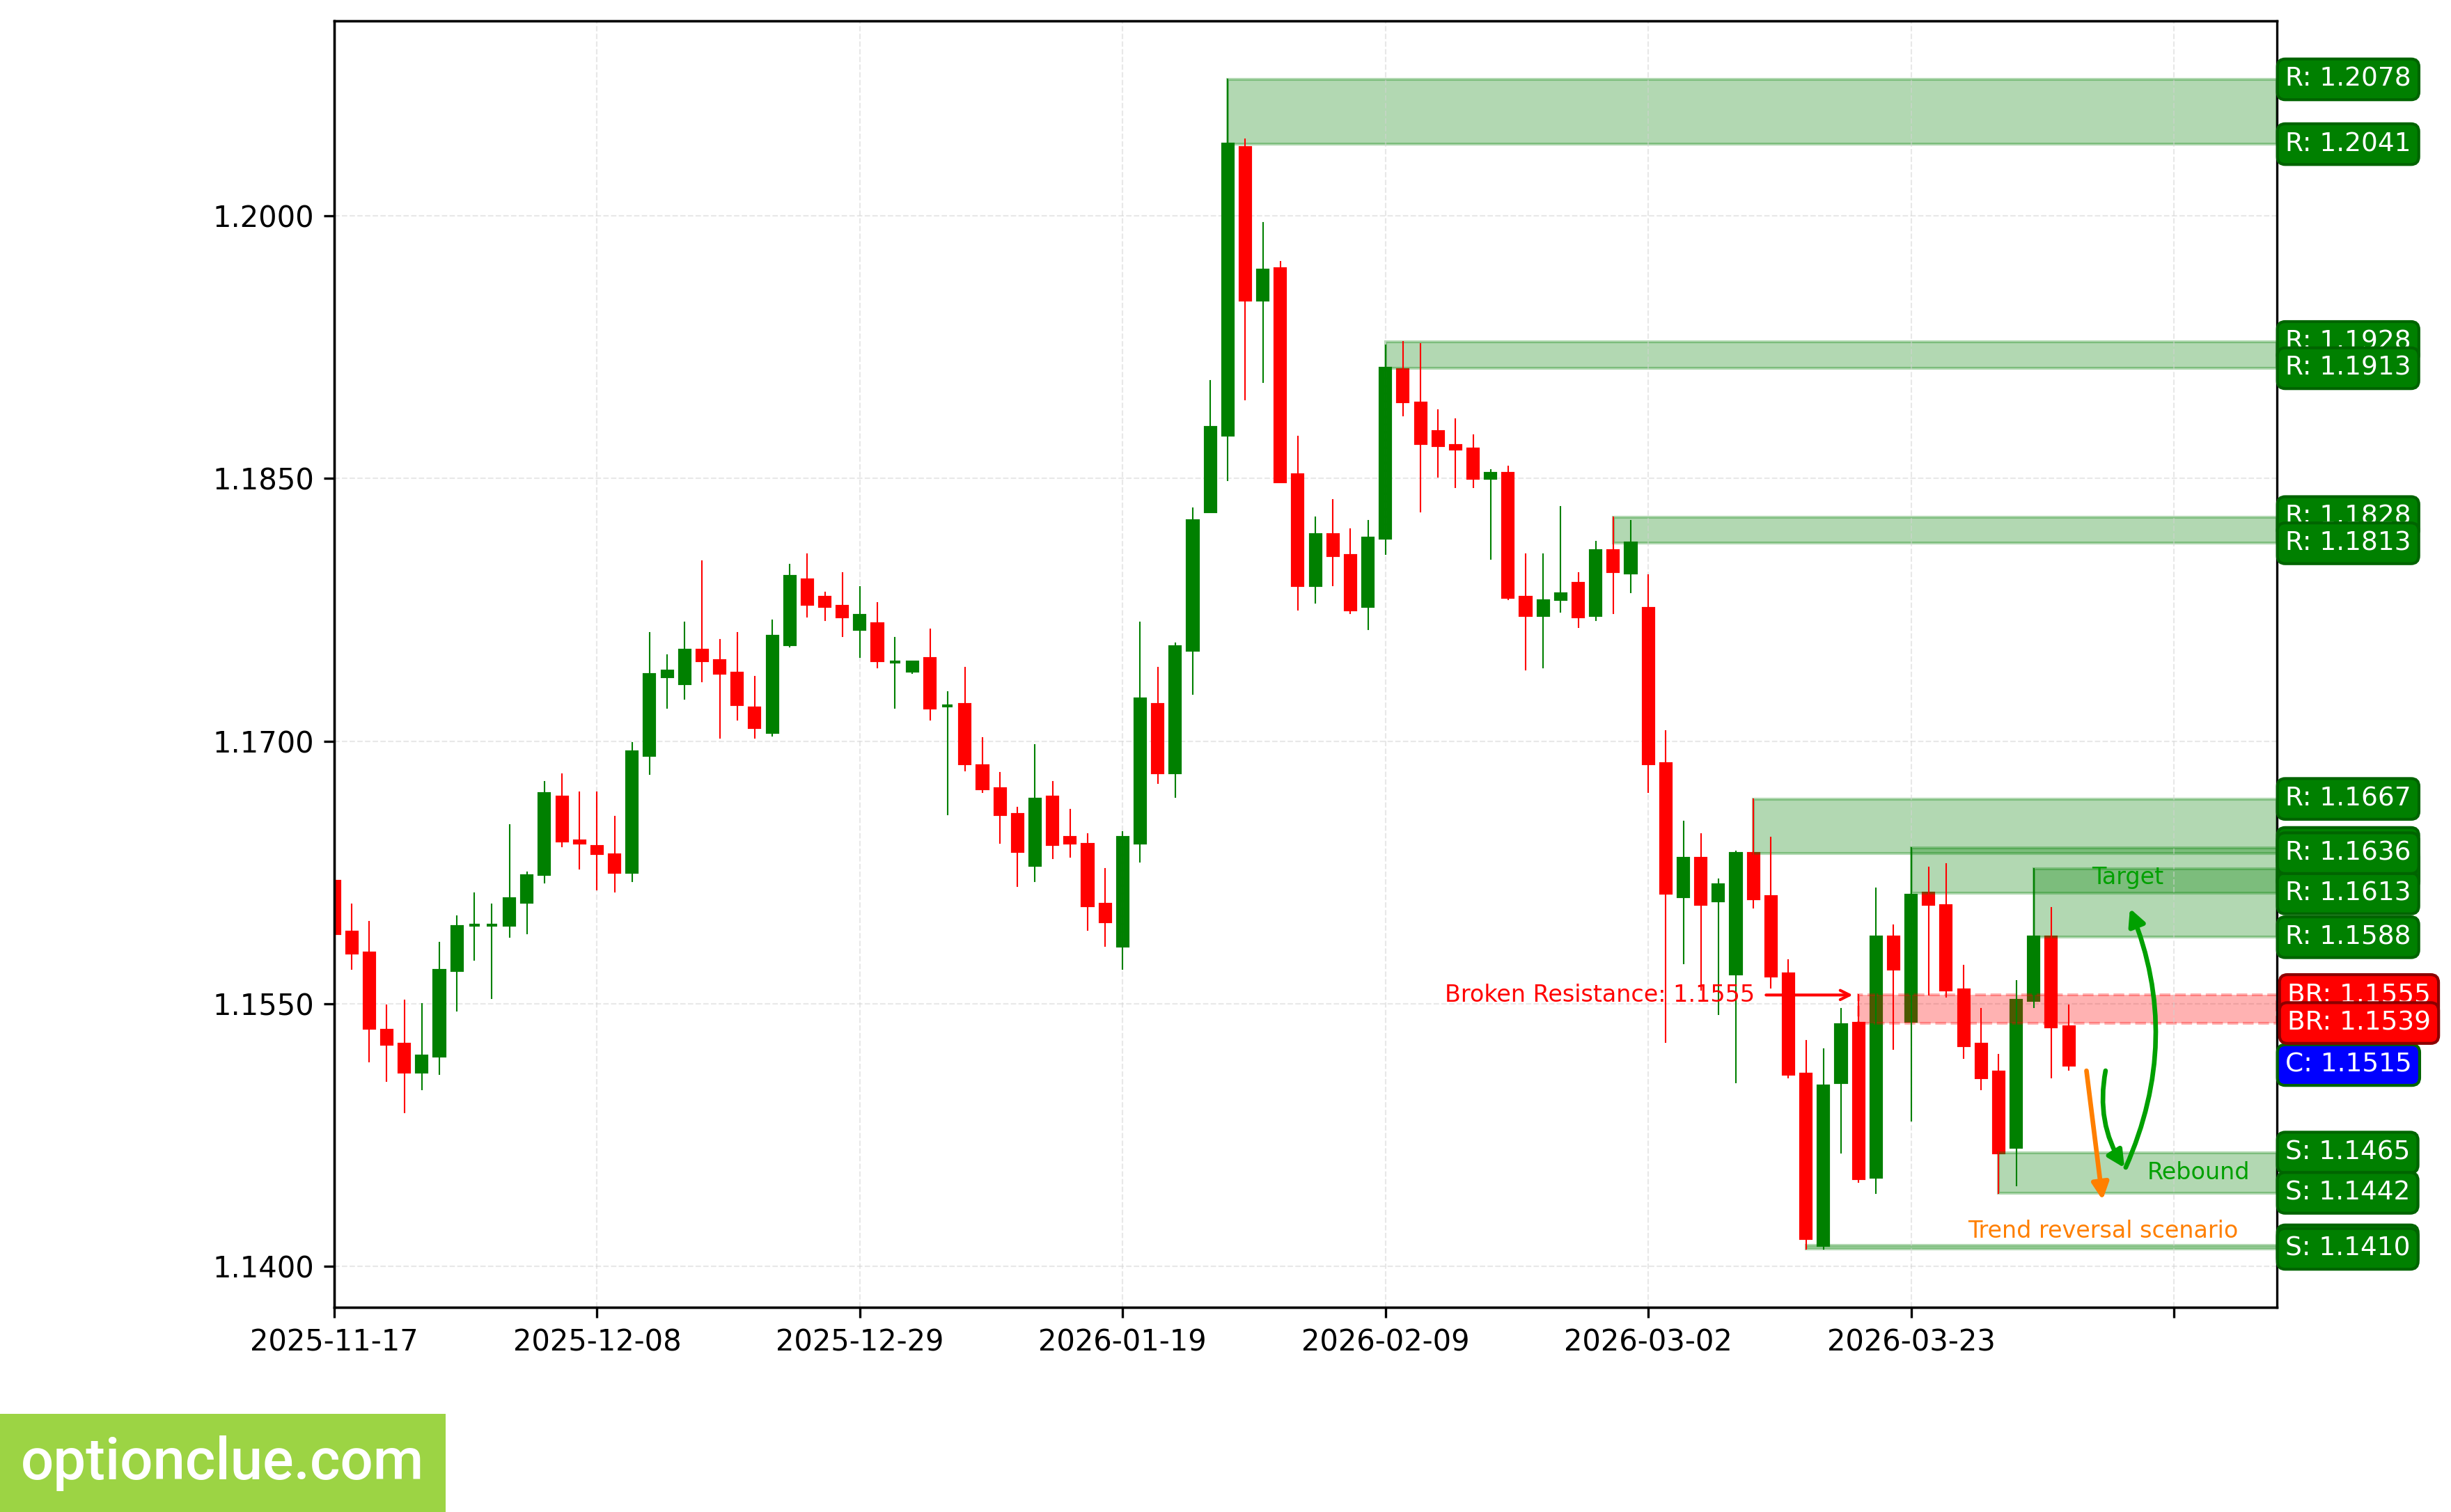
EURUSD. Technical analysis. D1.
British Pound (GBPUSD)
Trend has turned bearish, when 5 candlesticks ago the support level (1.3215 — 1.3222) was broken. 2 candlesticks ago, the correction likely completed, an impulse wave is developing.
Intermediate target for the downward movement is the support level with boundaries 1.3156 — 1.3185.
Potential profit/risk ratio from current prices when setting targets and fixing risks based on daily timeframe levels may be less than 0.1:1.
Short positions will remain relevant, as long as the market remains below the nearest resistance level with boundaries 1.3304 — 1.3346. If the market successfully closes above this nearest resistance, the trend will reverse to the opposite (bullish).
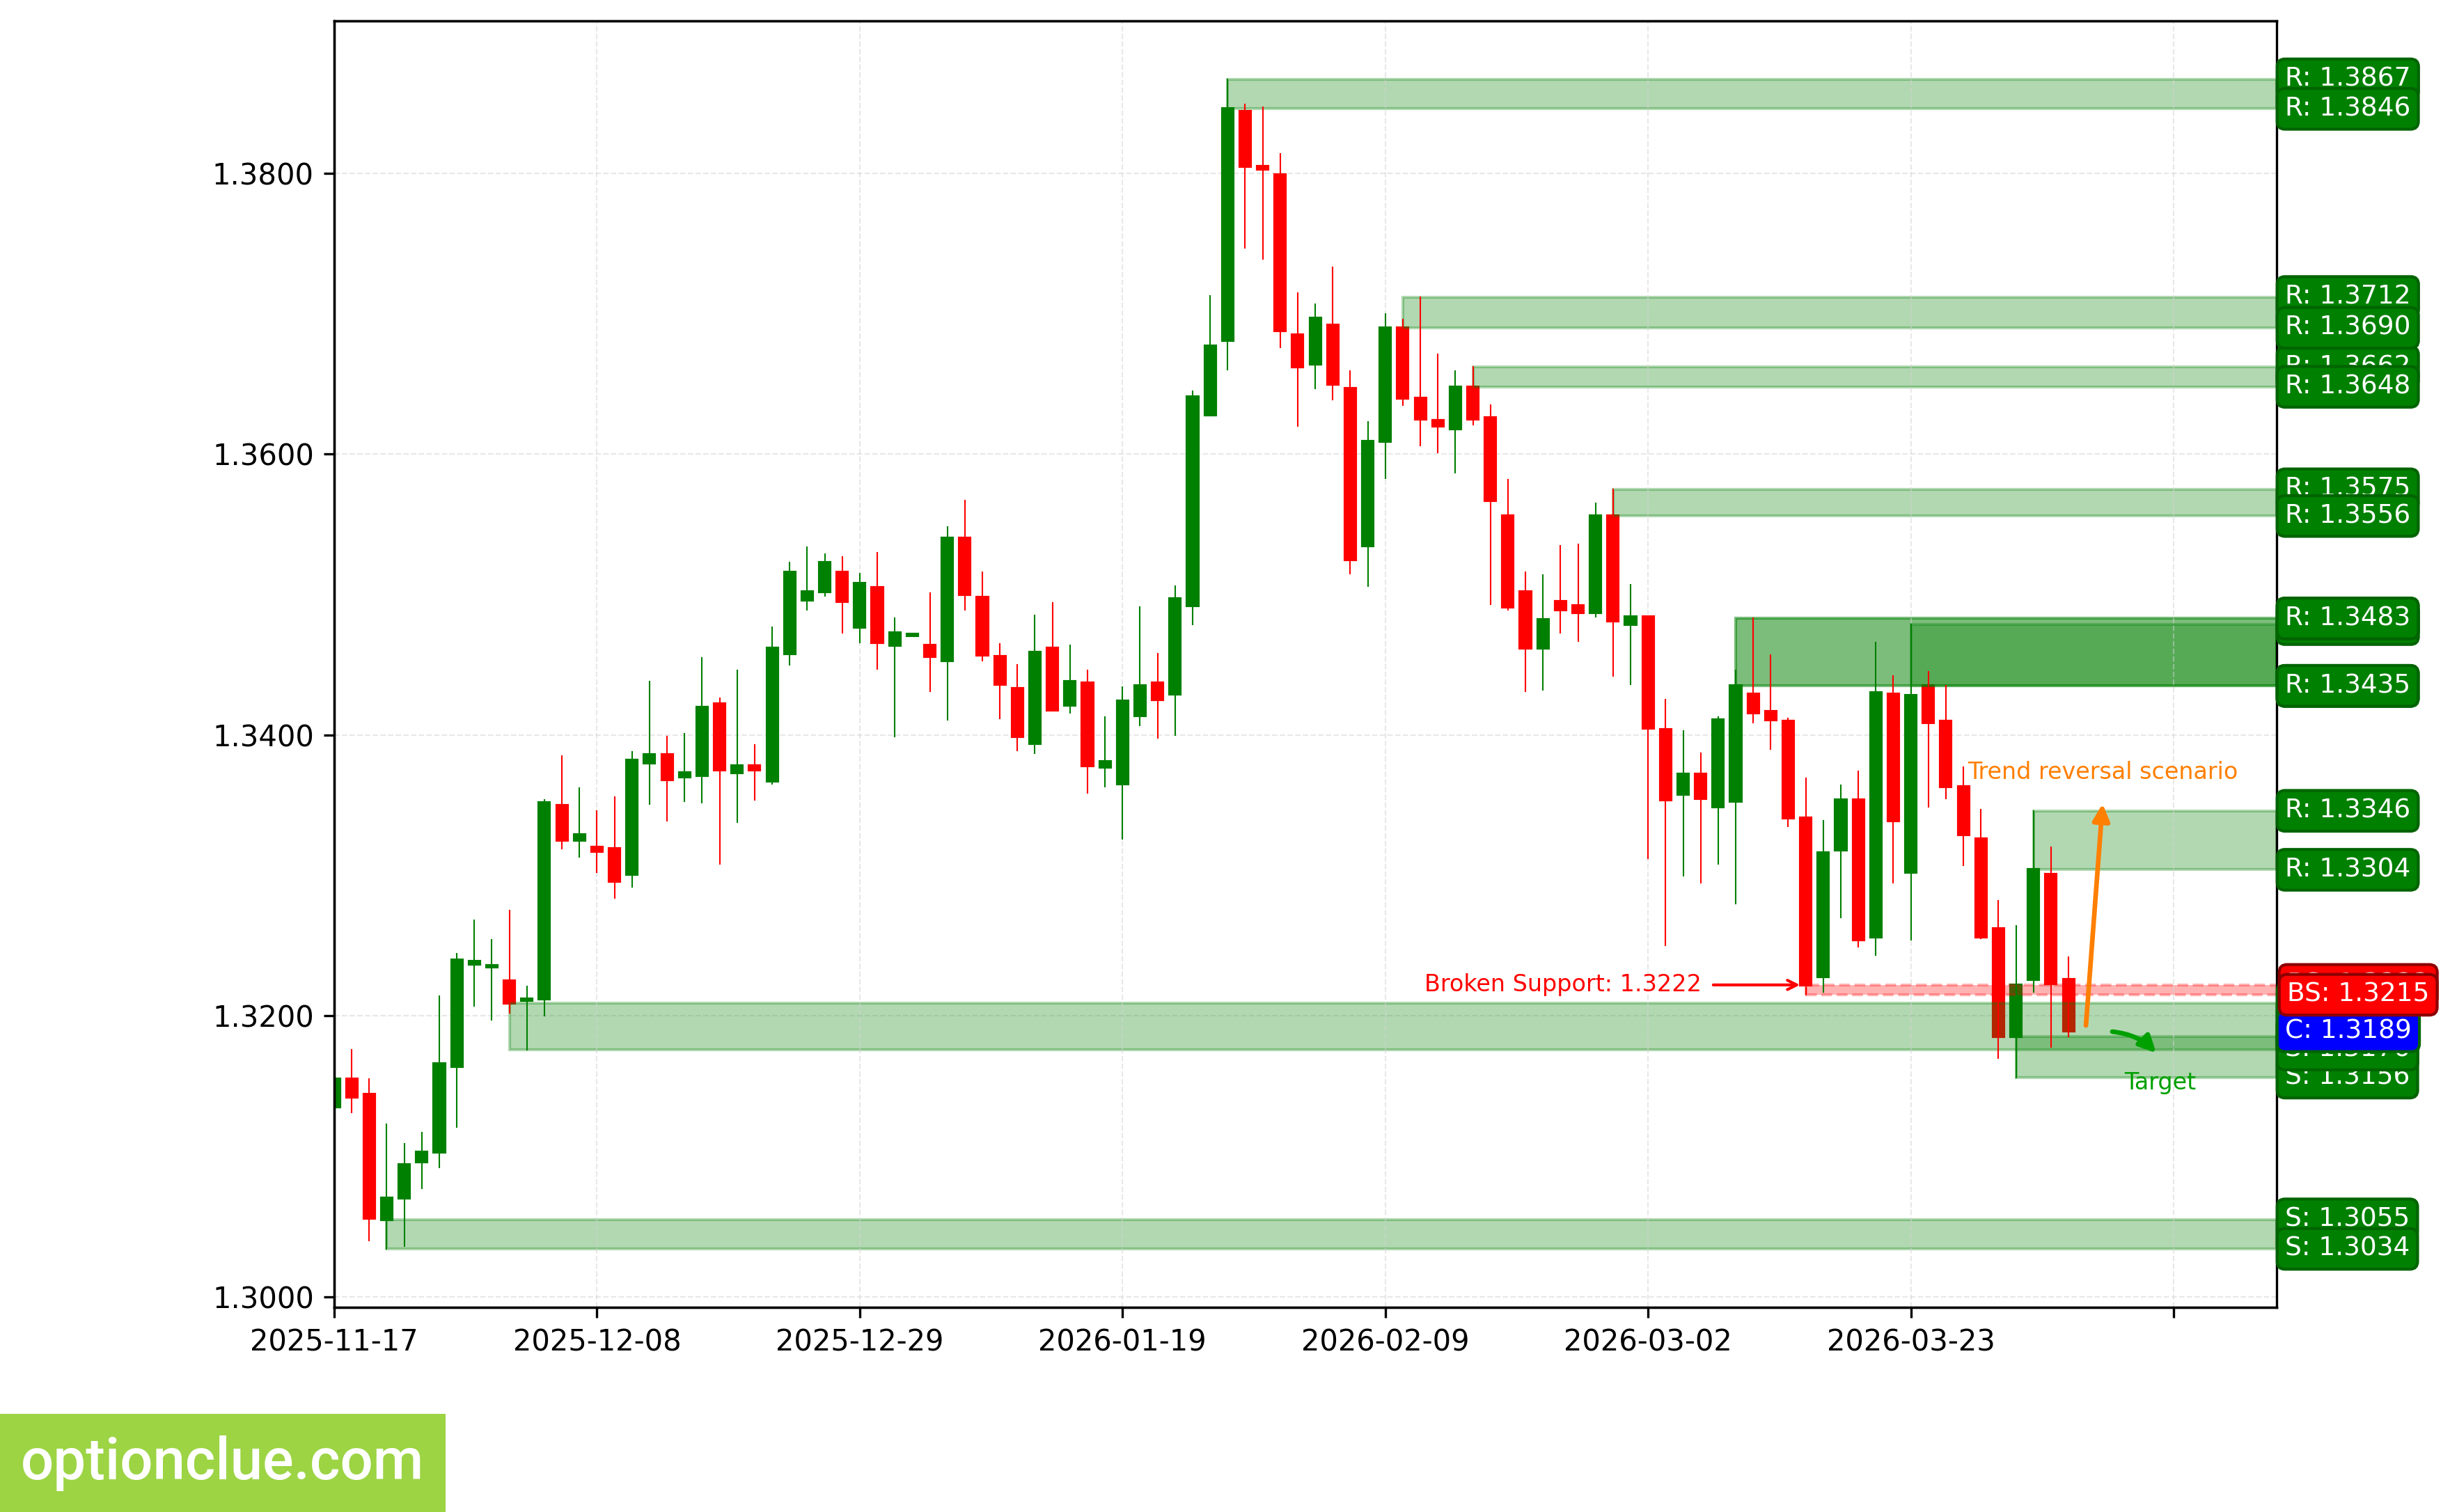
GBPUSD. Technical analysis. D1.
Swiss Franc (USDCHF)
Bullish trend continues, 2 candlesticks ago, the correction likely completed, an impulse wave is developing. The last broken level is resistance (0.7933 — 0.7957). The breakout occurred 6 candlesticks ago.
Intermediate target for the upward movement is the resistance level with boundaries 0.8033 — 0.8040. In case of successful trend development, a further target will be at the resistance level with boundaries 0.8087 — 0.8101.
Potential profit/risk ratio from current prices when setting targets and fixing risks based on daily timeframe levels may be small (around 0.1:1). When using a further target — also small (approximately 0.3:1).
Long positions will remain relevant, as long as the market remains above the nearest support level with boundaries 0.7832 — 0.7861. If the market successfully closes below this nearest support, the trend will reverse to the opposite (bearish).
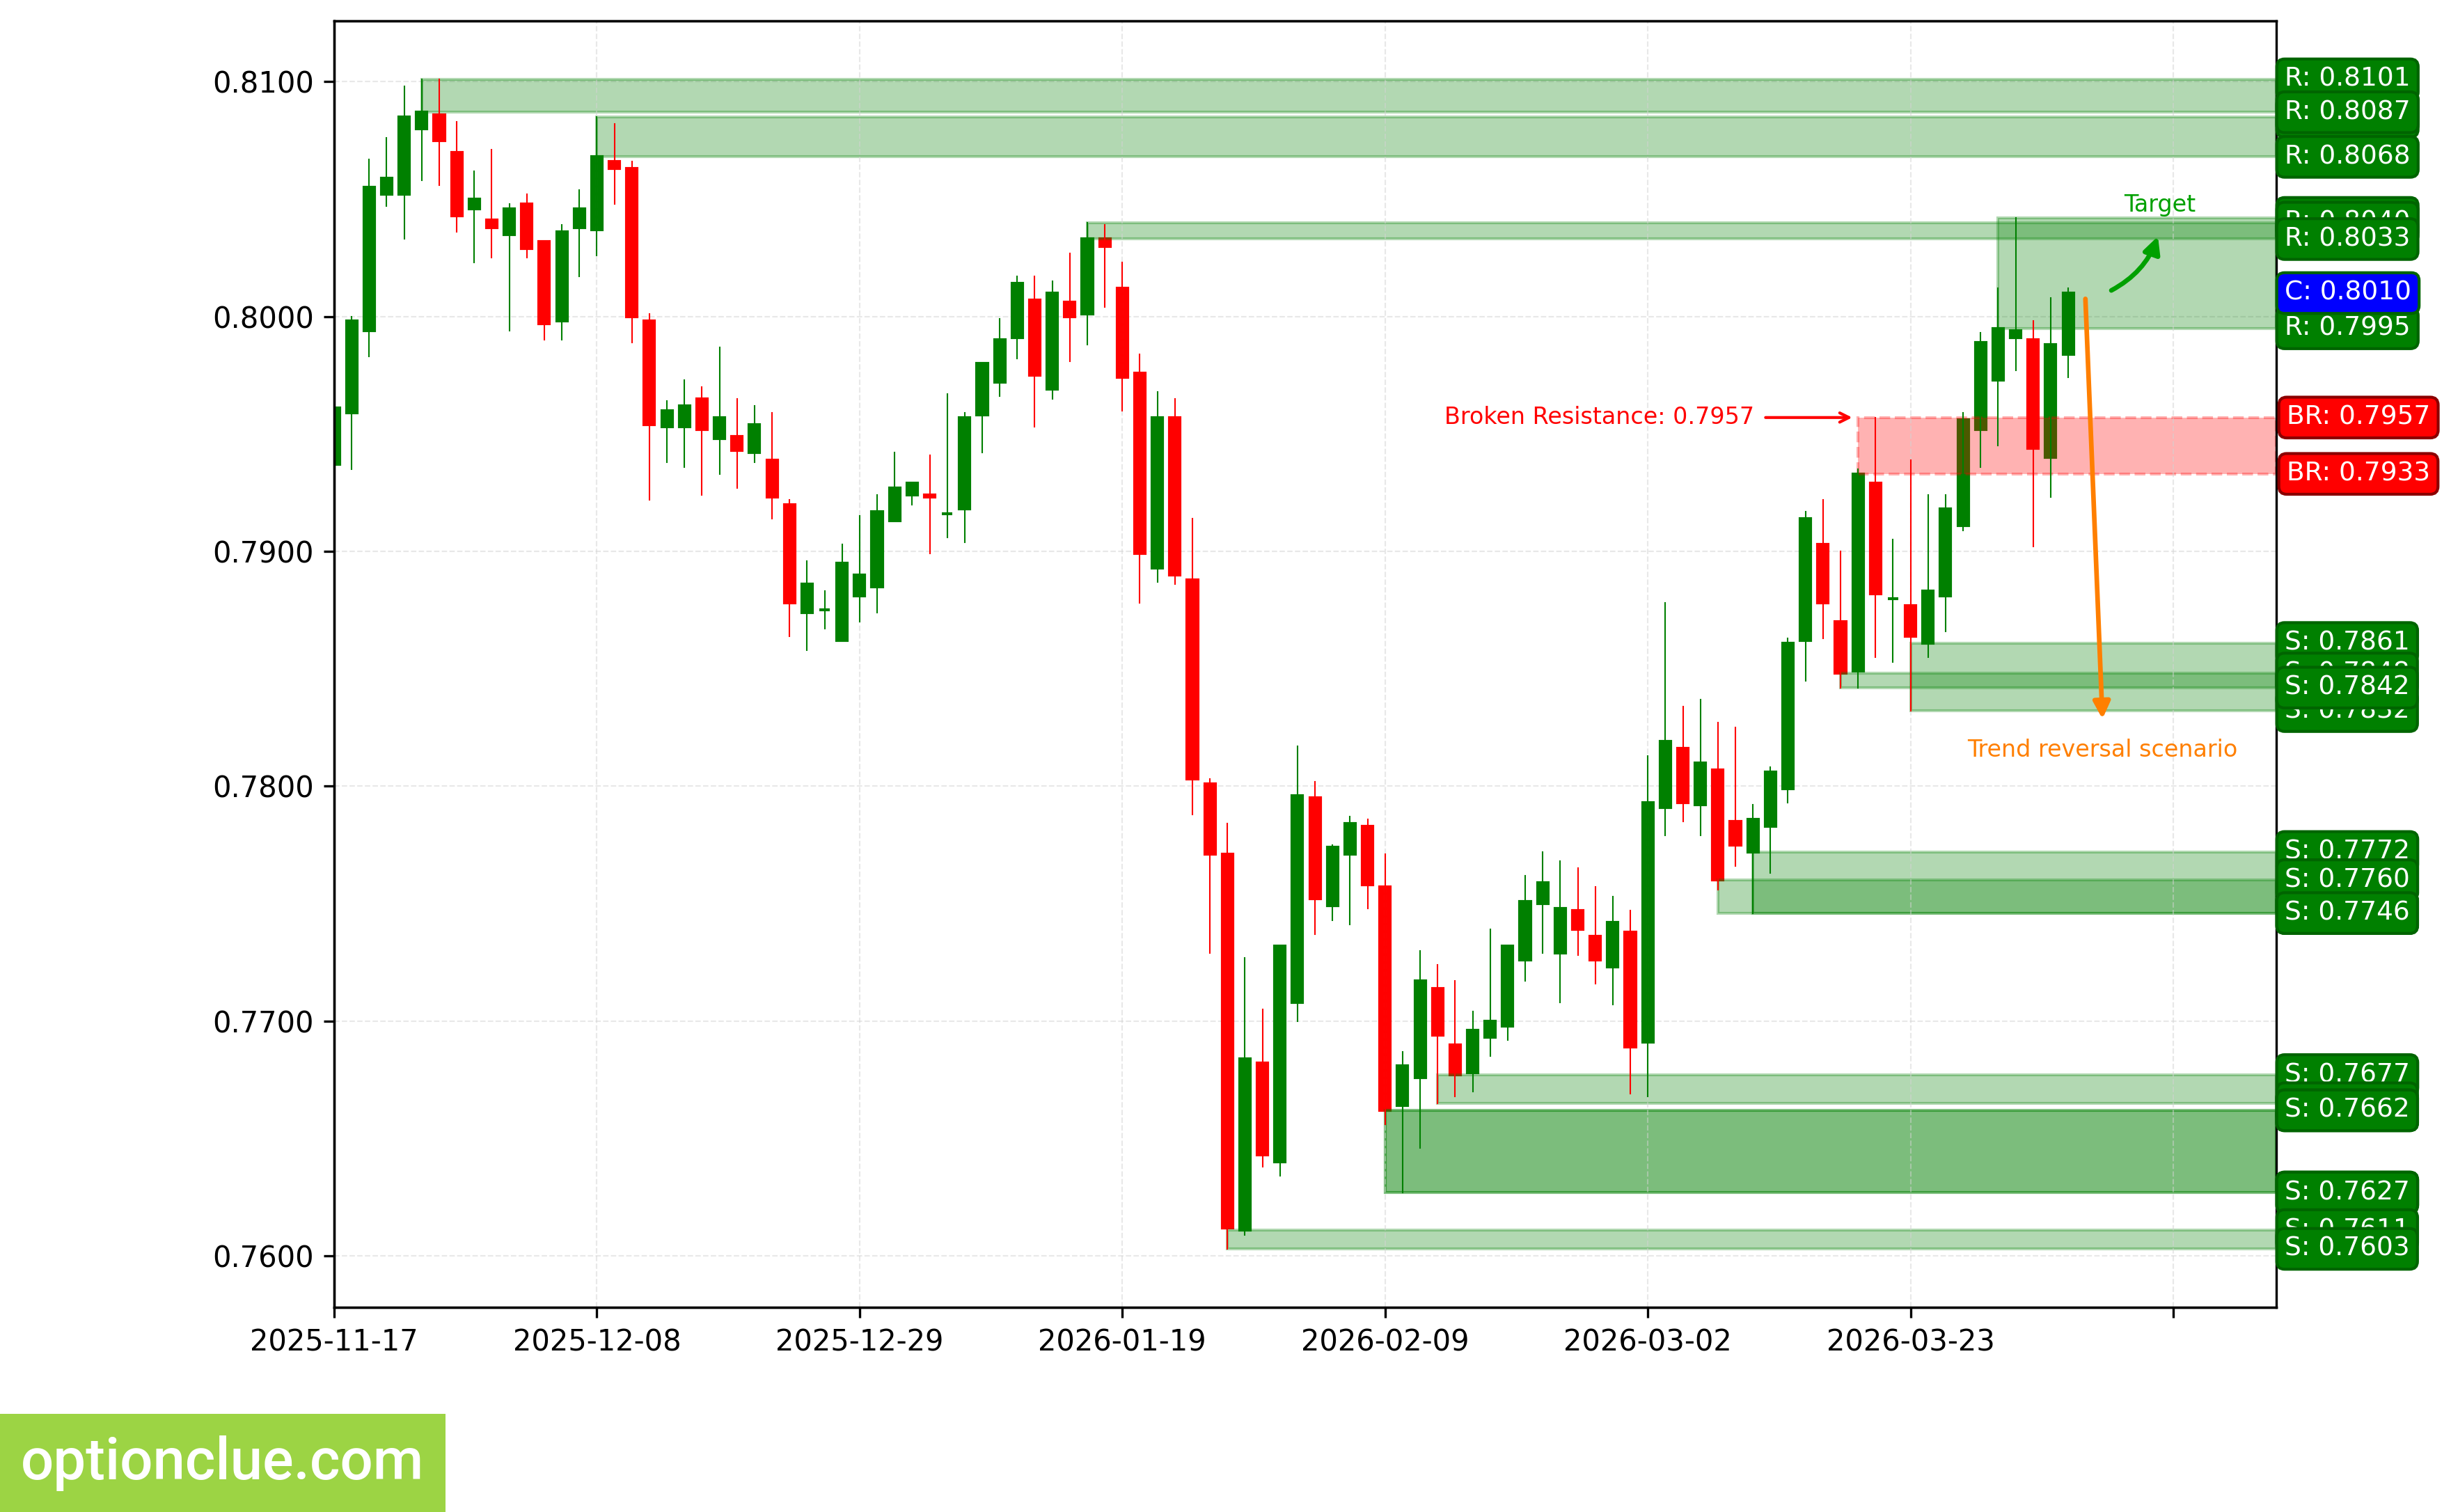
USDCHF. Technical analysis. D1.
Japanese Yen (USDJPY)
Bullish trend continues, 3 candlesticks ago the correction completed, an impulse wave is developing. The last broken level is resistance (159.71 — 159.74). The breakout occurred 13 candlesticks ago.
Intermediate target for the upward movement is the resistance level with boundaries 160.31 — 160.46.
Potential profit/risk ratio from current prices when setting targets and fixing risks based on daily timeframe levels may be small (around 0.3:1).
Long positions will remain relevant, as long as the market remains above the nearest support level with boundaries 158.25 — 158.70. If the market successfully closes below this support, the trend will reverse to the opposite (bearish).
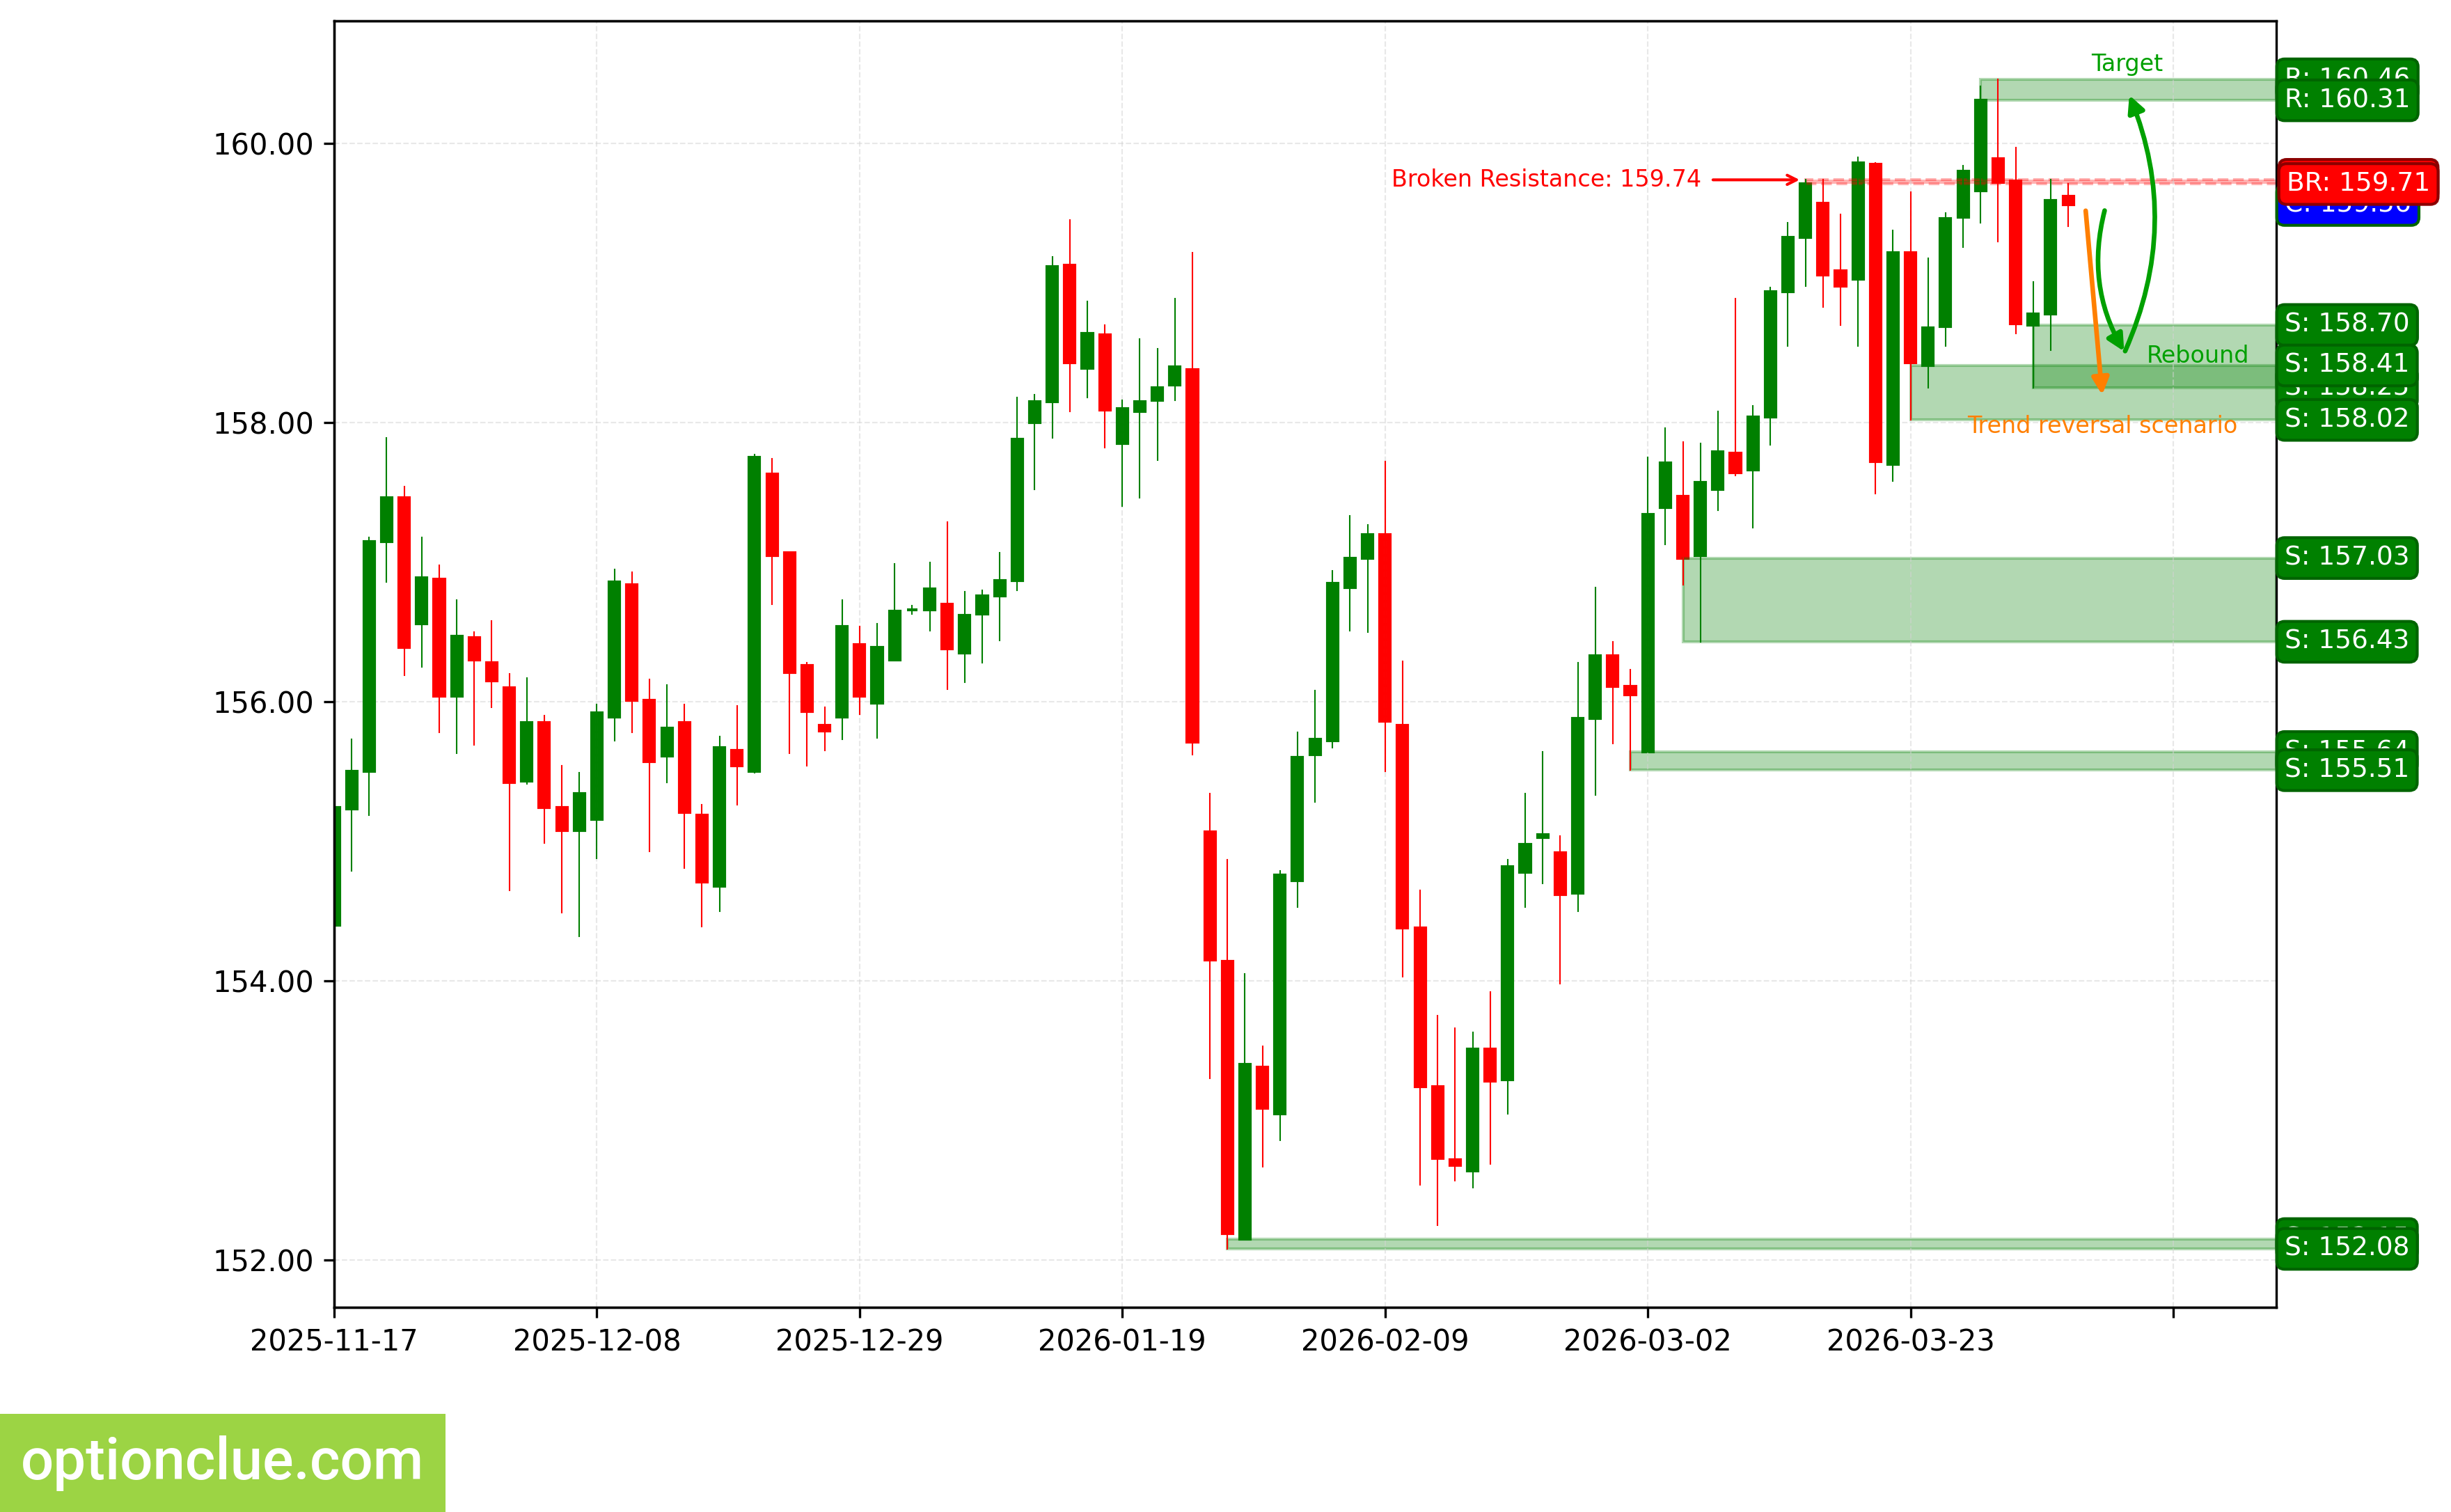
USDJPY. Technical analysis. D1.
Canadian Dollar (USDCAD)
Bullish trend continues, 10 candlesticks ago the correction completed, an impulse wave is developing. The last broken level is resistance (1.3712 — 1.3724). The breakout occurred 13 candlesticks ago.
Intermediate target for the upward movement is the resistance level with boundaries 1.3956 — 1.3960. In case of successful trend development, a further target will be at the resistance level with boundaries 1.4108 — 1.4124.
Potential profit/risk ratio from current prices when setting targets and fixing risks based on daily timeframe levels may be small (around 0.1:1). When using a further target — around 1:1.
Long positions will remain relevant, as long as the market is above the nearest support level with boundaries 1.3866 — 1.3875. If the market successfully closes below this support, the trend will reverse to the opposite (bearish).
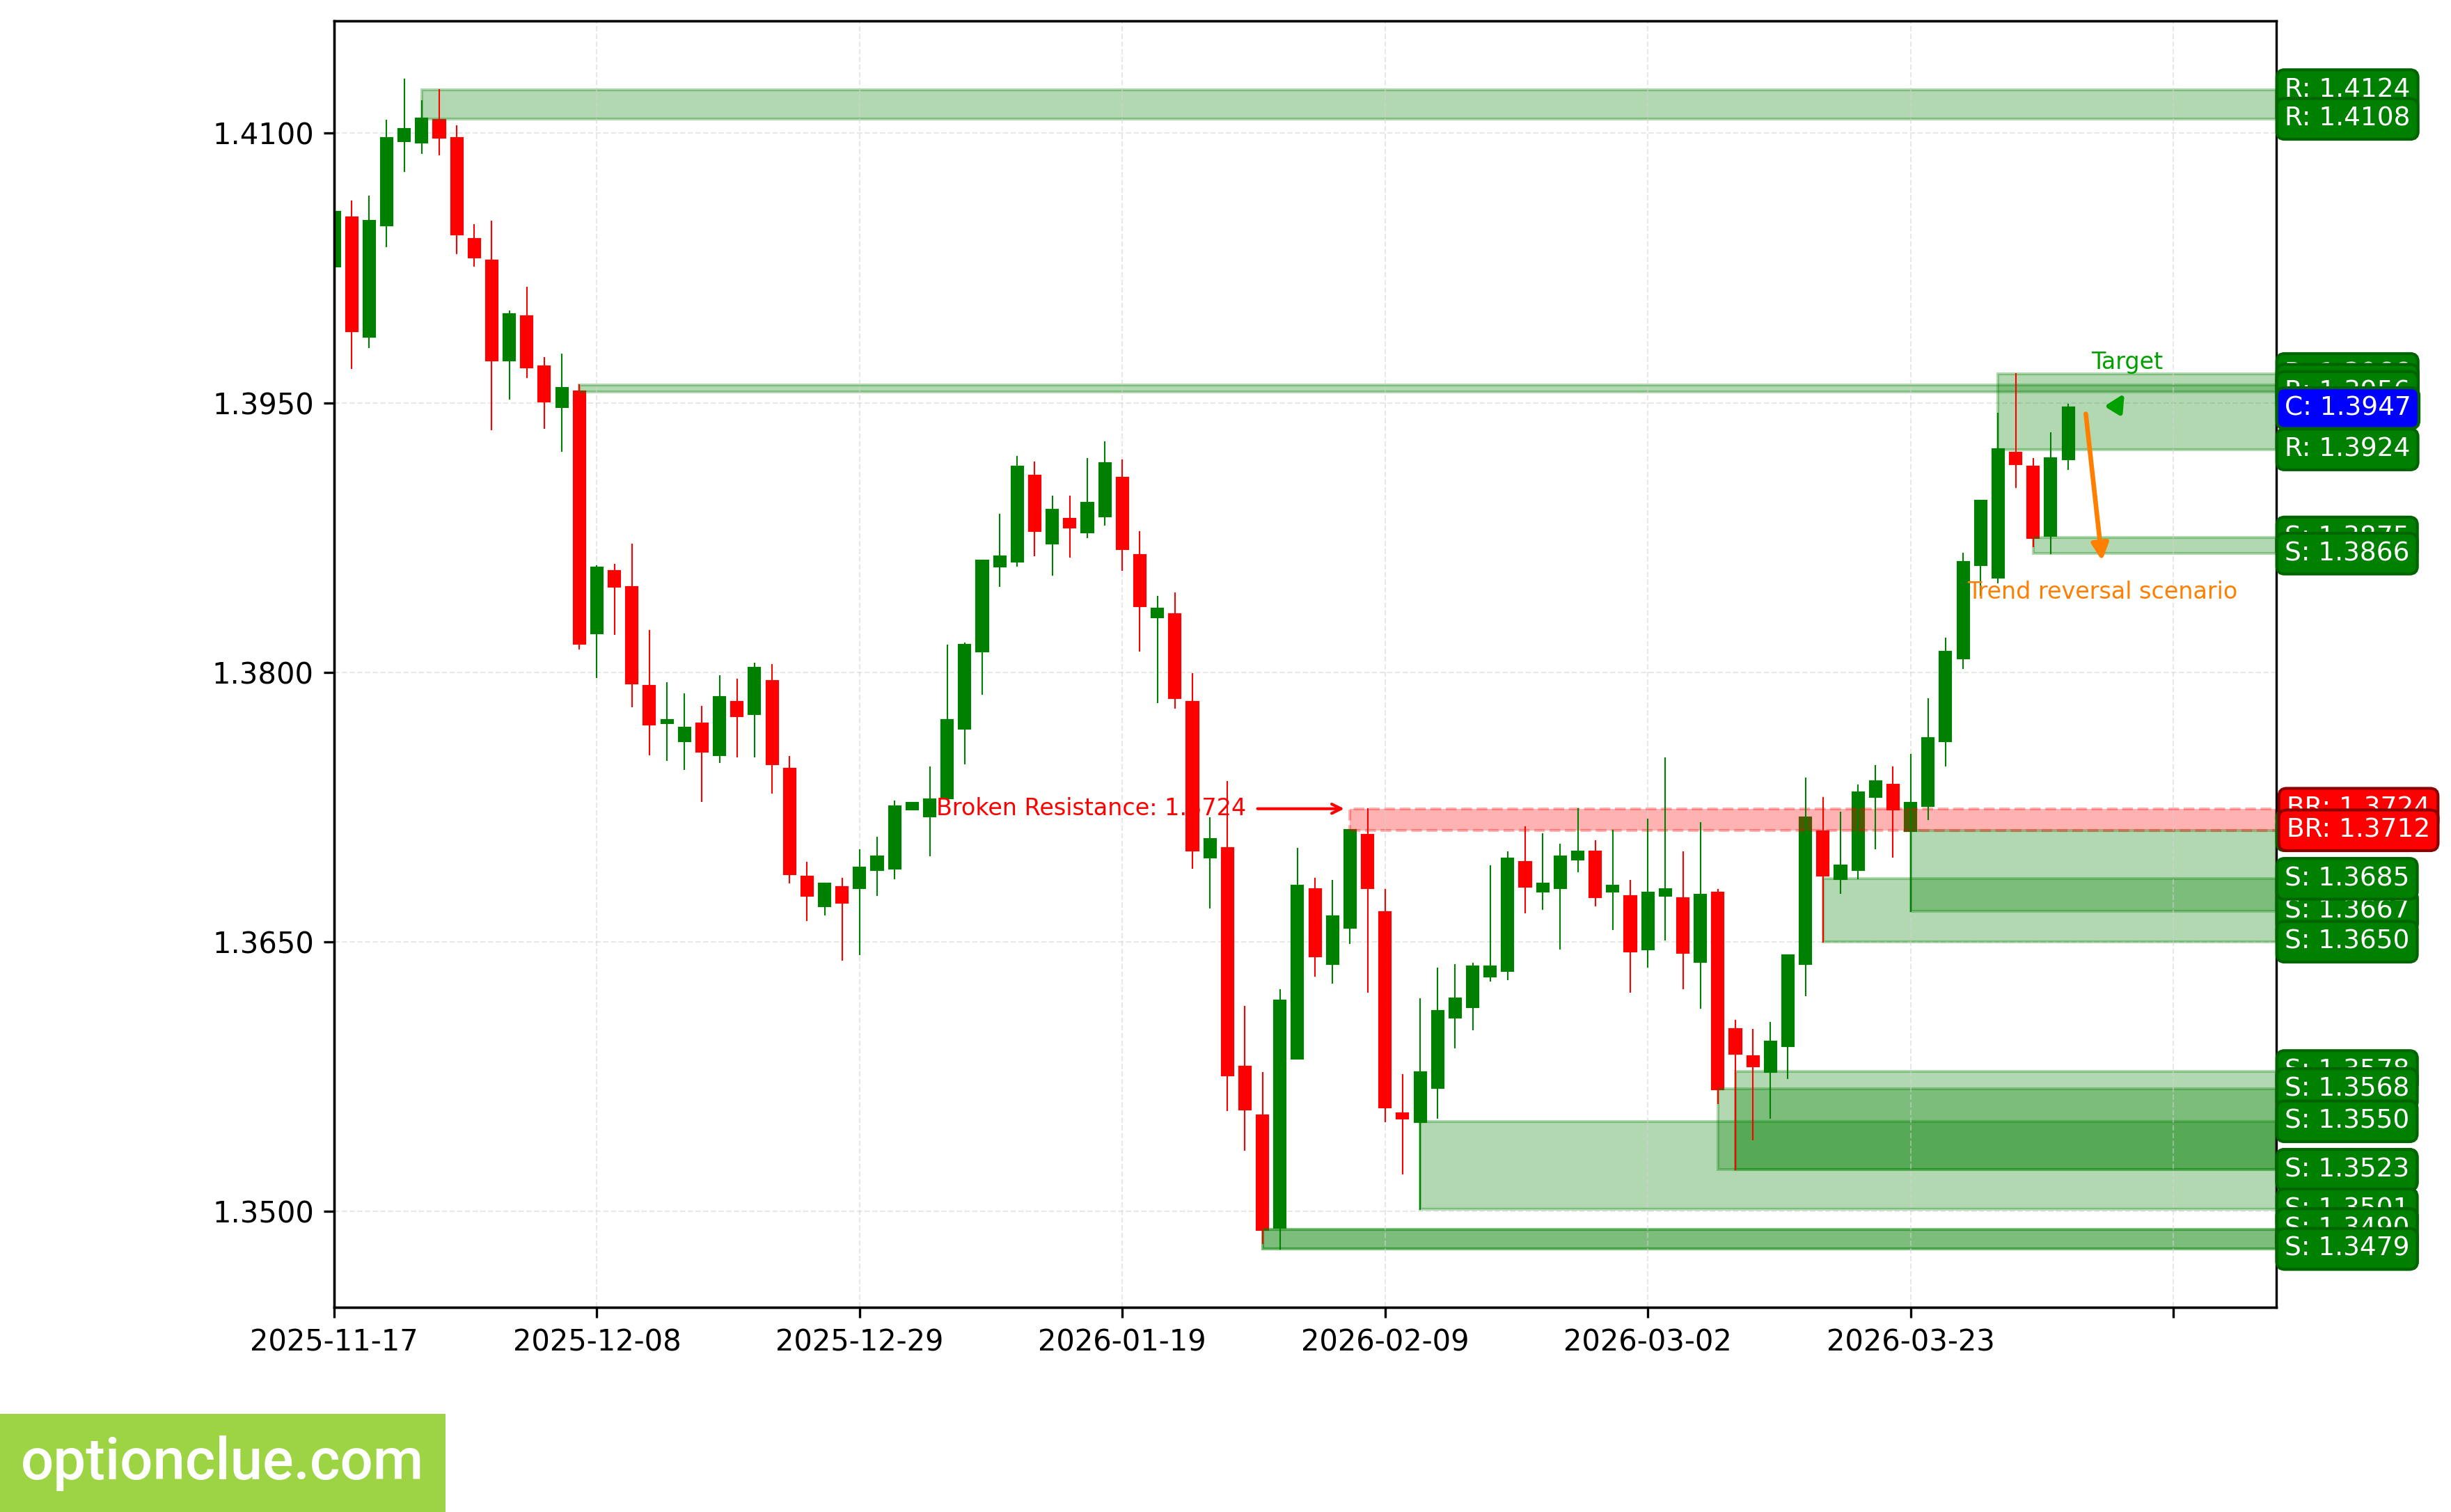
USDCAD. Technical analysis. D1.
Australian Dollar (AUDUSD)
Bearish trend continues, an impulse wave is developing. The last broken level is support (0.6977 — 0.6981). The breakout occurred 8 candlesticks ago.
Intermediate target for the downward movement is the support level with boundaries 0.6831 — 0.6851. In case of successful trend development, a further target will be at the support level with boundaries 0.6665 — 0.6679.
Potential profit/risk ratio from current prices when setting targets and fixing risks based on daily timeframe levels may be small (around 0.3:1). When using a further target — approximately 1.3:1. If a new correction completes near the resistance level (0.6929 — 0.6962), the potential profit/risk ratio may be insignificant (around 0.9:1). When using a further target — more than 2:1.
Short positions will remain relevant, as long as the market remains below the nearest resistance level with boundaries 0.6929 — 0.6962. If the market successfully closes above this nearest resistance, the trend will reverse to the opposite (bullish).
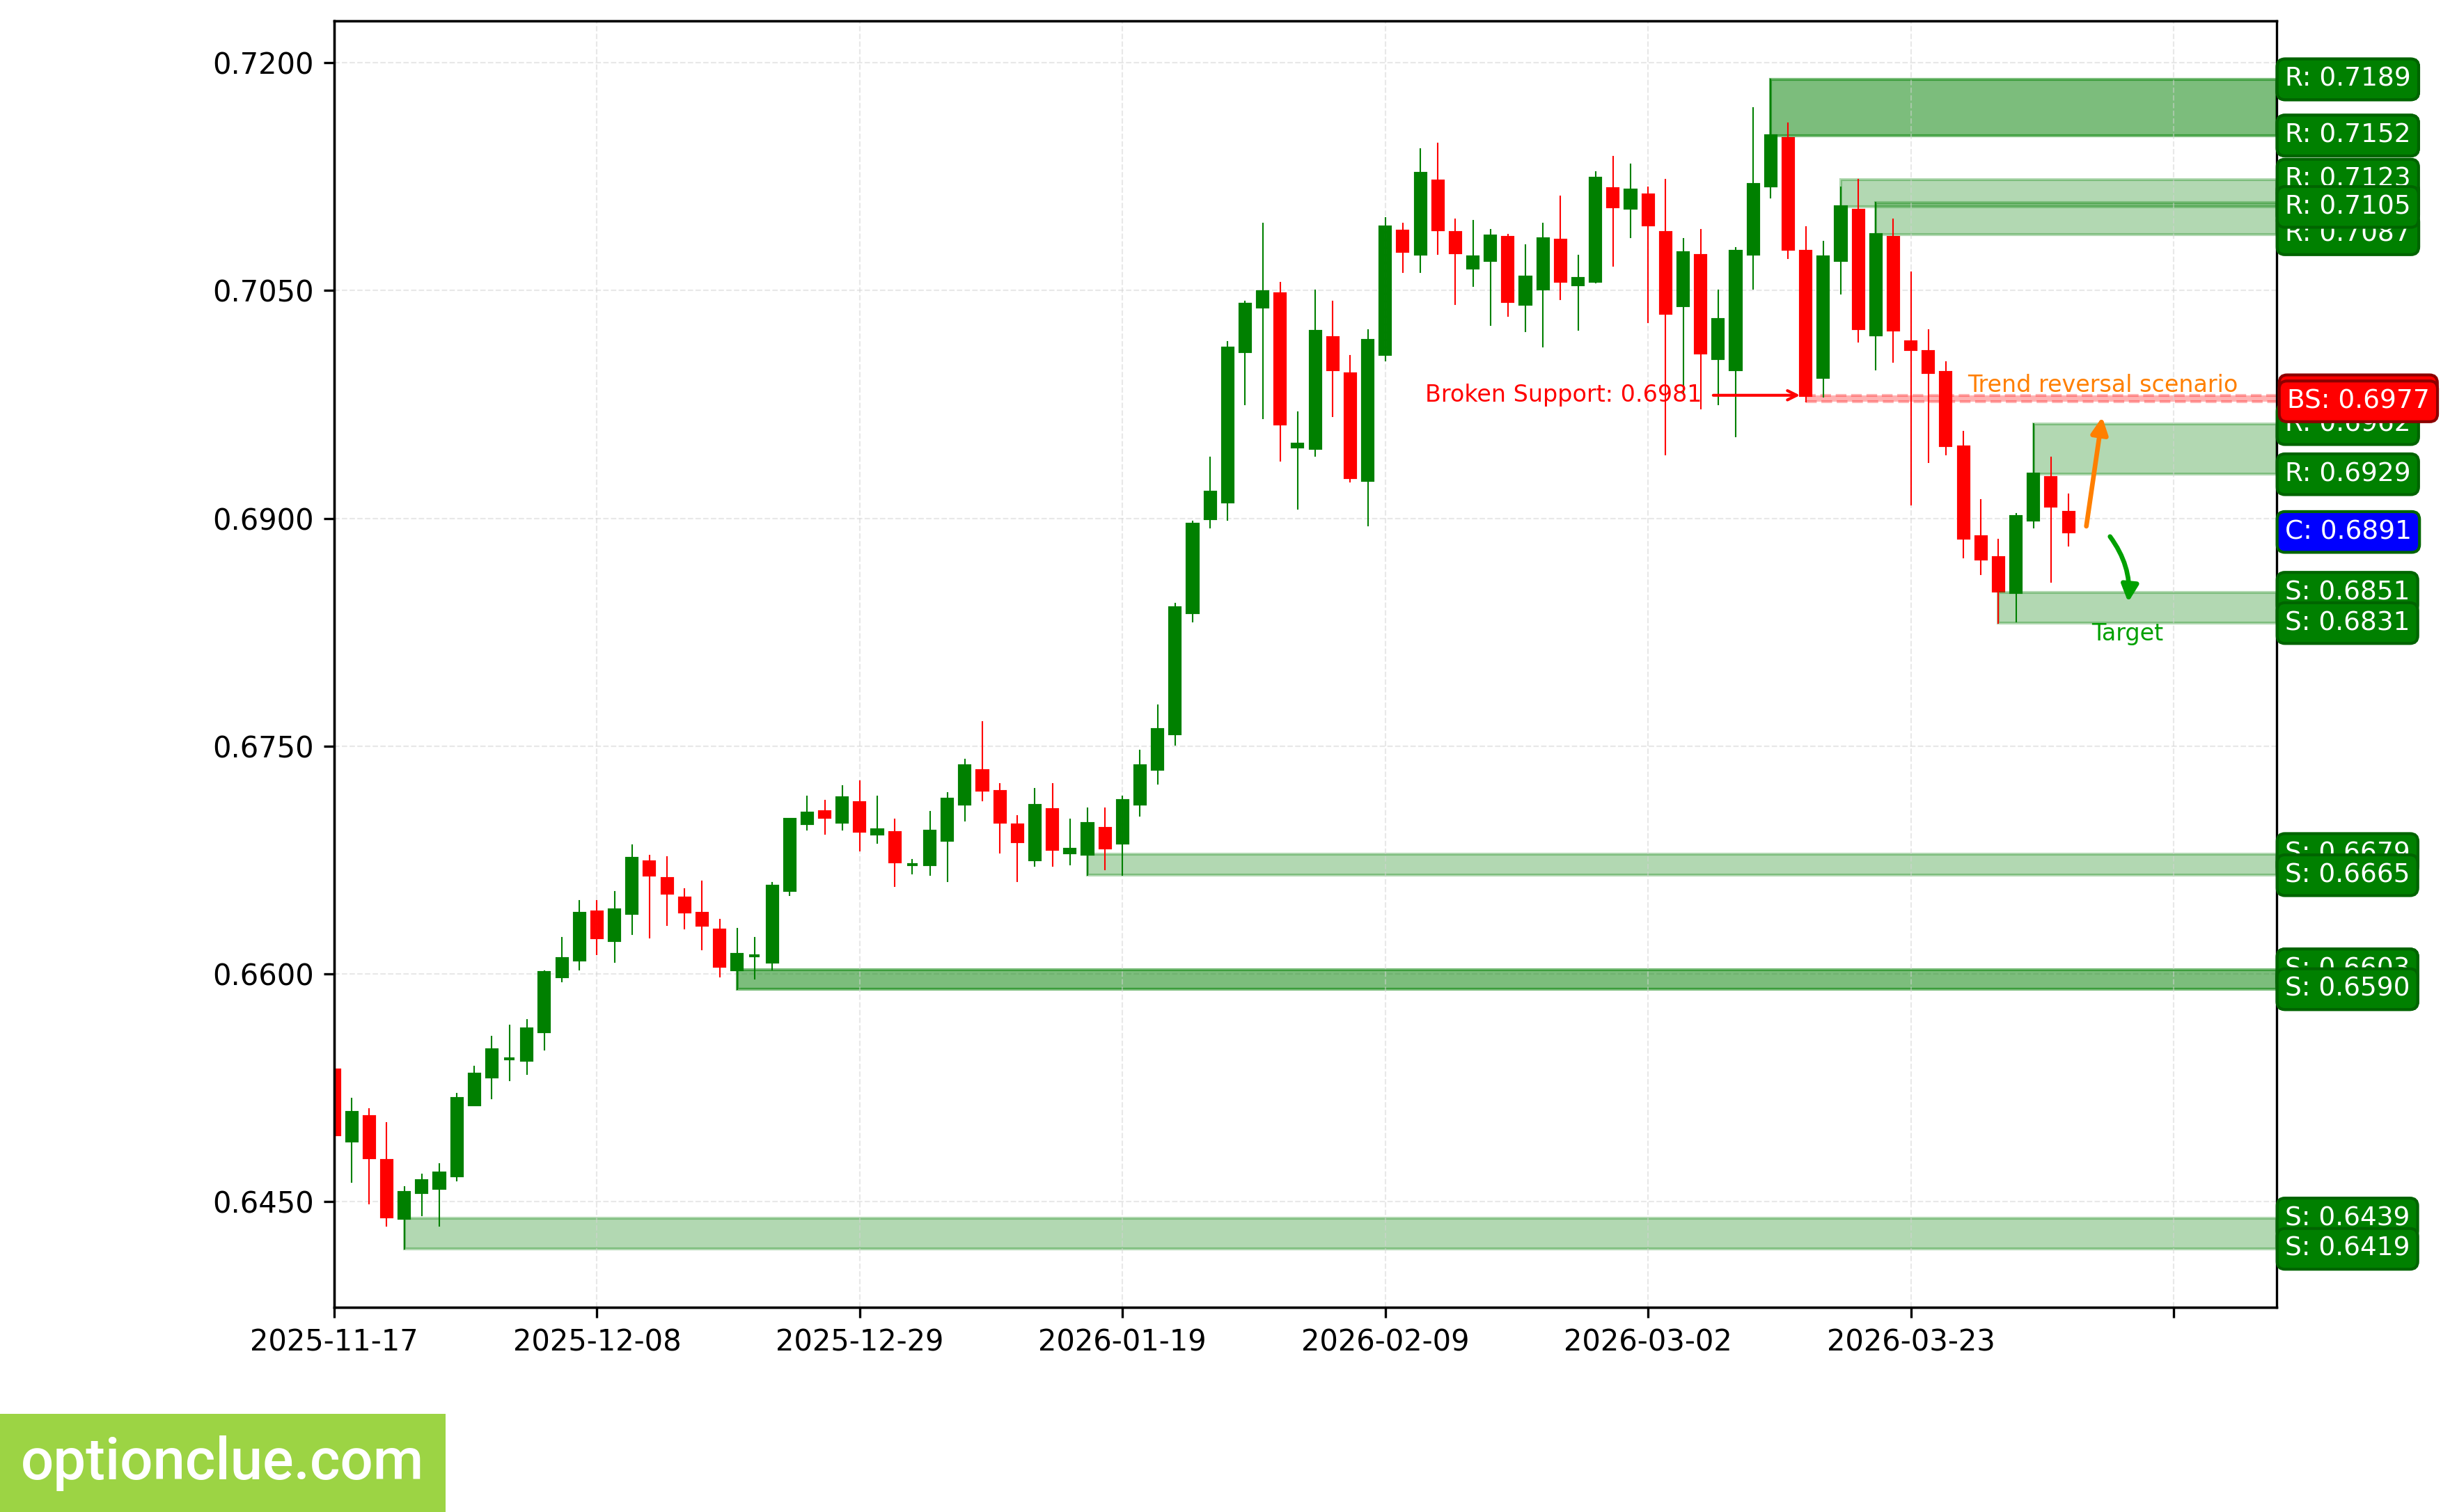
AUDUSD. Technical analysis. D1.
New Zealand Dollar (NZDUSD)
Bearish trend continues, the last broken level is support (0.5696 — 0.5718). The breakout occurred on the last closed candlestick, an impulse wave is developing.
Intermediate target for the downward movement is the support level with boundaries 0.5485 — 0.5528.
If a new correction completes near the resistance level (0.5752 — 0.5777), the potential profit/risk ratio may be approximately 2.8:1.
Short positions will remain relevant, as long as the market remains below the nearest resistance level with boundaries 0.5752 — 0.5777. If the market successfully closes above this nearest resistance, the trend will reverse to the opposite (bullish).
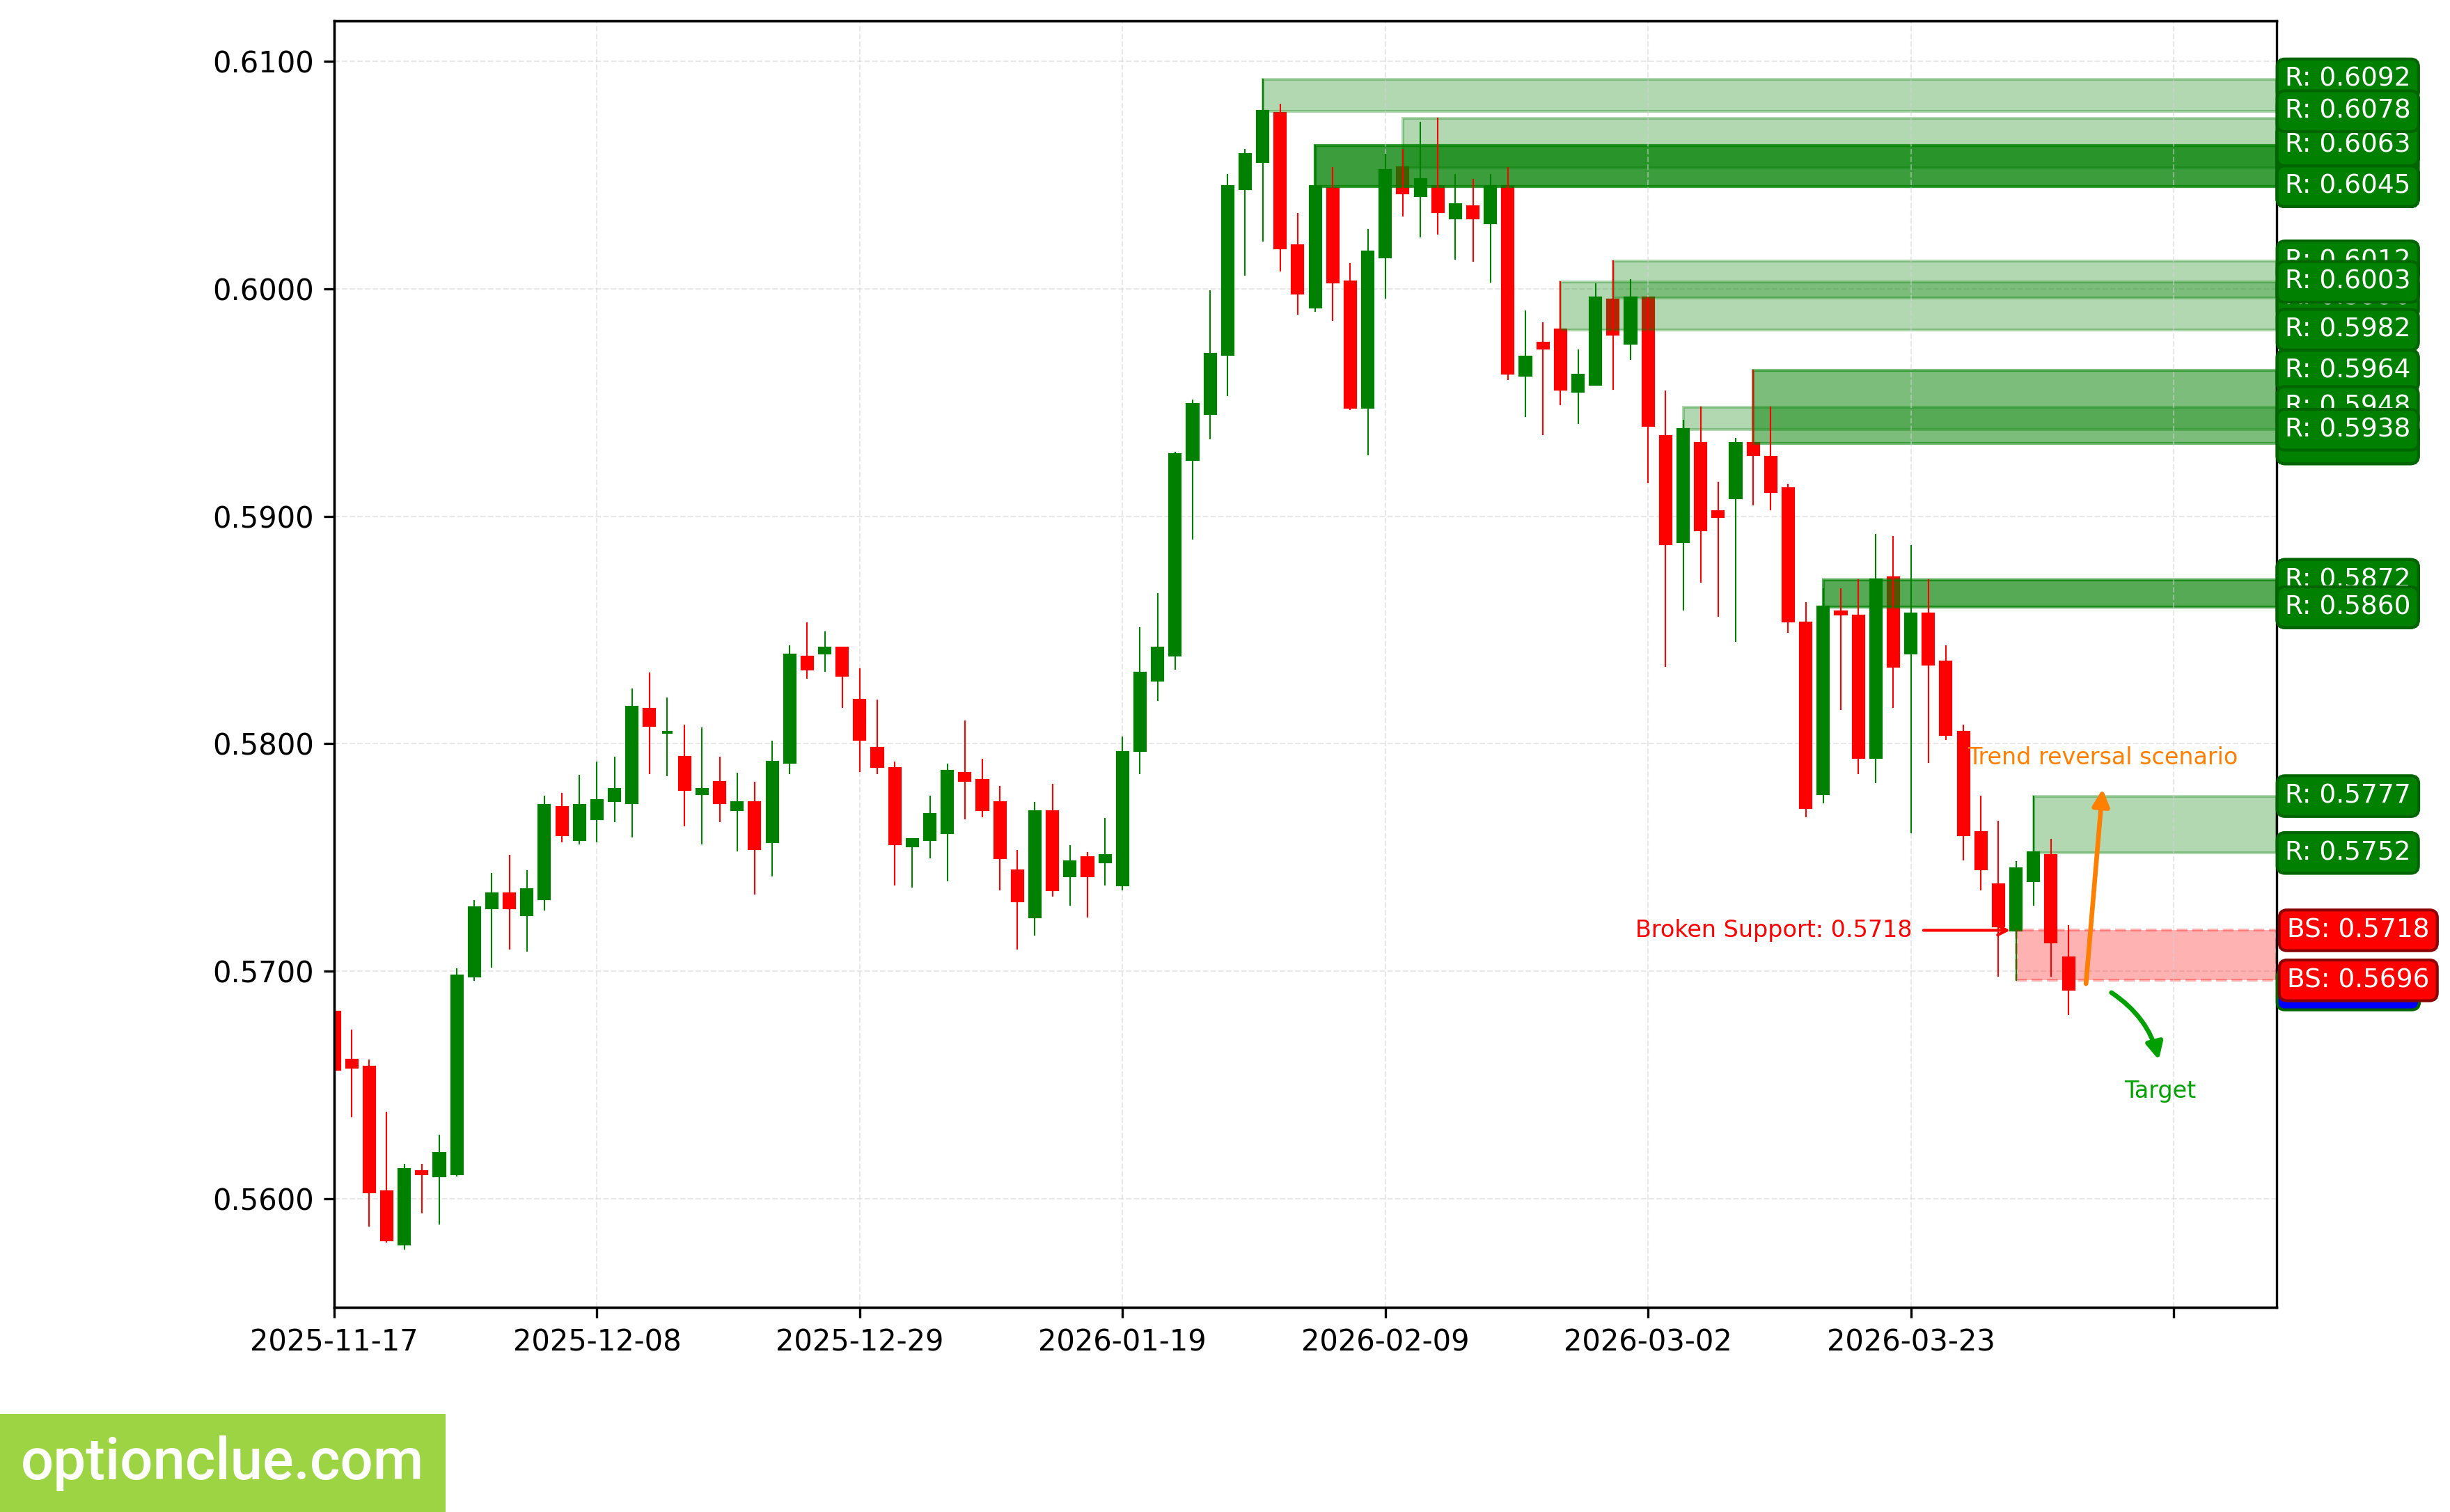
NZDUSD. Technical analysis. D1.
Bitcoin (BTC)
Bearish trend continues, a corrective wave is developing again. An entry point for selling on rebound may form after the current correction completes. The last broken level is support (67373 — 67843). The breakout occurred 9 candlesticks ago.
Intermediate target for the downward movement is the support level with boundaries 65725 — 66889.
If the correction completes near the resistance level (68233 — 69230), the potential profit/risk ratio may be small (approximately 0.6:1).
Short positions will remain relevant, as long as the market remains below the nearest resistance level with boundaries 68233 — 69230. If the market successfully closes above this nearest resistance, the trend will reverse to the opposite (bullish).
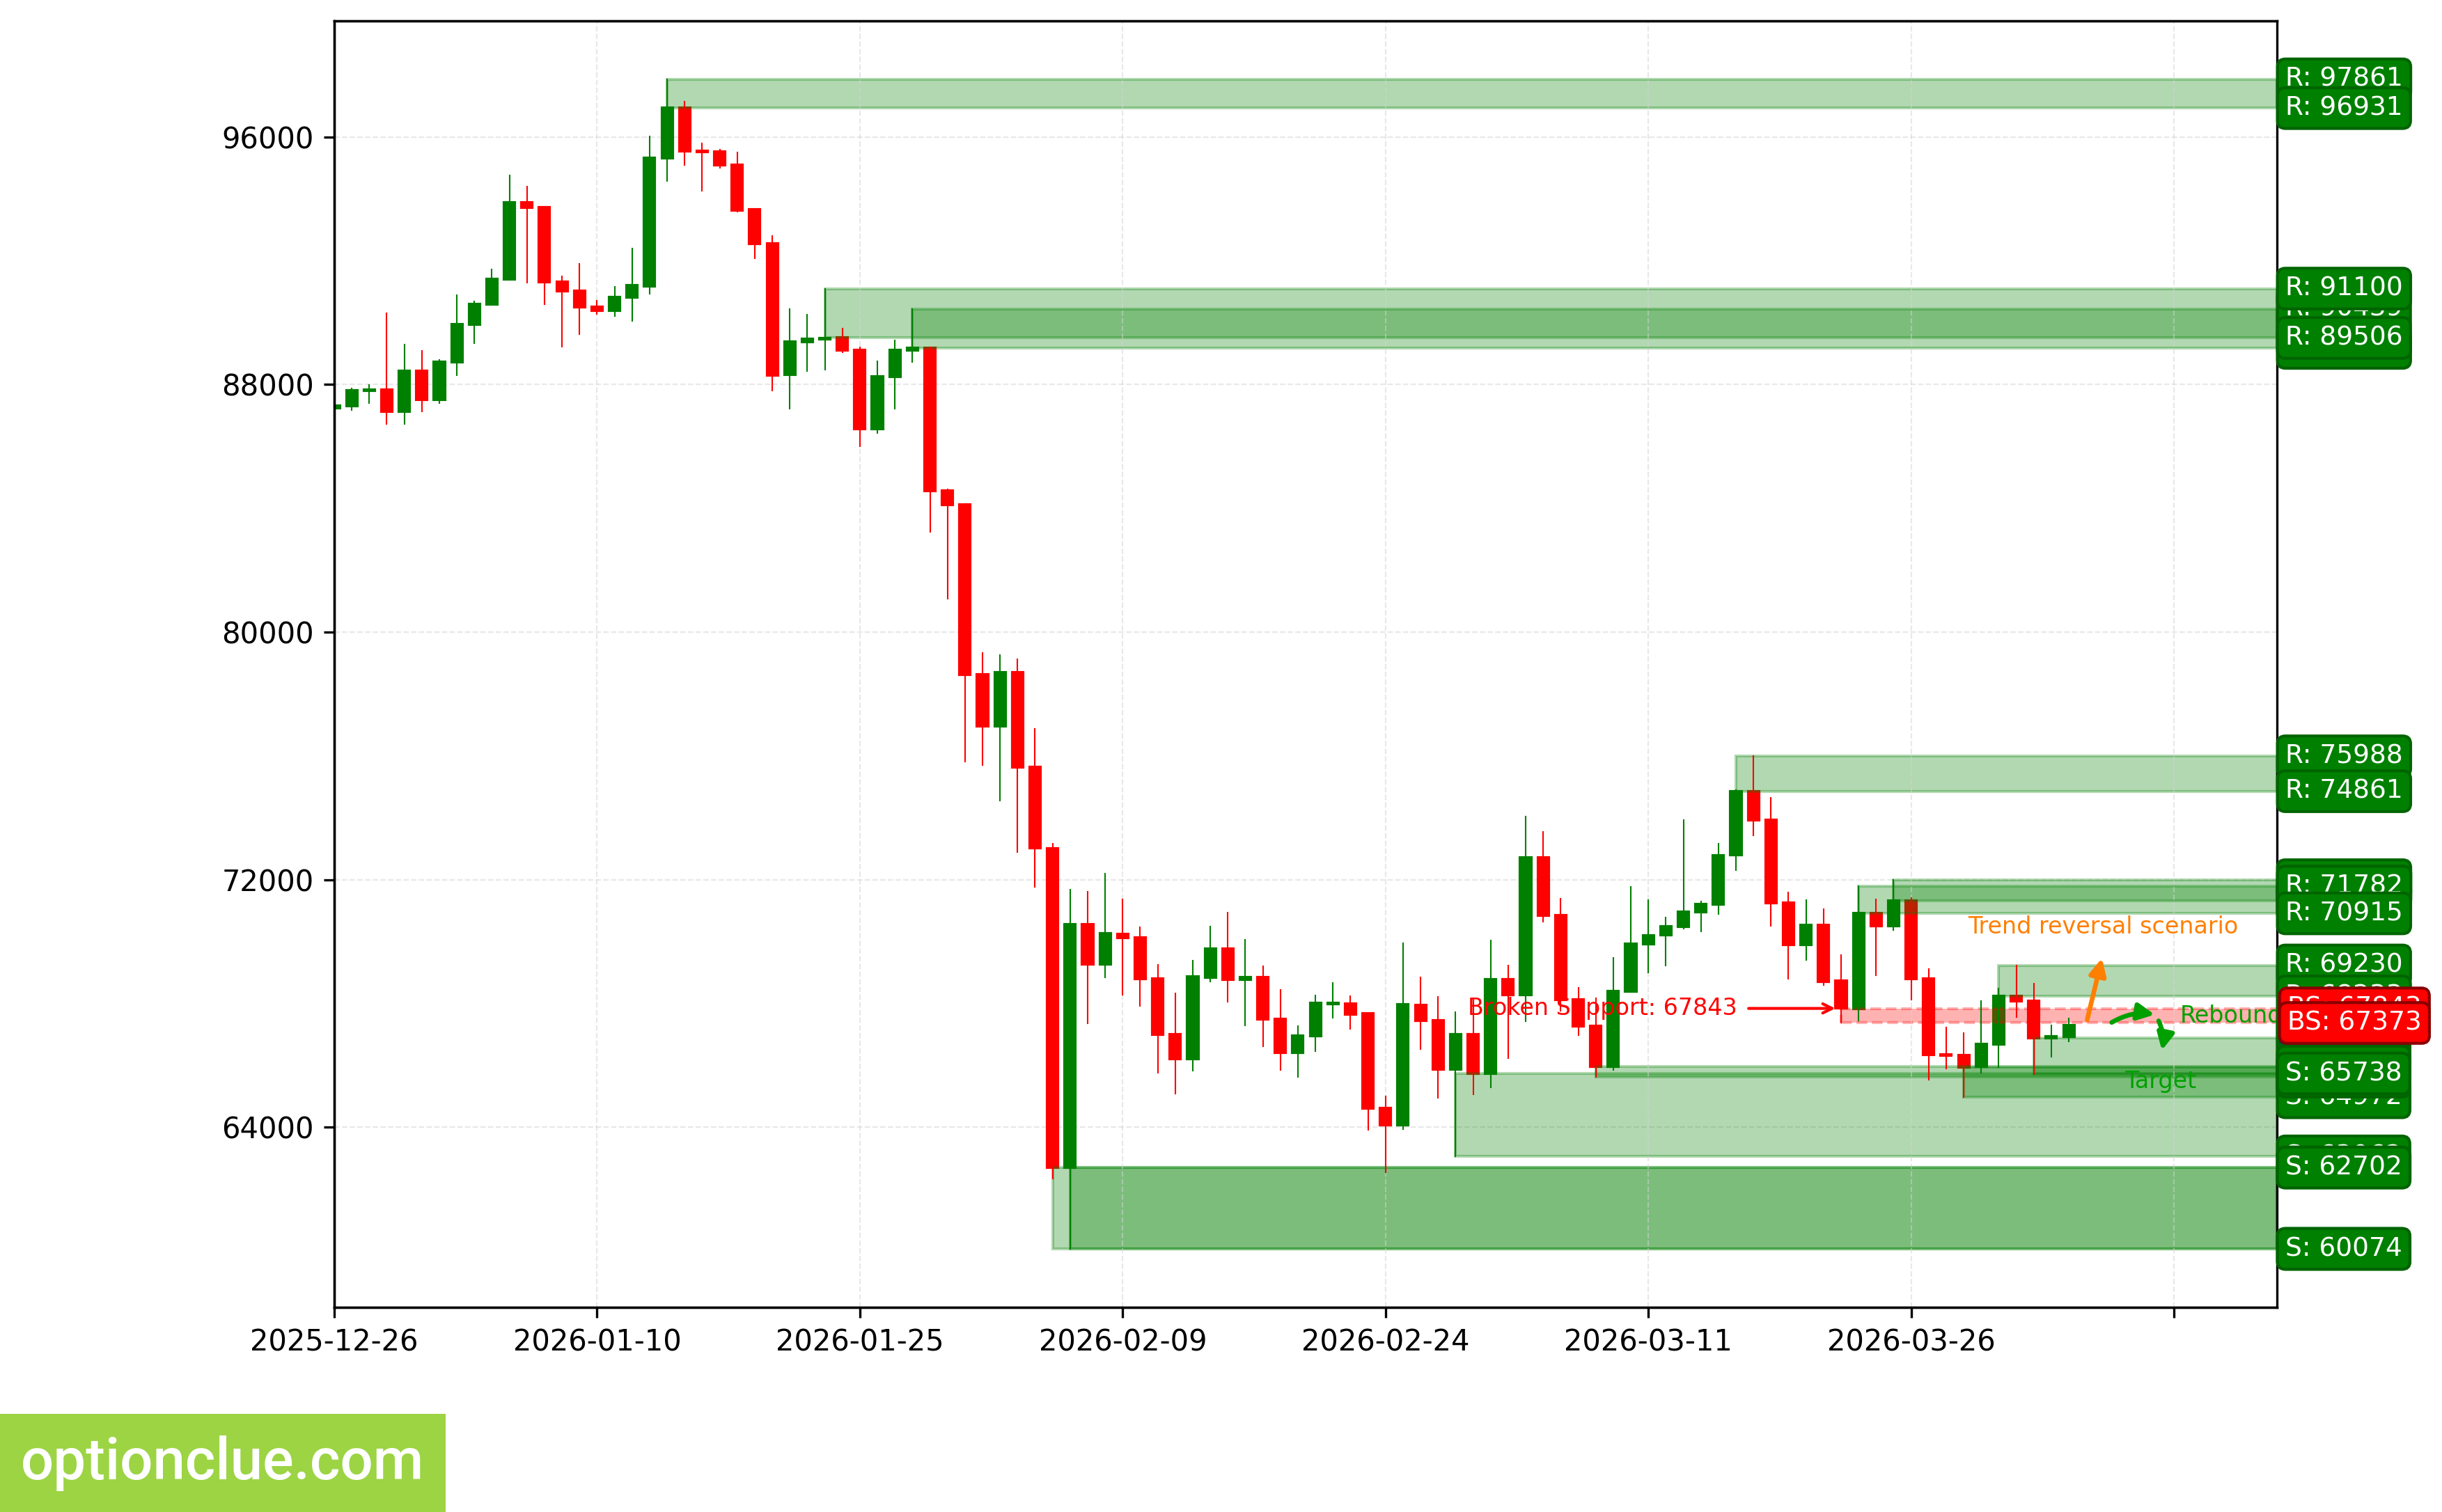
BTC. Technical analysis. D1.
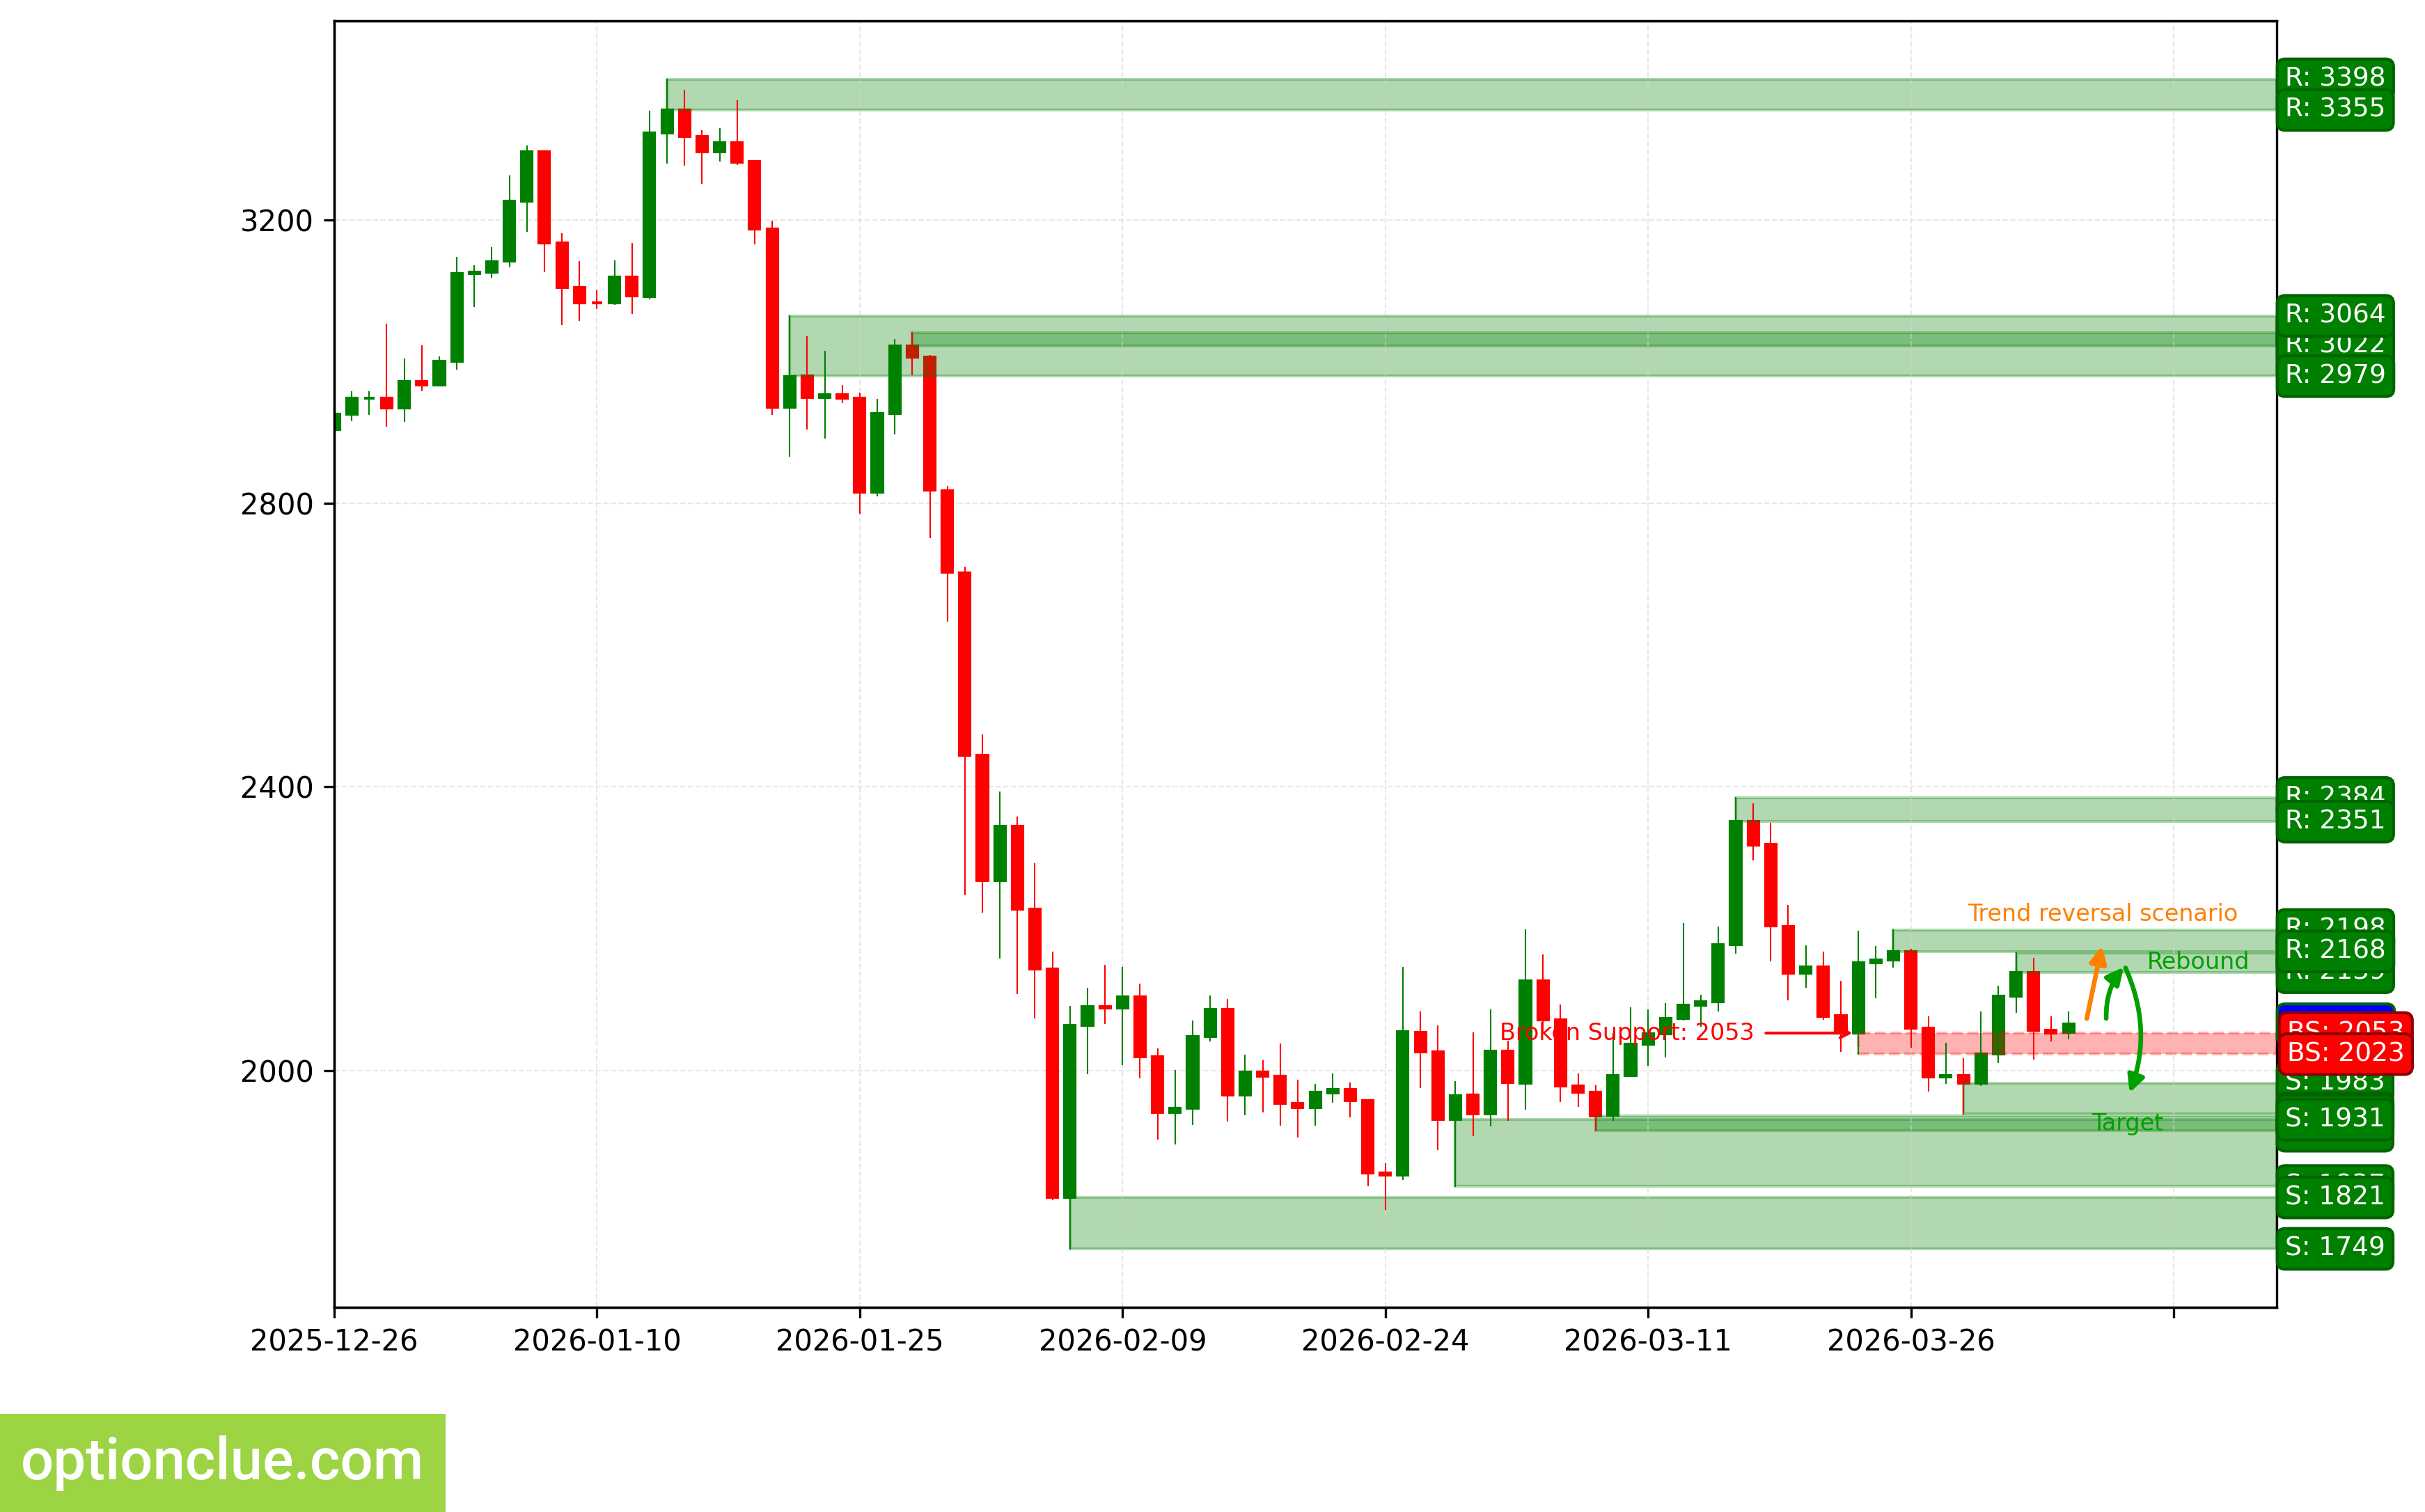
Ether (ETH)
Bearish trend continues, 3 candlesticks ago the correction completed, an impulse wave is developing. The last broken level is support (2023 — 2053). The breakout occurred 9 candlesticks ago.
Intermediate target for the downward movement is the support level with boundaries 1940 — 1983. In case of successful trend development, a further target will be at the support level with boundaries 1749 — 1821.
Potential profit/risk ratio from current prices when setting targets and fixing risks based on daily timeframe levels may be small (approximately 0.4:1). When using a further target — approximately 1.2:1.
Short positions will remain relevant, as long as the market remains below the nearest resistance level with boundaries 2139 — 2166. If the market successfully closes above this nearest resistance, the trend will reverse to the opposite (bullish).
ETH. Technical analysis. D1.
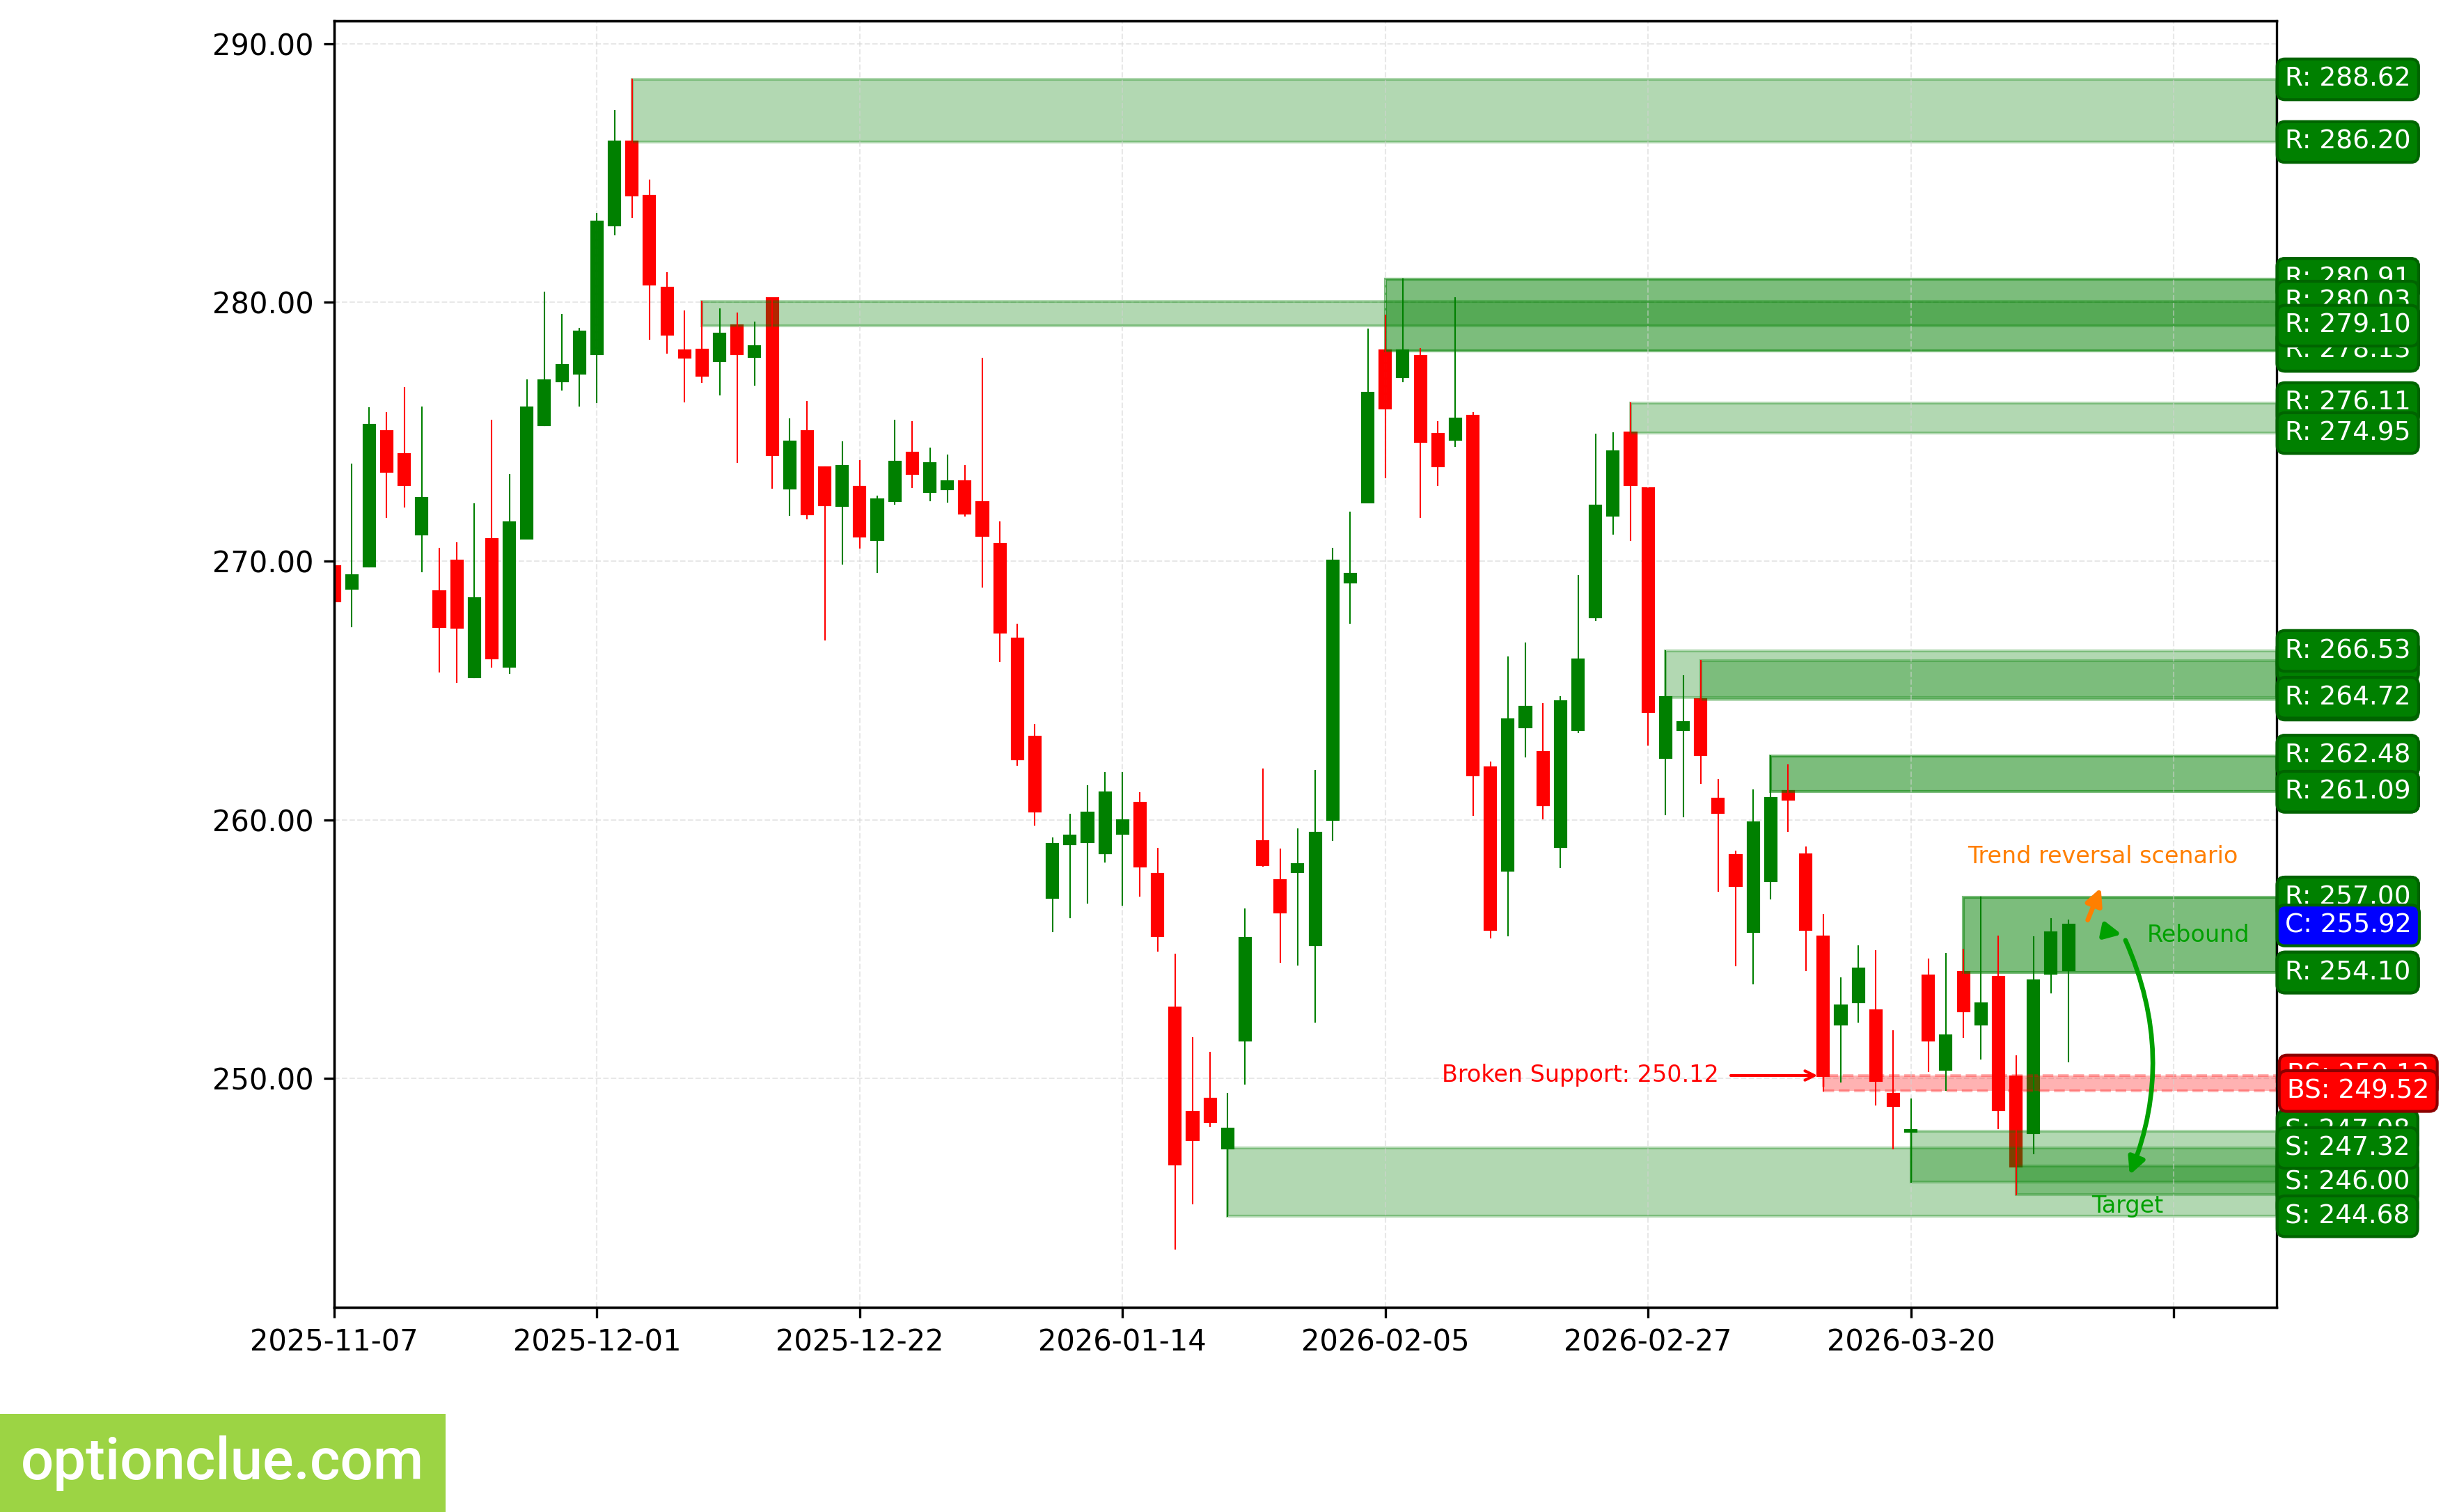
Apple Inc (AAPL)
Bearish trend continues, a corrective wave is developing. An entry point for selling on rebound may form after the current correction completes. The last broken level is support (249.52 — 250.12). The breakout occurred 11 candlesticks ago.
Intermediate target for the downward movement is the support level with boundaries 245.51 — 246.63. In case of successful trend development, a further target will be at the support level with boundaries 225.95 — 226.79.
If a new correction completes near the resistance level (254.10 — 257.00), the potential profit/risk ratio may be approximately 1.4:1. When using a further target — around 4.5:1.
Short positions will remain relevant, as long as the market remains below the nearest resistance level with boundaries 254.10 — 257.00. If the market successfully closes above this nearest resistance, the trend will reverse to the opposite (bullish).
AAPL. Technical analysis. D1.
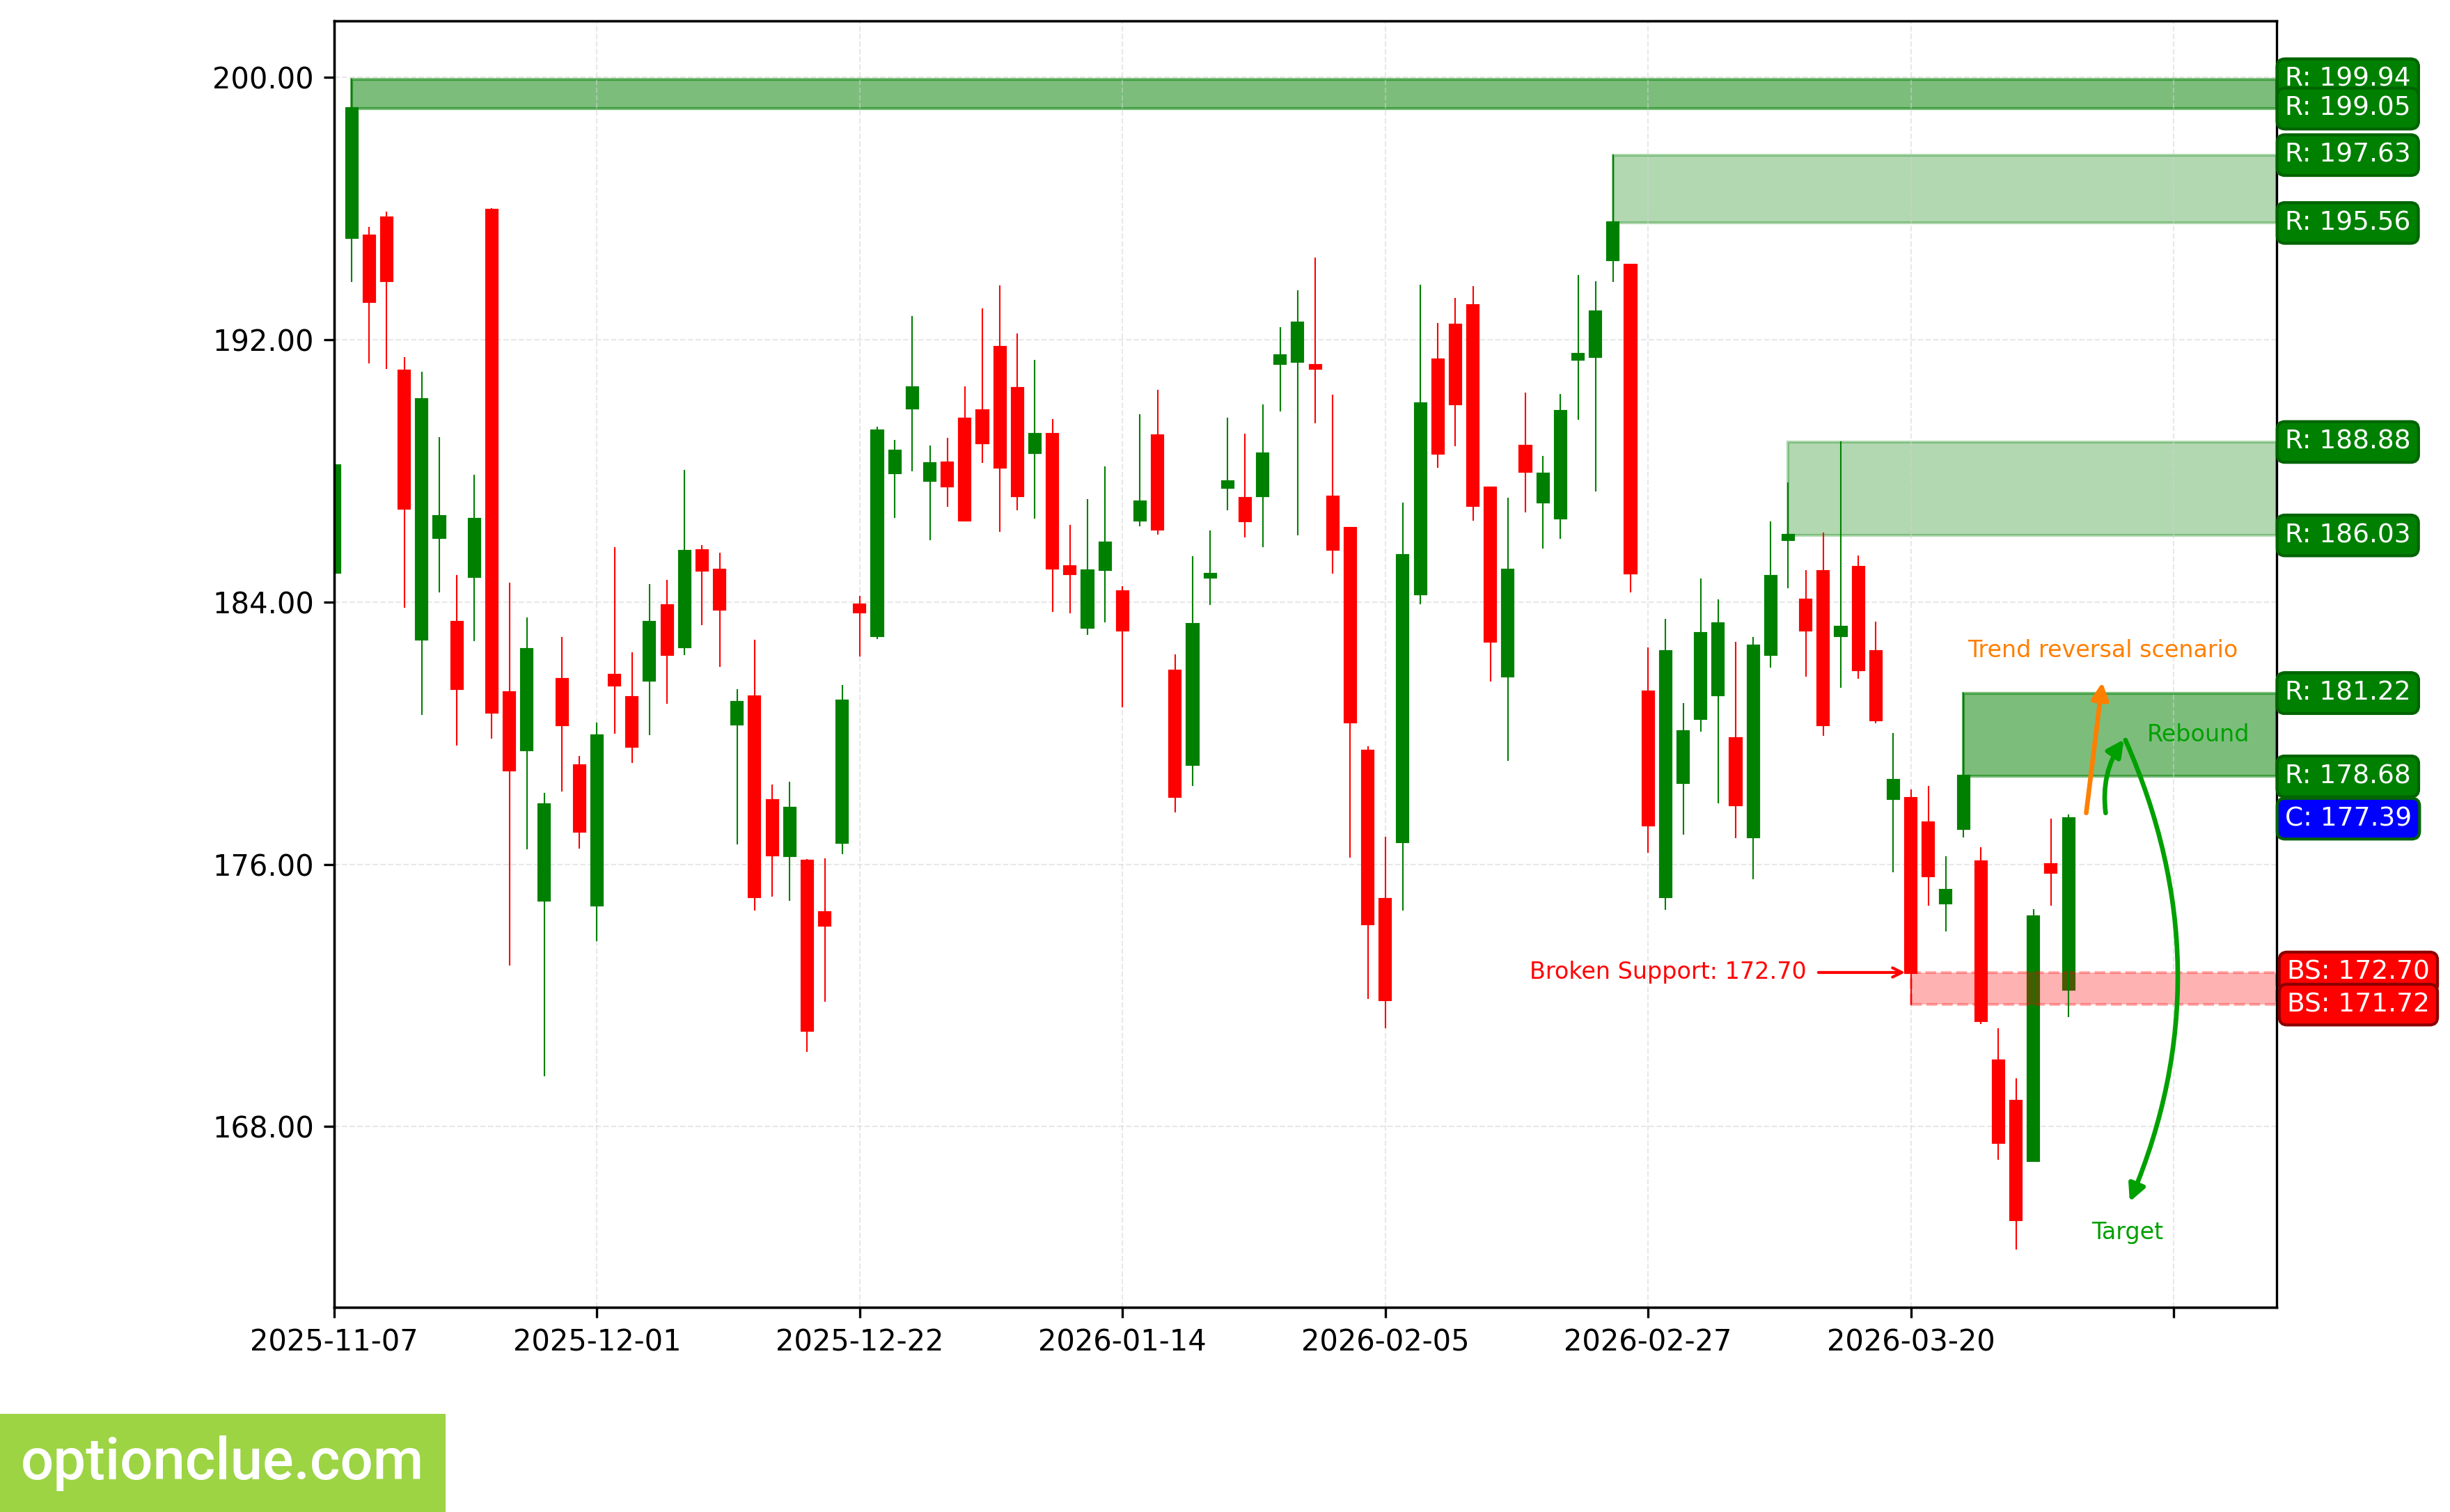
NVIDIA Corp (NVDA)
Bearish trend continues, a corrective wave is developing. An entry point for selling on rebound may form after the current correction completes. The last broken level is support (171.72 — 172.70). The breakout occurred 6 candlesticks ago.
Intermediate target for the downward movement is the support level with boundaries 164.07 — 167.02. In case of successful trend development, a further target will be at the support level with boundaries 151.49 — 152.98.
If a new correction completes near the resistance level (178.68 — 181.22), the potential profit/risk ratio may be approximately 2:1. When using a further target — around 4:1.
Short positions will remain relevant, as long as the market remains below the nearest resistance level with boundaries 178.68 — 181.22. If the market successfully closes above this nearest resistance, the trend will reverse to the opposite (bullish).
NVDA. Technical analysis. D1.
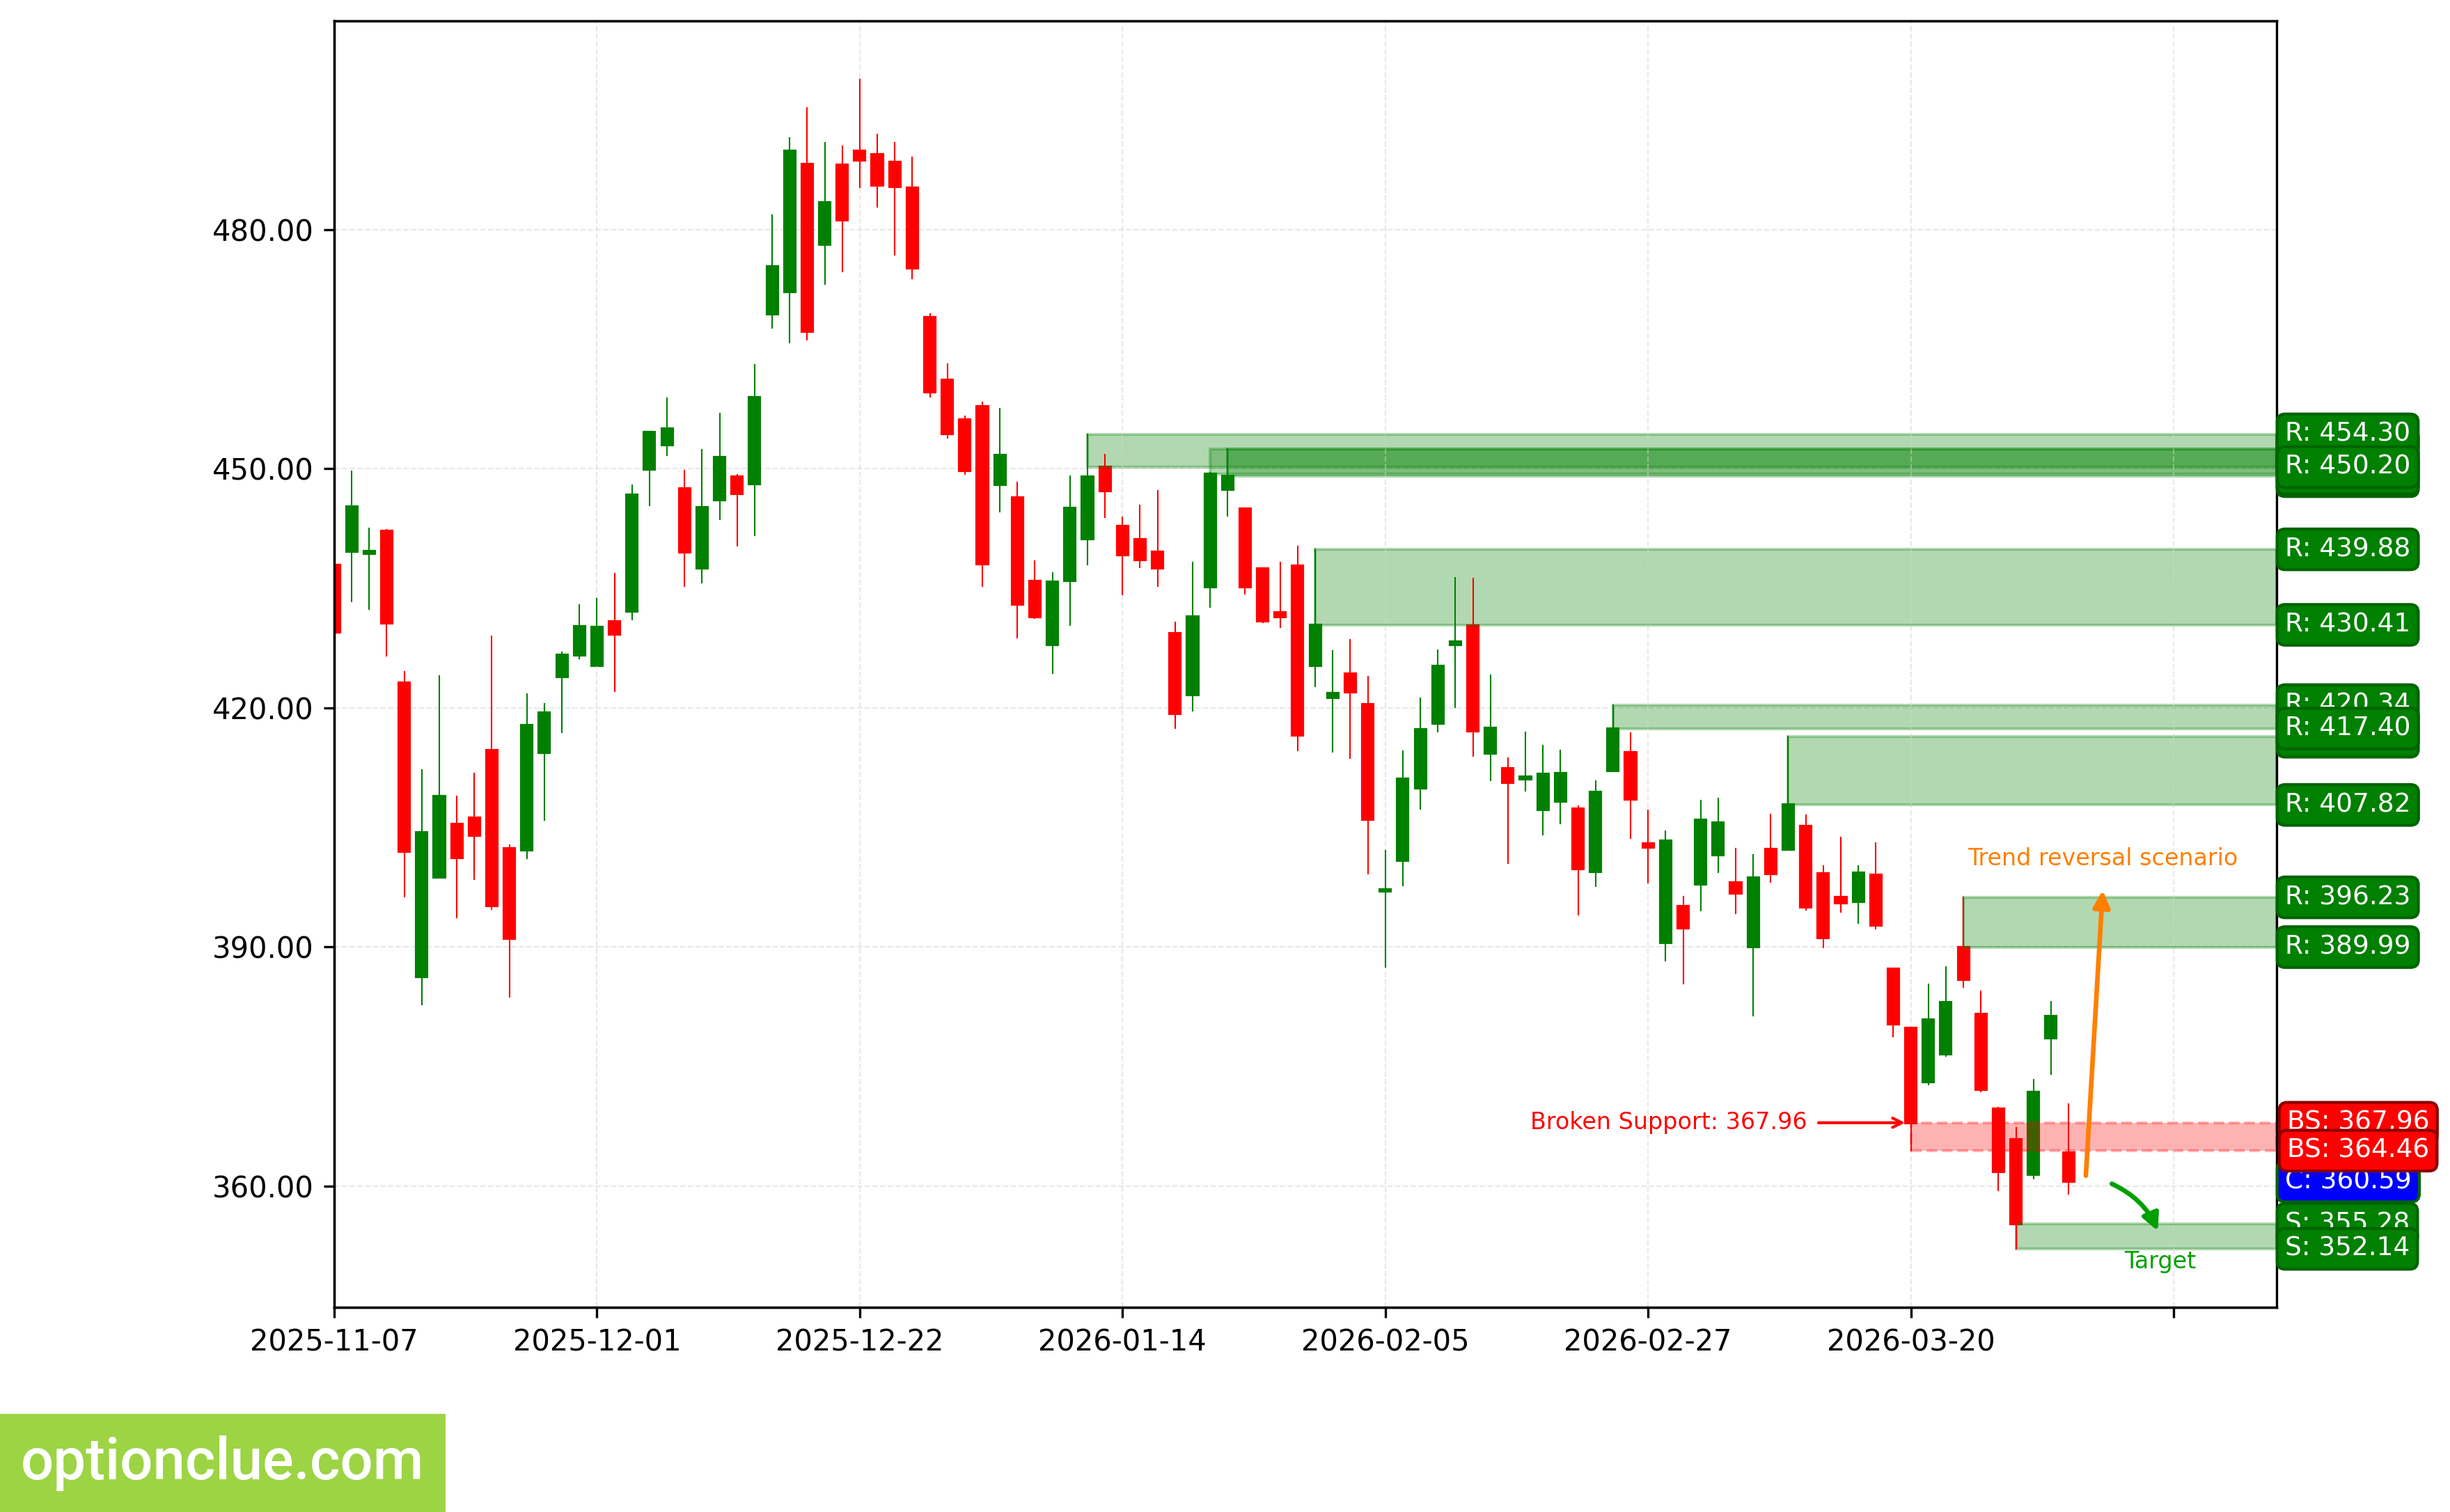
Tesla Inc (TSLA)
Bearish trend continues, a corrective wave is developing. An entry point for selling may form after the current correction completes. The last broken level is support (364.46 — 367.96). The breakout occurred 5 candlesticks ago.
Intermediate target for the downward movement is the support level with boundaries 352.14 — 355.28. In case of successful trend development, a further target will be at the support level with boundaries 314.60 — 320.11.
If a new correction completes near the resistance level (389.99 — 396.23), the potential profit/risk ratio may be approximately 2:1. When using a further target — around 4:1. If the correction completes near the last broken level (364.46 — 367.96), the potential profit/risk ratio may be small (around 0.2:1). When selecting a further target — around 1:1.
Short positions will remain relevant, as long as the market remains below the nearest resistance level with boundaries 389.99 — 396.23. If the market successfully closes above this nearest resistance, the trend will reverse to the opposite (bullish).
TSLA. Technical analysis. D1.
Summary
From the perspective of medium-term trading, financial instruments with correction nearing completion on Daily and/or potentially the most promising profit/risk ratios include: AAPL, NVDA, USDJPY. In the near future, they may deserve attention depending on the depth of market correction: USDCAD, USDCHF.
The remaining financial instruments on the trading list may also be interesting, but on these markets, rebound signals on Daily are likely to appear no earlier than in a week.