
Reviewing the most important levels on key financial instruments and likely scenarios for developments.
Key Topics
- Euro (EURUSD)
- British Pound (GBPUSD)
- Swiss Franc (USDCHF)
- Japanese Yen (USDJPY)
- Canadian Dollar (USDCAD)
- Australian Dollar (AUDUSD)
- Bitcoin (BTC)
- Ether (ETH)
- Apple Inc (AAPL)
- NVIDIA Corp (NVDA)
- Tesla Inc (TSLA)
- Summary
Euro (EURUSD)
The bullish trend continues, with a correction developing. The last broken level is resistance (1.1666 — 1.1682). The breakout occurred 18 candlesticks ago.
The intermediate target for the upward movement is the resistance level with boundaries 1.1795 — 1.1808. In case of successful trend development, the farther target will be at the resistance level with boundaries 1.1871 — 1.1918.
The potential profit/risk ratio from current prices when setting targets and fixing risks at daily timeframe levels may be around 1:1. Using the farther target — about 2:1.
Long positions will remain relevant as long as the market stays above the nearest support level with boundaries 1.1703 — 1.1710. If the market successfully closes below this support, the trend will reverse to the opposite (bearish).
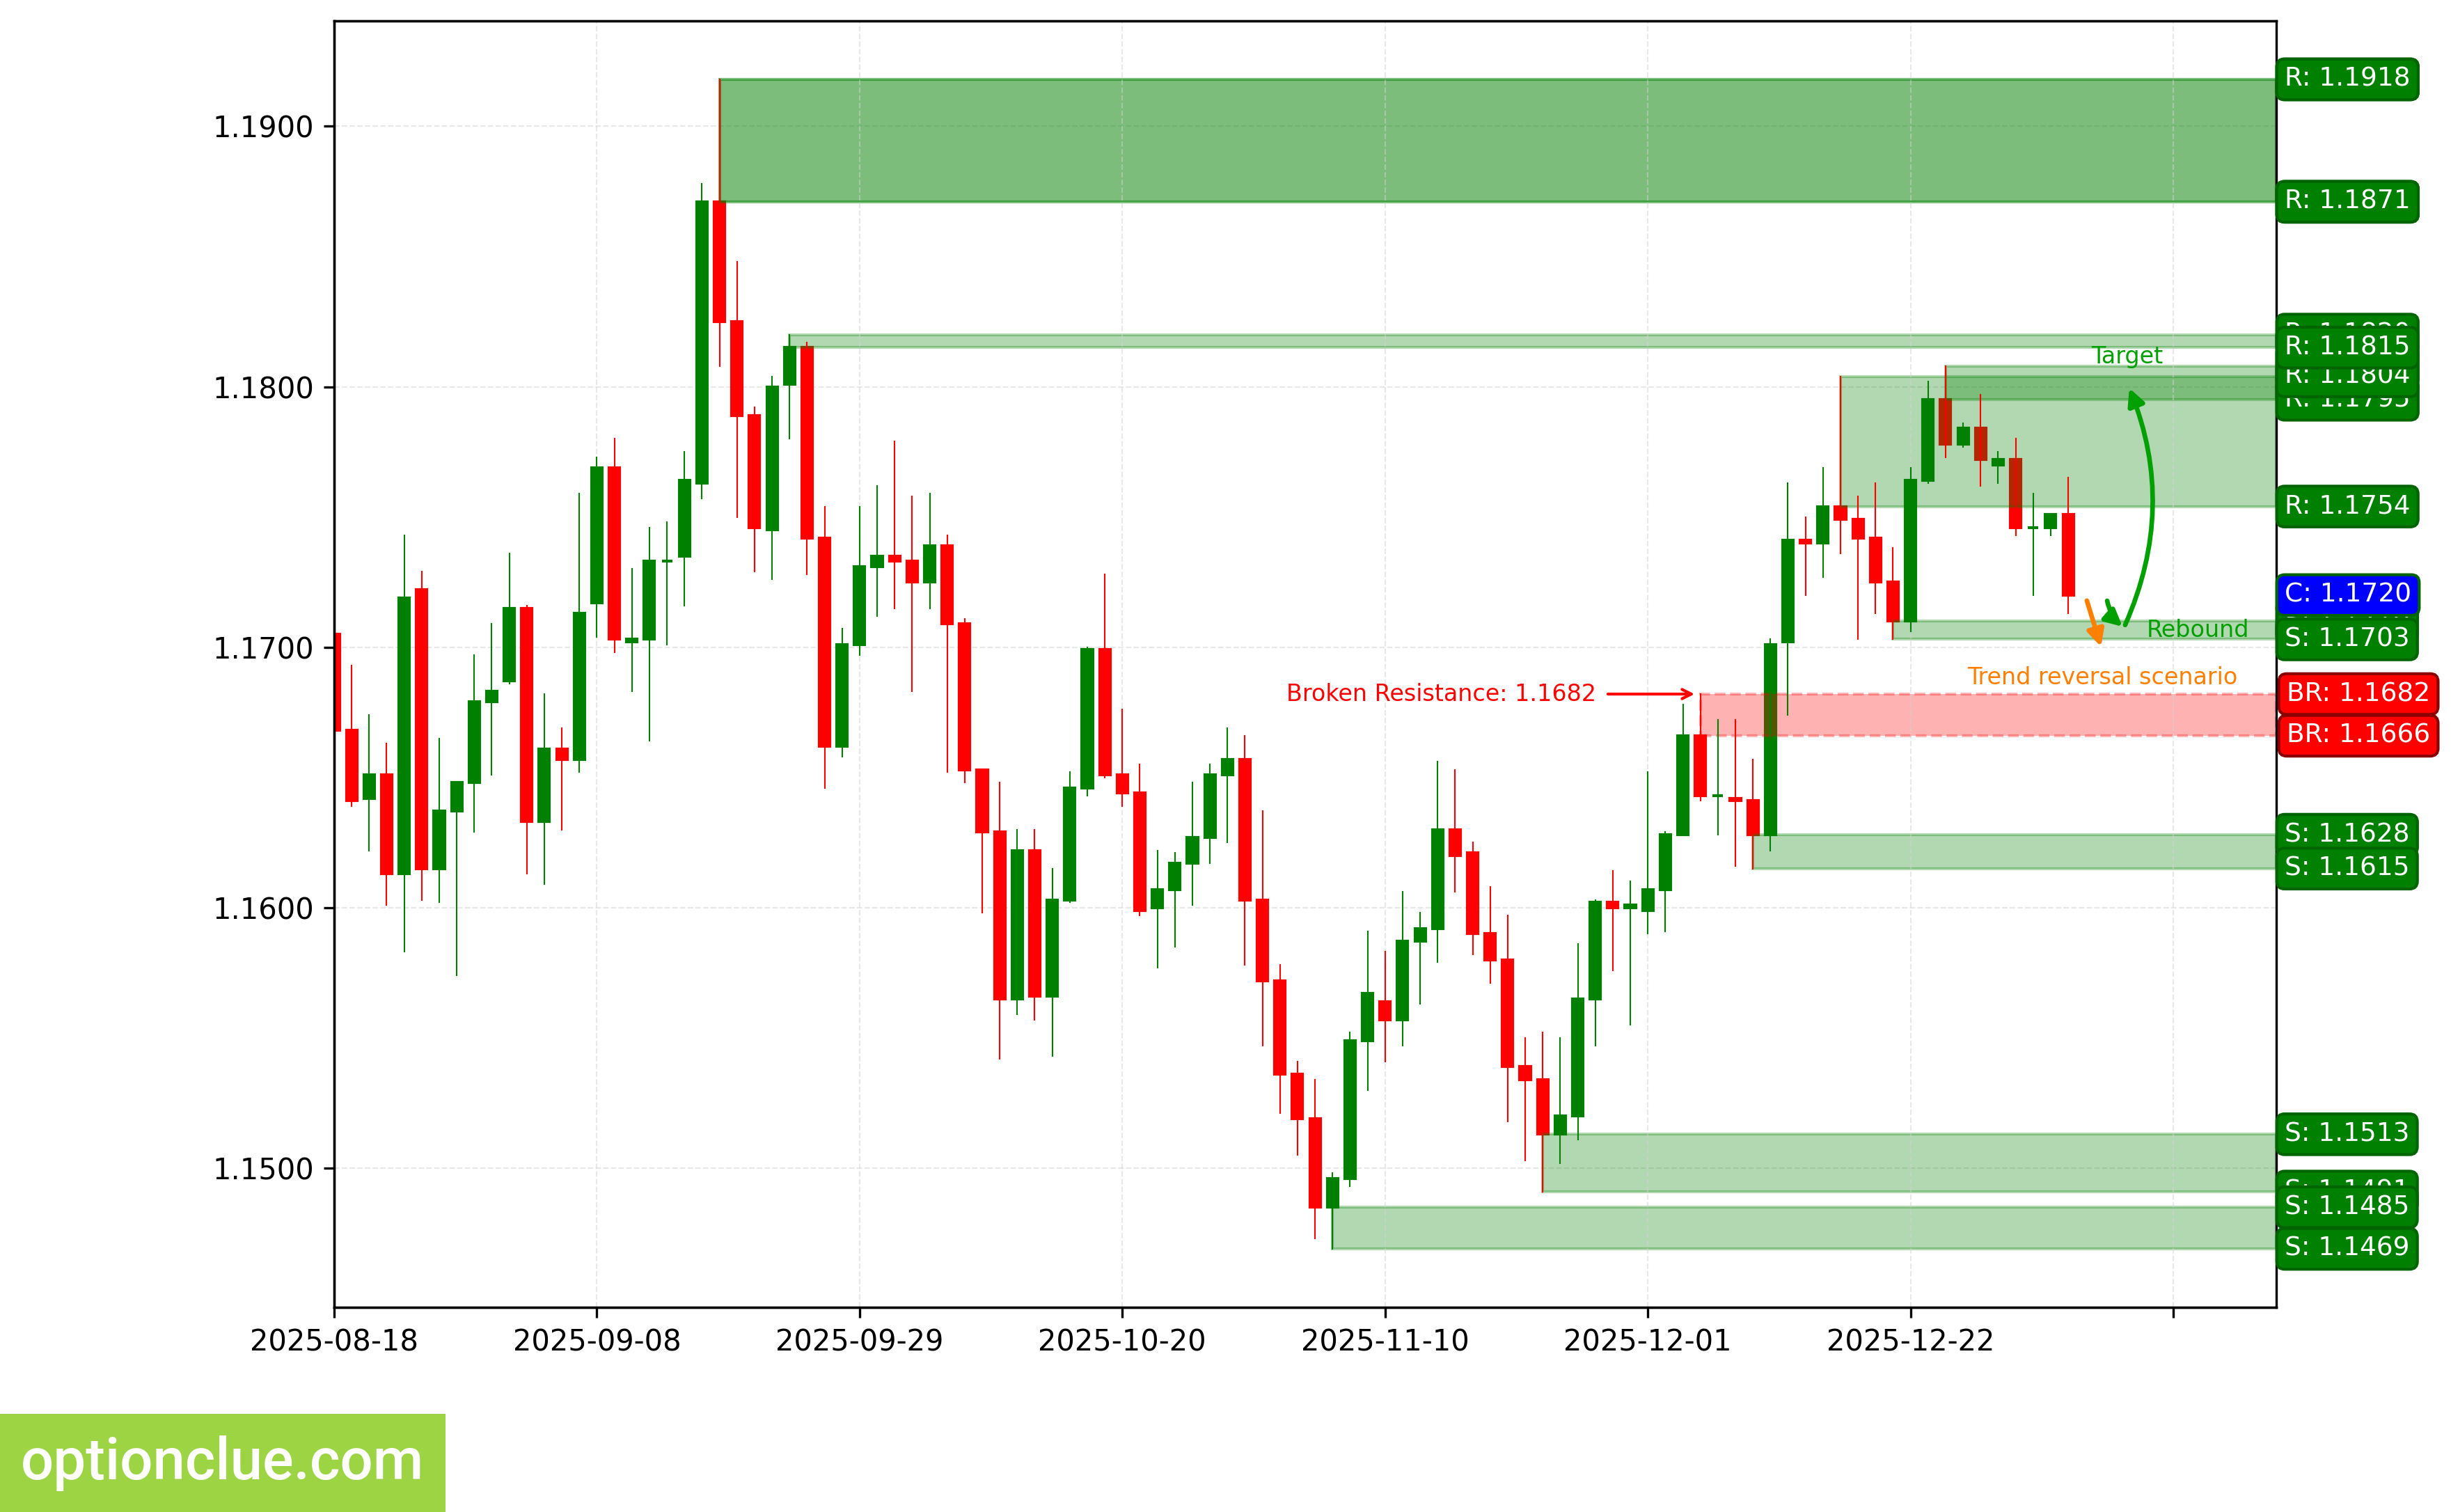
EURUSD. Technical analysis. D1.
British Pound (GBPUSD)
The trend has changed to bearish when the support level (1.3469 — 1.3499) was broken last week. The breakout occurred 4 candlesticks ago. 2 candlesticks ago, the correction likely completed and an entry point for selling on rebound formed; an impulse wave is developing.
The intermediate target for the downward movement is the support level with boundaries 1.3312 — 1.3374. In case of successful trend development, the farther target will be at the support level with boundaries 1.3180 — 1.3209.
From current prices, the profit/risk ratio is low (about 0.7:1). Using the farther target — around 2:1.
Short positions will remain relevant as long as the market stays below the nearest resistance level with boundaries 1.3476 — 1.3502. If the market successfully closes above this nearest resistance, the trend will reverse to the opposite (bullish).
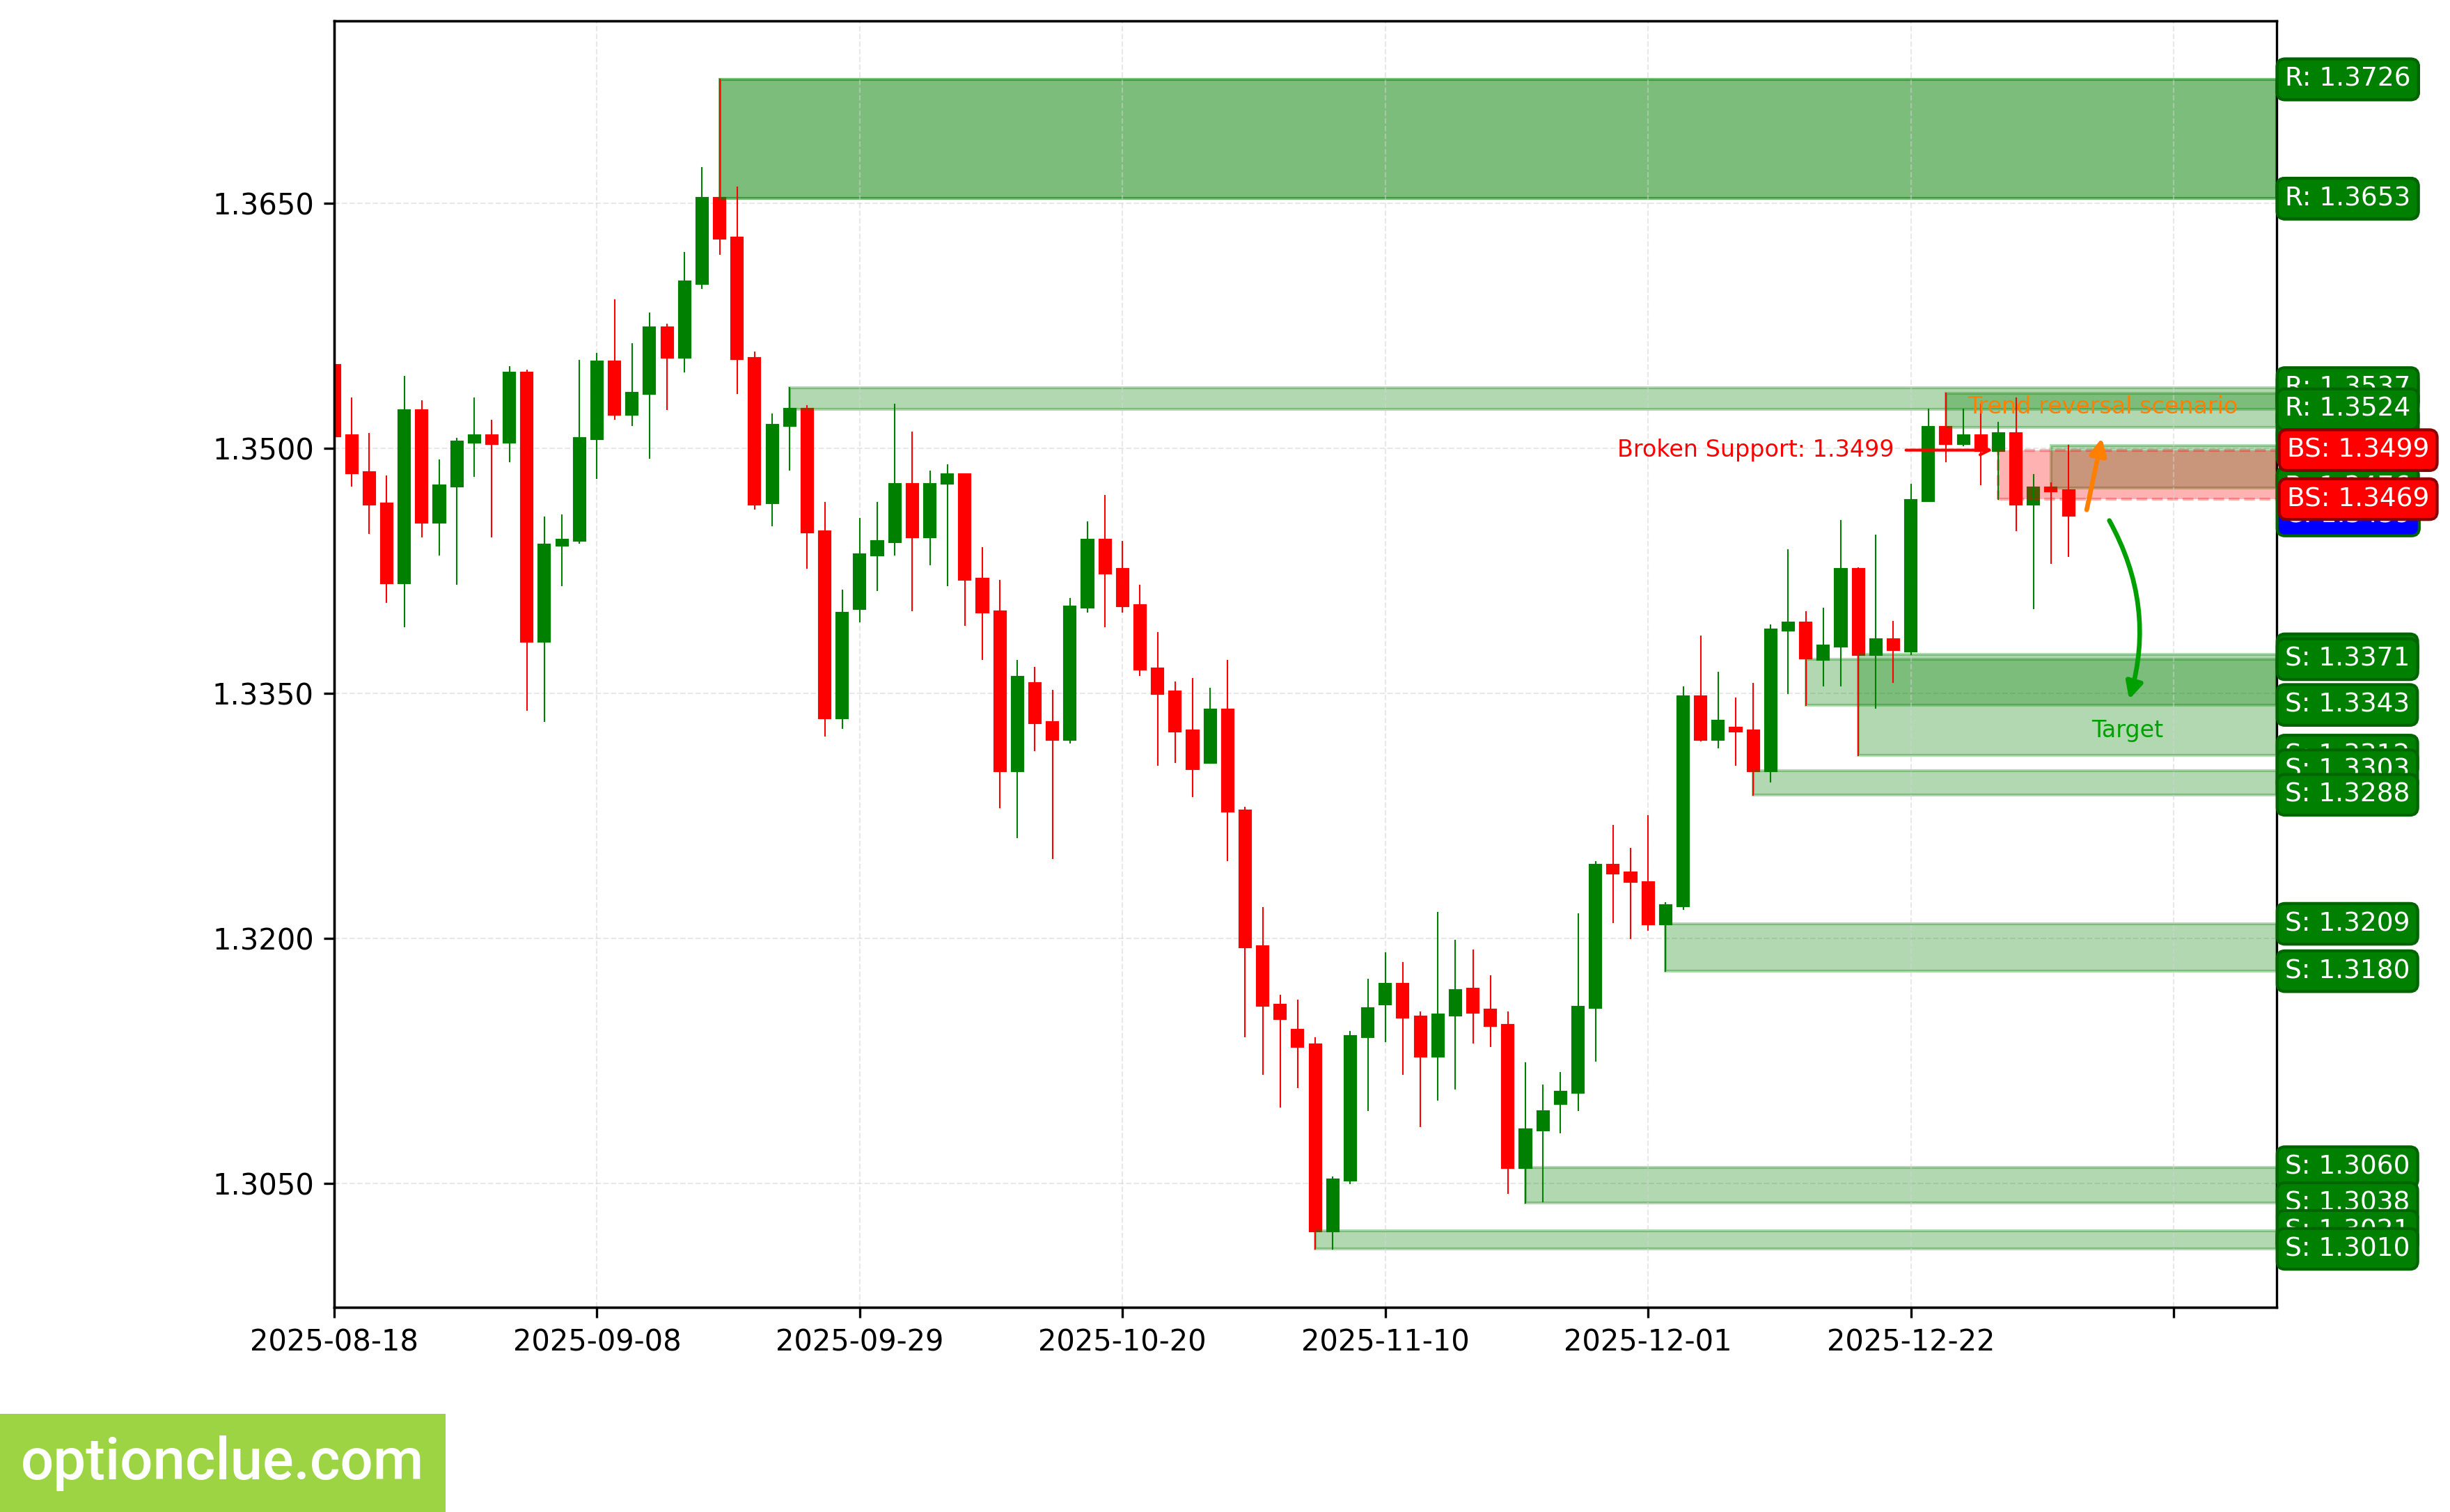
GBPUSD. Technical analysis. D1.
Swiss Franc (USDCHF)
The bearish trend continues, with a corrective wave developing. Sell entry points may appear after rebound confirmation. The last broken level is support (0.7924 — 0.7942). The breakout occurred 10 candlesticks ago.
The intermediate target for the downward movement is the support level with boundaries 0.7858 — 0.7874.
Short positions will remain relevant as long as the market stays below the nearest resistance level with boundaries 0.8068 — 0.8085. If the market successfully closes above this nearest resistance, the trend will reverse to the opposite (bullish).
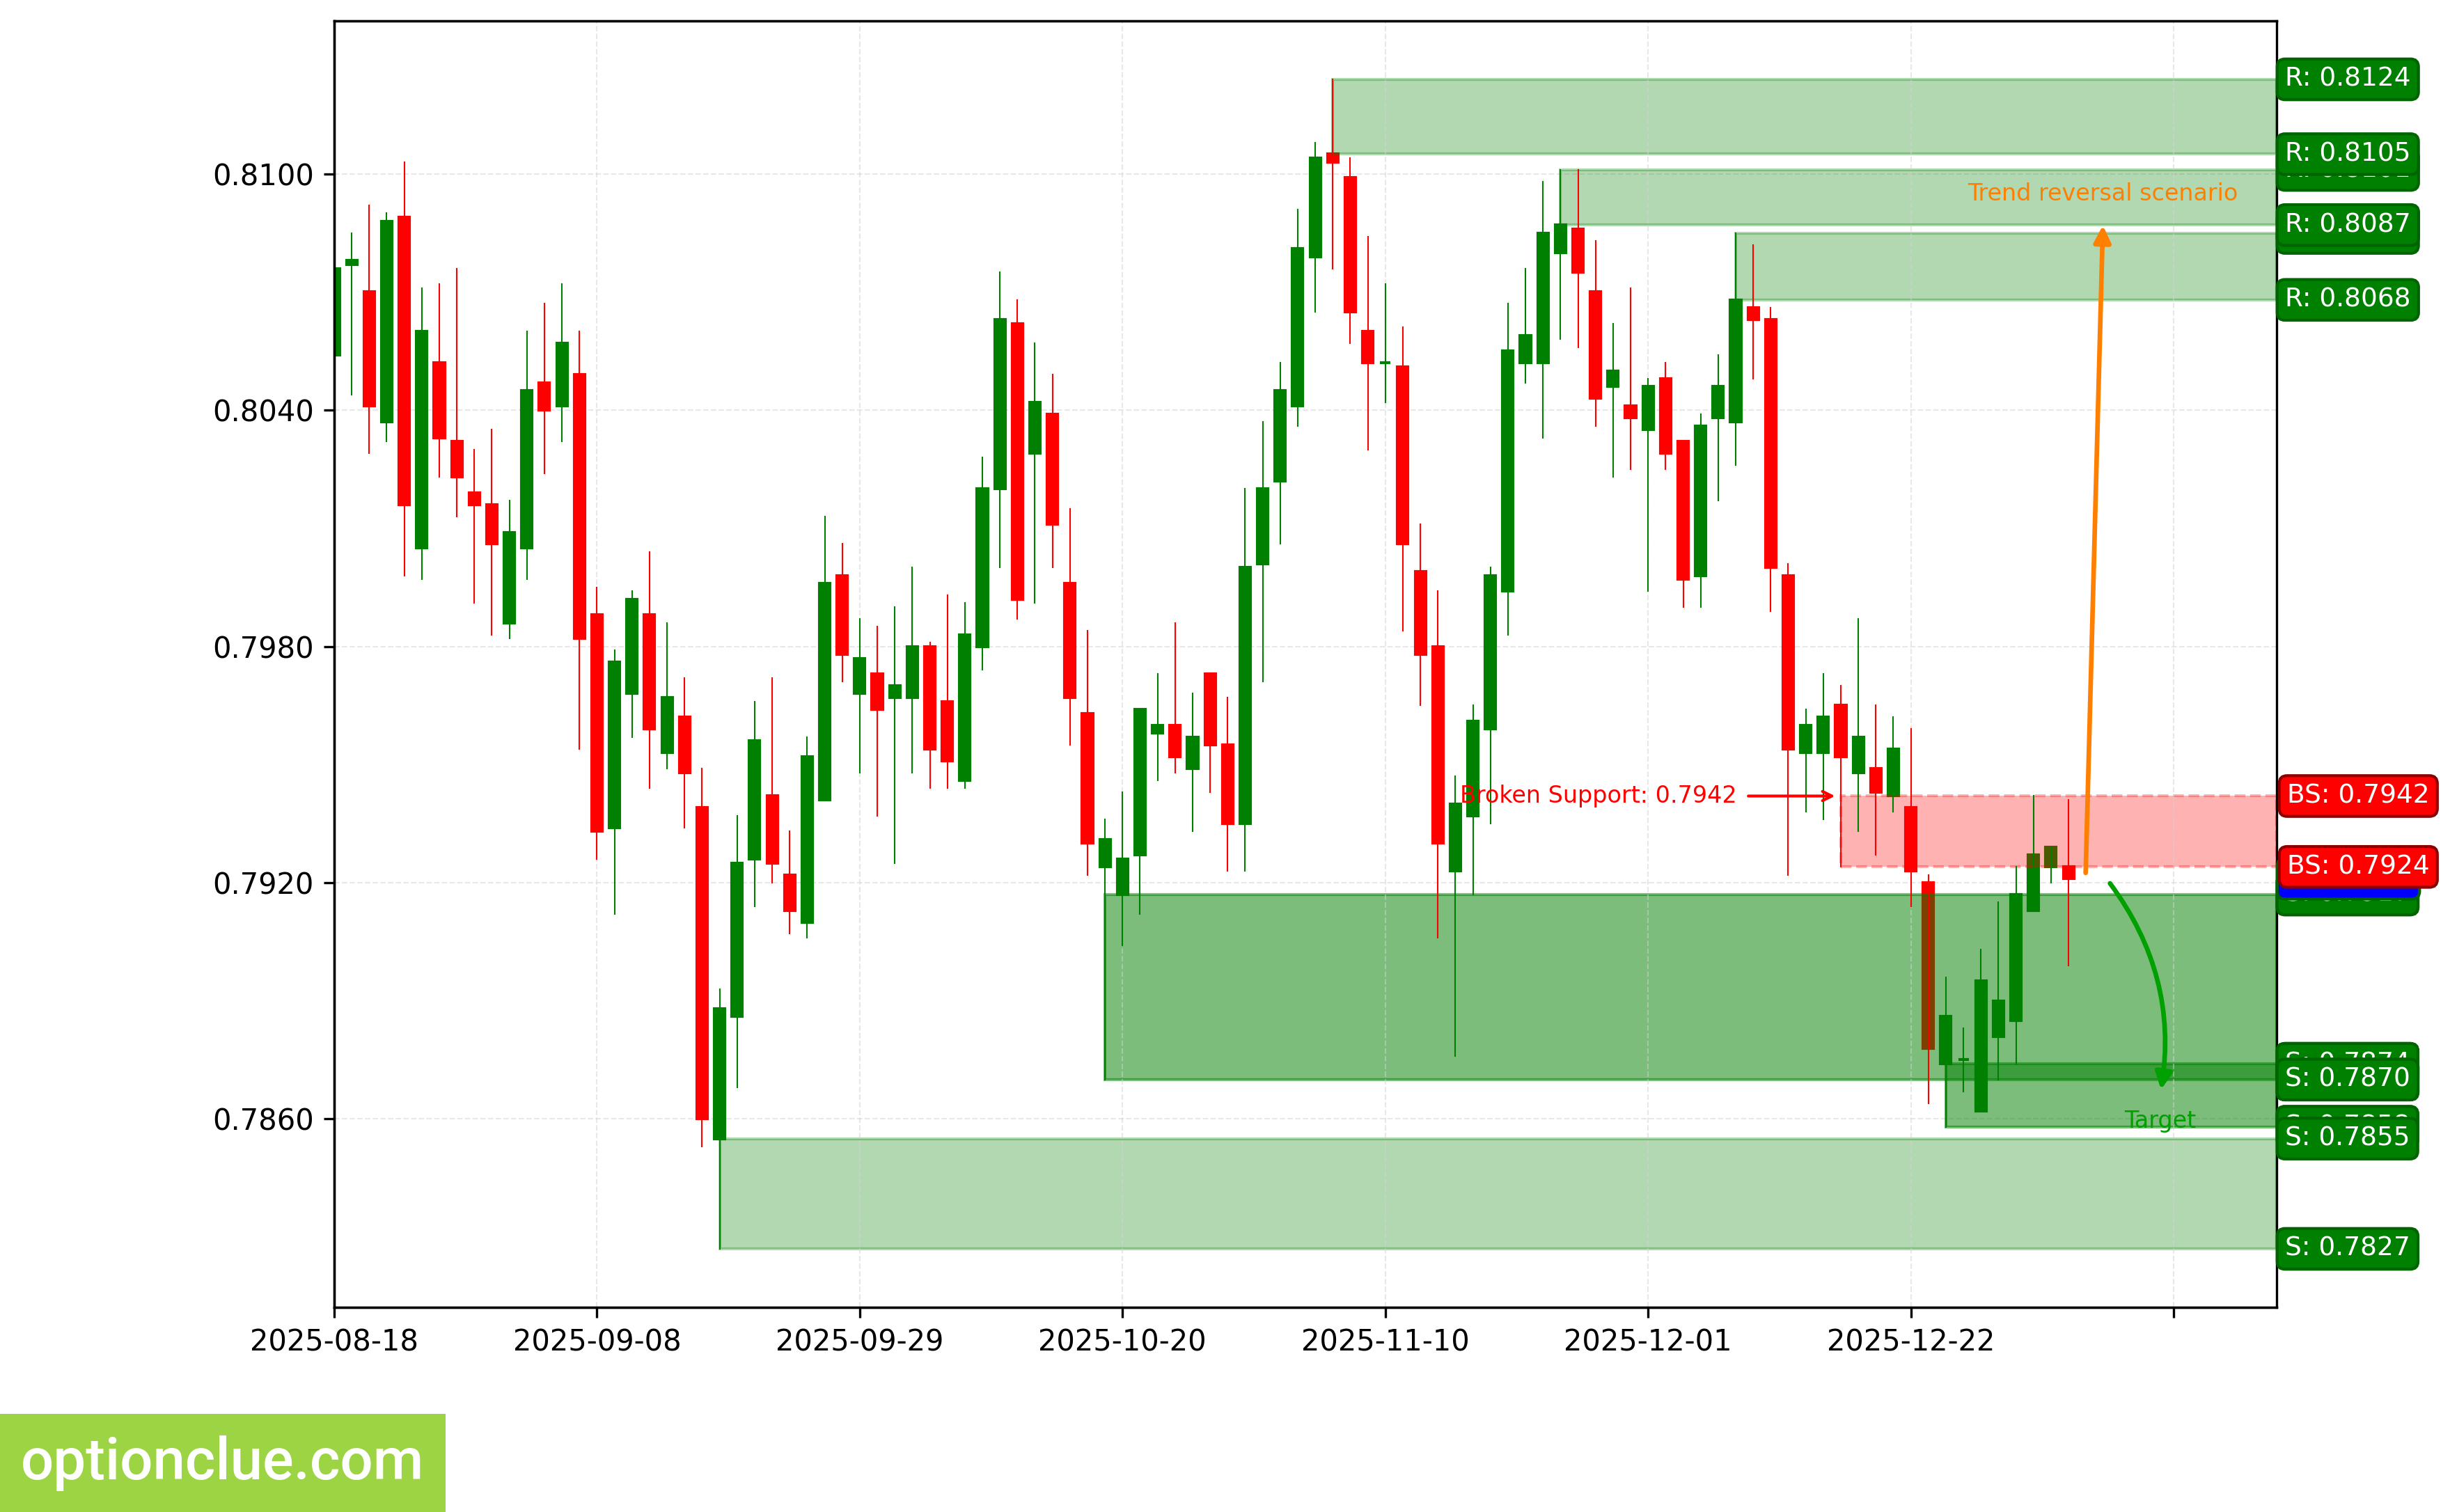
USDCHF. Technical analysis. D1.
Japanese Yen (USDJPY)
The bullish trend continues; 4 candlesticks ago the correction completed and a buy entry point on rebound formed; an impulse wave is developing. The last broken level is resistance (156.82 — 156.95). The breakout occurred 11 candlesticks ago, and price has returned to this last broken level.
The intermediate target for the upward movement is the resistance level with boundaries 157.73 — 157.78. In case of successful trend development, the farther target will be at the resistance level with boundaries 161.69 — 161.85.
The potential profit/risk ratio from current prices when setting targets and fixing risks at daily timeframe levels may be low (about 0.4:1). Using the farther target — about 2:1.
Long positions will remain relevant as long as the market stays above the nearest support level with boundaries 155.75 — 156.00. If the market successfully closes below this support, the trend will reverse to the opposite (bearish).
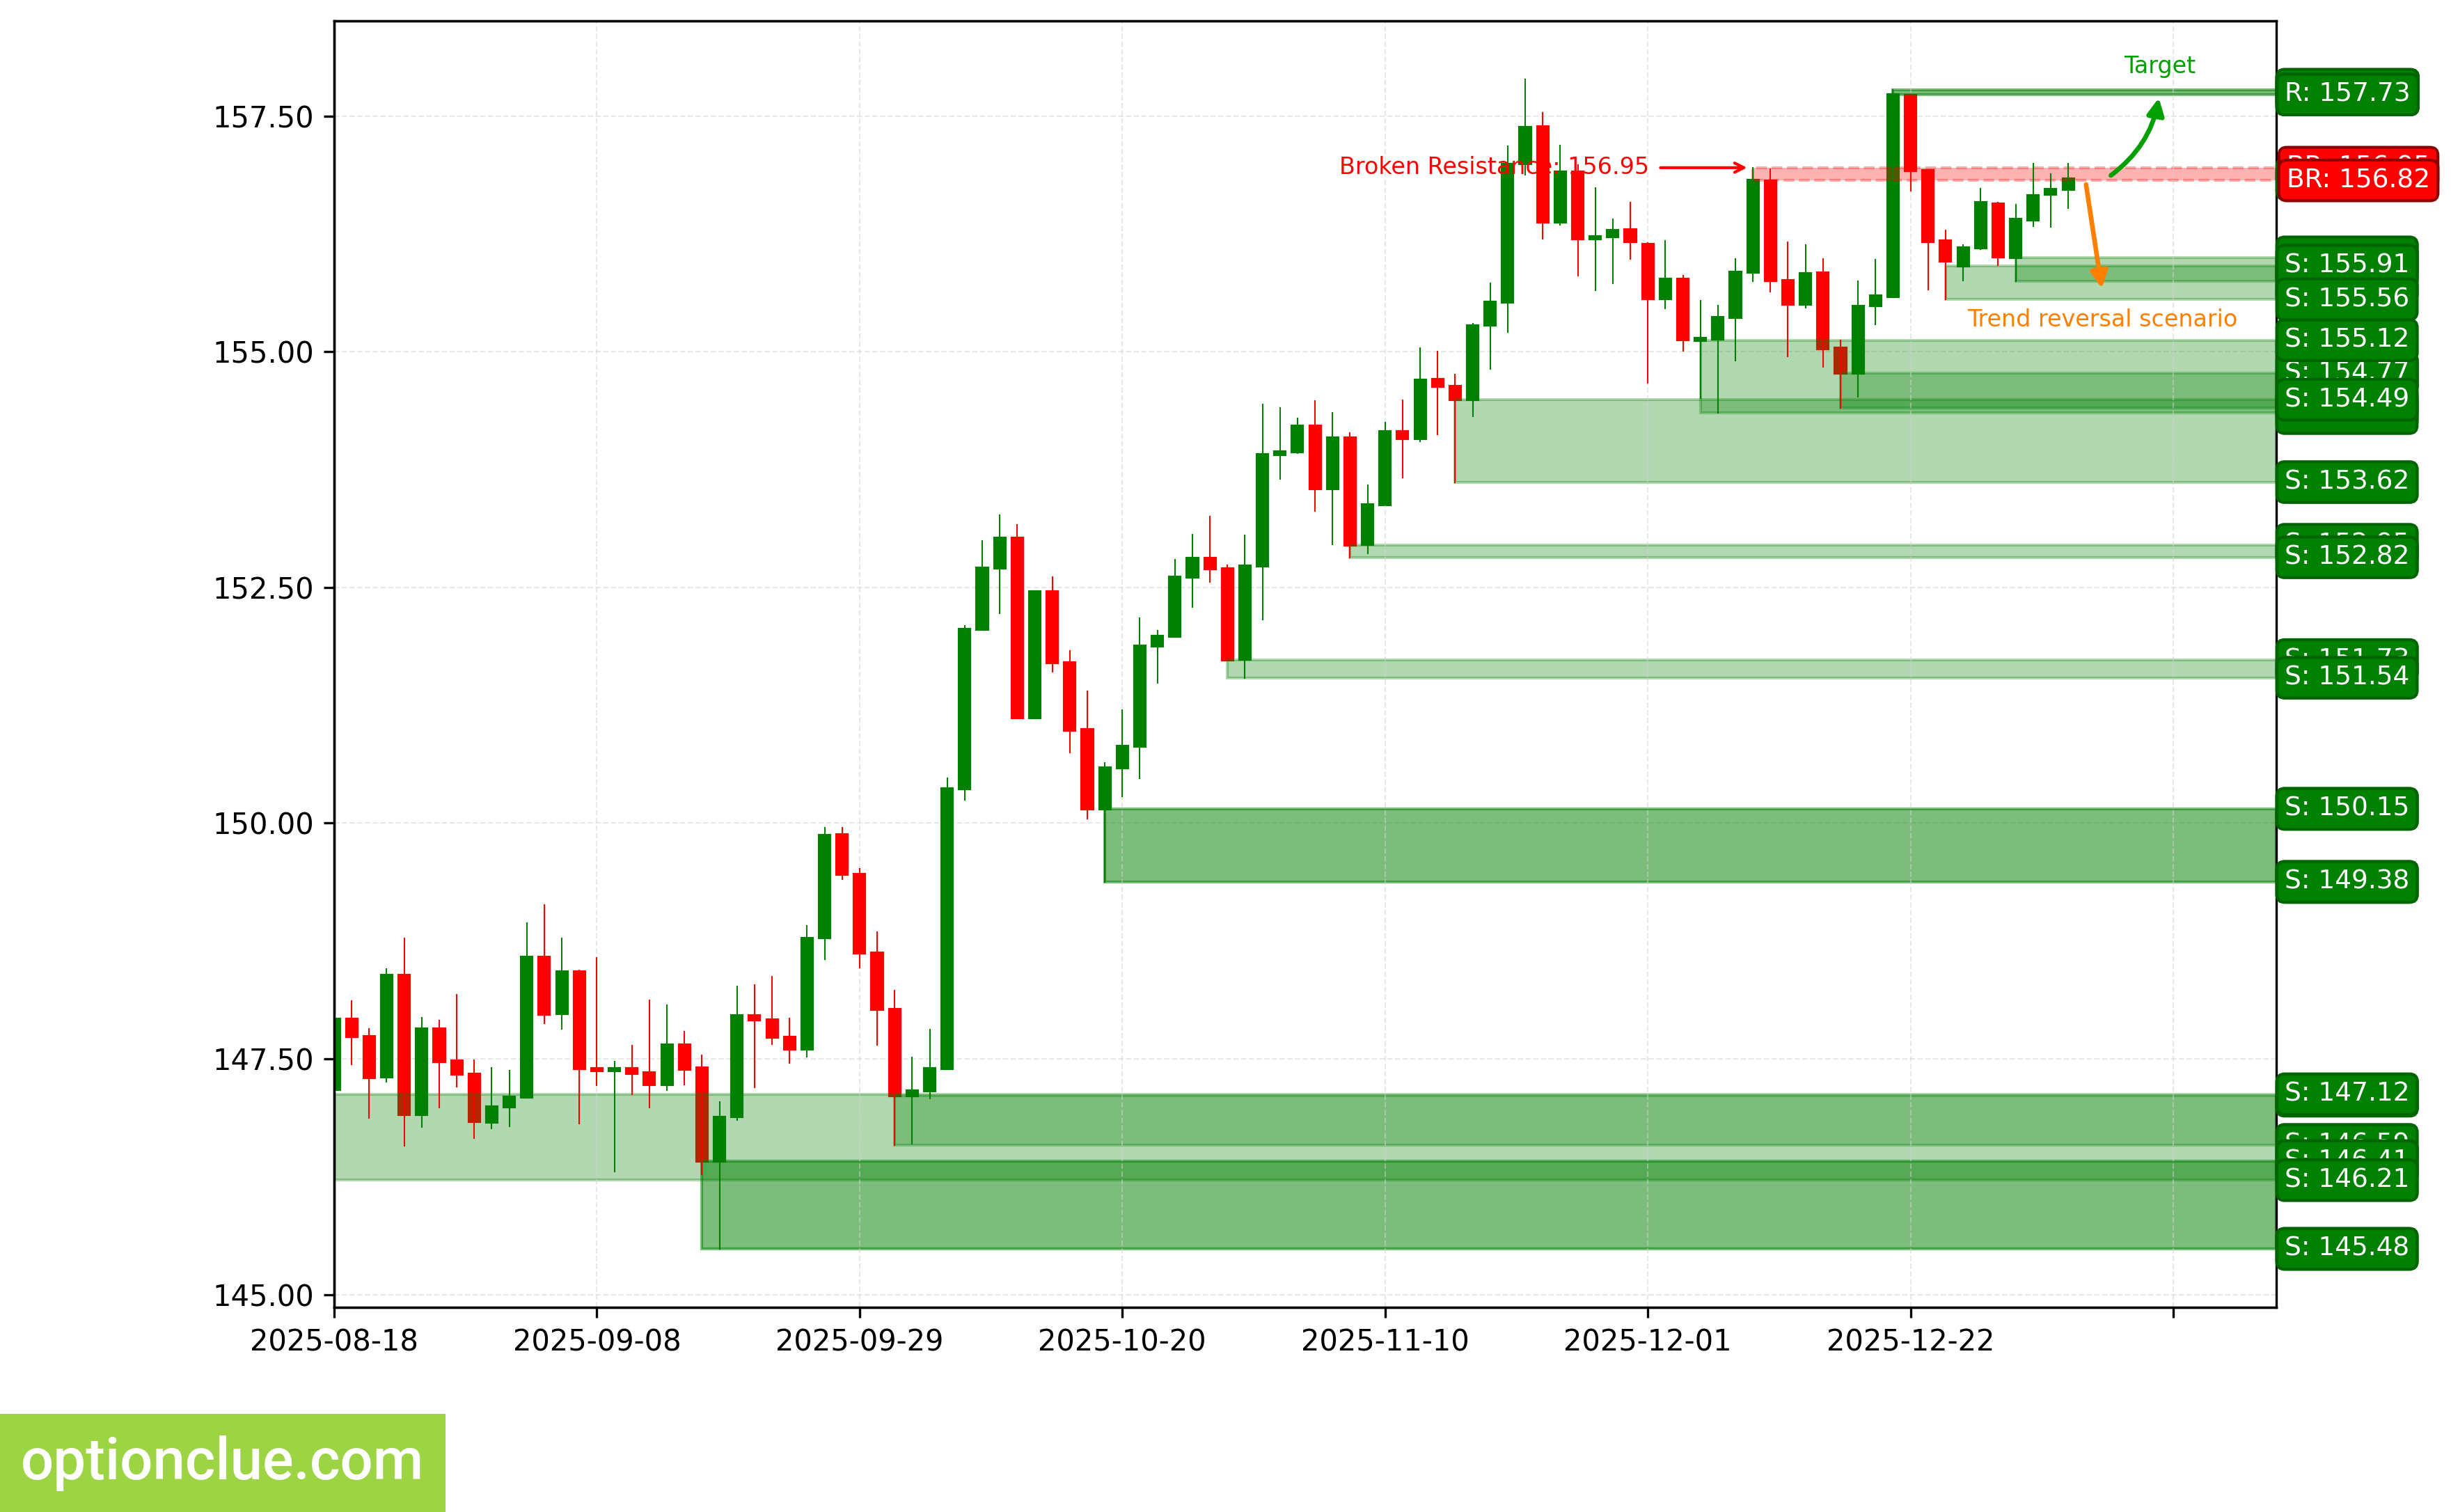
USDJPY. Technical analysis. D1.
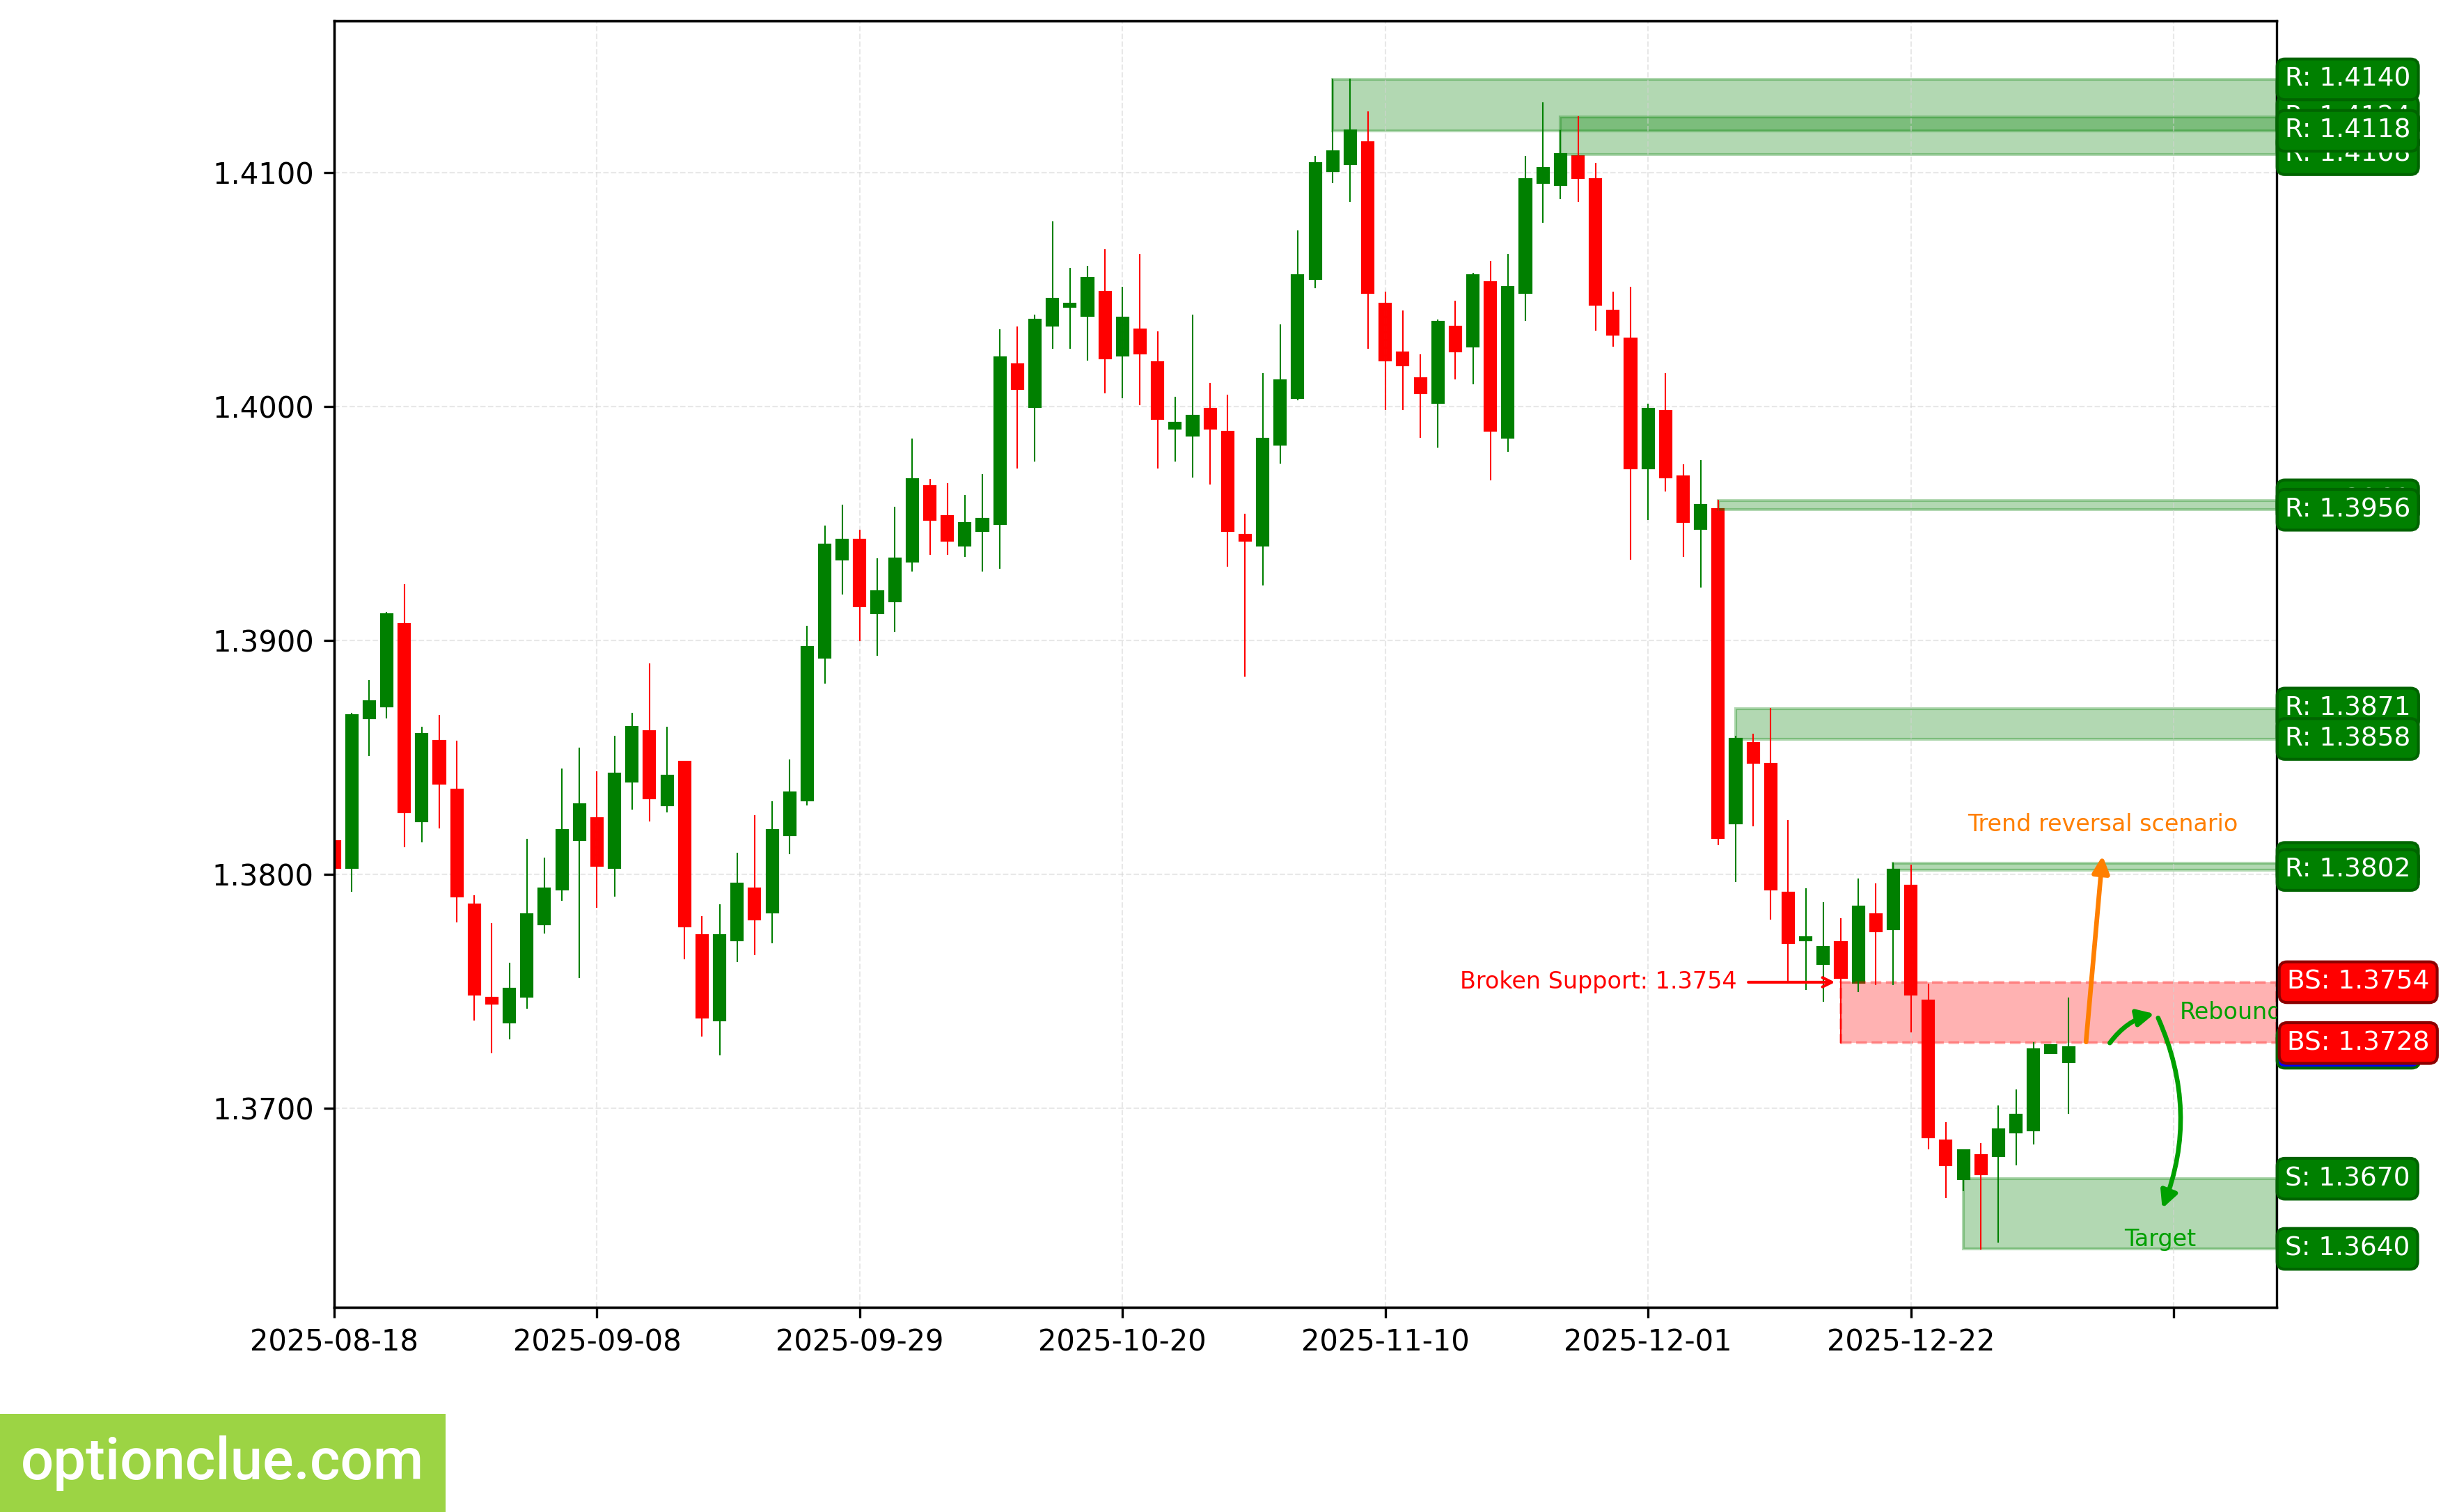
Canadian Dollar (USDCAD)
The bearish trend continues, with a corrective wave developing. A sell entry point on rebound may form after the current correction completes. The last broken level is support (1.3728 — 1.3754). The breakout occurred 9 candlesticks ago.
The intermediate target for the downward movement is the support level with boundaries 1.3640 — 1.3670. In case of successful trend development, the farther target will be at the support level with boundaries 1.3573 — 1.3590.
The potential profit/risk ratio from current prices when setting targets and fixing risks at daily timeframe levels may be low (around 0.4:1). Using the farther target — about 1:1. If the correction completes near the resistance level (1.3802 — 1.3805), the potential profit/risk ratio may be about 2:1. For the farther target — over 3:1.
Short positions will remain relevant as long as the market stays below the nearest resistance level with boundaries 1.3802 — 1.3805. If the market successfully closes above this nearest resistance, the trend will reverse to the opposite (bullish).
USDCAD. Technical analysis. D1.
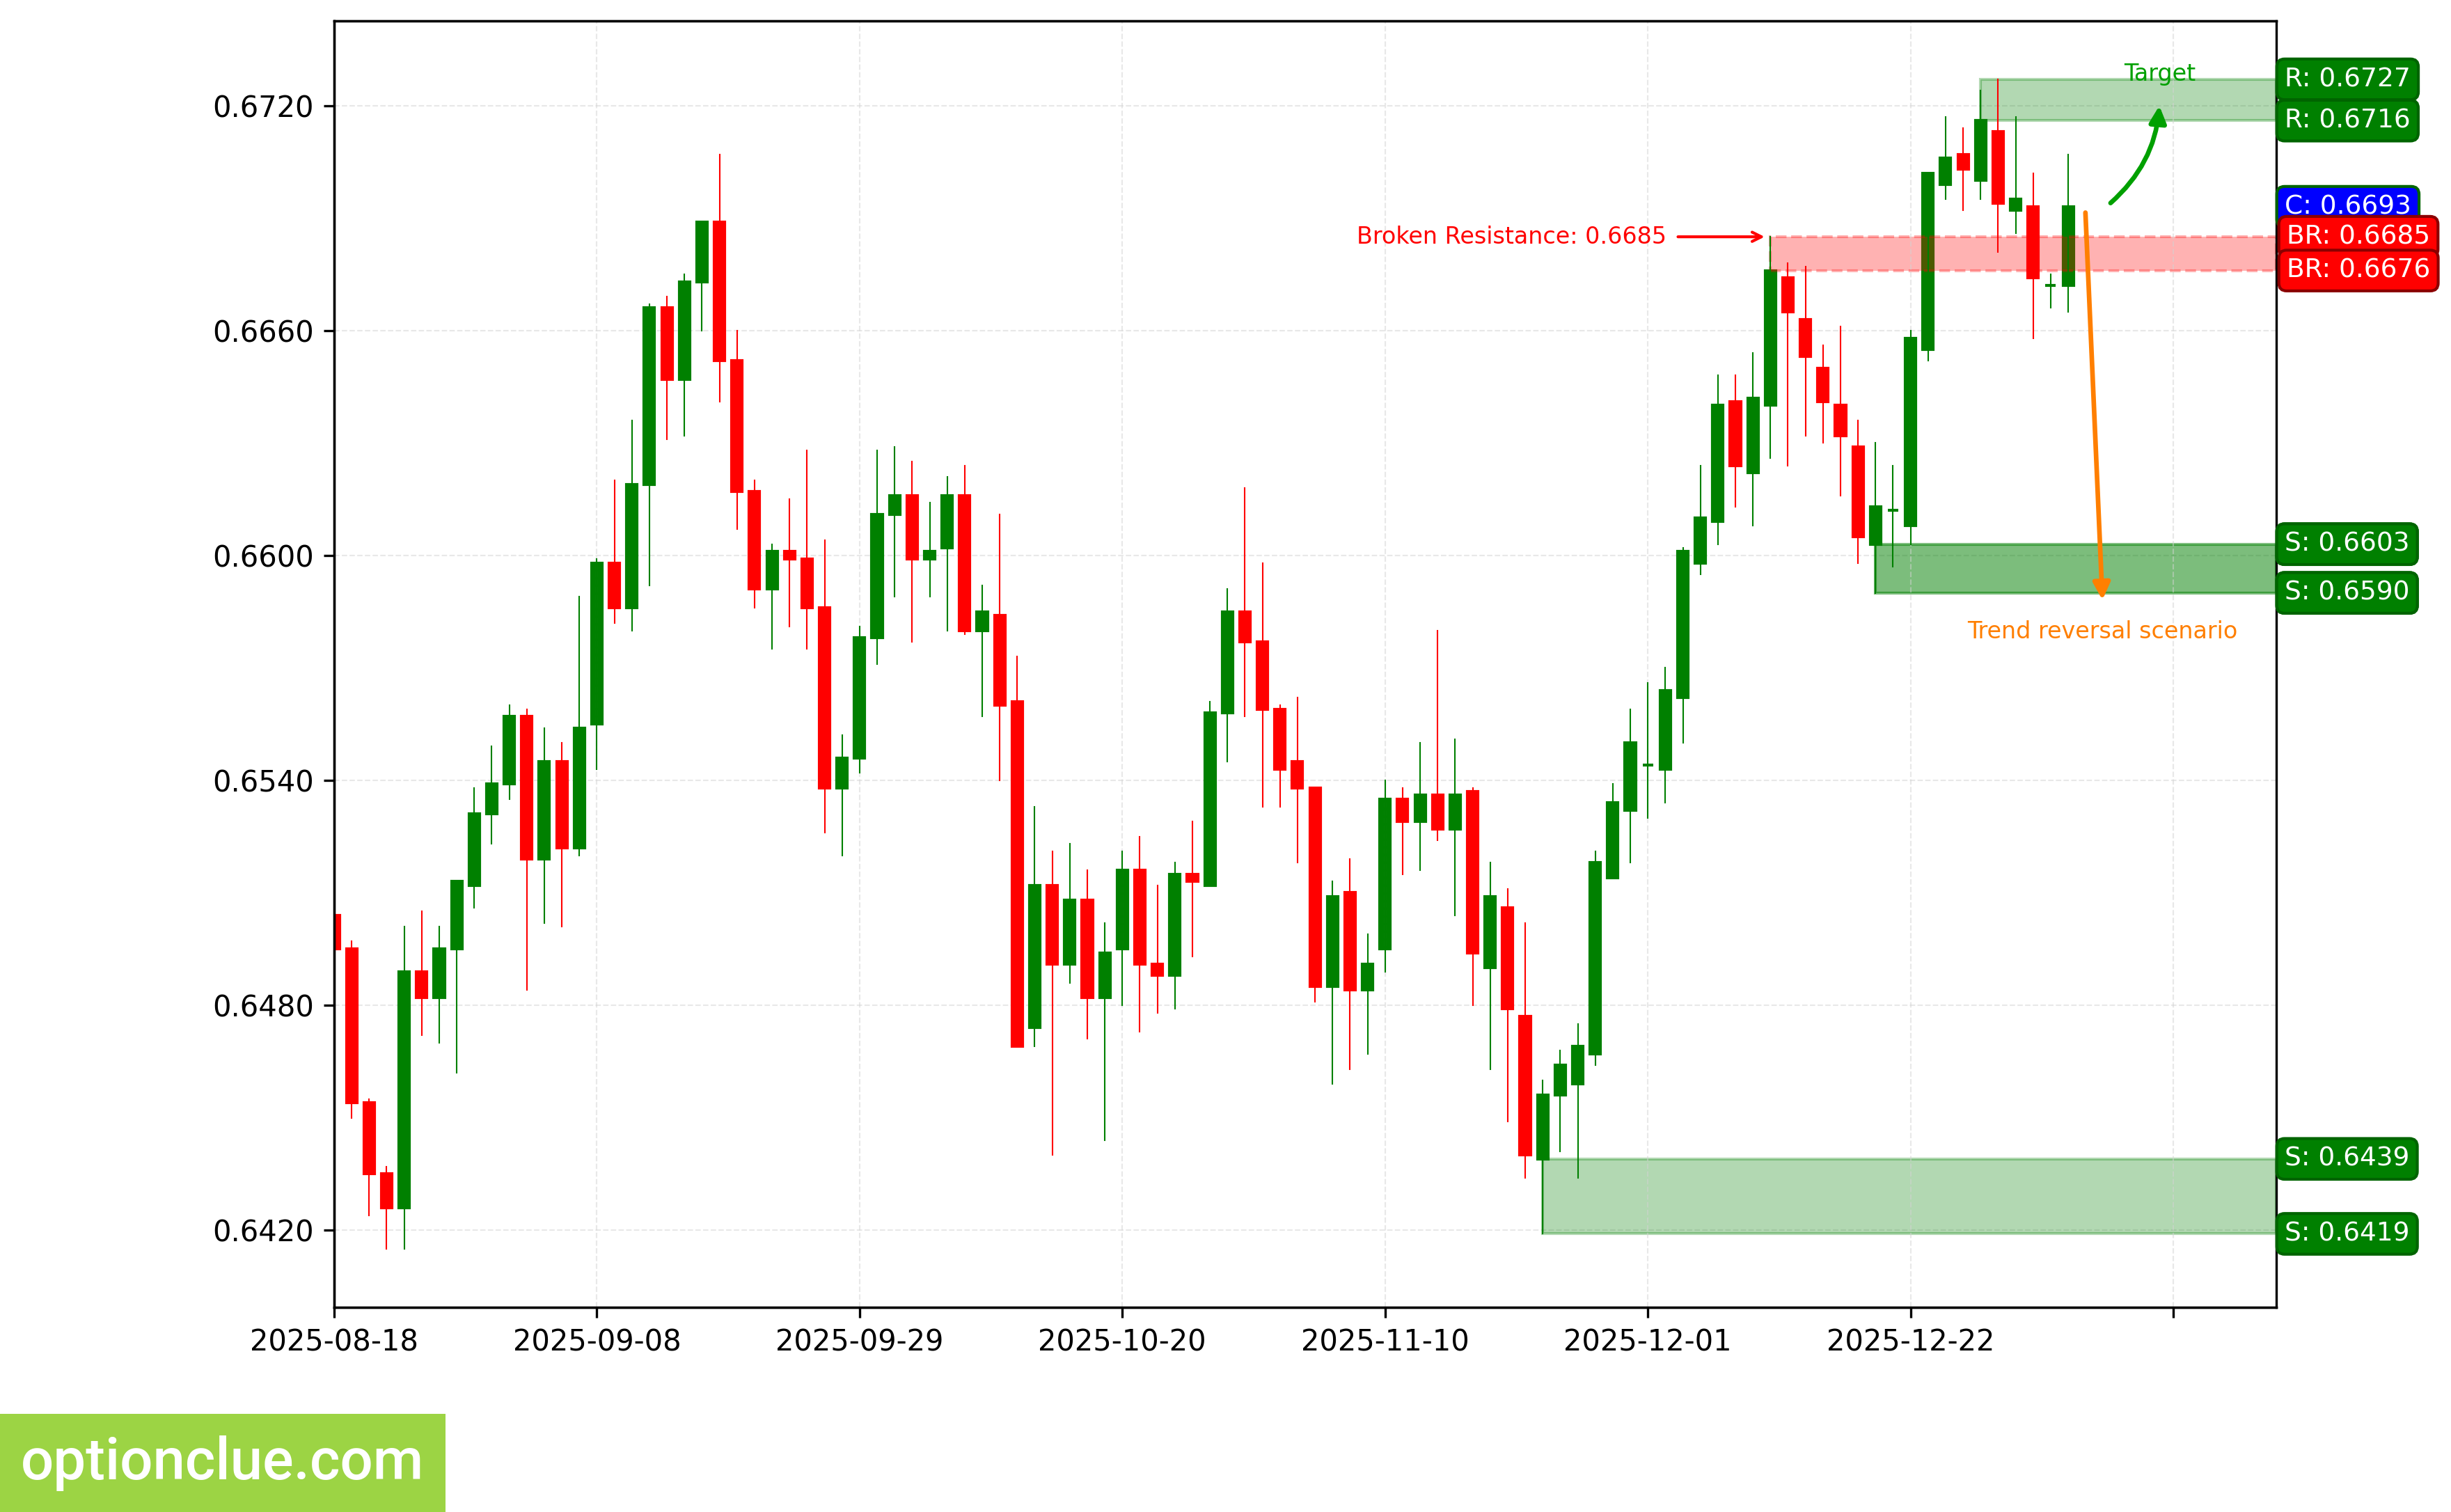
Australian Dollar (AUDUSD)
The bullish trend continues; 4 candlesticks ago the correction completed and a buy entry point on rebound formed; an impulse wave is developing. The last broken level is resistance (0.6676 — 0.6685).
The intermediate target for the upward movement is the resistance level with boundaries 0.6716 — 0.6727. In case of successful trend development, the farther target will be at the resistance level with boundaries 0.6915 — 0.6942.
The potential profit/risk ratio from current prices when setting targets and fixing risks at daily timeframe levels may be low (about 0.2:1). Using the farther target — about 1.5:1.
Long positions will remain relevant as long as the market stays above the nearest support level with boundaries 0.6590 — 0.6603. If the market successfully closes below this support, the trend will reverse to the opposite (bearish).
AUDUSD. Technical analysis. D1.
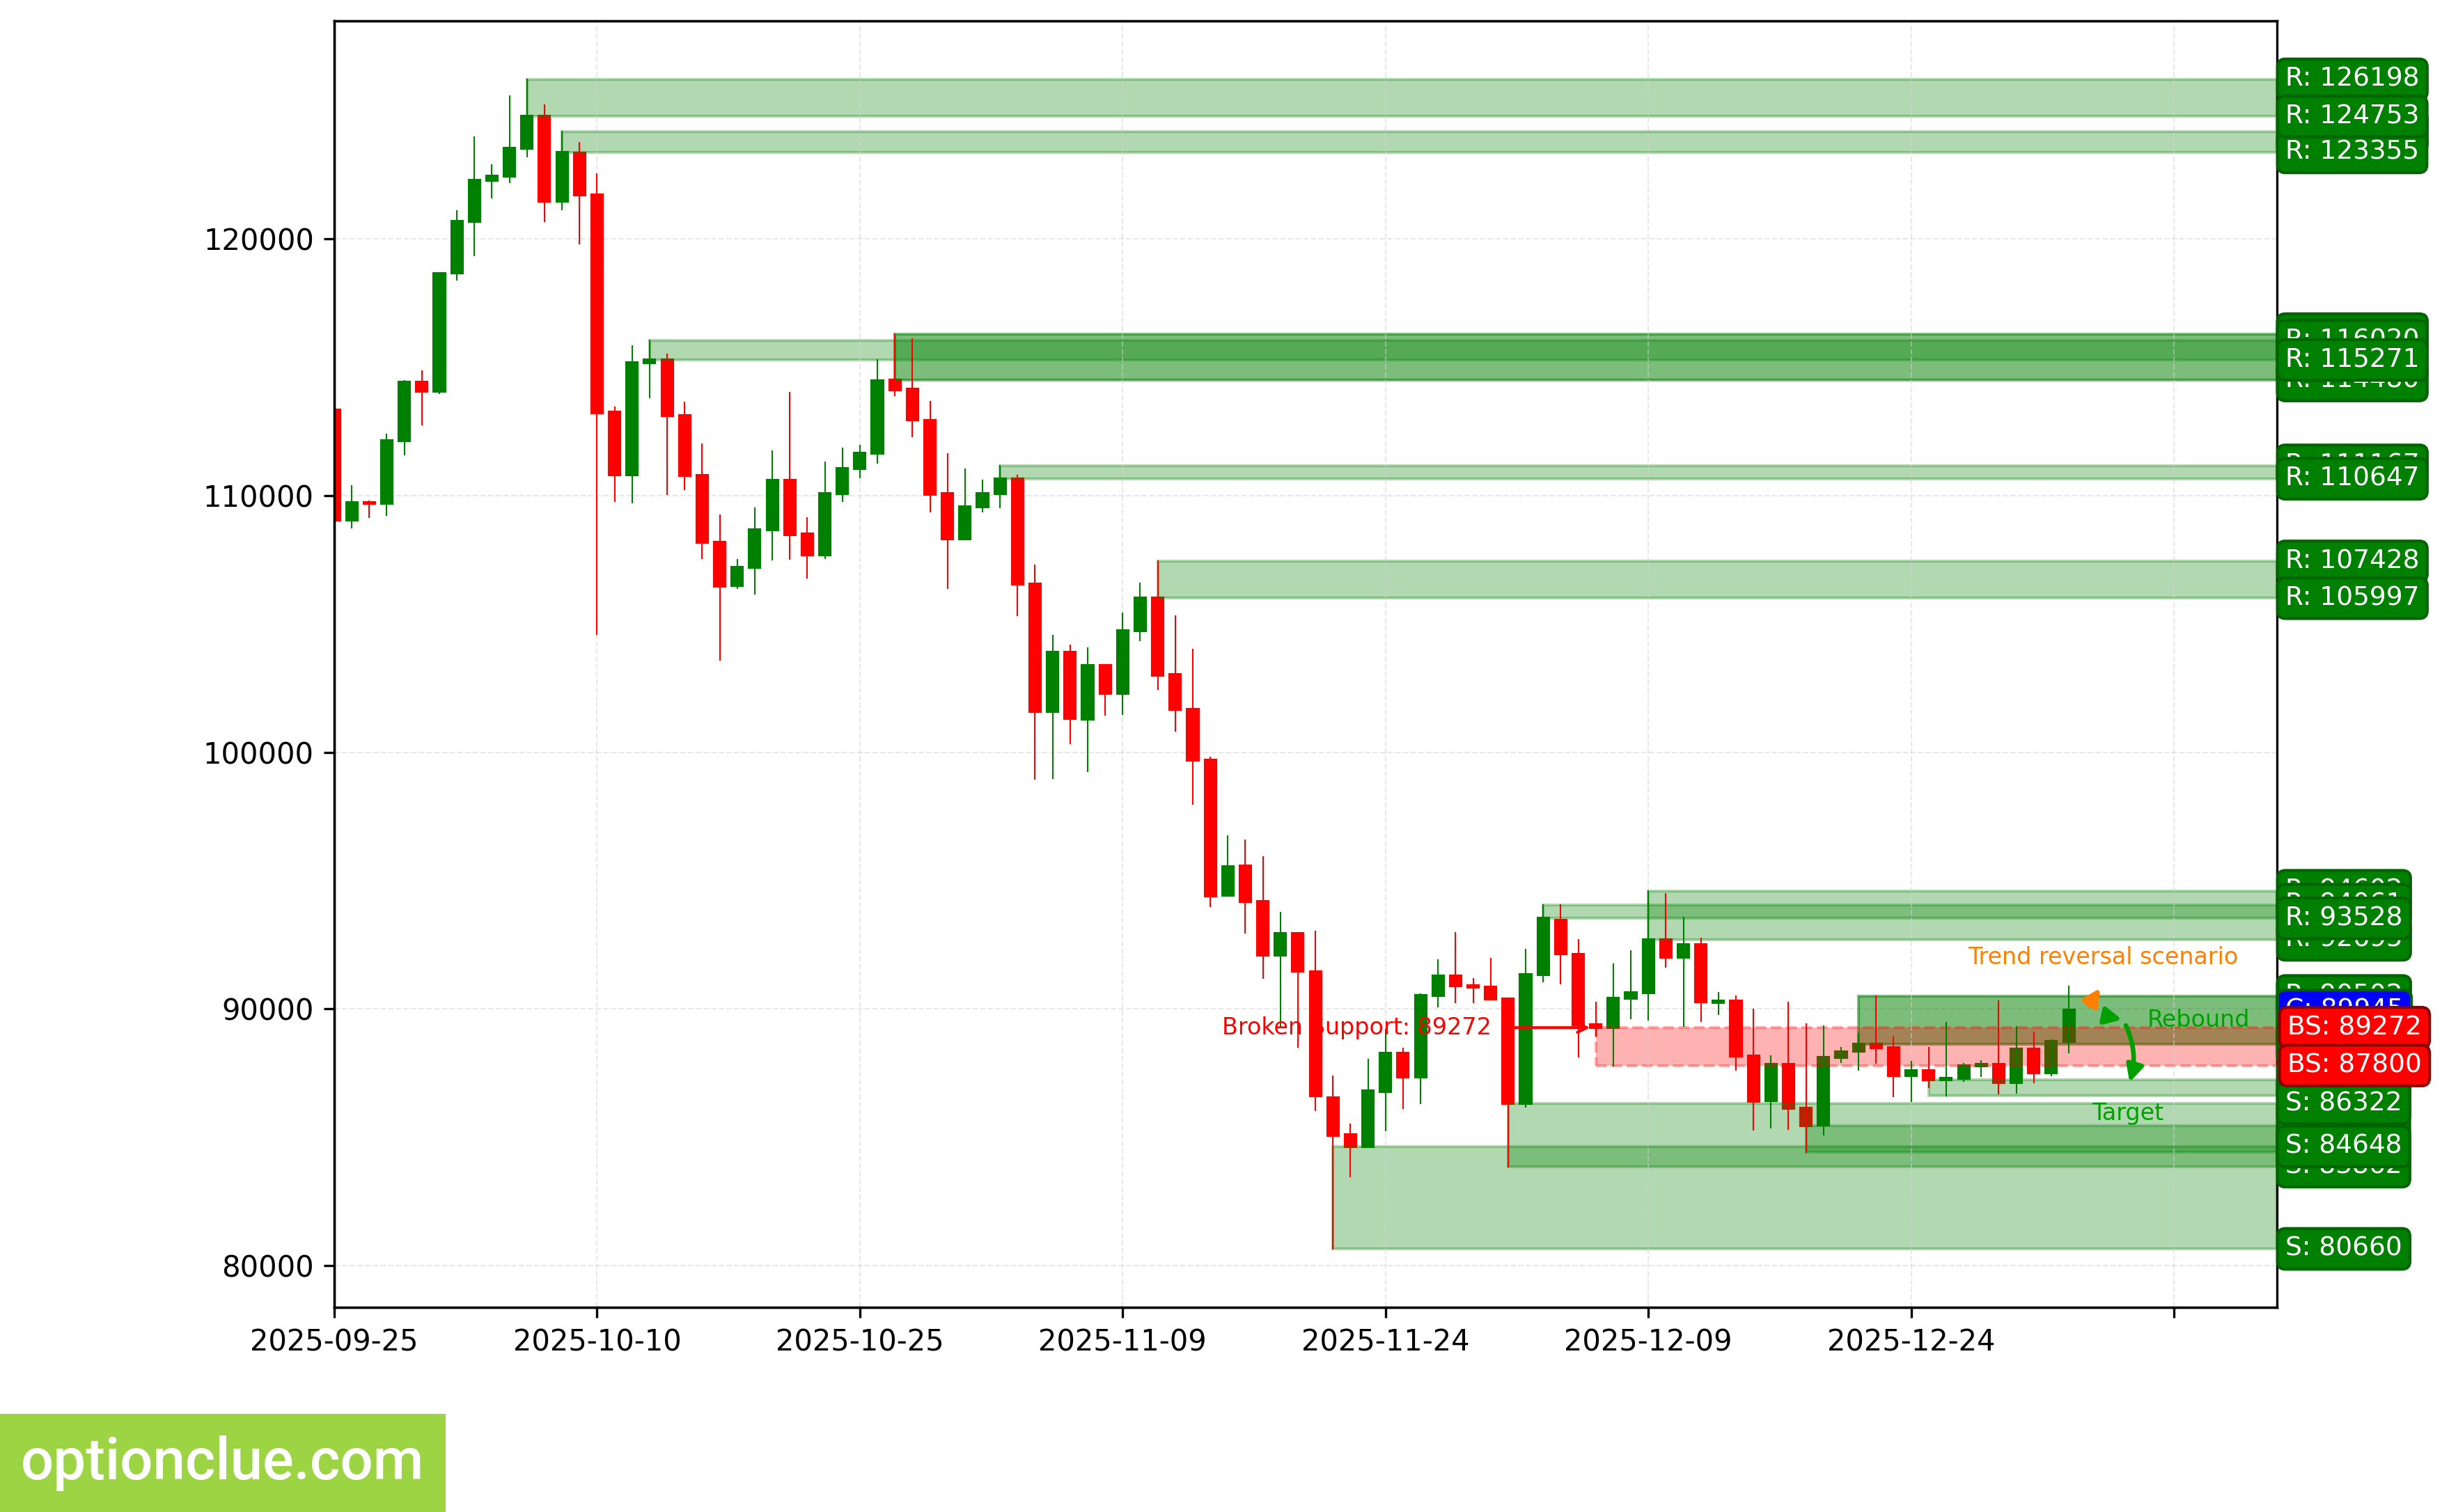
Bitcoin (BTC)
The bearish trend continues, with another corrective wave developing. A sell entry point on rebound may form after the current correction completes. The last broken level is support (87800 — 89272). The breakout occurred 19 candlesticks ago.
The intermediate target for the downward movement is the support level with boundaries 86628 — 87235.
If the correction completes near the resistance level (88622 — 90502), the potential profit/risk ratio may be about 1.1:1.
Short positions will remain relevant as long as the market stays below the nearest resistance level with boundaries 88622 — 90502. If the market successfully closes above this nearest resistance, the trend will reverse to the opposite (bullish).
BTC. Technical analysis. D1.
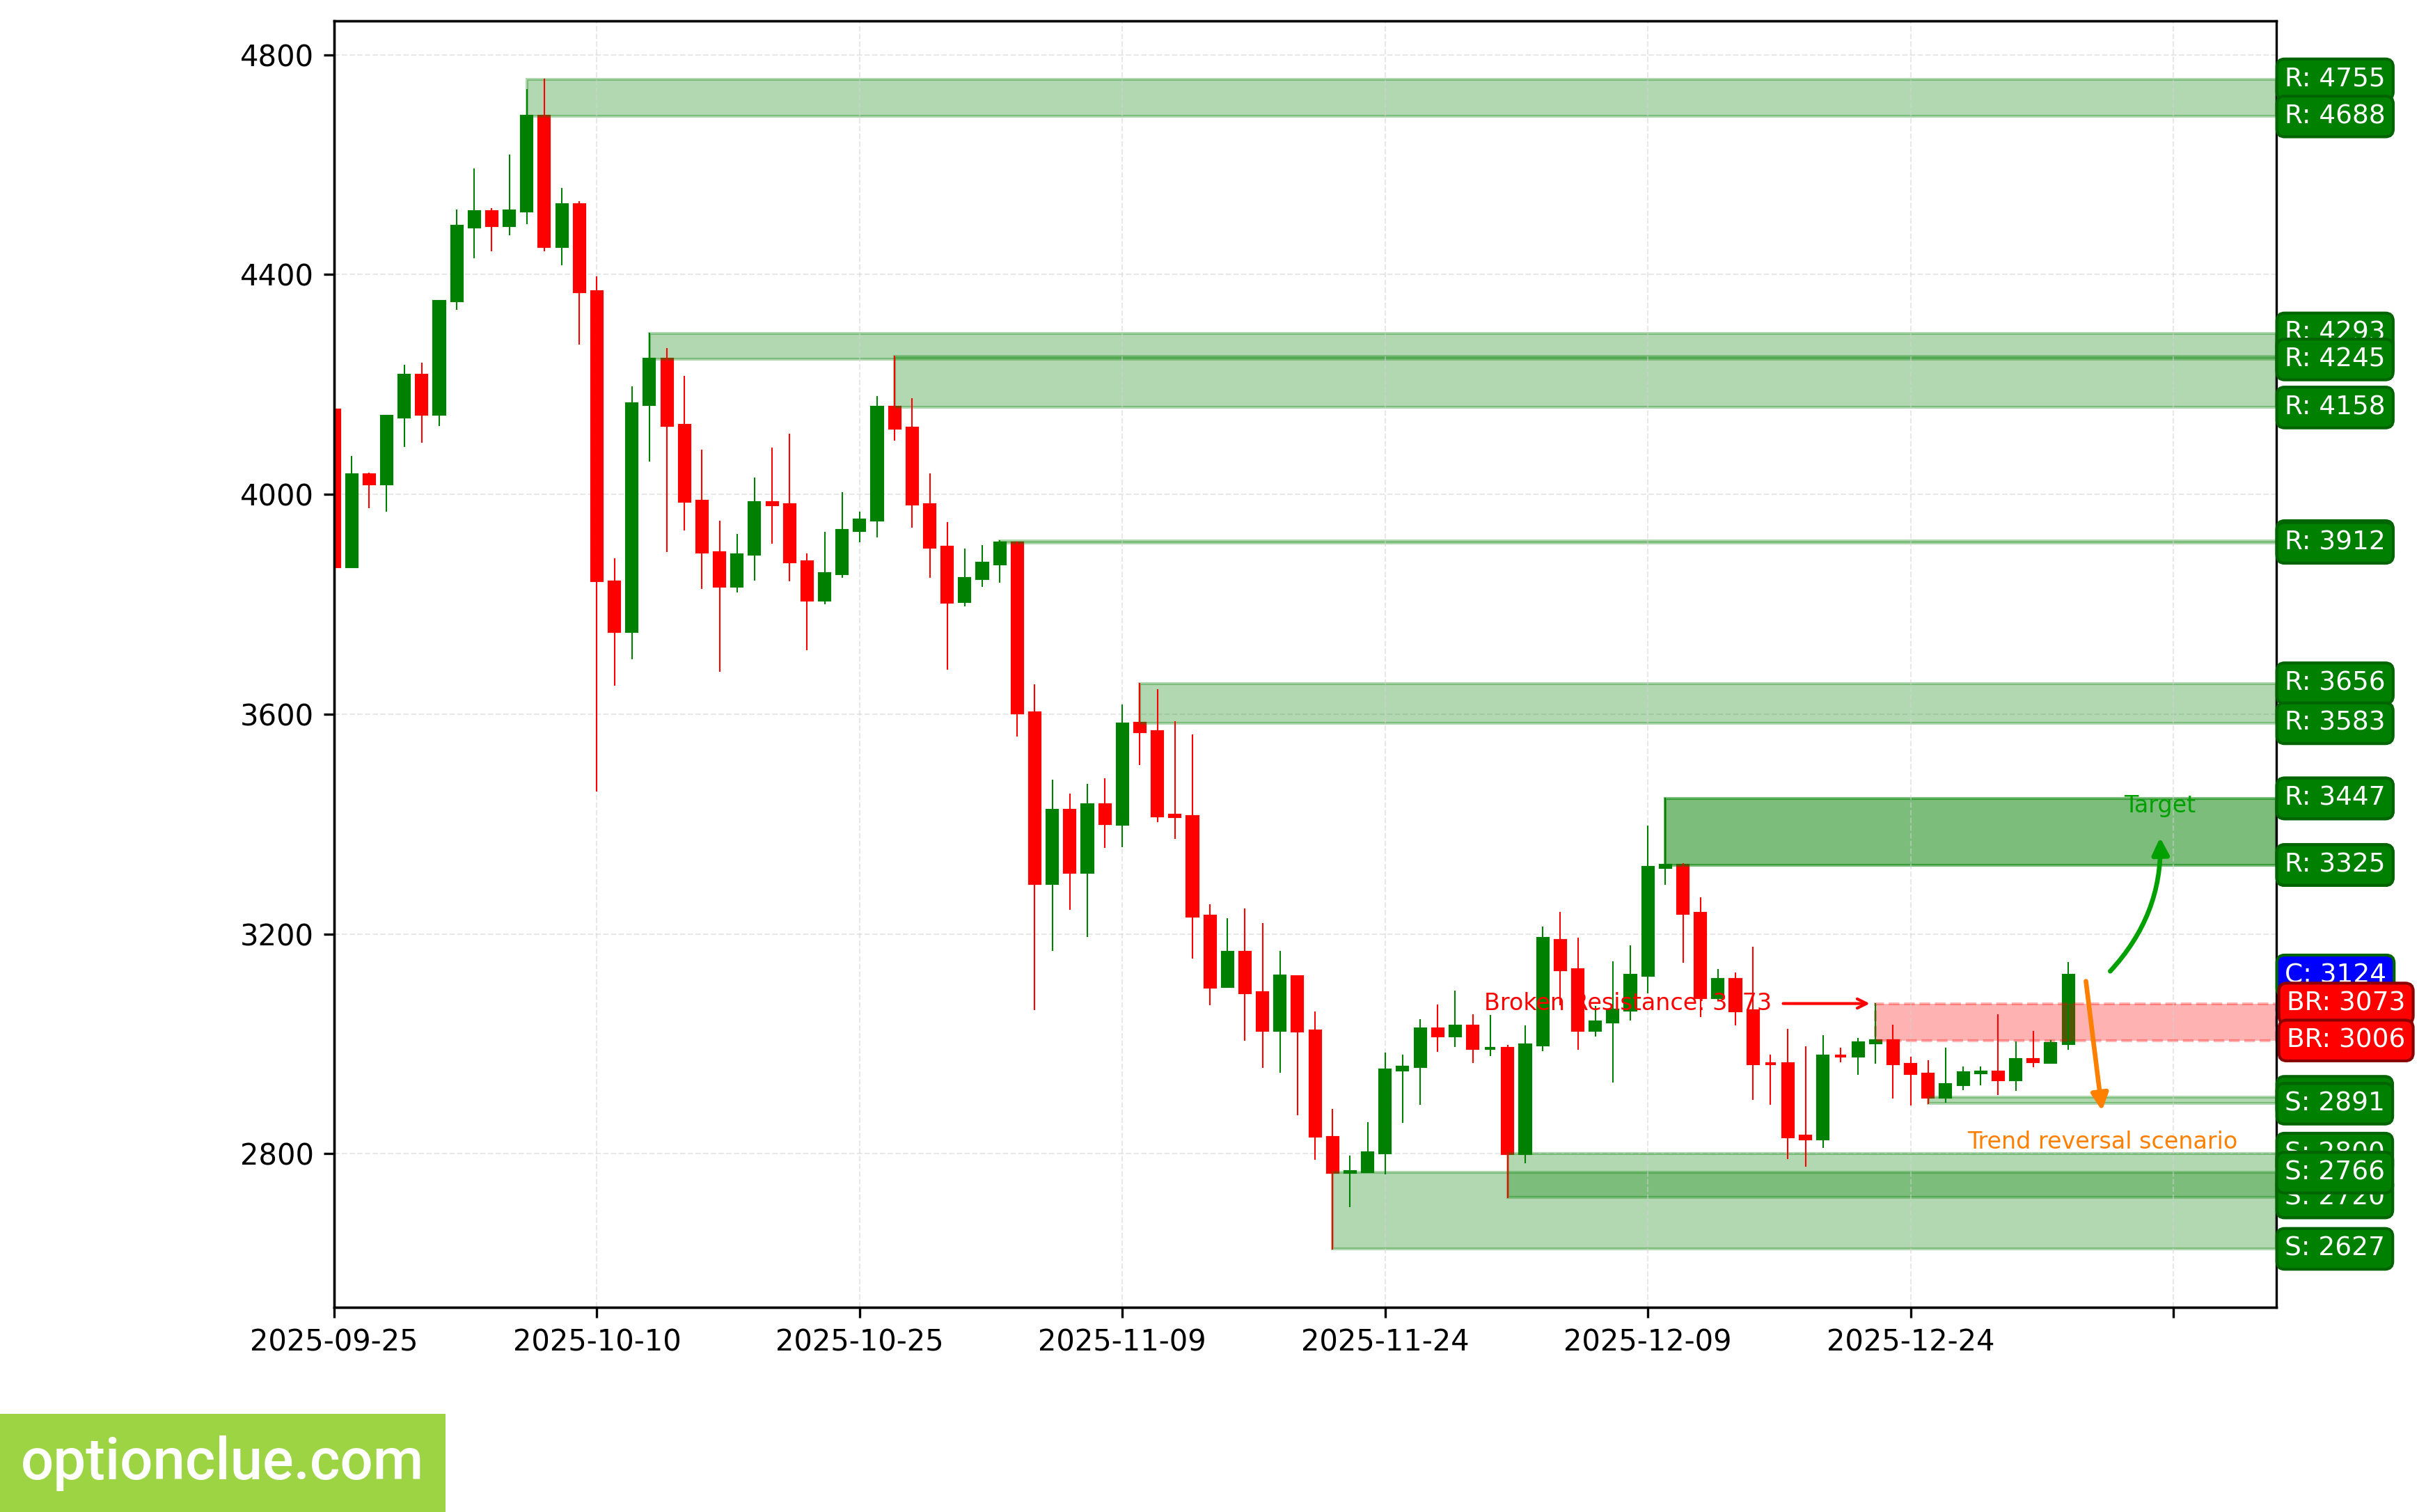
Ether (ETH)
The trend has changed to bullish when the resistance level (3006–3073) was broken on the last closed candlestick. An impulse wave is developing.
The intermediate target for the upward movement is the resistance level with boundaries 3325–3447. In case of successful trend development, the farther target will be at the resistance level with boundaries 3583–3656.
If the new correction completes near the support level (2891–2904), the potential profit/risk ratio may be around 4.6:1. Using the farther target — around 7.4:1. If the correction completes near the last broken level (3006–3073), the potential profit/risk ratio is around 1.2:1. Selecting the farther target — about 2.3:1.
Long positions will remain relevant as long as the market stays above the nearest support level with boundaries 2891–2904. If the market successfully closes below this support, the trend will reverse to the opposite (bearish).
ETH. Technical analysis. D1.
Apple Inc (AAPL)
The bullish trend continues, with a corrective wave developing. A buy entry point on rebound may form after the current correction completes. The last broken level is resistance (275.25 — 276.70).
The intermediate target for the upward movement is the resistance level with boundaries 286.20 — 288.62.
If the correction completes near the support level (269.56 — 270.84), the potential profit/risk ratio may be about 3:1.
Long positions will remain relevant as long as the market stays above the nearest support level with boundaries 269.56 — 270.84. If the market successfully closes below this support, the trend will reverse to the opposite (bearish).
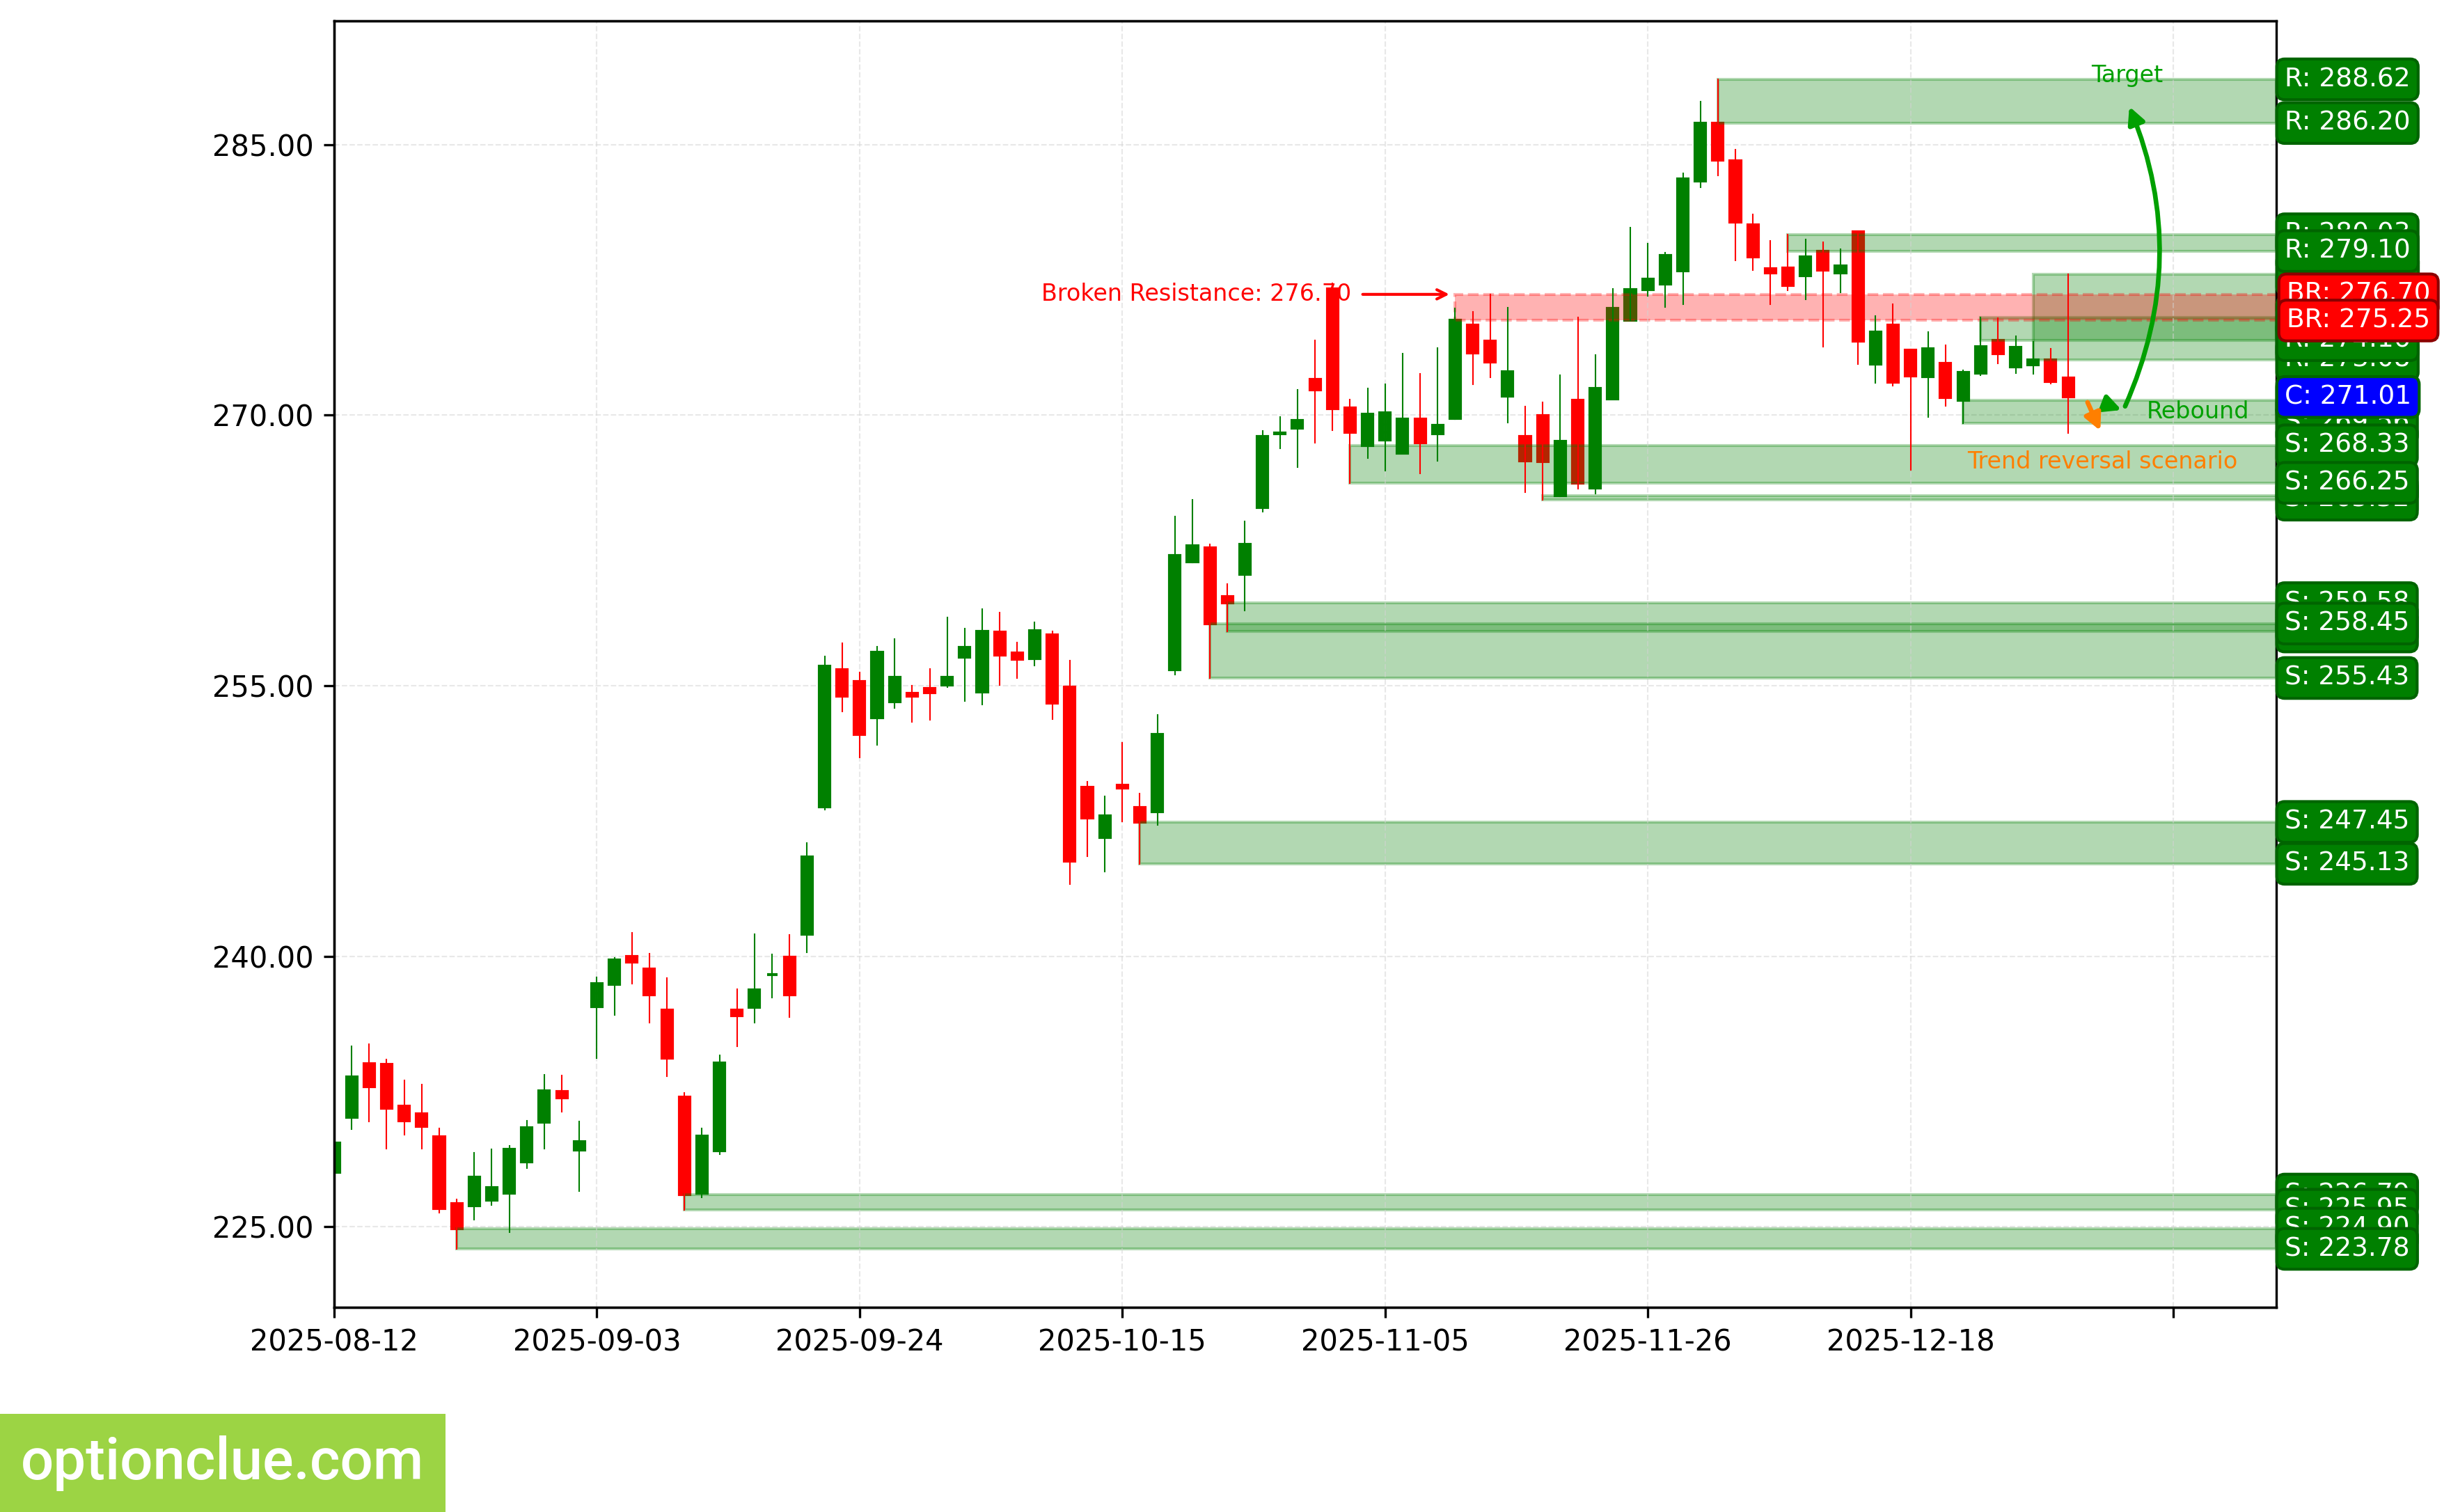
AAPL. Technical analysis. D1.
NVIDIA Corp (NVDA)
The bullish trend continues, with a corrective wave developing. A buy entry point on rebound may form after the current correction completes. The last broken level is resistance (185.56 — 188.00). The breakout occurred 7 candlesticks ago.
The intermediate target for the upward movement is the resistance level with boundaries 190.53 — 192.69. In case of successful trend development, the farther target will be at the resistance level with boundaries 199.05 — 199.94.
The potential profit/risk ratio from current prices when setting targets and fixing risks at daily timeframe levels may be low (around 0.1:1). Using the farther target — also low (about 0.4:1). If the correction completes near the support level (170.31 — 170.94), the potential profit/risk ratio may be over 3:1. For the farther target — over 5:1. If the correction completes near the last broken level (185.56 — 188.00), the potential profit/risk ratio may also be low (around 0.2:1). Selecting the farther target — modest (around 0.6:1).
Long positions will remain relevant as long as the market stays above the nearest support level with boundaries 170.31 — 170.94. If the market successfully closes below this support, the trend will reverse to the opposite (bearish).
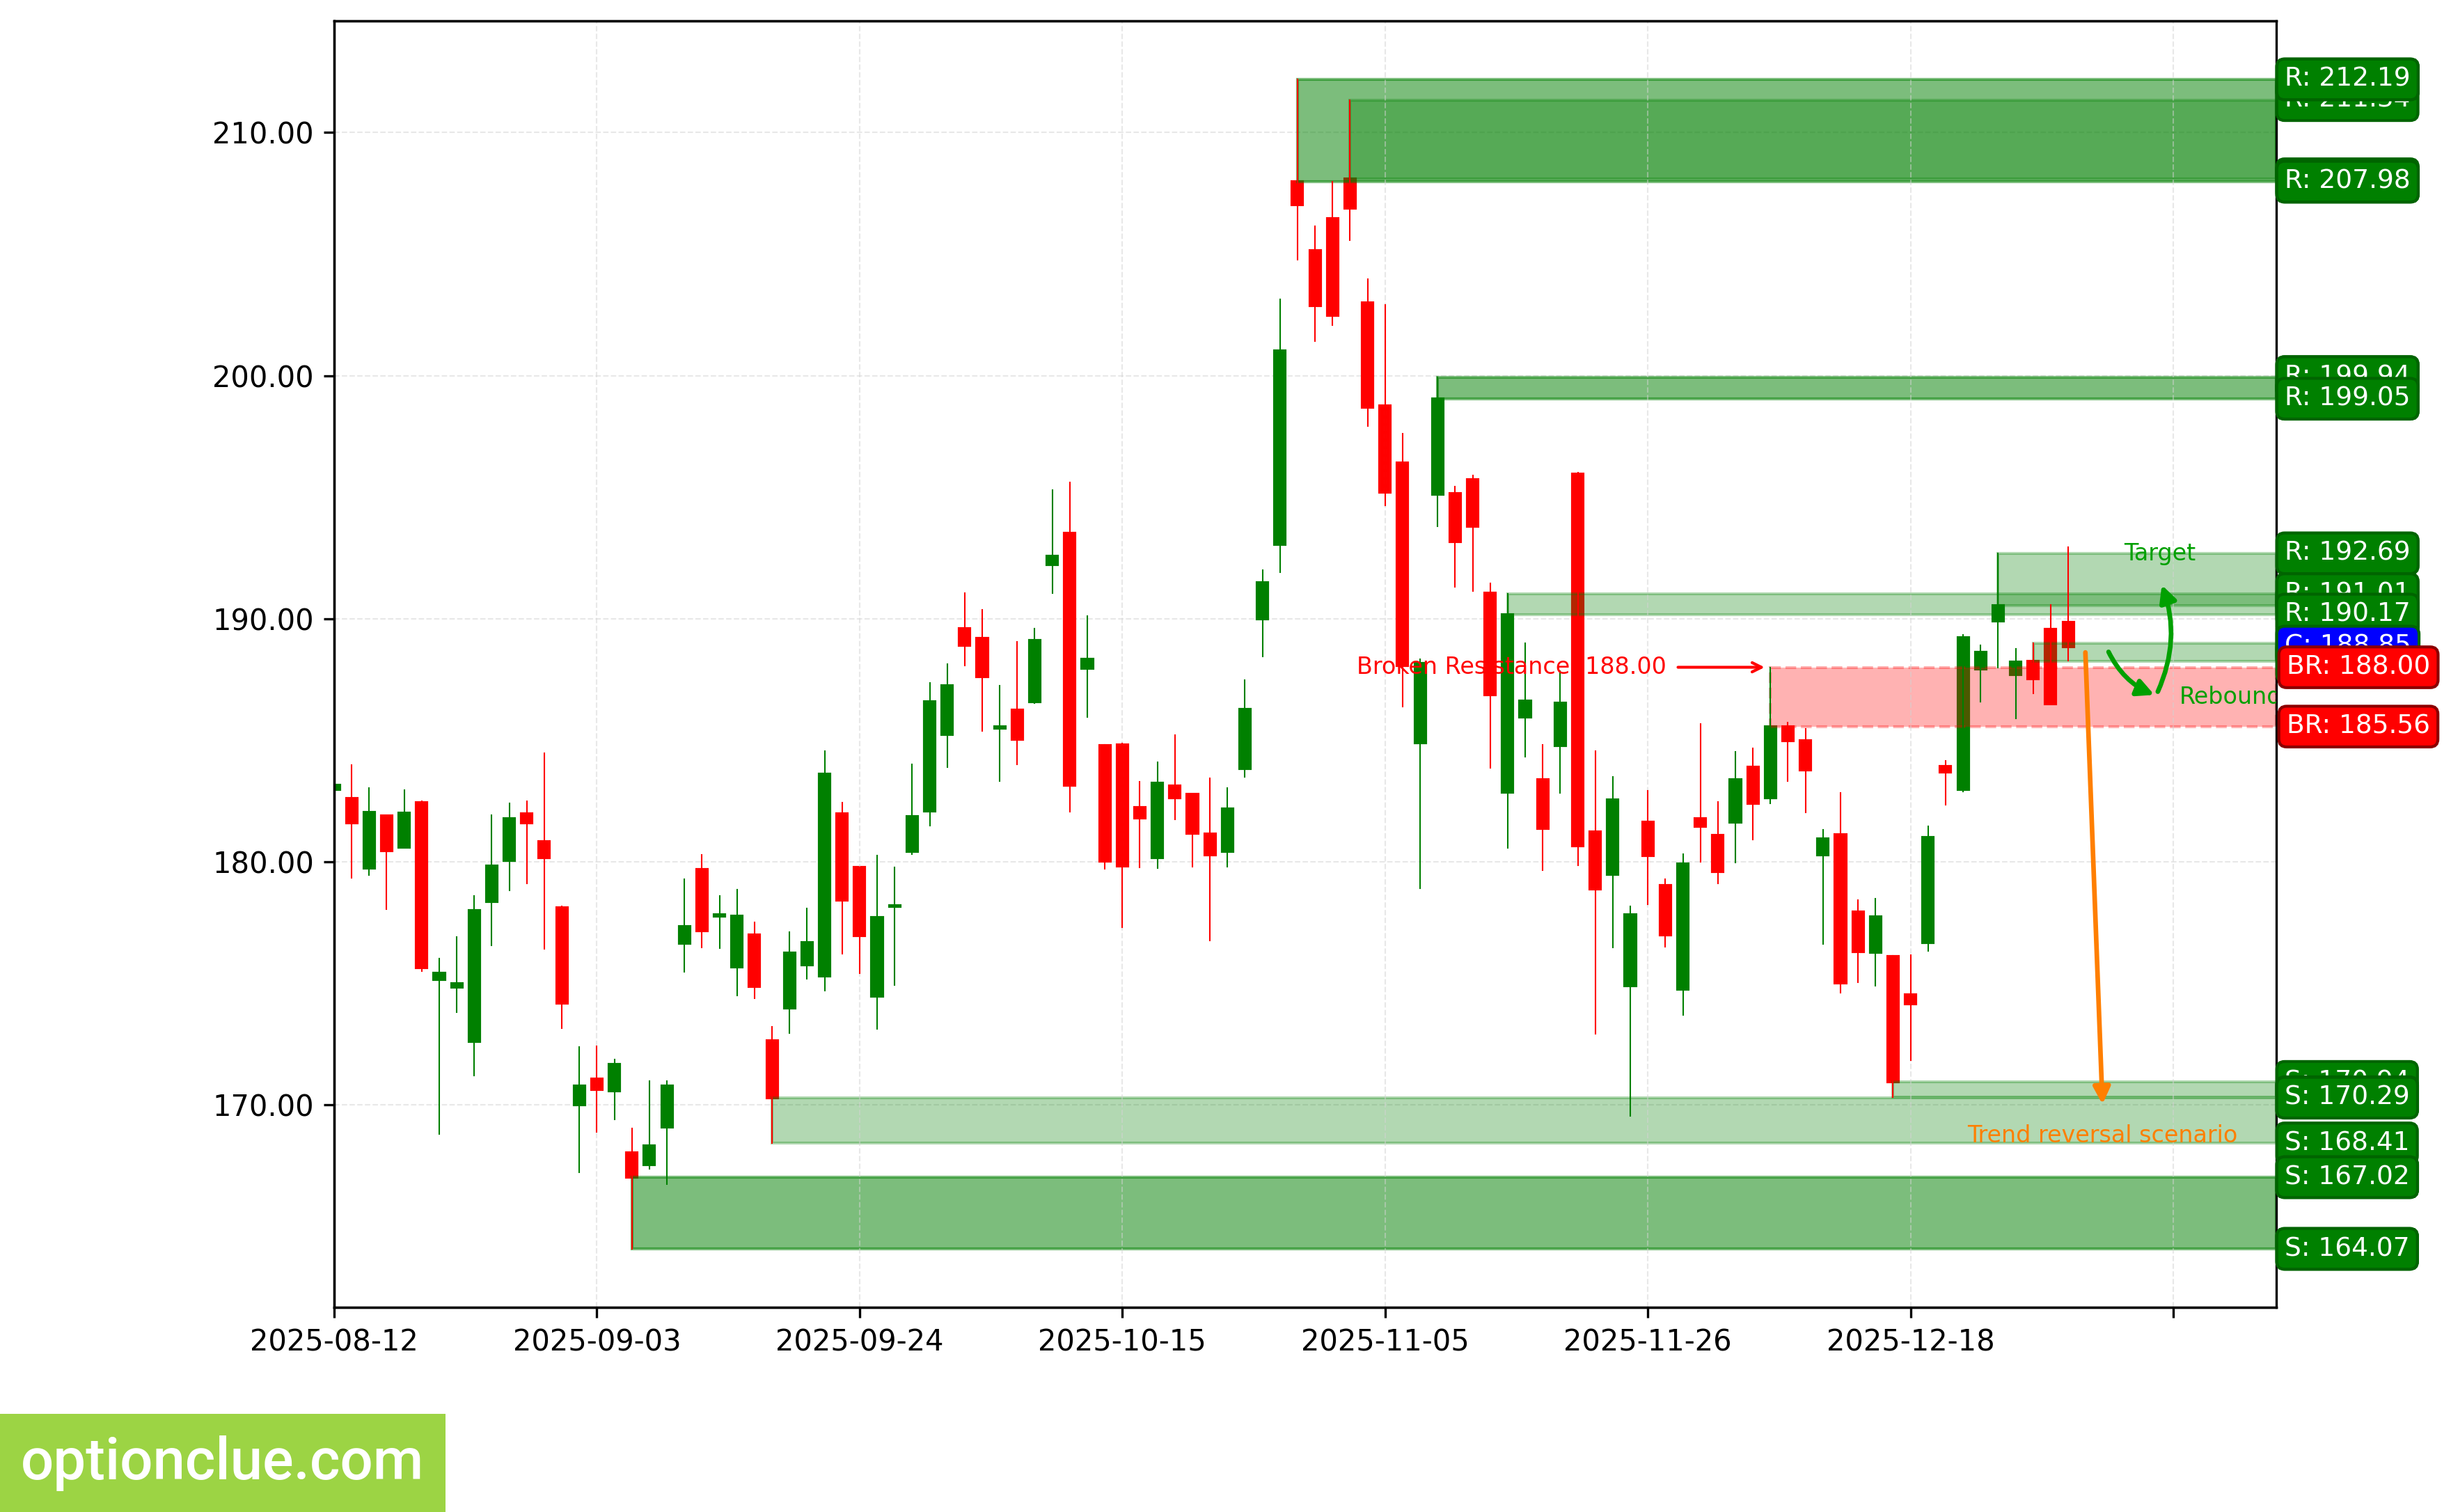
NVDA. Technical analysis. D1.
Tesla Inc (TSLA)
The trend has changed to bearish when the support level (465.83 — 467.26) was broken. The breakout occurred 4 candlesticks ago. An impulse wave is developing.
The intermediate target for the downward movement is the support level with boundaries 435.25 — 437.54. In case of successful trend development, the farther target will be at the support level with boundaries 383.76 — 391.09.
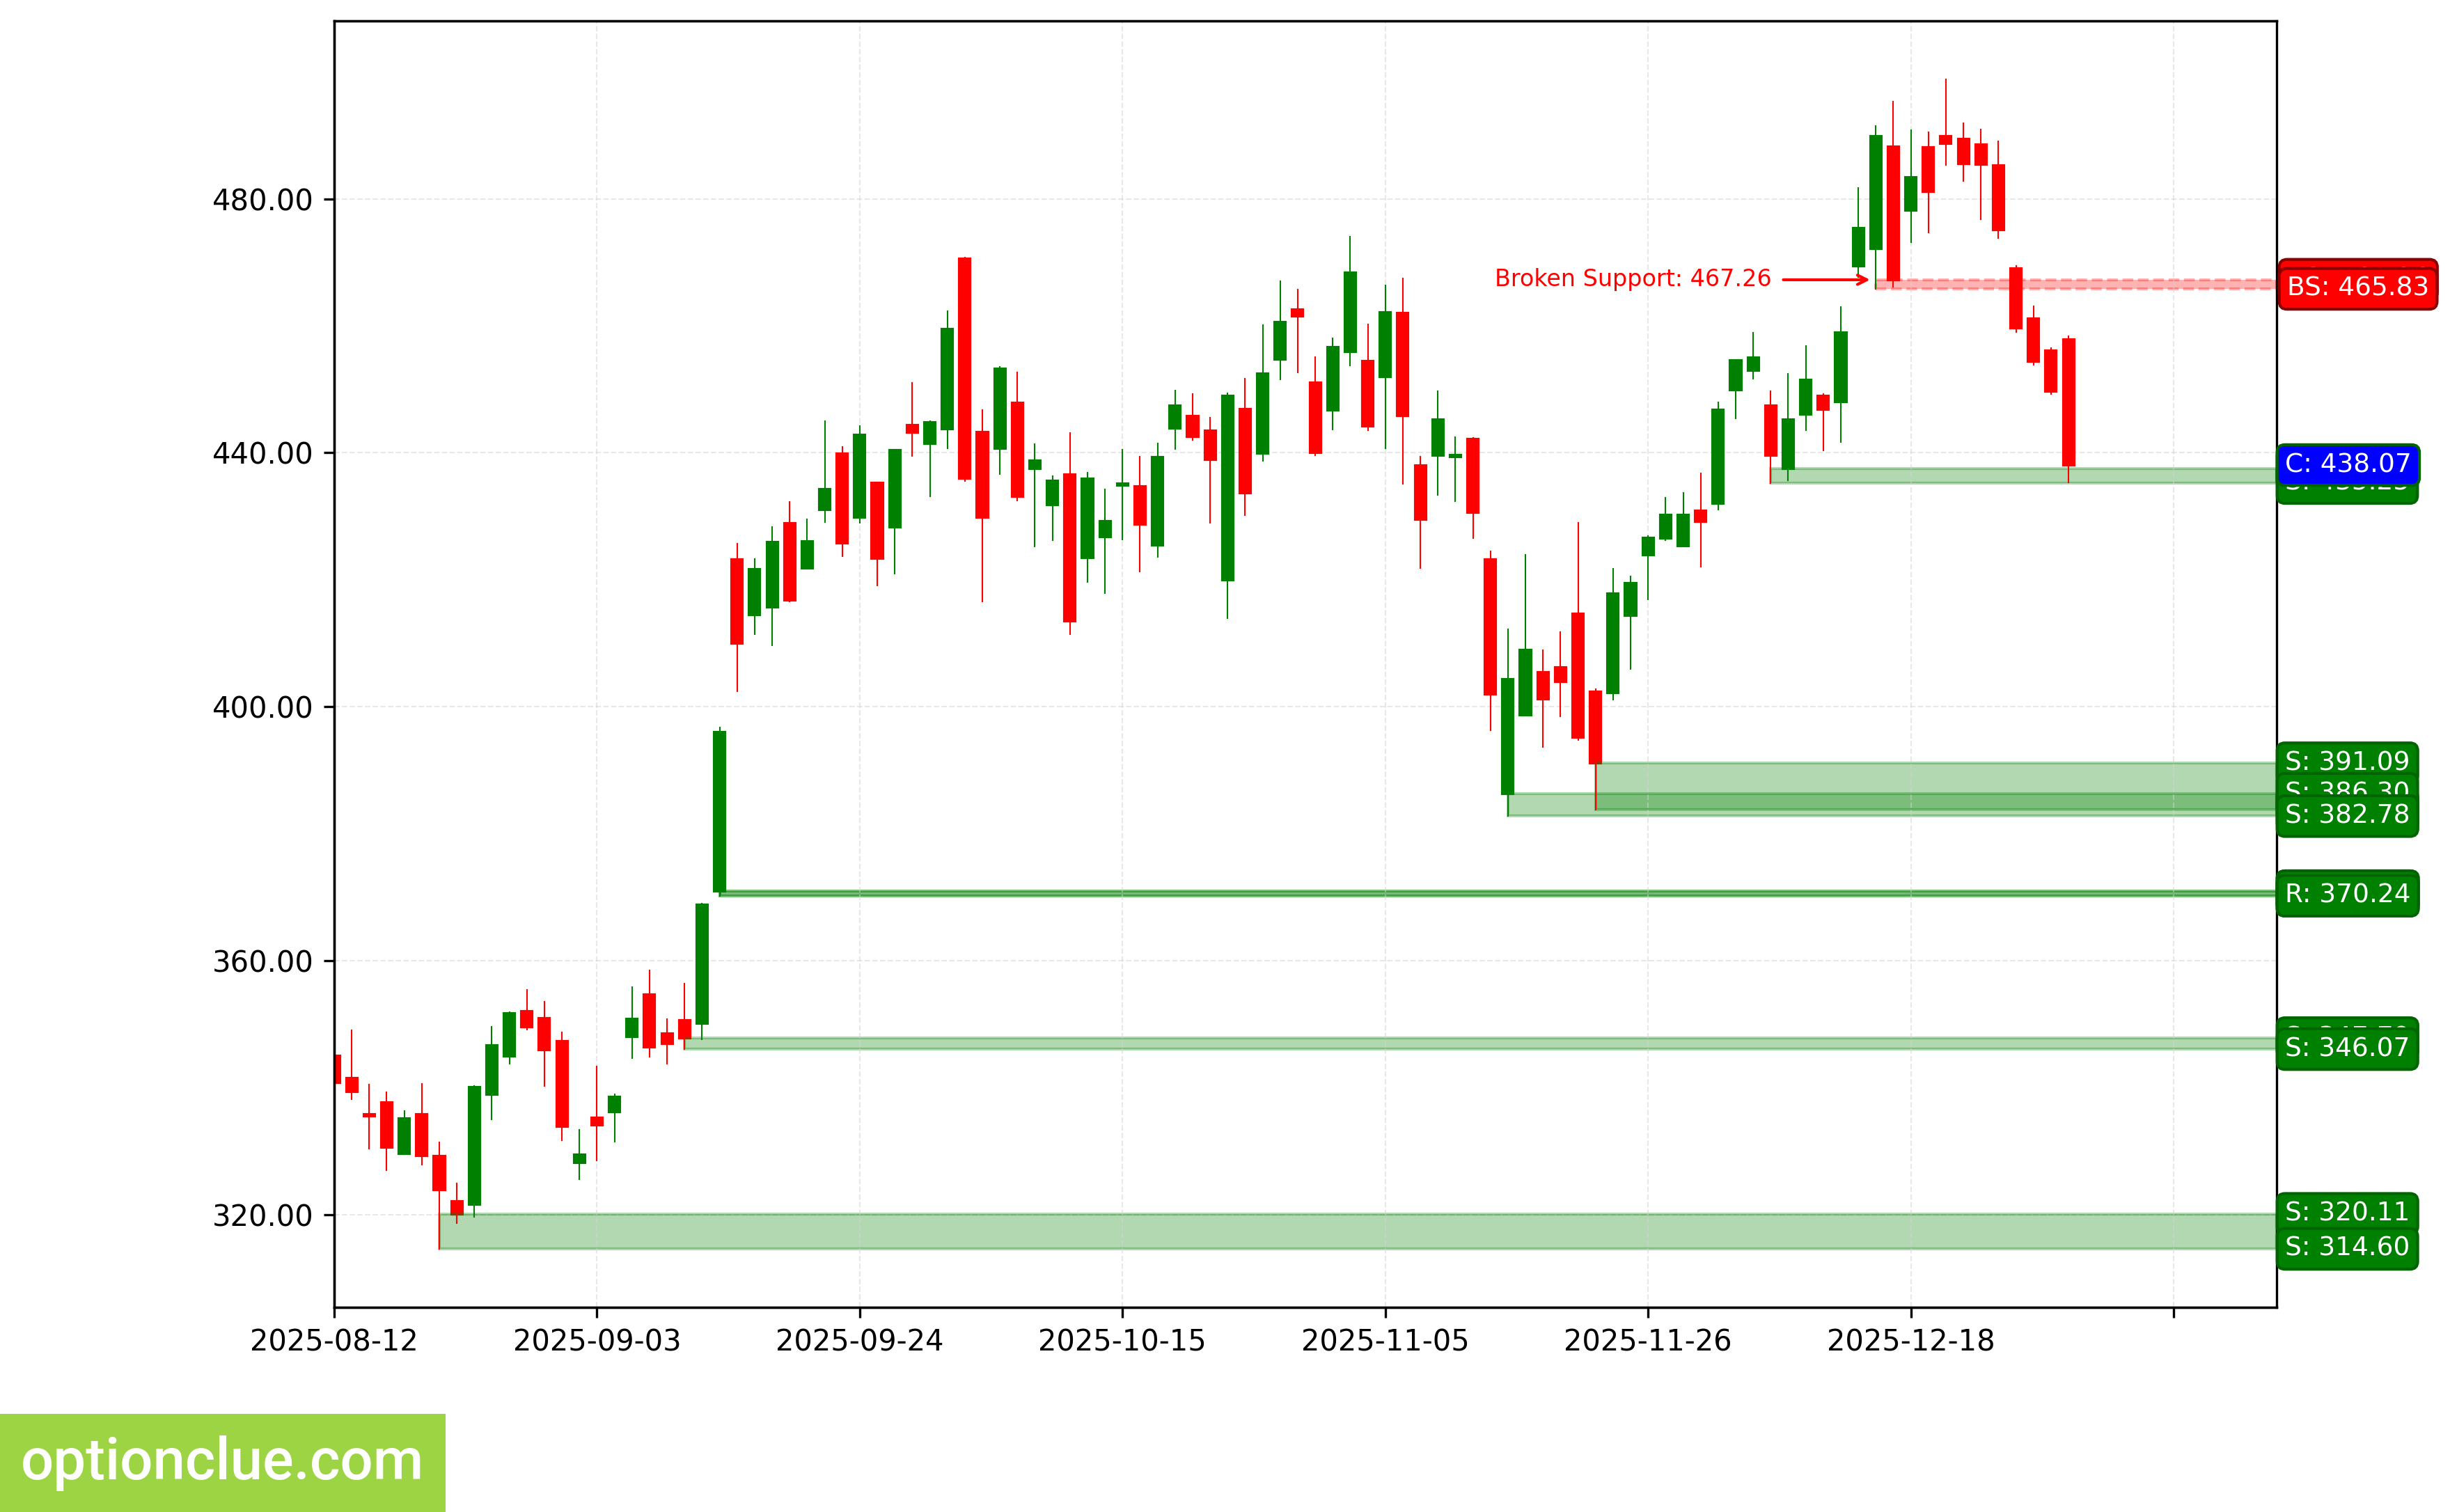
TSLA. Technical analysis. D1.
Summary
In terms of medium-term trading, financial instruments with correction nearing completion on the daily timeframe and/or with the most promising profit/risk ratios include: EURUSD, USDCHF, AUDUSD. Depending on the depth of the market correction, the following may soon warrant attention: USDCAD, ETH, NVDA, TSLA.
The other financial instruments may also be of interest, but daily rebound signals on these markets are likely to appear no earlier than in a week.