We examine the most important levels for key financial instruments and probable development scenarios.
Key Topics
- Euro (EURUSD)
- British Pound (GBPUSD)
- Japanese Yen (USDJPY)
- Canadian Dollar (USDCAD)
- Australian Dollar (AUDUSD)
- Bitcoin (BTC)
- Ether (ETH)
- Apple Inc (AAPL)
- NVIDIA Corp (NVDA)
- Tesla Inc (TSLA)
- Summary
Euro (EURUSD)
The bullish trend continues, a corrective wave is developing. An entry point for buying on rebound may form after the current correction completes. The last broken level is resistance (1.1539 — 1.1555). The breakout occurred 6 candlesticks ago, and the price has returned to this last broken level.
The intermediate target for the upward movement is the resistance level with boundaries 1.1614 — 1.1640. In case of successful trend development, a farther target will be at the resistance level with boundaries 1.1769 — 1.1796.
If the correction completes around the support level (1.1385 — 1.1457), the potential profit/risk ratio may be around 1.3:1. When using the farther target — around 2.4:1.
Long positions will remain relevant as long as the market is above the nearest support level with boundaries 1.1385 — 1.1457. If the market successfully closes below this support, the trend will reverse to the opposite (bearish).
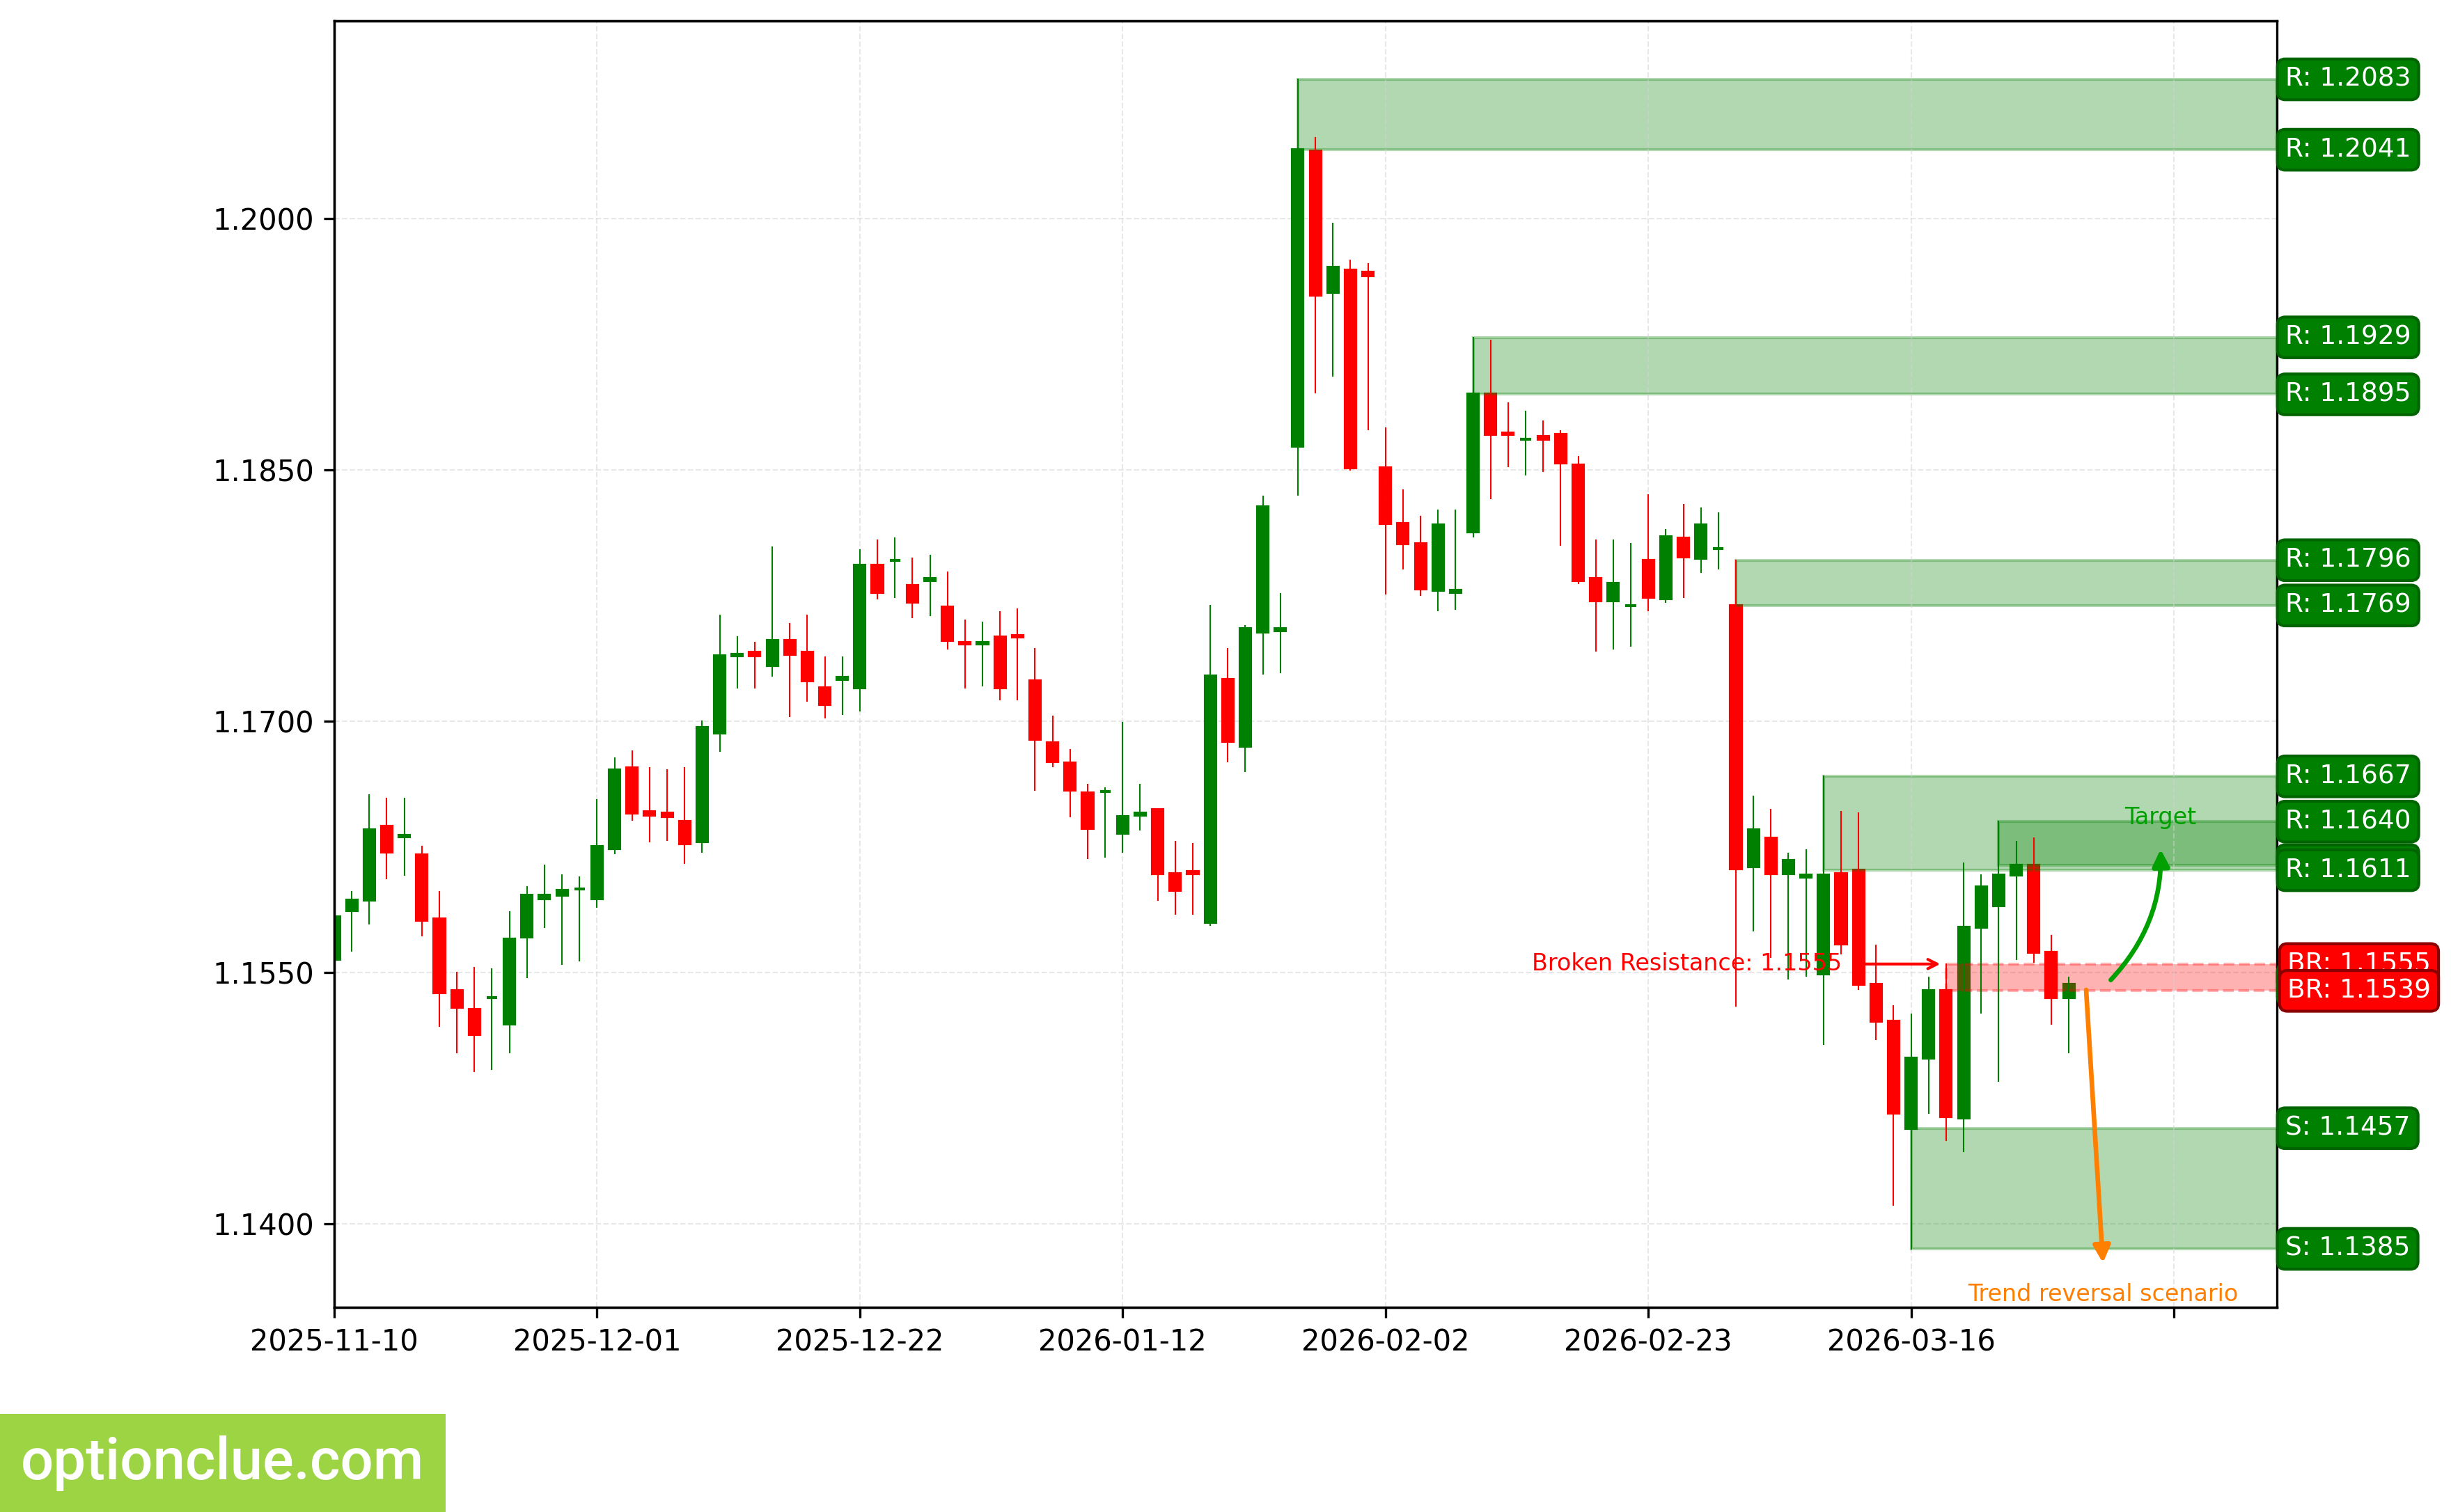
EURUSD. Technical analysis. D1.
British Pound (GBPUSD)
The trend has turned bullish when the resistance level (1.3358 — 1.3375) was broken 5 candlesticks ago. A corrective wave is developing. An entry point for buying on rebound may form after the current correction completes.
The intermediate target for the upward movement is the resistance level with boundaries 1.3426 — 1.3479. In case of successful trend development, a farther target will be at the resistance level with boundaries 1.3653 — 1.3662.
The potential profit/risk ratio from current prices when setting targets and fixing risks based on daily timeframe levels may be minor (around 0.8:1). When using the farther target — approximately 1.9:1. If the correction completes around the support level (1.3191 — 1.3218), the potential profit/risk ratio may be around 1.5:1. When selecting the farther target — around 3:1.
Long positions will remain relevant as long as the market is above the nearest support level with boundaries 1.3191 — 1.3218. If the market successfully closes below this support, the trend will reverse to the opposite (bearish).
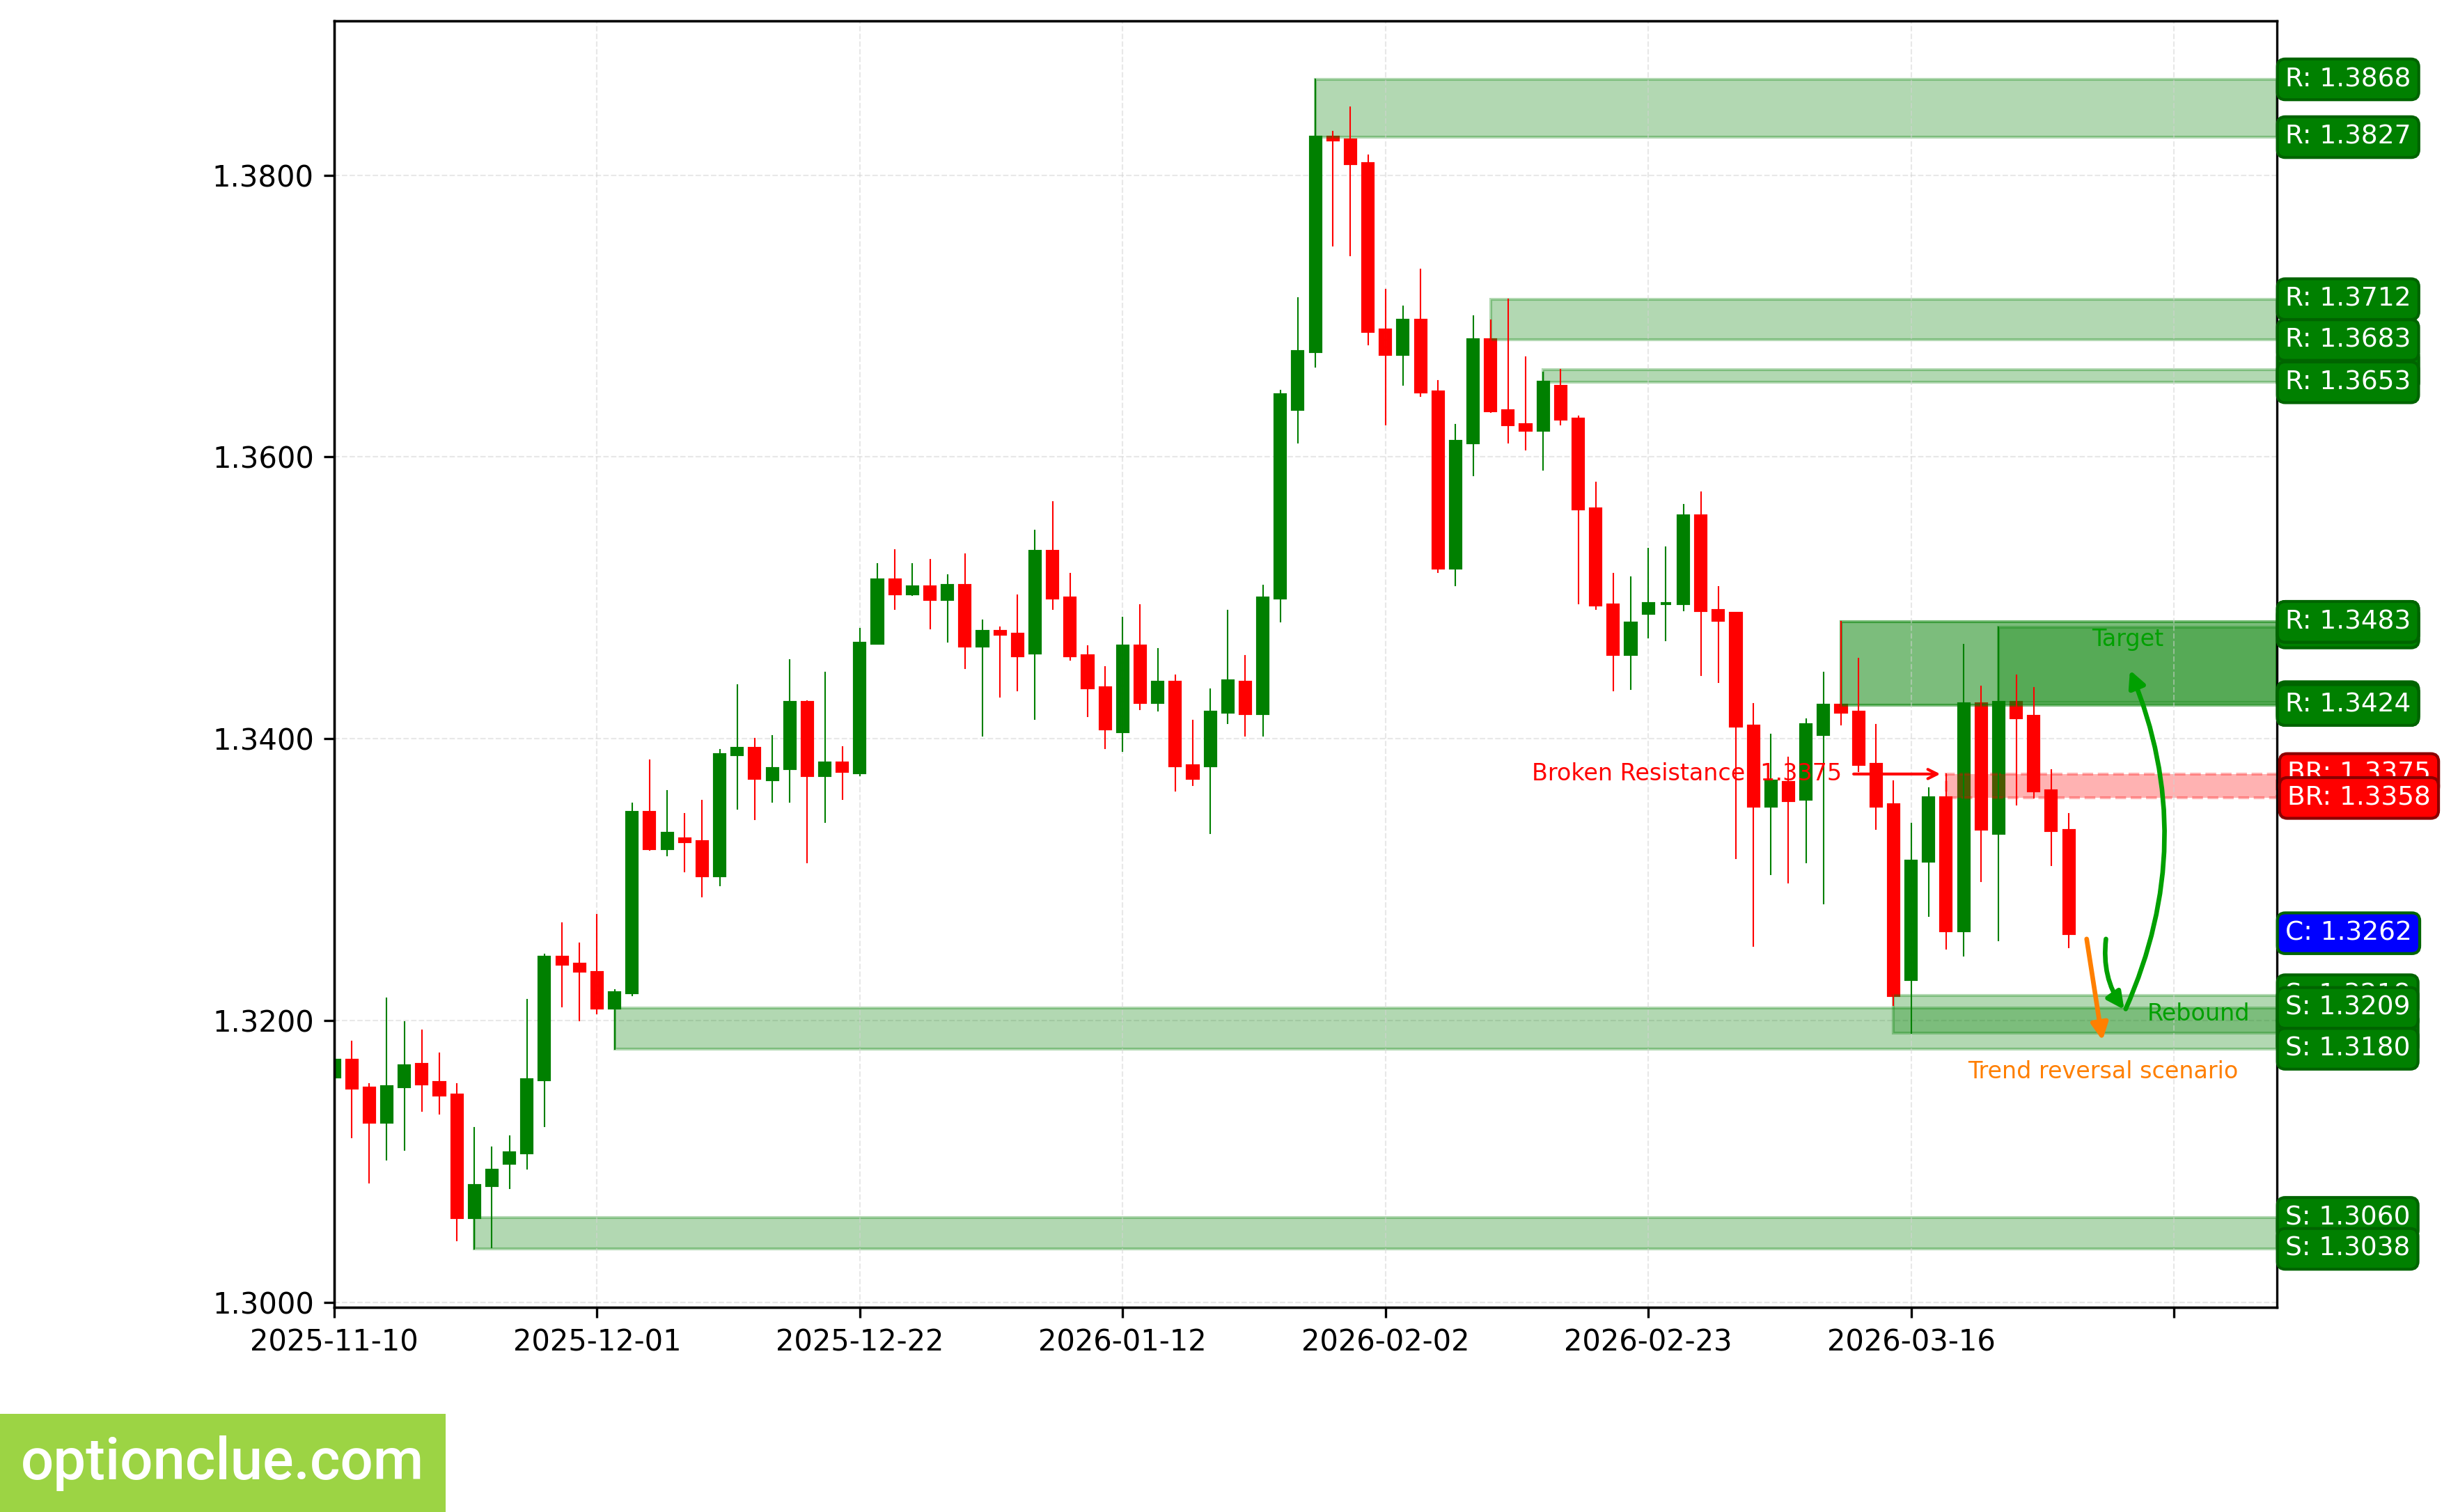
GBPUSD. Technical analysis. D1.
Japanese Yen (USDJPY)
The bullish trend continues, an impulse wave is developing. The last broken level is resistance (159.74 — 159.89). The breakout occurred on the last closed candlestick.
Long positions will remain relevant as long as the market remains above the nearest support level with boundaries 158.04 — 158.49. If the market successfully closes below this support, the trend will reverse to the opposite (bearish).
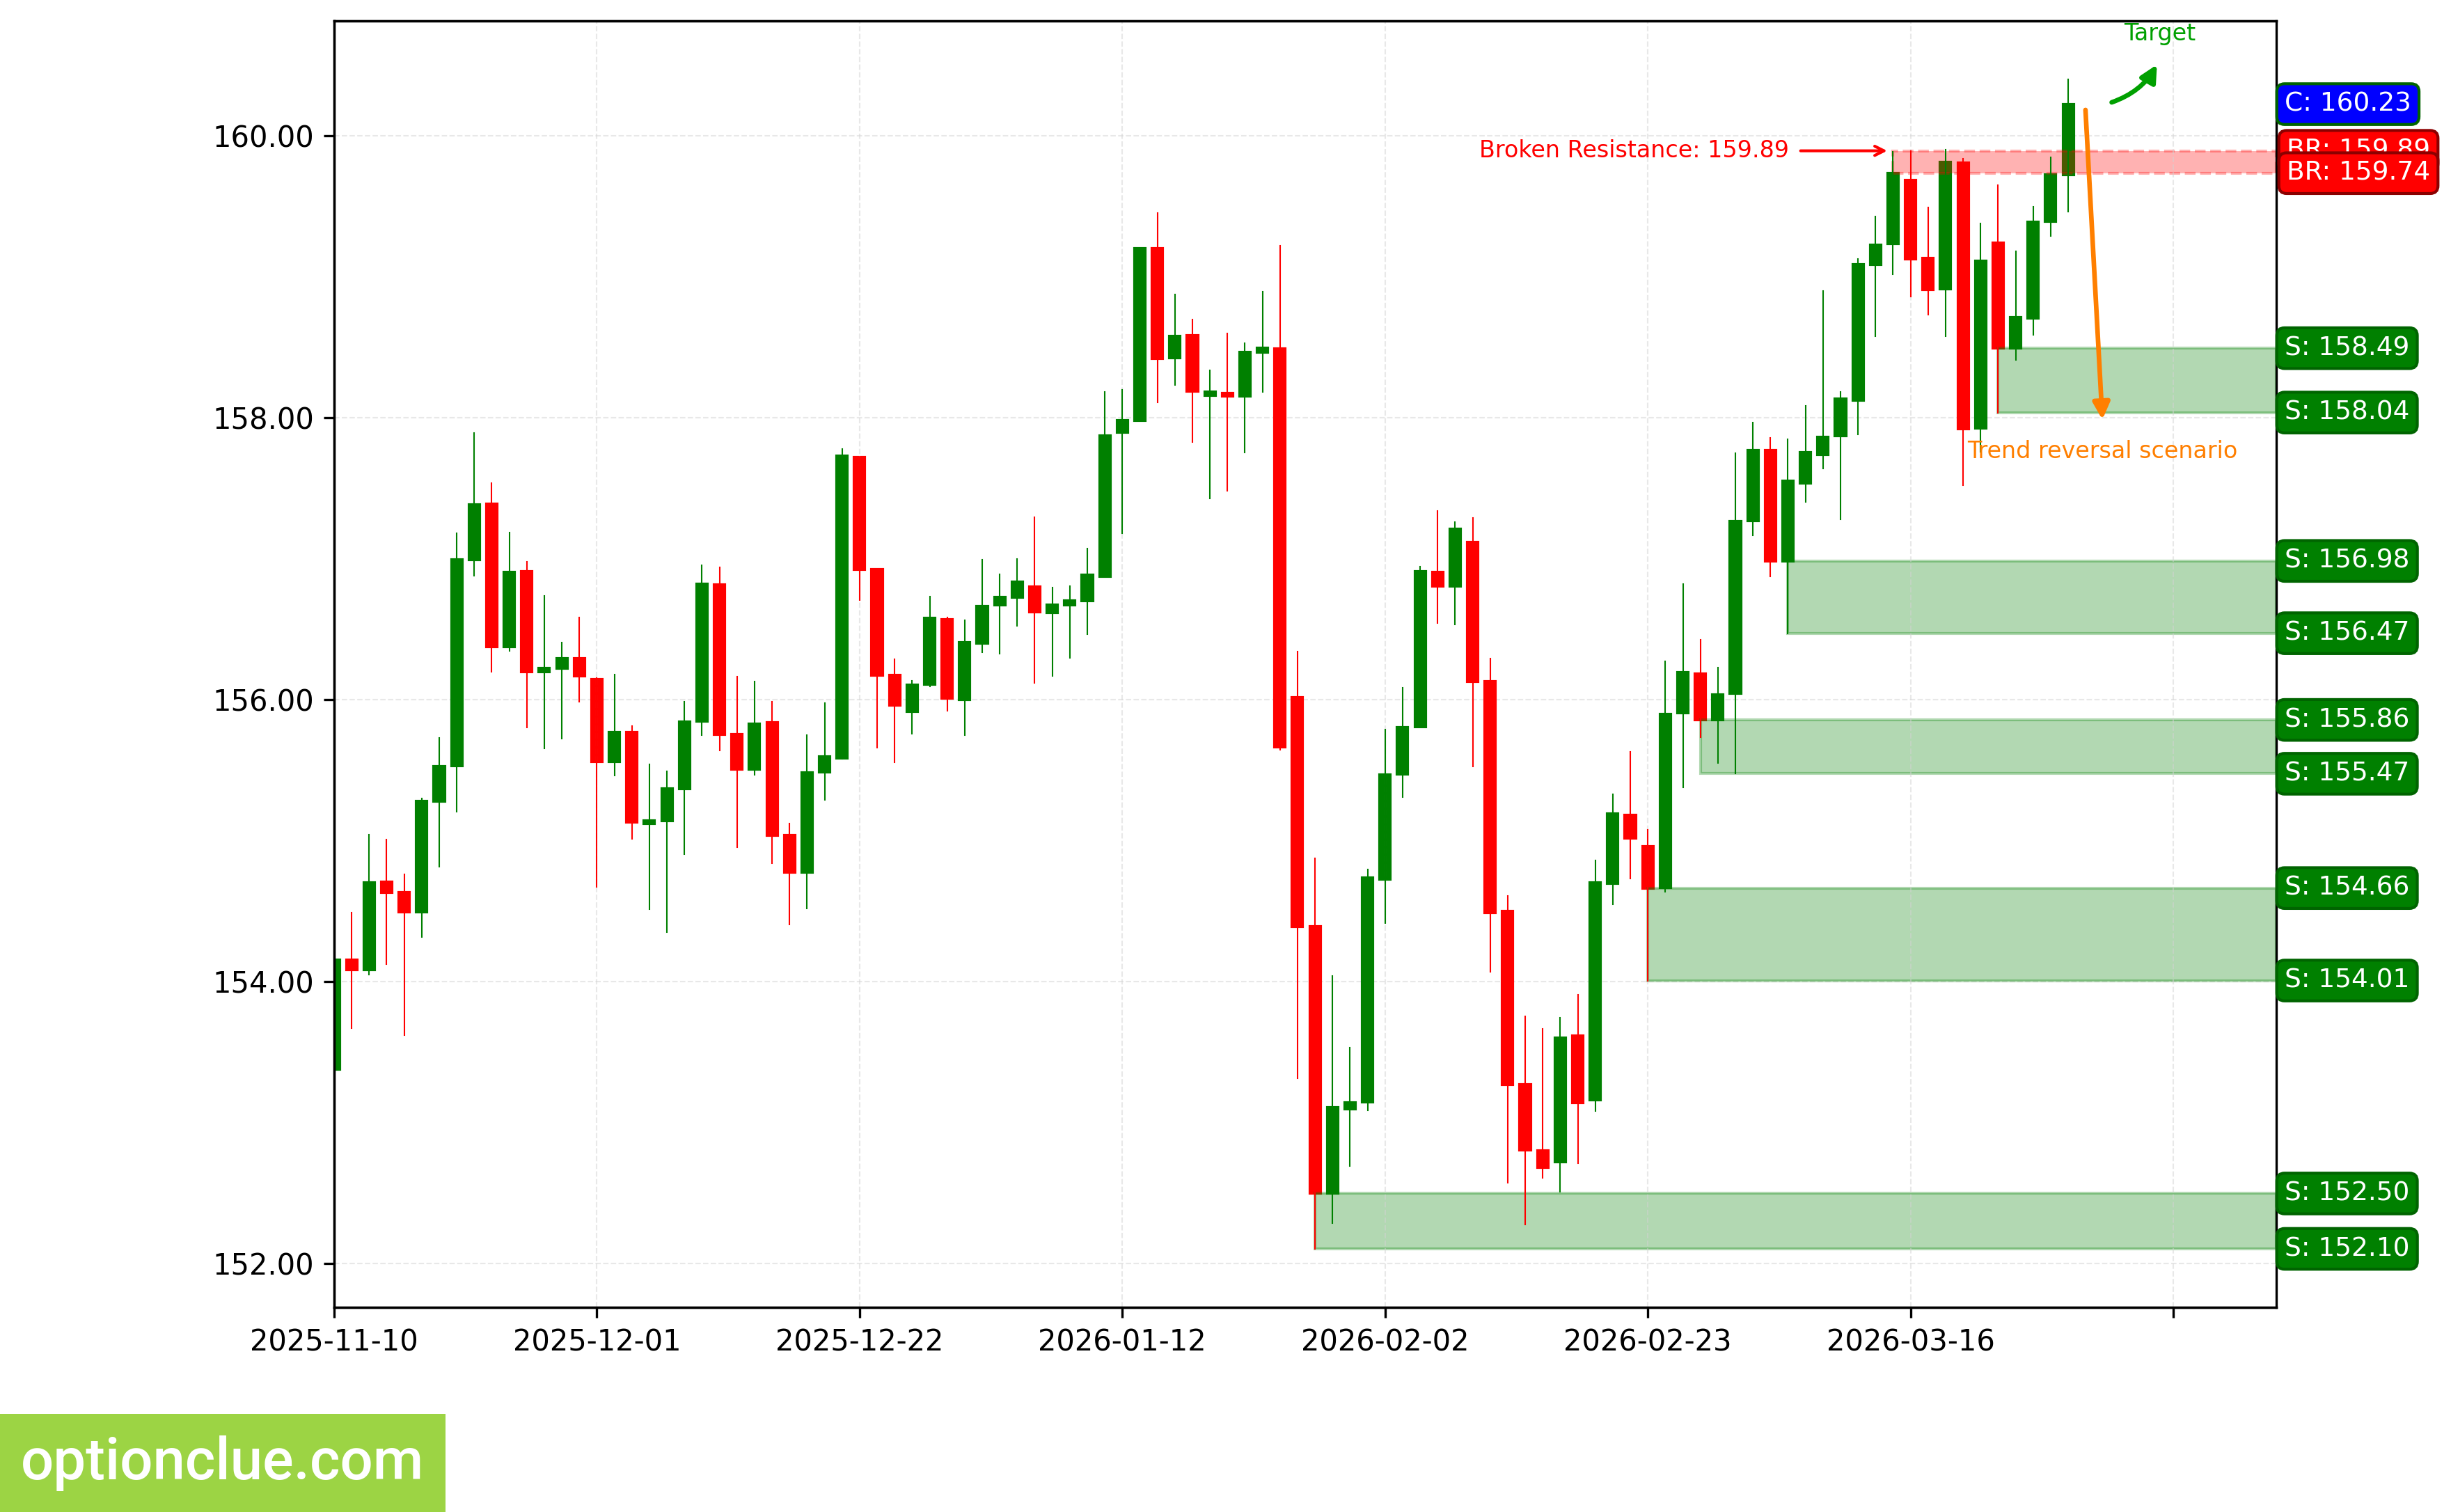
USDJPY. Technical analysis. D1.
Canadian Dollar (USDCAD)
The bullish trend continues, the correction completed 5 candlesticks ago and an entry point for buying on rebound formed, an impulse wave is developing. The last broken level is resistance (1.3712 — 1.3724). The breakout occurred 8 candlesticks ago.
The intermediate target for the upward movement is the resistance level with boundaries 1.3916 — 1.3928. In case of successful trend development, a farther target will be at the resistance level with boundaries 1.4108 — 1.4124.
The potential profit/risk ratio from current prices when setting targets and fixing risks based on daily timeframe levels may be small (around 0.1:1). When using the farther target — also small (approximately 0.7:1).
Long positions will remain relevant as long as the market is above the nearest support level with boundaries 1.3667 — 1.3712. If the market successfully closes below this support, the trend will reverse to the opposite (bearish).
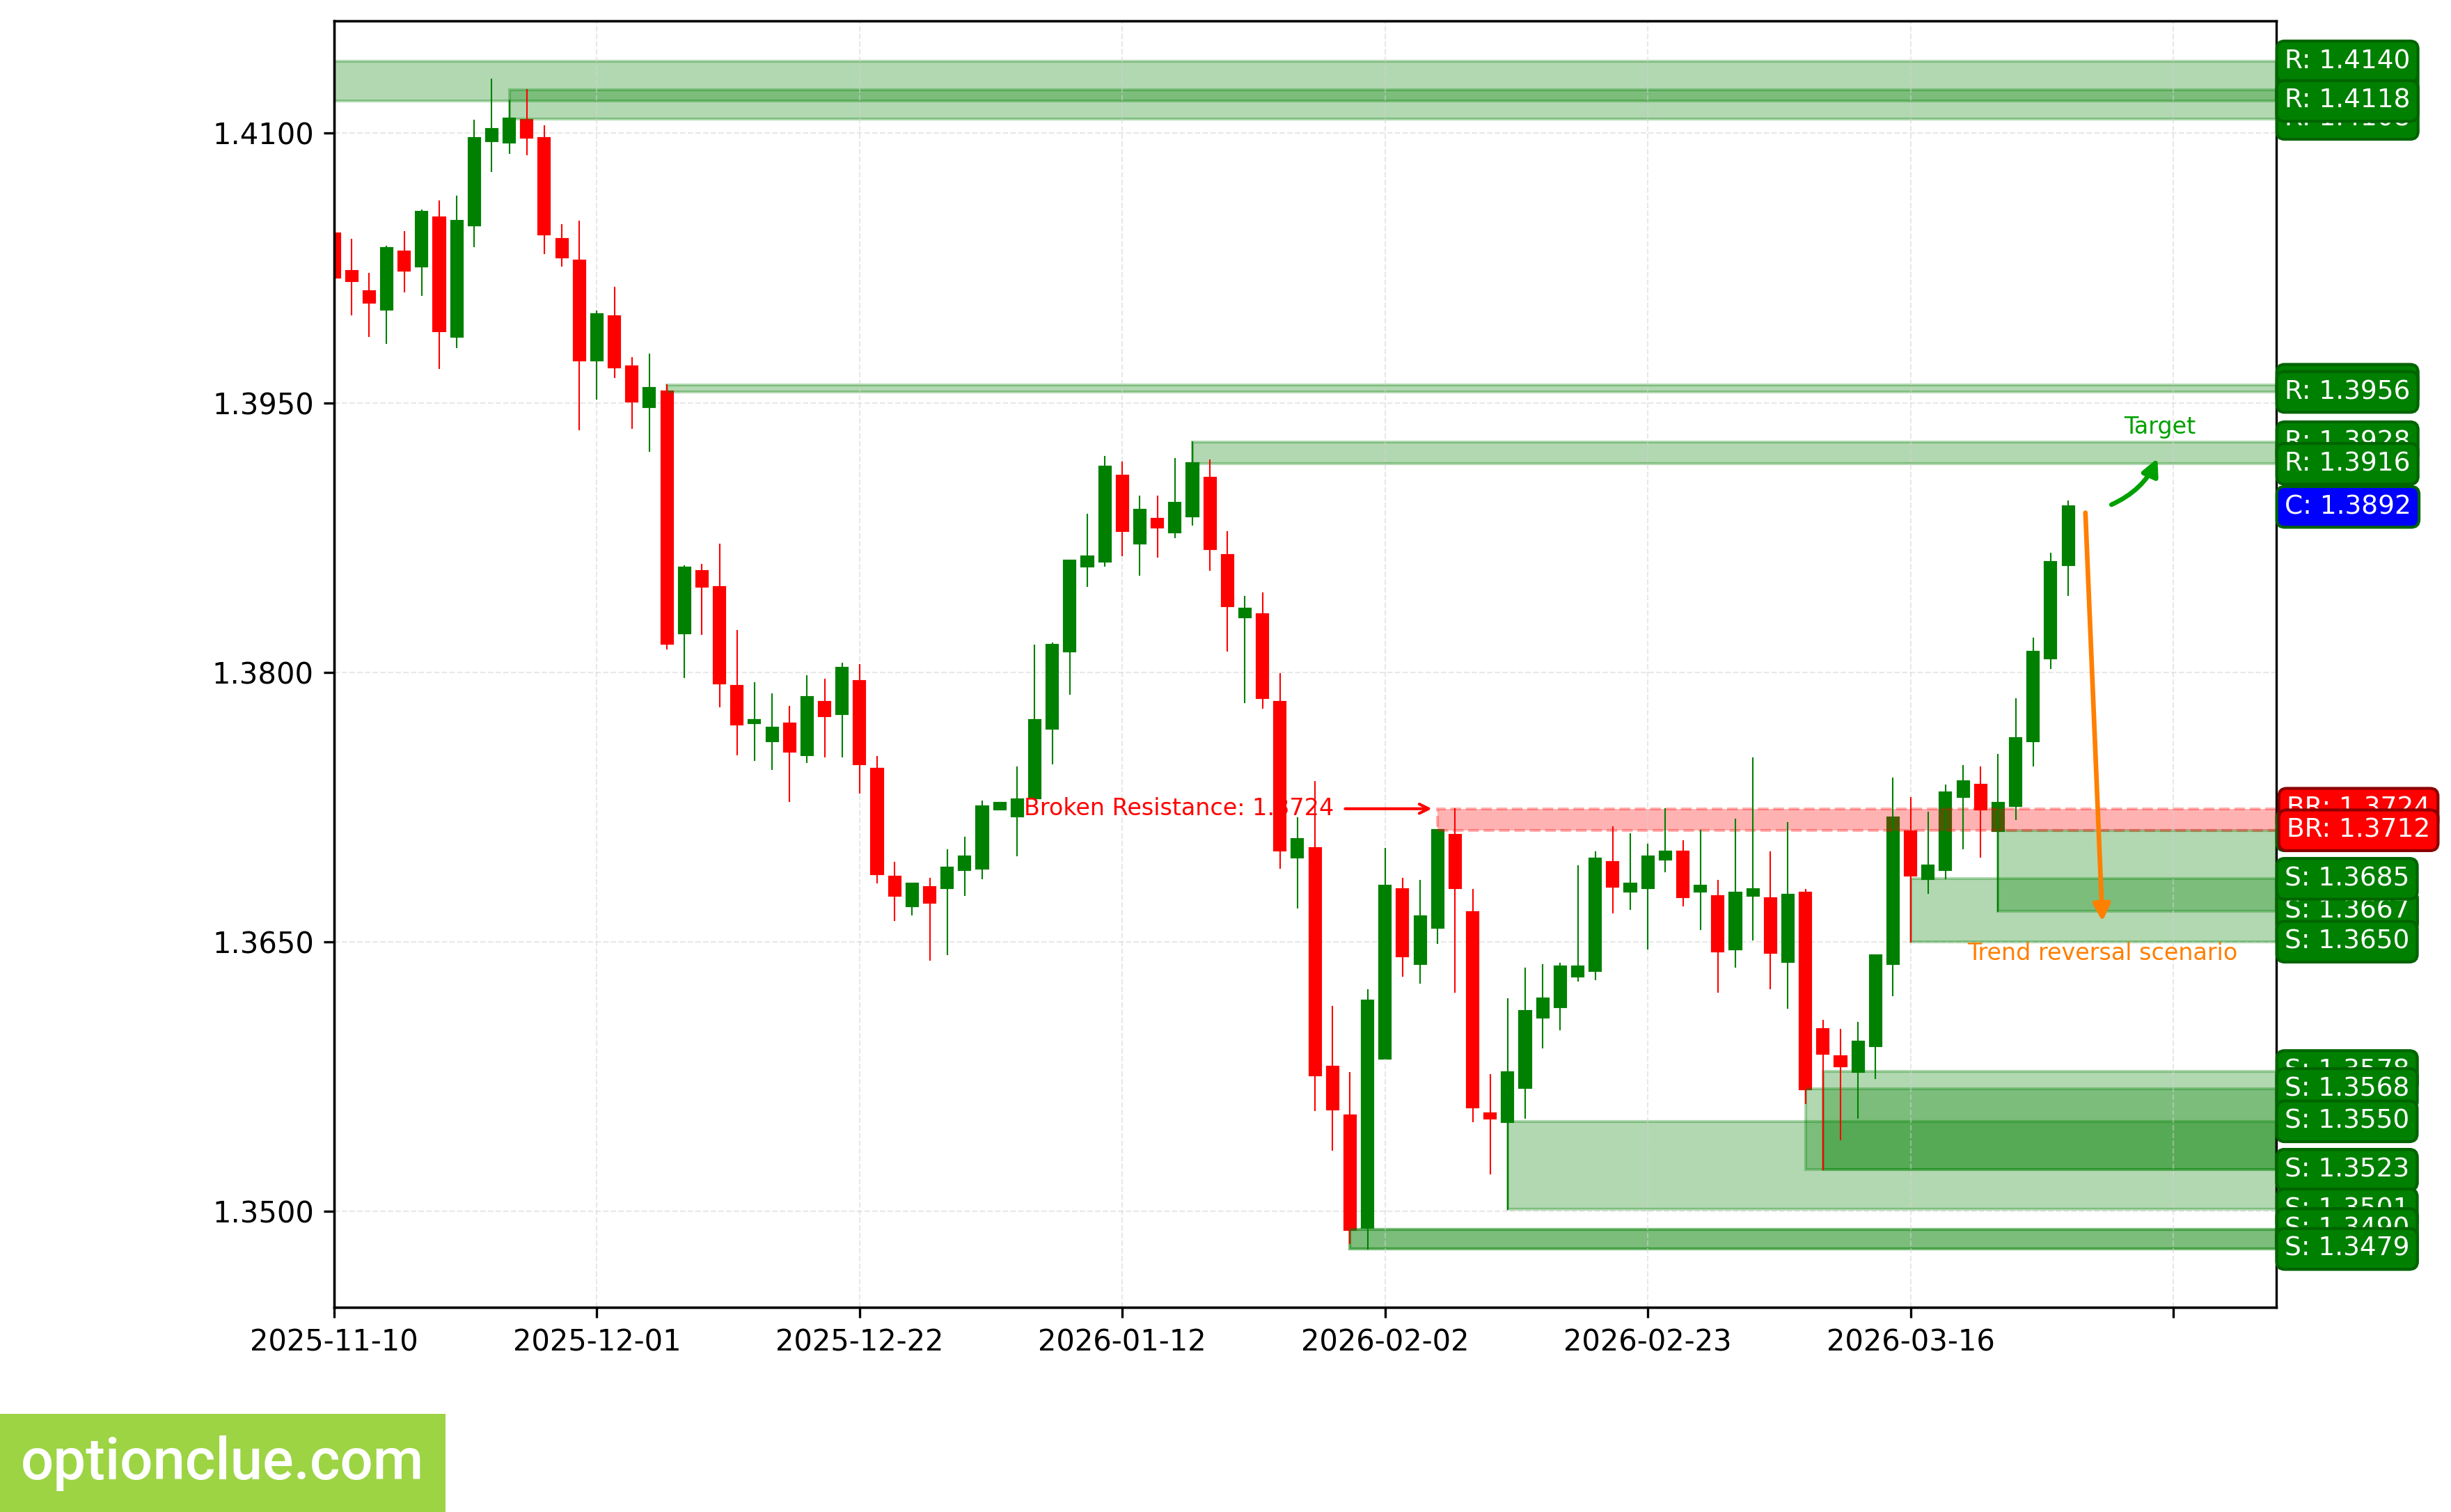
USDCAD. Technical analysis. D1.
Australian Dollar (AUDUSD)
The trend has turned bearish 3 candlesticks ago when the support level (0.6977 — 0.6981) was broken. An impulse wave is developing.
The intermediate target for the downward movement is the support level with boundaries 0.6665 — 0.6679. In case of successful trend development, a farther target will be at the support level with boundaries 0.6419 — 0.6439.
If the new correction completes around the resistance level (0.7087 — 0.7108), the potential profit/risk ratio may be more than 3:1. When using the farther target — more than 5:1. If the next correction completes around the last broken level (0.6977 — 0.6981), the potential profit/risk ratio may be around 1.3:1. When selecting the farther target — approximately 2:1.
Short positions will remain relevant as long as the market remains below the nearest resistance level with boundaries 0.7087 — 0.7108. If the market successfully closes above this nearest resistance, the trend will reverse to the opposite (bullish).
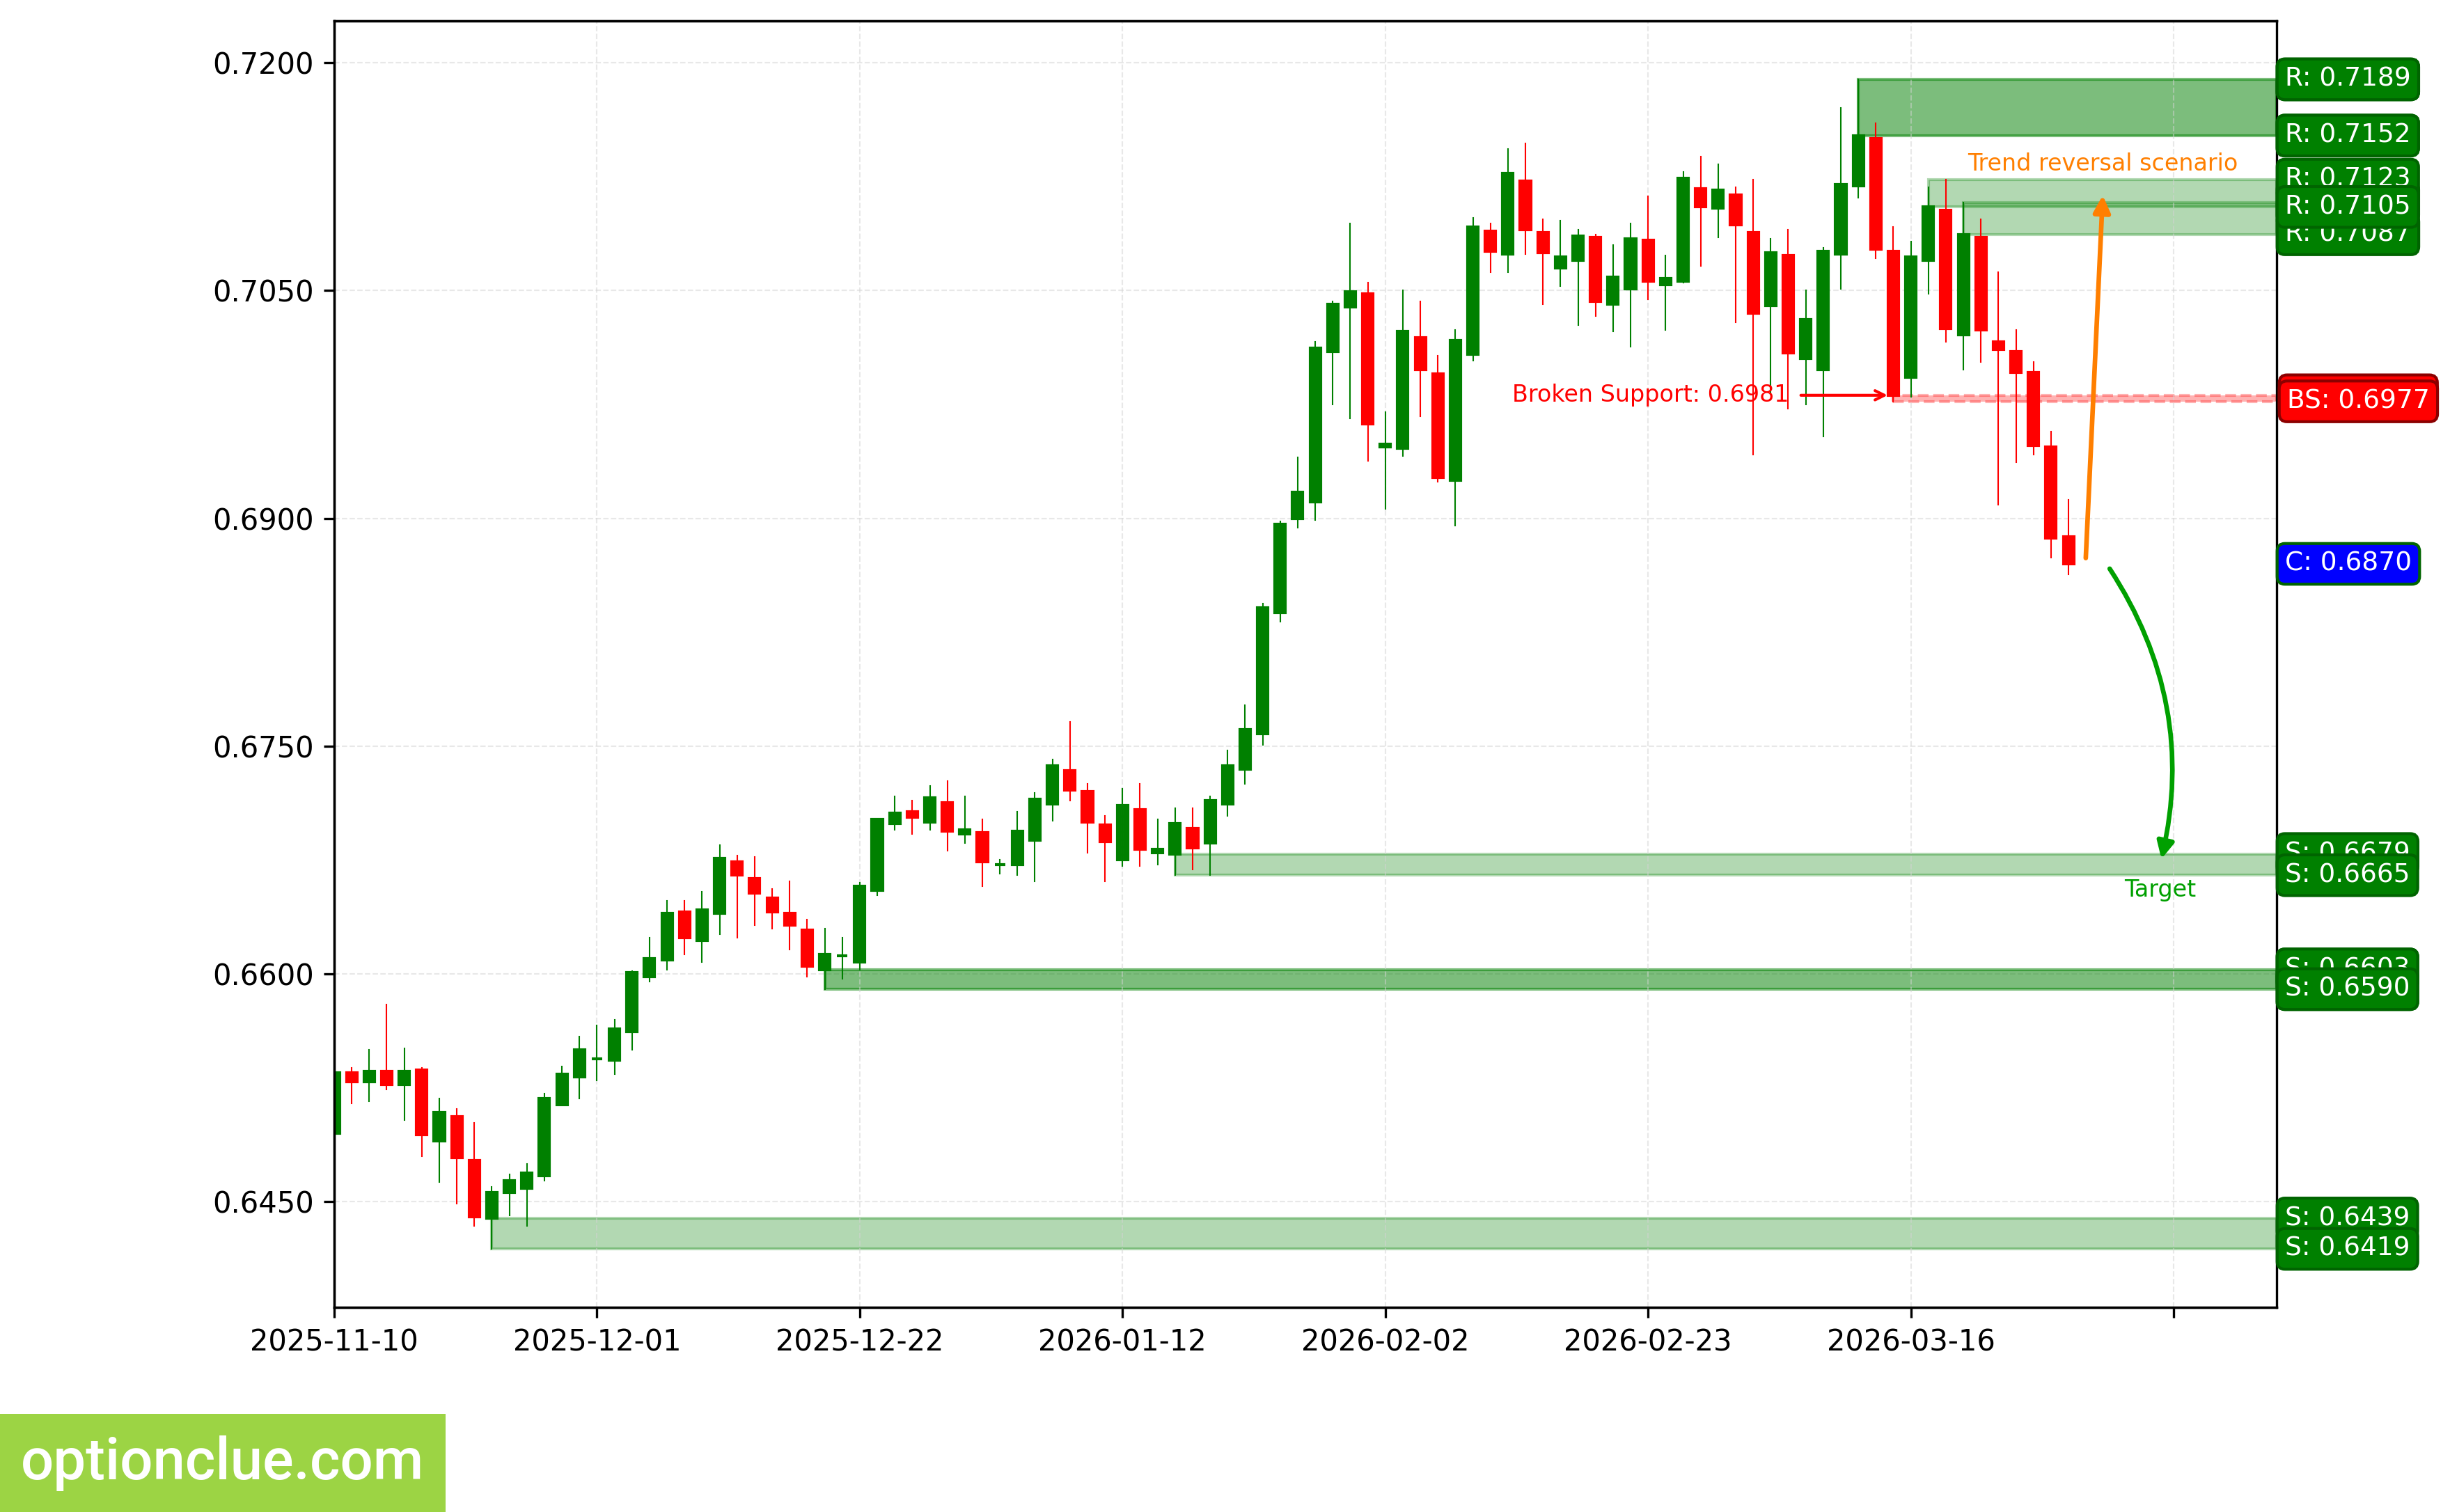
AUDUSD. Technical analysis. D1.
Bitcoin (BTC)
The trend has turned bearish when the support level (67373 — 67843) was broken on the last closed candlestick. An impulse wave is developing.
The intermediate target for the downward movement is the support level with boundaries 65639 — 65970.
If the next correction completes around the resistance level (71310 — 71986), the potential profit/risk ratio may be approximately 2:1. If the correction completes around the last broken level (67373 — 67843), the potential profit/risk ratio may be small (approximately 0.2:1).
Short positions will remain relevant as long as the market remains below the nearest resistance level with boundaries 71310 — 71986. If the market successfully closes above this nearest resistance, the trend will reverse to the opposite (bullish).
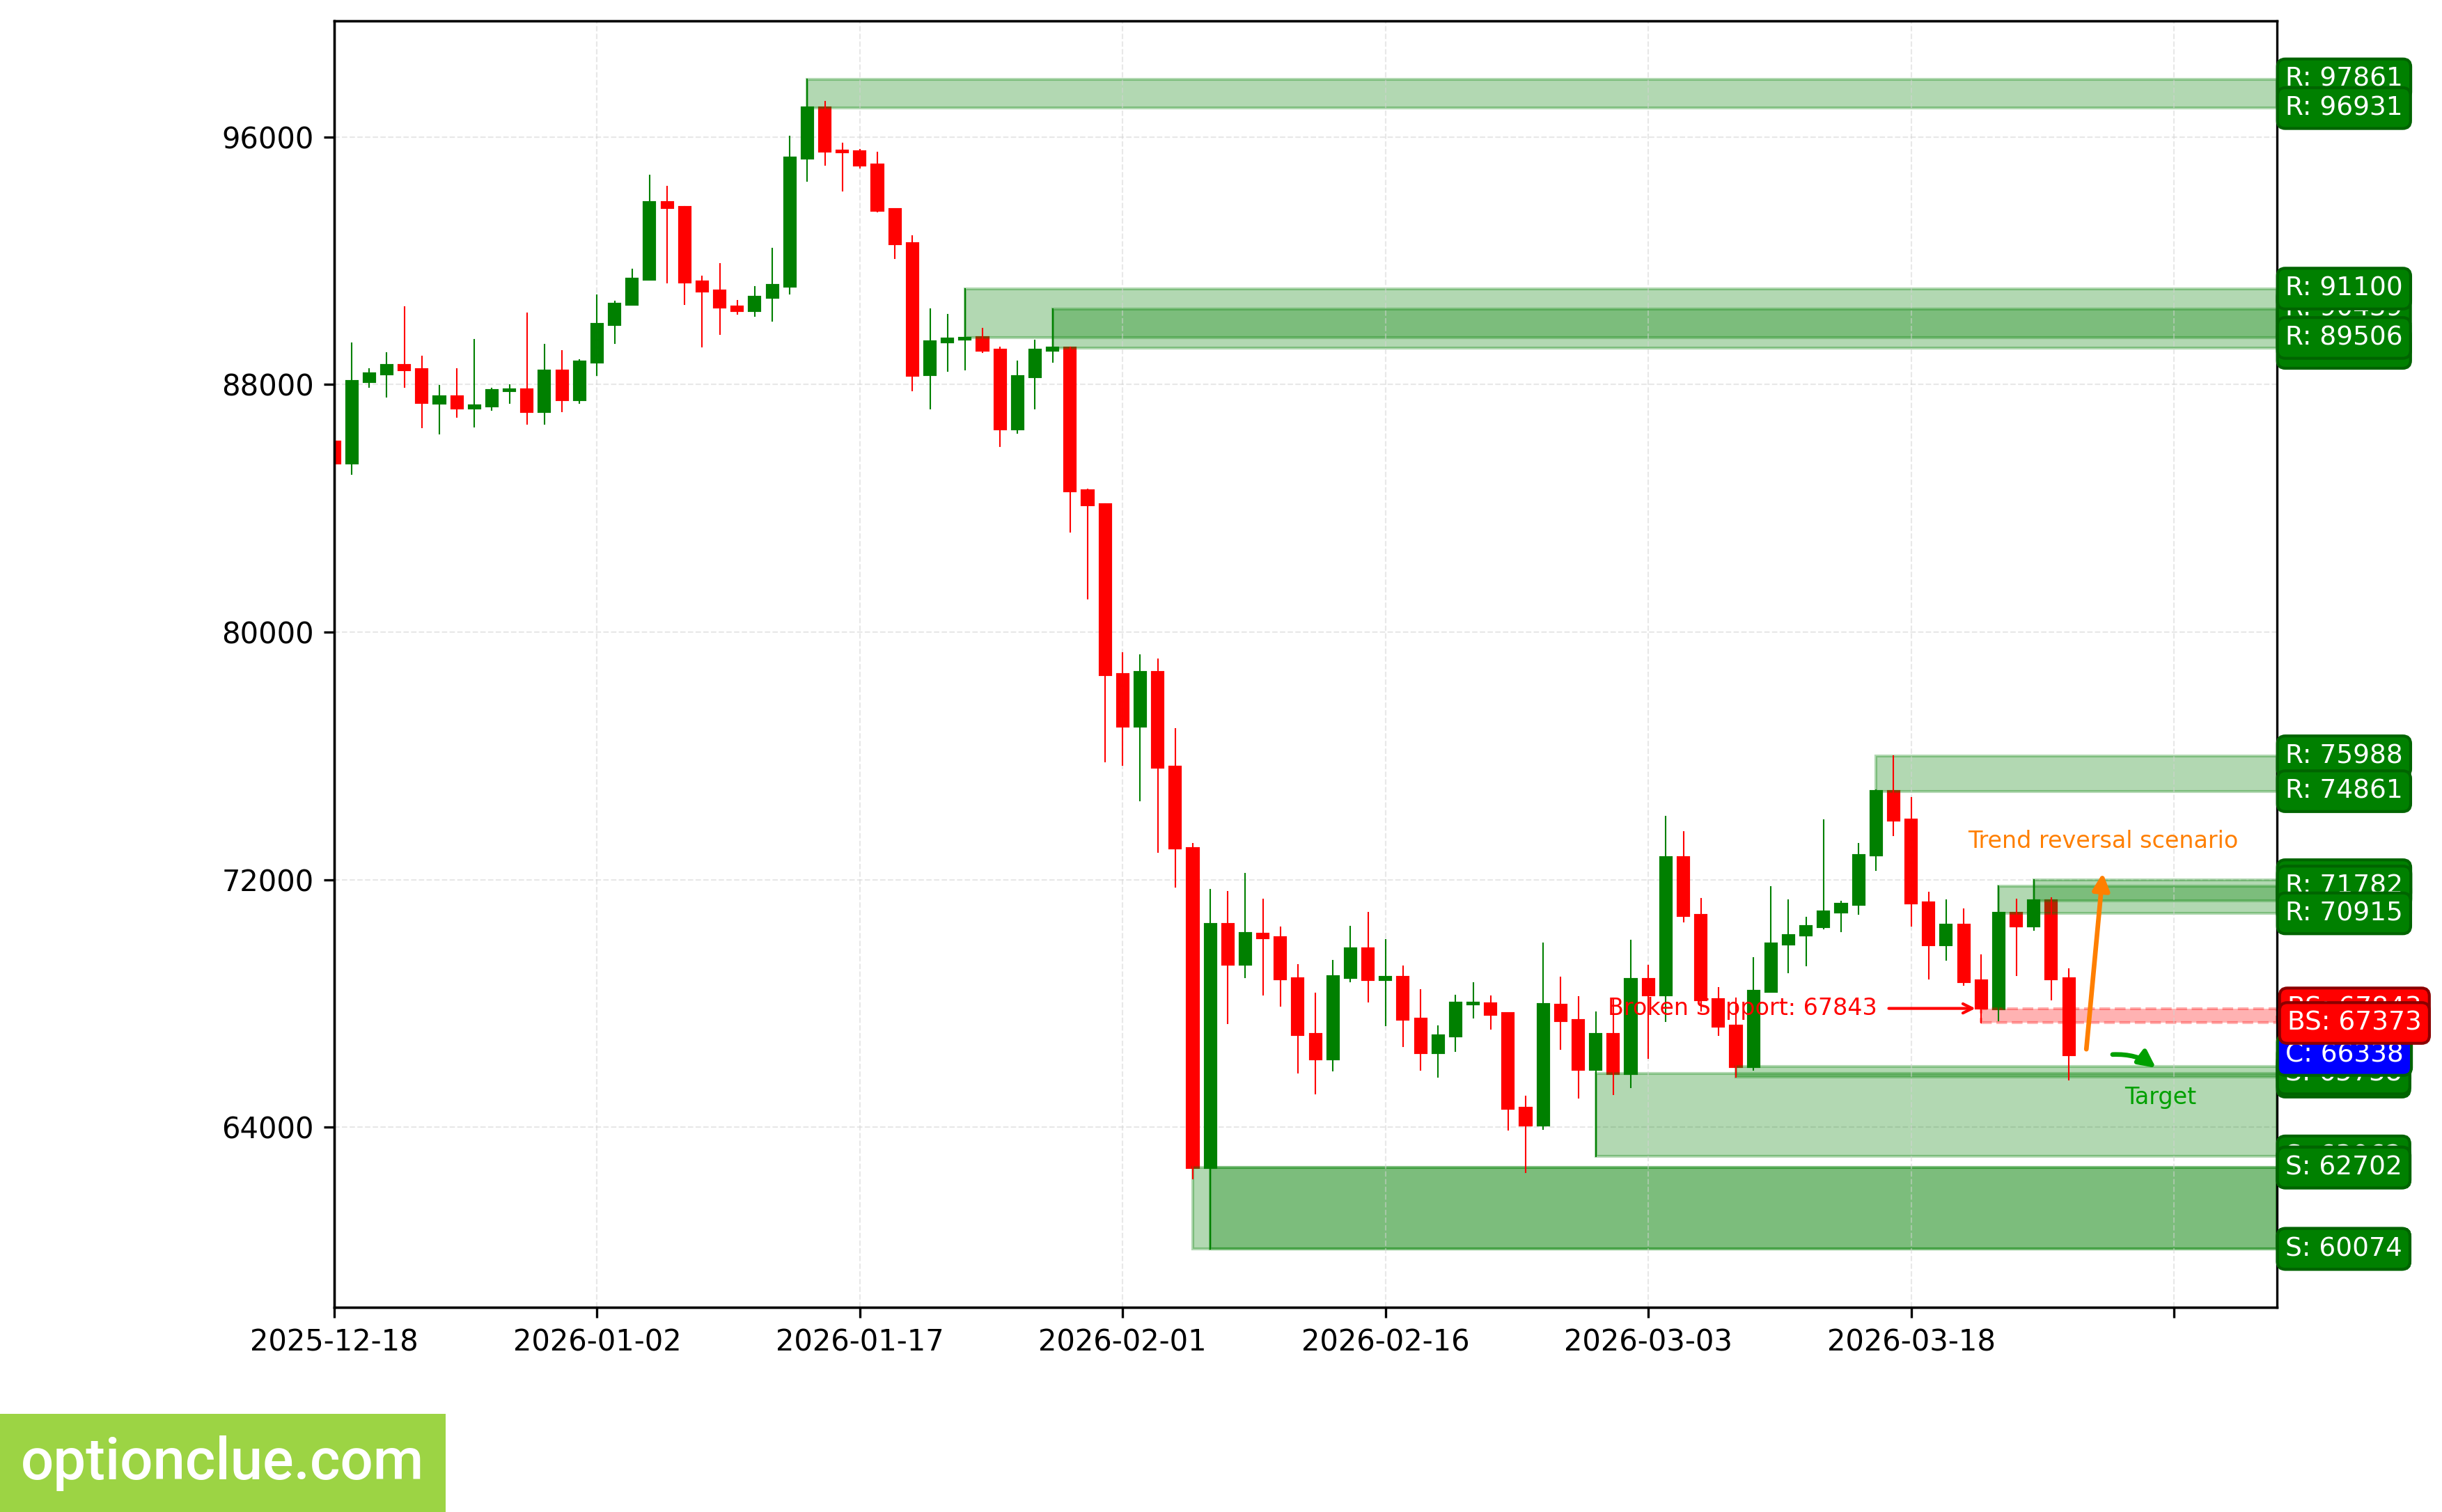
BTC. Technical analysis. D1.
Ether (ETH)
The trend has turned bearish when the support level (2023 — 2053) was broken on the last closed candlestick. An impulse wave is developing.
The intermediate target for the downward movement is the support level with boundaries 1915 — 1937.
If the new correction completes around the resistance level (2168 — 2198), the potential profit/risk ratio may be approximately 2:1. If the next correction completes around the last broken level (2023 — 2053), the potential profit/risk ratio may be small (around 0.4:1).
Short positions will remain relevant as long as the market remains below the nearest resistance level with boundaries 2168 — 2198. If the market successfully closes above this nearest resistance, the trend will reverse to the opposite (bullish).
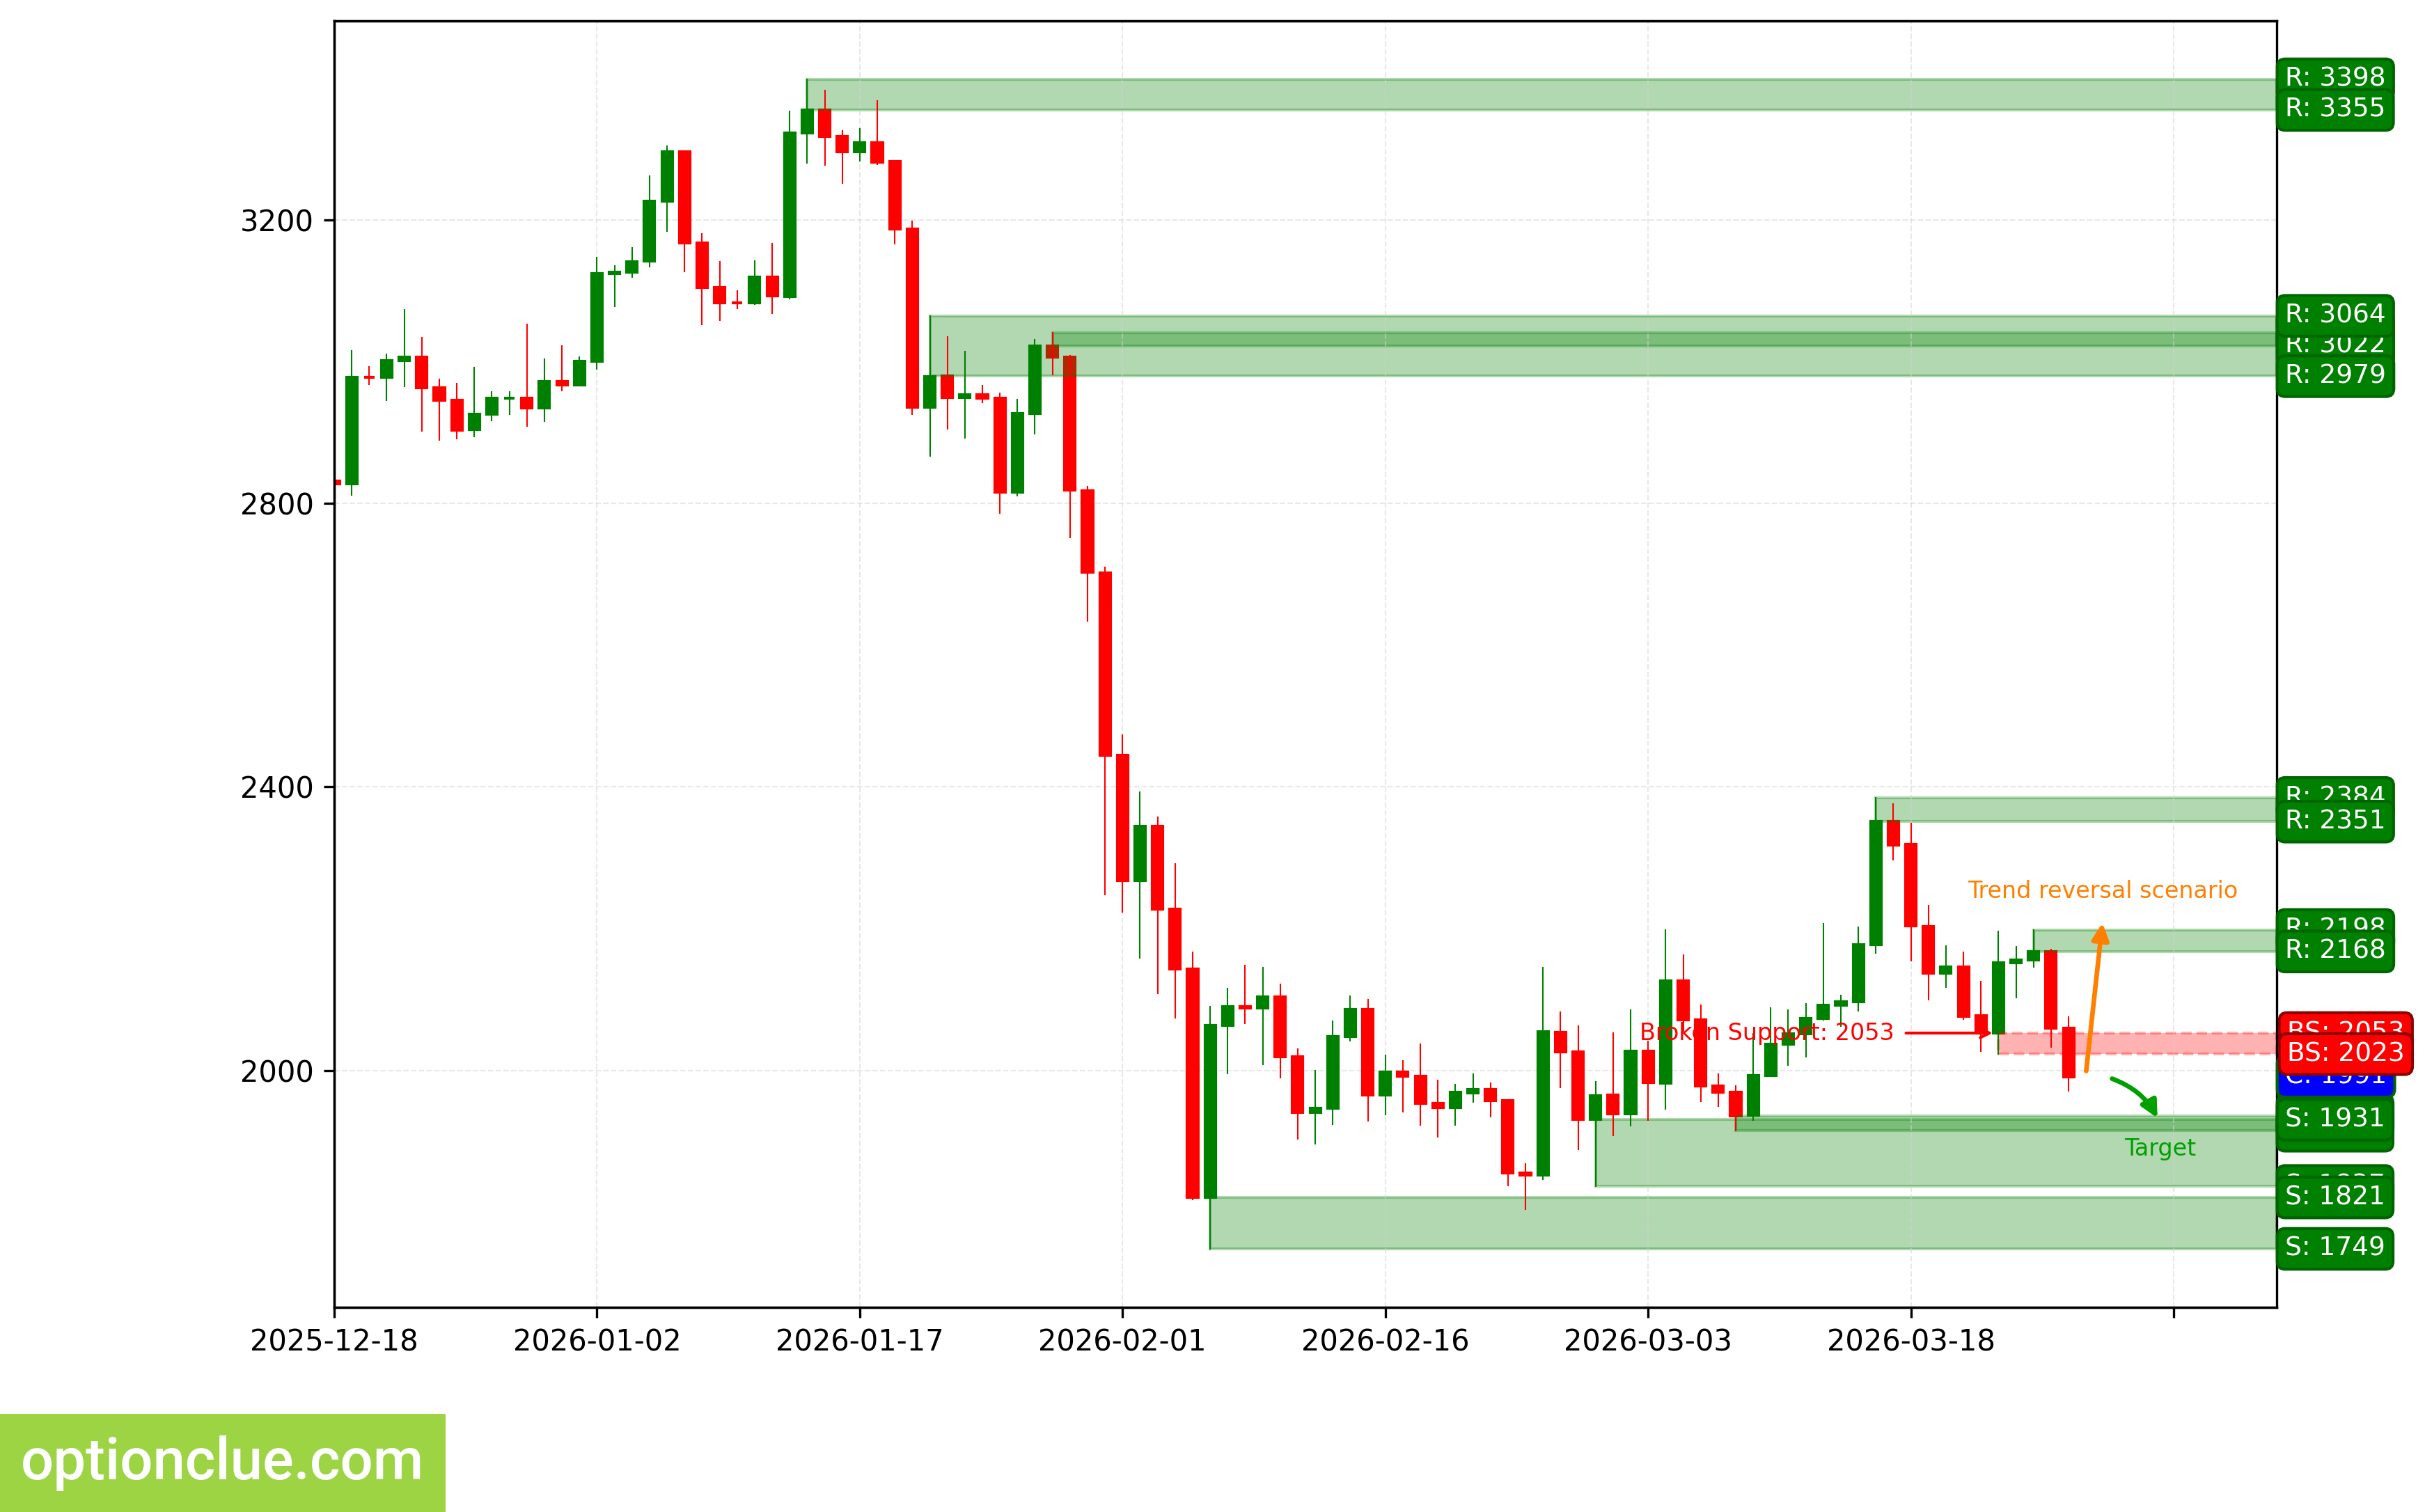
ETH. Technical analysis. D1.
Apple Inc (AAPL)
The bearish trend continues, a corrective wave is developing. An entry point for selling on rebound may form after the current correction completes. The last broken level is support (249.52 — 250.12). The breakout occurred 7 candlesticks ago.
The intermediate target for the downward movement is the support level with boundaries 246.00 — 247.98. In case of successful trend development, a farther target will be at the support level with boundaries 225.95 — 226.79.
If the new correction completes around the resistance level (254.23 — 255.13), the potential profit/risk ratio may be approximately 1.2:1. When using the farther target — around 5:1. If the correction completes around the last broken level (249.52 — 250.12), the potential profit/risk ratio may be small (around 0.2:1). When selecting the farther target — approximately 2:1.
Short positions will remain relevant as long as the market remains below the nearest resistance level with boundaries 254.23 — 255.13. If the market successfully closes above this nearest resistance, the trend will reverse to the opposite (bullish).
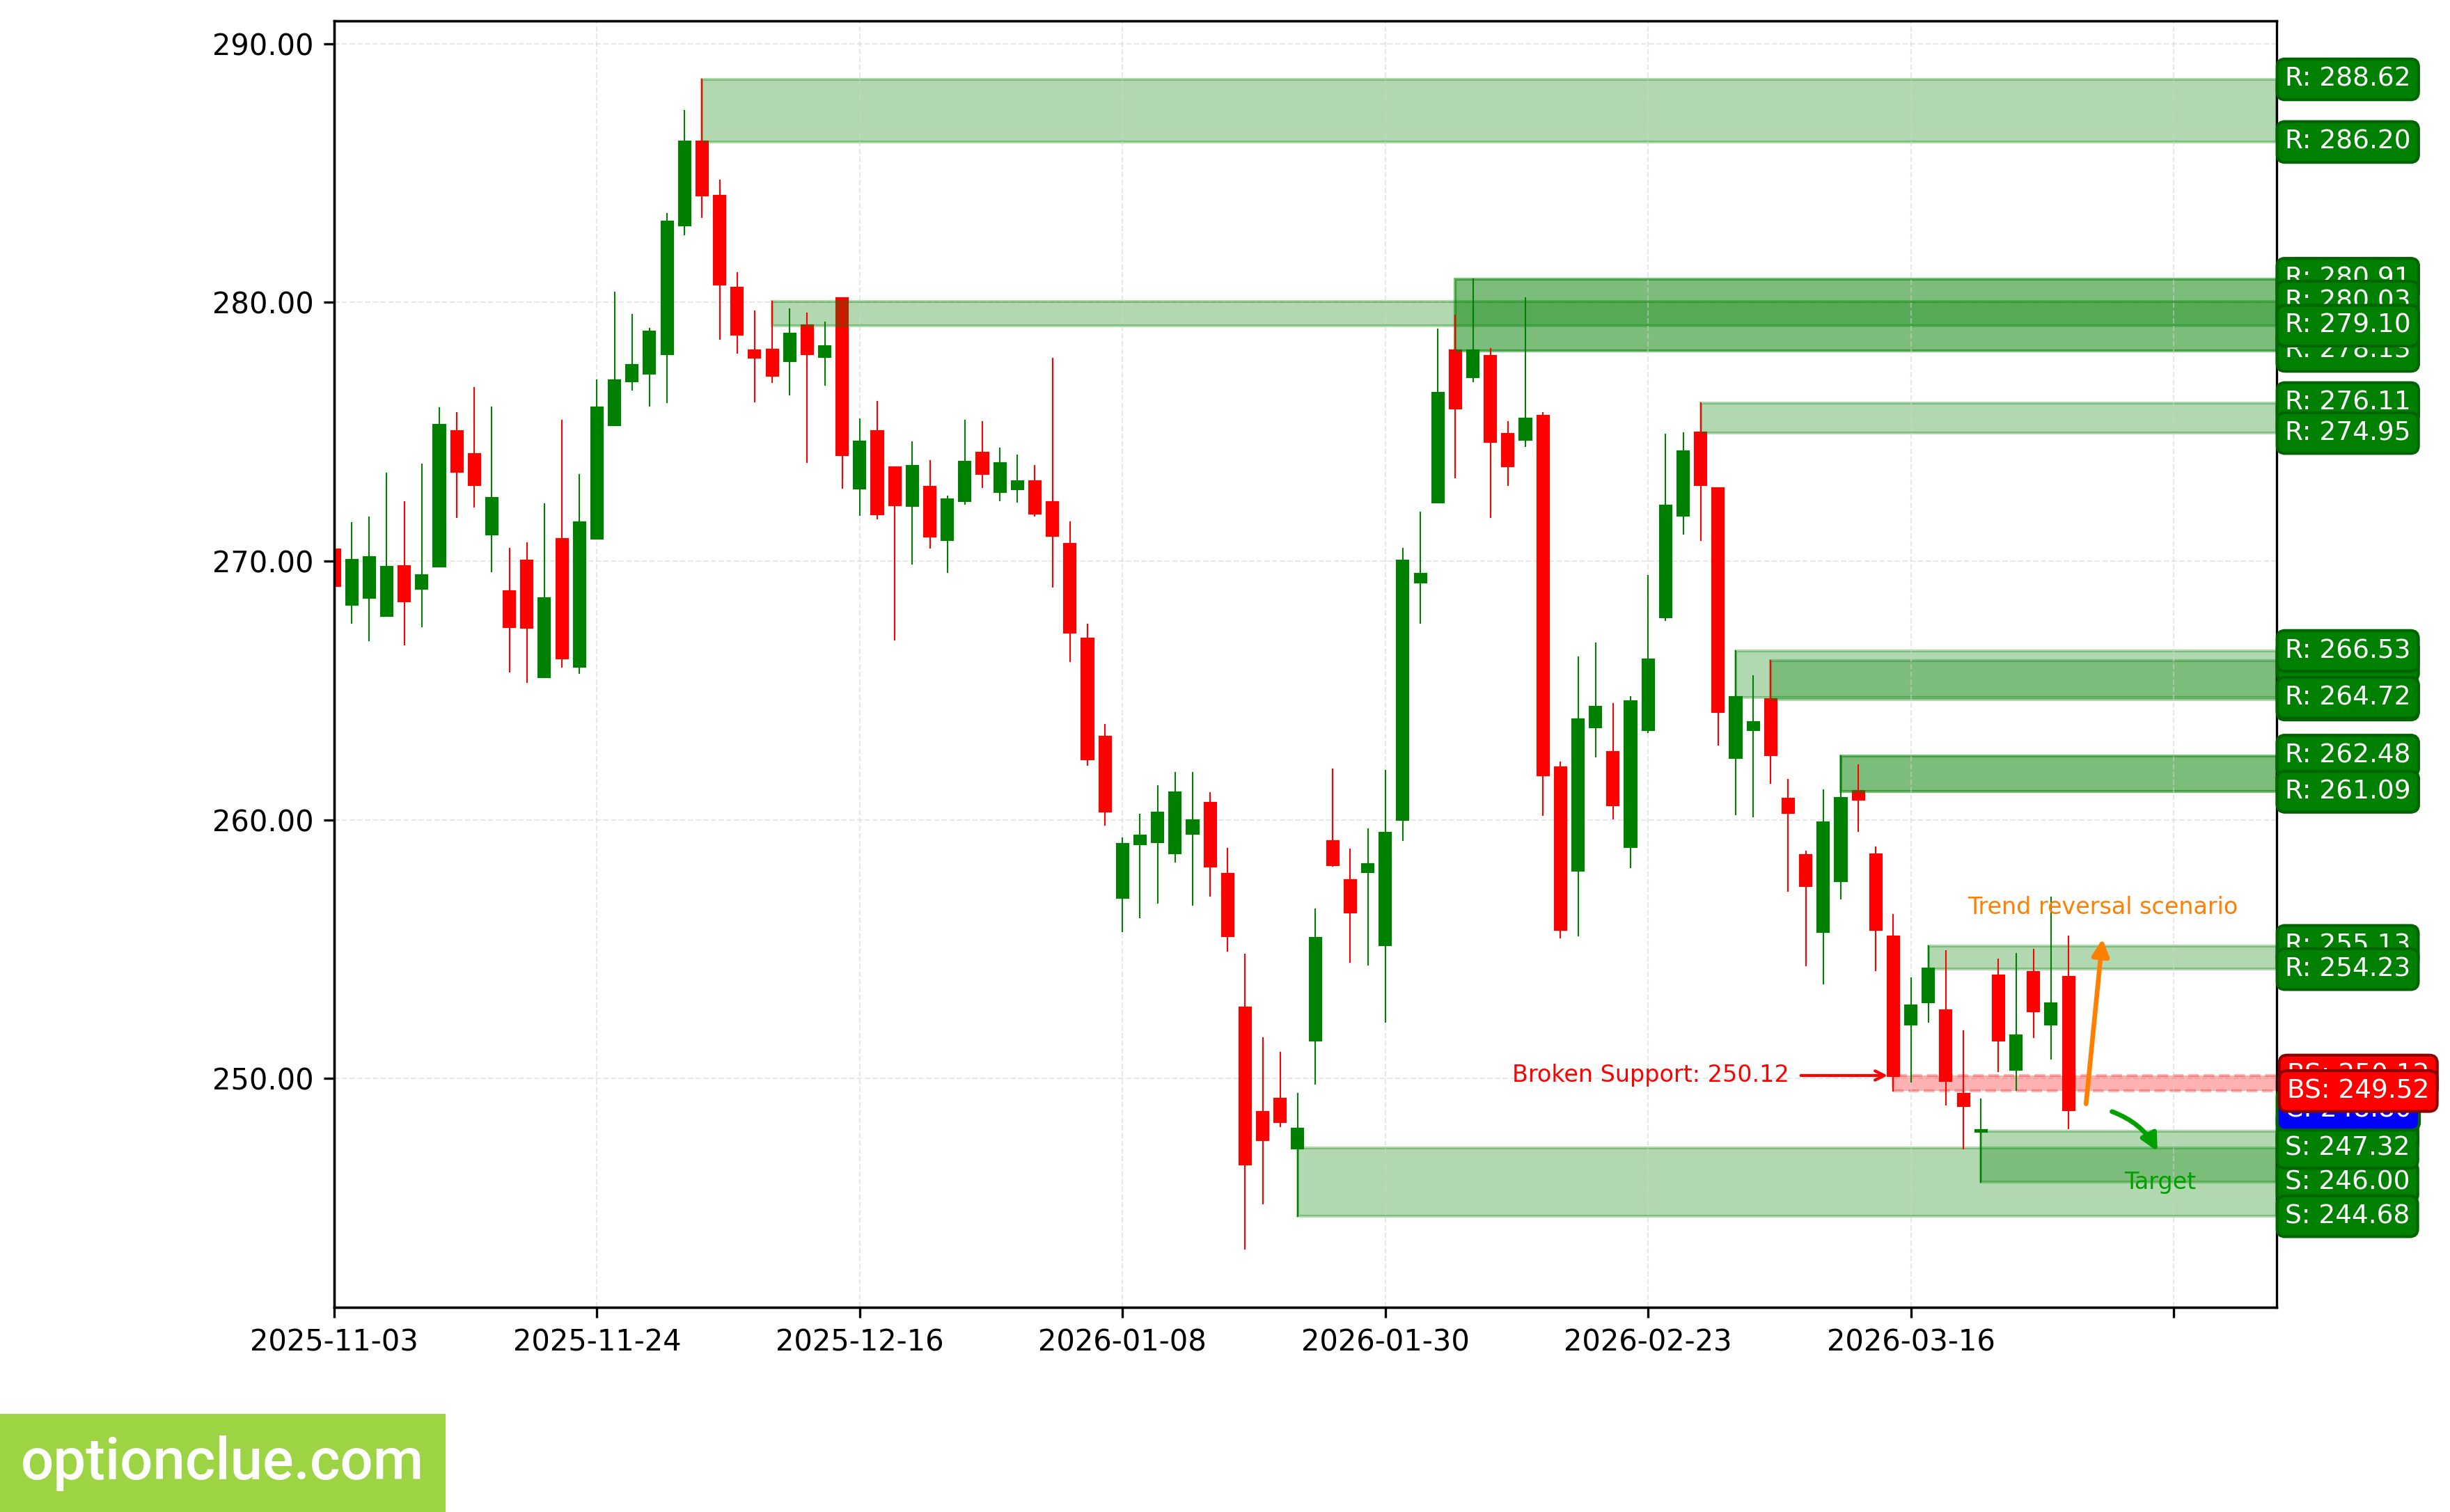
AAPL. Technical analysis. D1.
NVIDIA Corp (NVDA)
The bearish trend continues, an impulse wave is developing. The last broken level is support (171.72 — 172.70). The breakout occurred 2 candlesticks ago.
The intermediate target for the downward movement is the support level with boundaries 164.07 — 167.02. In case of successful trend development, a farther target will be at the support level with boundaries 151.49 — 152.98.
If the new correction completes around the resistance level (178.68 — 181.22), the potential profit/risk ratio may be approximately 2:1. When using the farther target — approximately 4:1. If the next correction completes around the last broken level (171.72 — 172.70), the potential profit/risk ratio may be small (approximately 0.4:1). When selecting the farther target — approximately 1.4:1.
Short positions will remain relevant as long as the market remains below the nearest resistance level with boundaries 178.68 — 181.22. If the market successfully closes above this nearest resistance, the trend will reverse to the opposite (bullish).
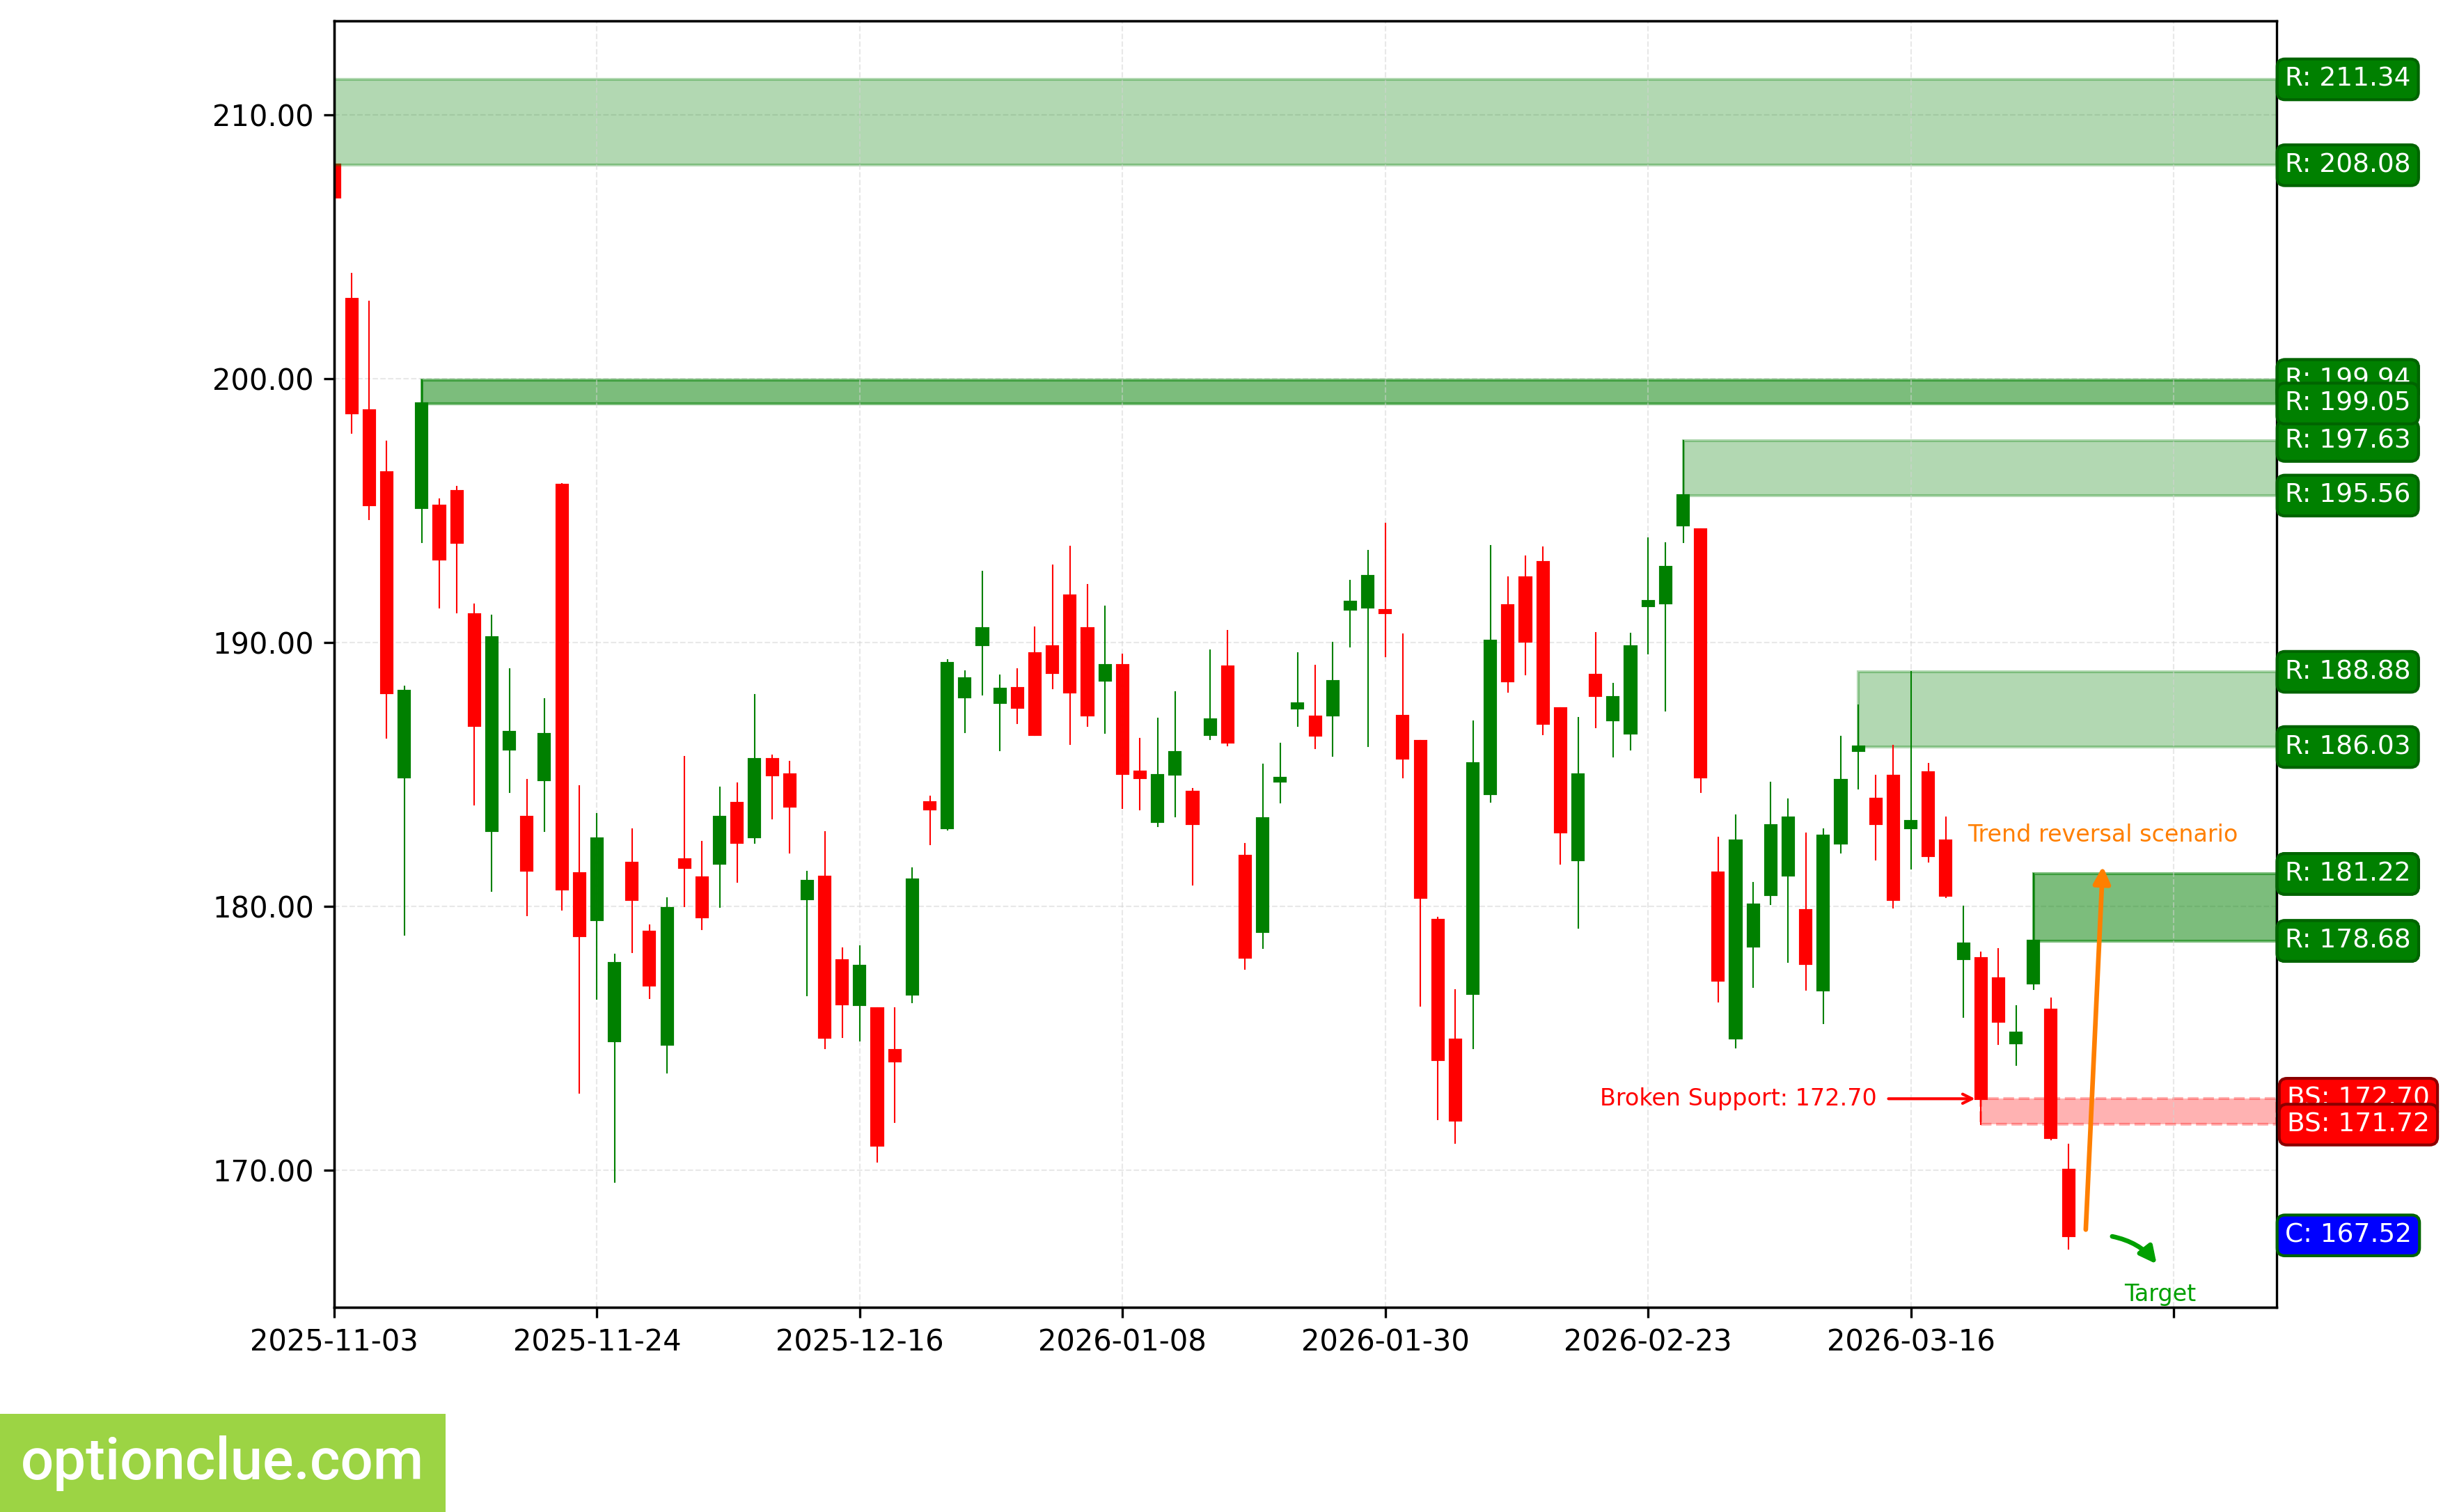
NVDA. Technical analysis. D1.
Tesla Inc (TSLA)
The bearish trend continues, an impulse wave is developing. The last broken level is support (364.46 — 367.96). The breakout occurred on the last closed candlestick.
The intermediate target for the downward movement is the support level with boundaries 346.07 — 347.79. In case of successful trend development, a farther target will be at the support level with boundaries 314.60 — 320.11.
If the new correction completes around the resistance level (389.99 — 396.23), the potential profit/risk ratio may be approximately 2.8:1. When using the farther target — around 4.5:1. If the next correction completes around the last broken level (364.46 — 367.96), the potential profit/risk ratio may be small (approximately 0.4:1). When selecting the farther target — around 1.1:1.
Short positions will remain relevant as long as the market remains below the nearest resistance level with boundaries 389.99 — 396.23. If the market successfully closes above this nearest resistance, the trend will reverse to the opposite (bullish).
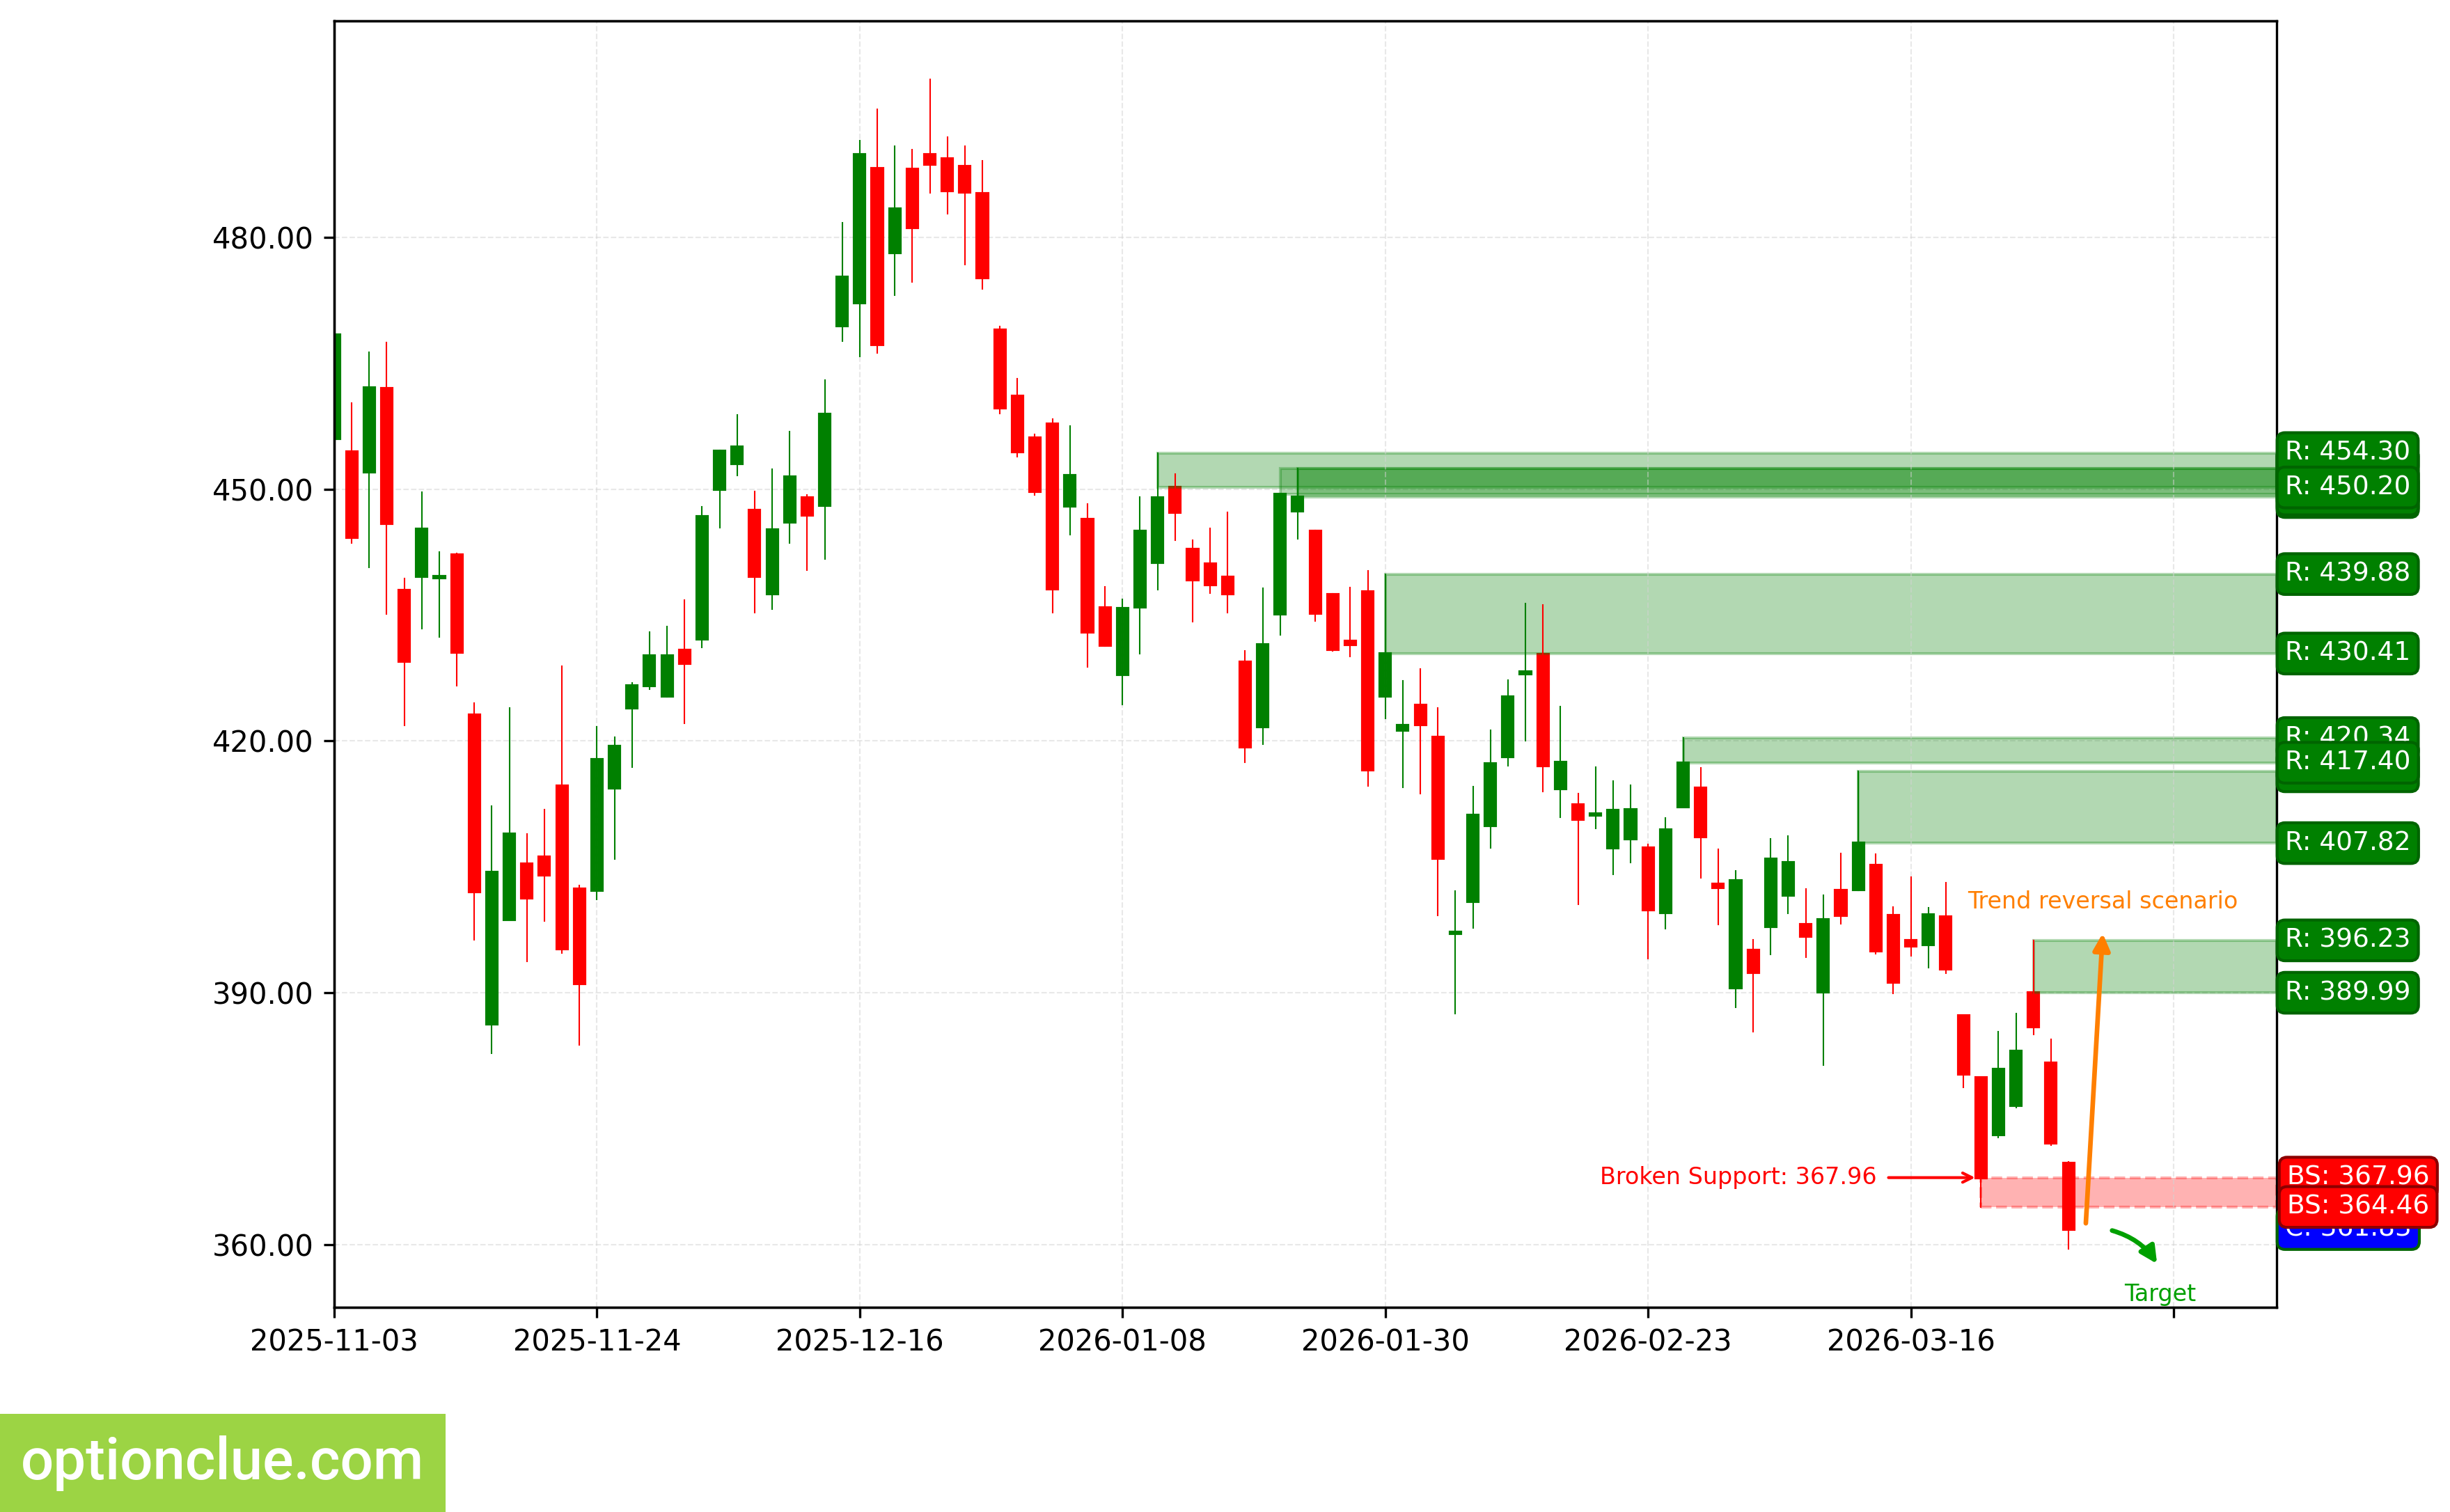
TSLA. Technical analysis. D1.
Summary
From a medium-term trading perspective, financial instruments with correction nearing completion on Daily and/or potentially the most promising profit-to-risk ratios include: EURUSD, GBPUSD. BTC, ETH may soon deserve attention depending on the depth of market correction.
The other financial instruments on the trading list may also be of interest, but rebound signals on Daily are likely to appear no earlier than in a week on these markets.