
We are reviewing the most important levels on key financial instruments and likely scenarios for developments.
Key Topics
- Euro (EURUSD)
- British Pound (GBPUSD)
- Swiss Franc (USDCHF)
- Japanese Yen (USDJPY)
- Canadian Dollar (USDCAD)
- Australian Dollar (AUDUSD)
- Bitcoin (BTC)
- Ether (ETH)
- Apple Inc (AAPL)
- NVIDIA Corp (NVDA)
- Tesla Inc (TSLA)
- Summary
Euro (EURUSD)
Bullish trend continues, a corrective wave is developing again. An entry point for buying on rebound may form after the current correction completes. The last broken level is resistance (1.1666 — 1.1682). The breakout occurred 13 candlesticks ago.
Intermediate target for the upward movement is the resistance level with boundaries 1.1795 — 1.1808. In case of successful trend development, a farther target will be at the resistance level with boundaries 1.1871 — 1.1918.
If the next correction completes near the support level (1.1703 — 1.1710), the potential profit/risk ratio may be slightly more than 1:1. When using a farther target — more than 2:1.
Long positions will remain relevant, as long as the market is above the nearest support level with boundaries 1.1703 — 1.1710. If the market successfully closes below this support, the trend will reverse to the opposite (bearish).
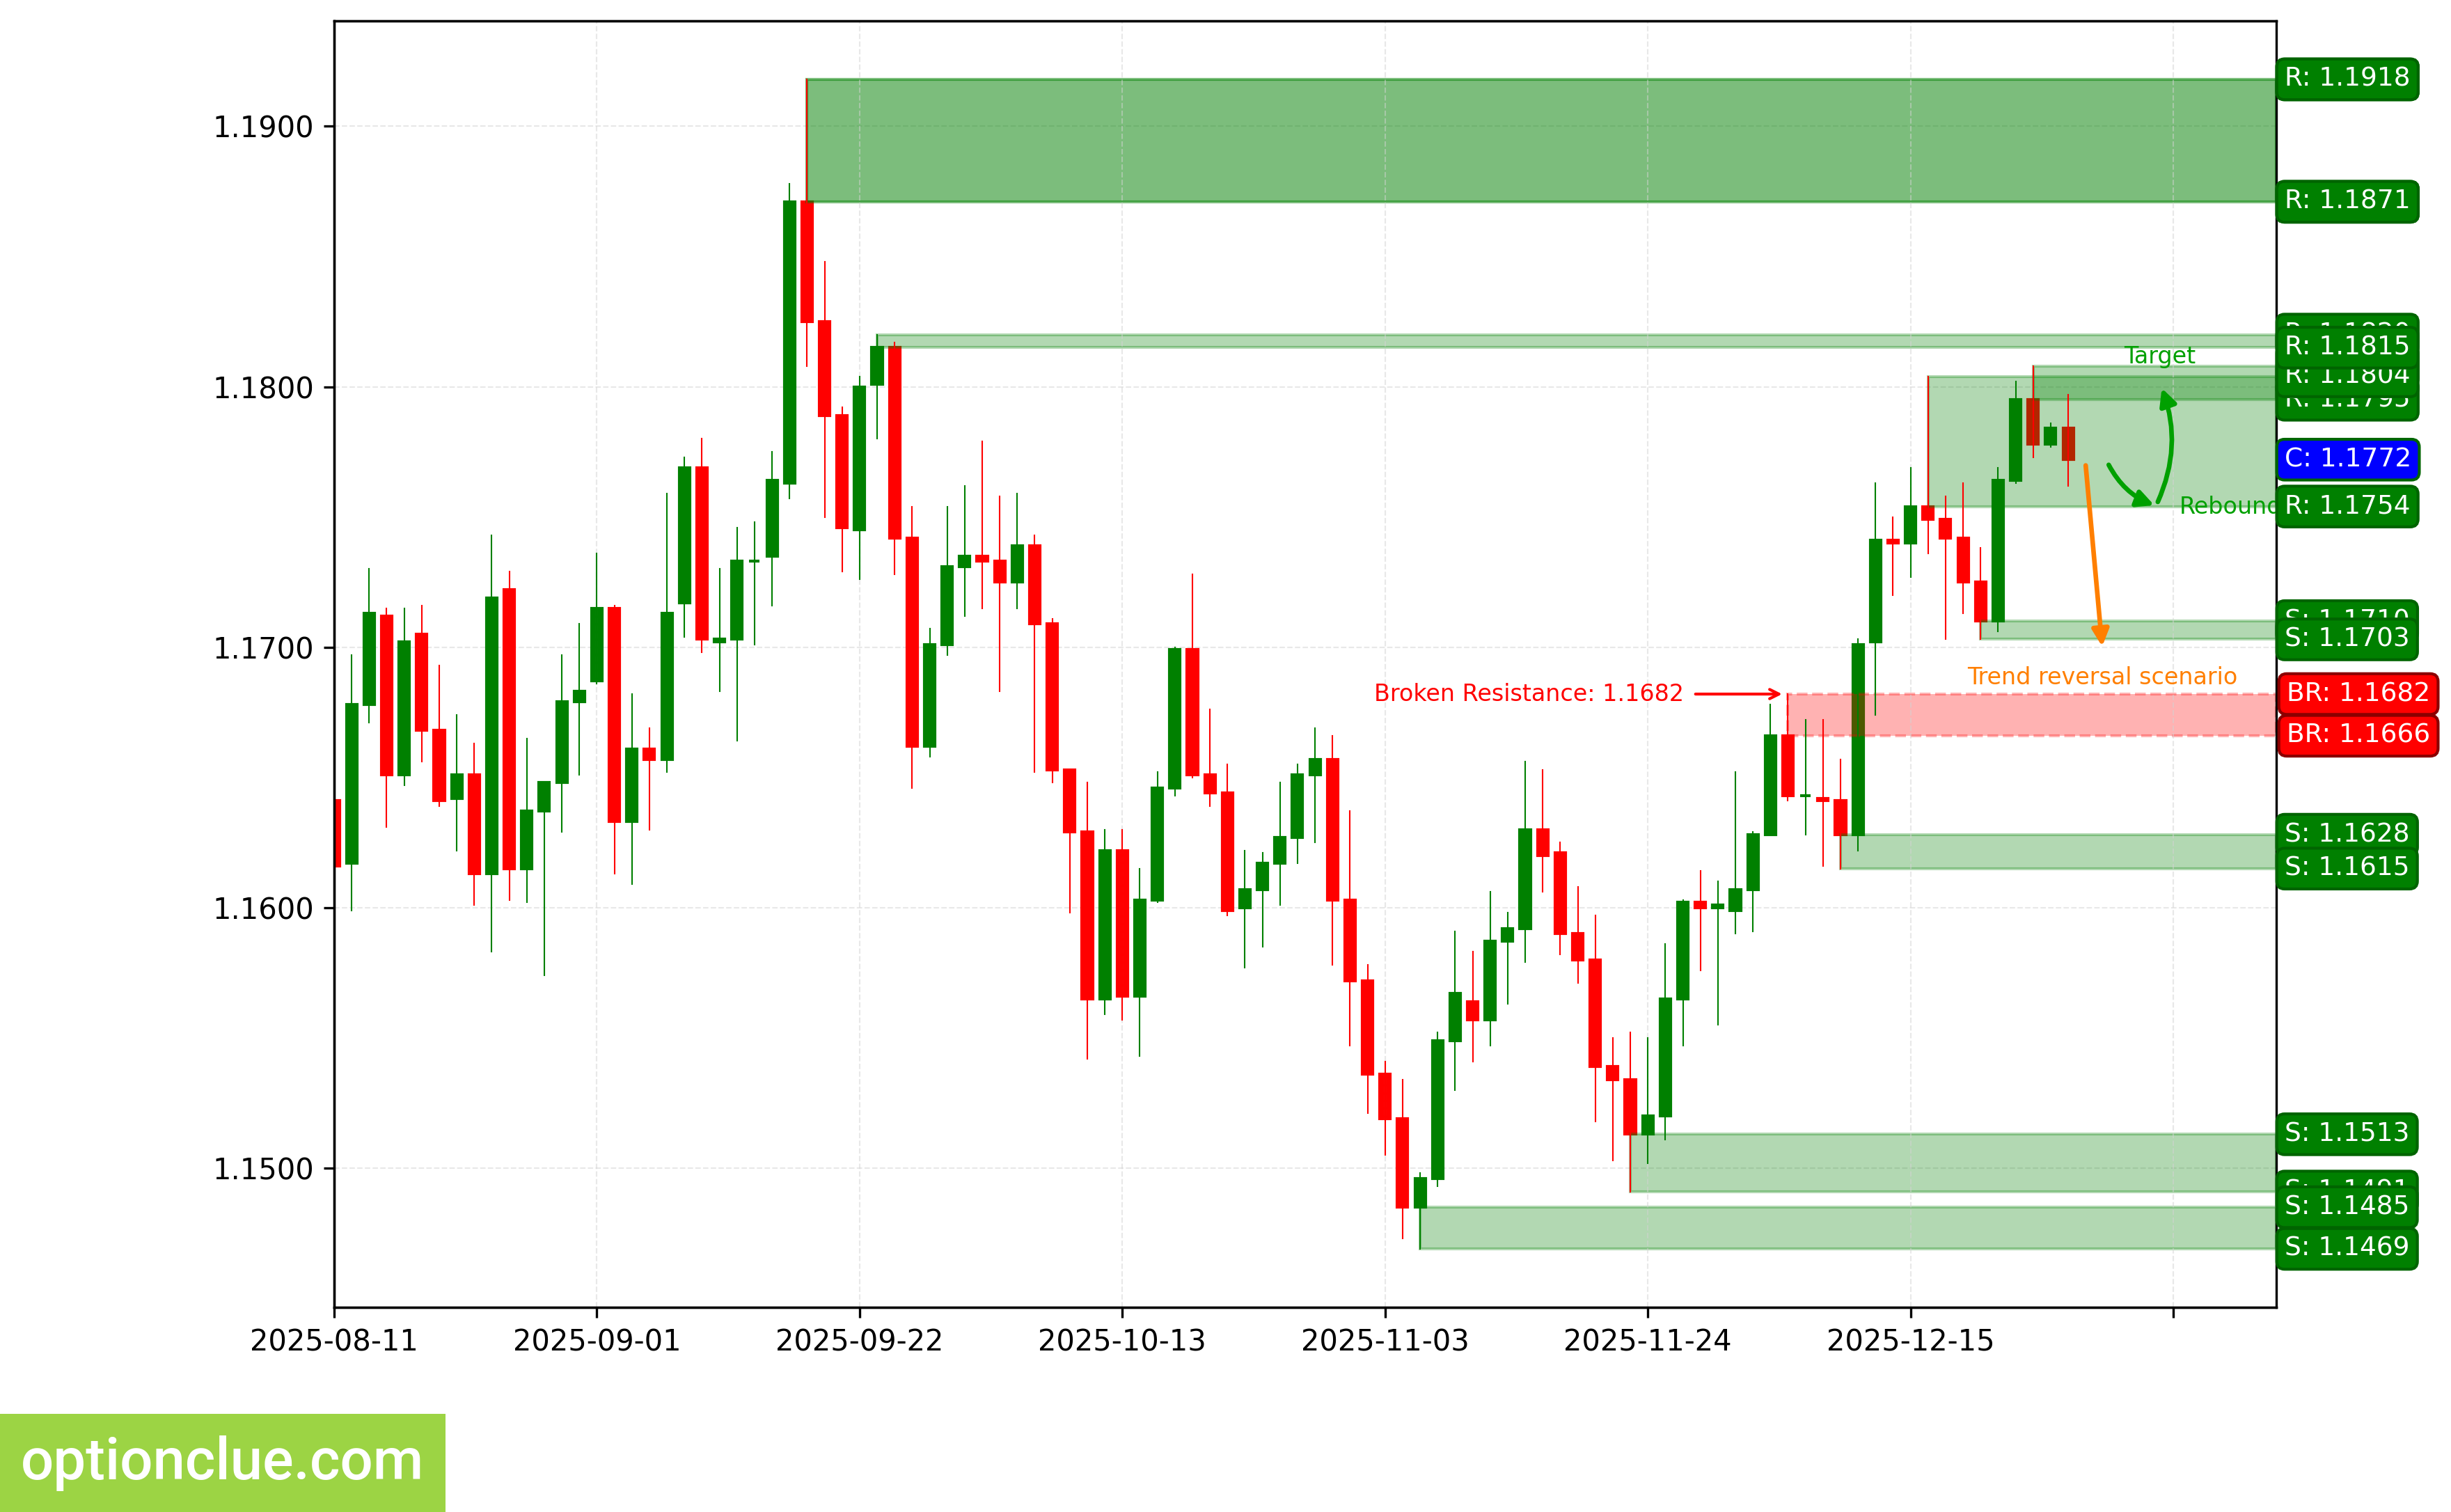
EURUSD. Technical analysis. D1.
British Pound (GBPUSD)
Bullish trend continues, a corrective wave is developing. An entry point for buying on rebound may form after the current correction completes. The last broken level is resistance (1.3393 — 1.3438). The breakout occurred 5 candlesticks ago.
Intermediate target for the upward movement is the resistance level with boundaries 1.3513 — 1.3534. In case of successful trend development, a farther target will be at the resistance level with boundaries 1.3653 — 1.3726.
The potential profit/risk ratio from current prices when setting targets and fixing risks according to daily timeframe levels may be small (around 0.1:1). When using a farther target — also small (approximately 0.6:1). If the correction completes near the support level (1.3312 — 1.3374), the potential profit/risk ratio may be approximately 1.5:1. For a farther target — around 2.7:1. If the correction completes near the last broken level (1.3393 — 1.3438), the potential profit/risk ratio may be small (approximately 0.5:1). When selecting a farther target — insignificant (around 1.3:1).
Long positions will remain relevant, as long as the market is above the nearest support level with boundaries 1.3312 — 1.3374. If the market successfully closes below this nearest support, the trend will reverse to the opposite (bearish).
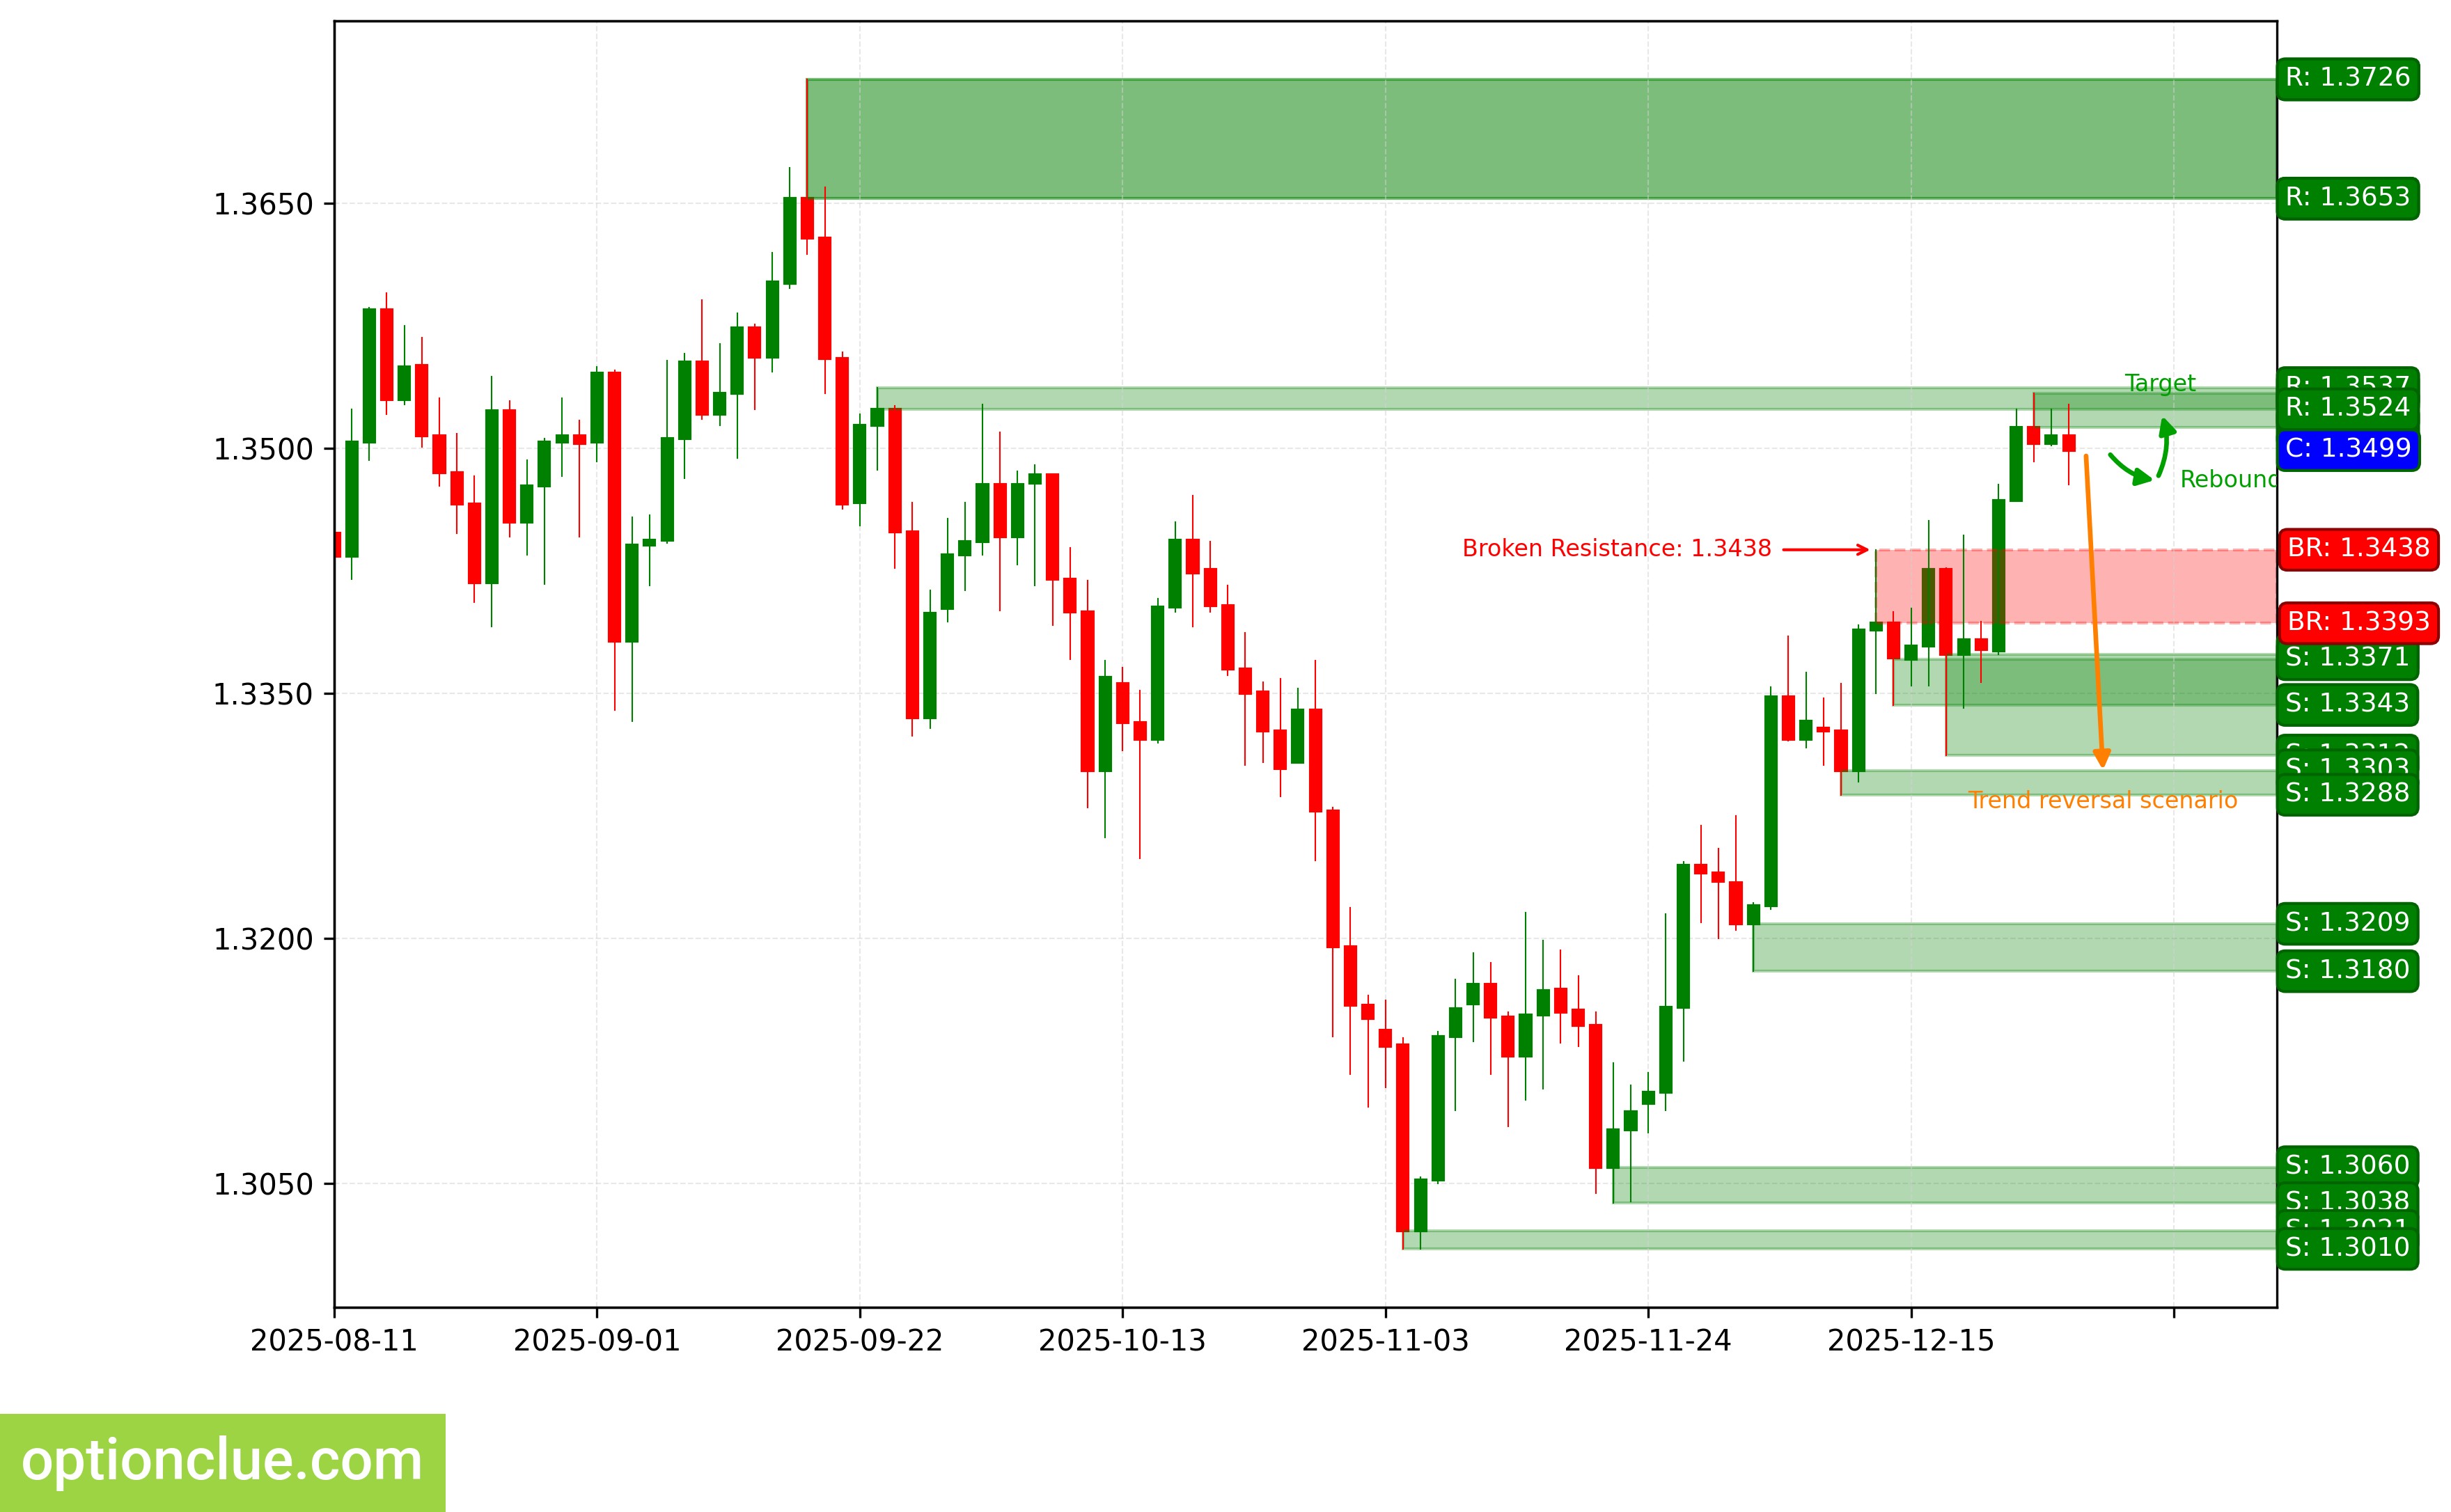
GBPUSD. Technical analysis. D1.
Swiss Franc (USDCHF)
Bearish trend continues, a corrective wave is developing. An entry point for selling on rebound may form after the current correction completes. The last broken level is support (0.7924 — 0.7942). The breakout occurred 5 candlesticks ago.
Intermediate target for the downward movement is the support level with boundaries 0.7858 — 0.7874.
The potential profit/risk ratio from current prices when setting targets and fixing risks according to daily timeframe levels may be small (approximately 0.1:1). If the correction completes near the resistance level (0.8068 — 0.8085), the potential profit/risk ratio may be around 3:1. If the correction completes near the last broken level (0.7924 — 0.7942), the potential profit/risk ratio may be small (around 0.3:1).
Short positions will remain relevant, as long as the market remains below the nearest resistance level with boundaries 0.8068 — 0.8085. If the market successfully closes above this nearest resistance, the trend will reverse to the opposite (bullish).
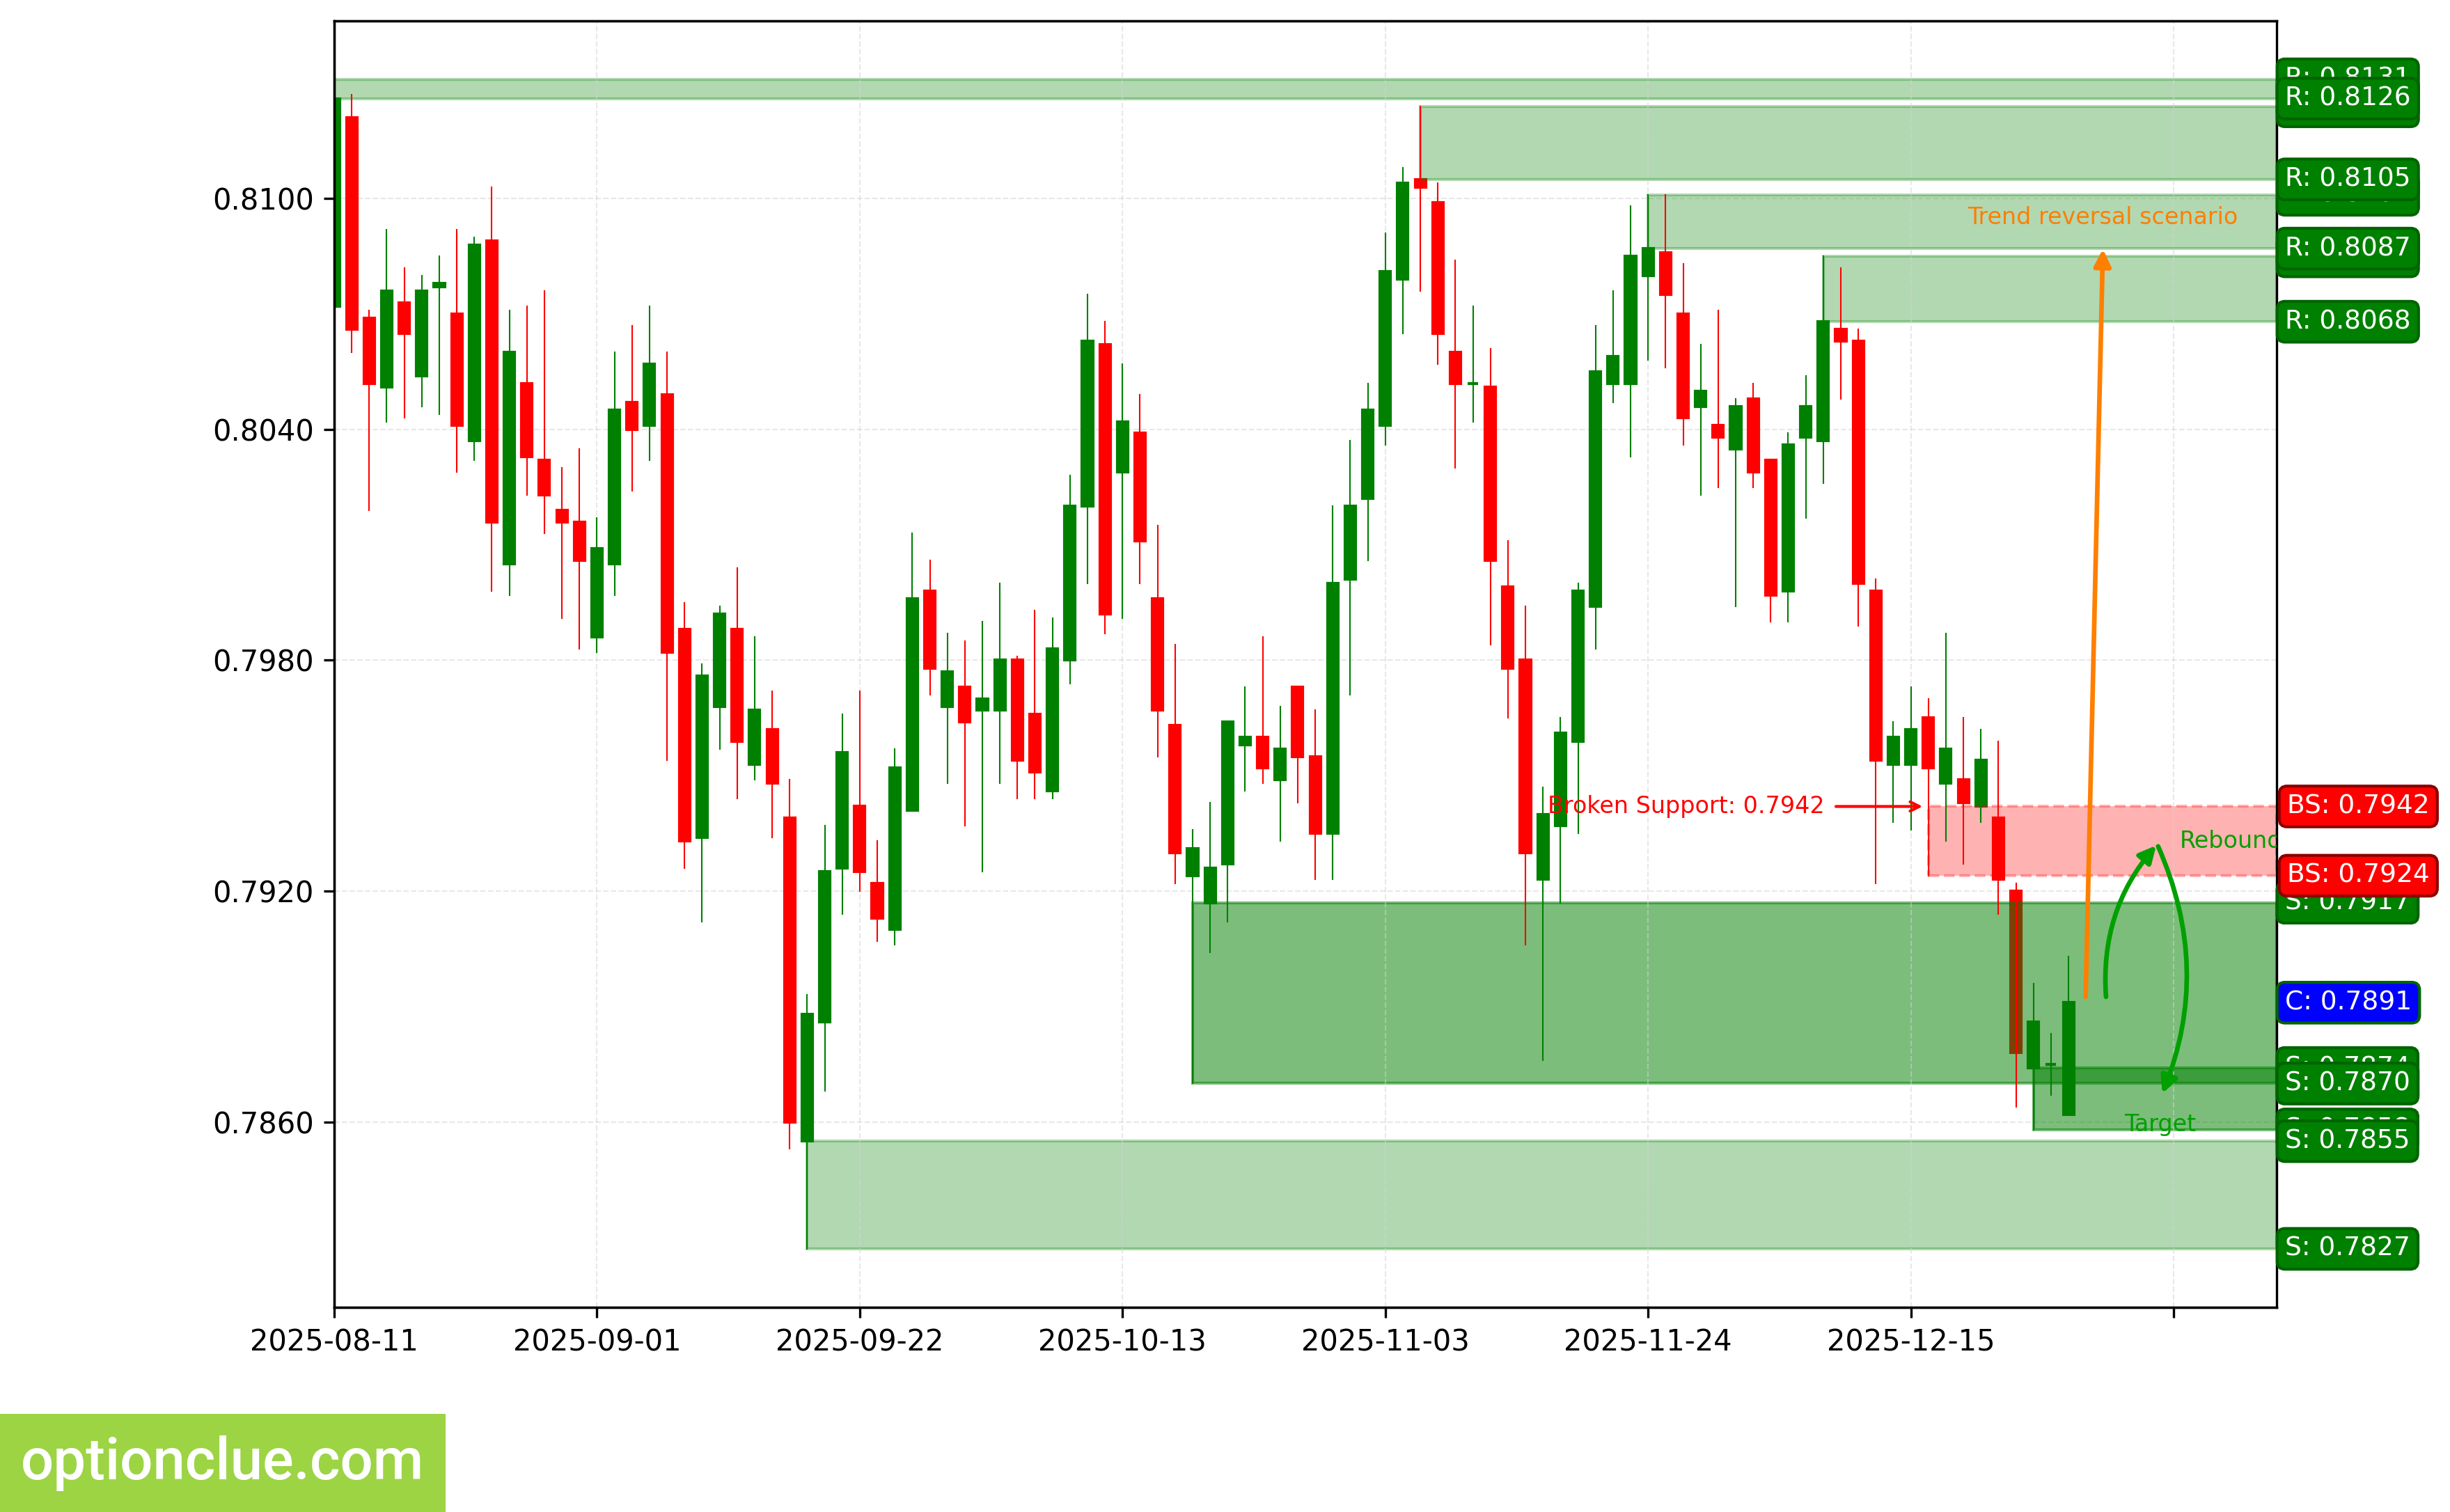
USDCHF. Technical analysis. D1.
Japanese Yen (USDJPY)
Bullish trend continues, 2 candlesticks ago the correction likely completed and an entry point for buying on rebound formed, an impulse wave is developing. The last broken level is resistance (156.82 — 156.95). The breakout occurred 6 candlesticks ago.
Intermediate target for the upward movement is the resistance level with boundaries 157.73 — 157.78. In case of successful trend development, a farther target will be at the resistance level with boundaries 161.69 — 161.85.
If the correction completes near the support level (155.56 — 155.91), the potential profit/risk ratio may be approximately 1.5:1. When using a farther target — around 4:1.
Long positions will remain relevant, as long as the market is above the nearest support level with boundaries 155.56 — 155.91. If the market successfully closes below this support, the trend will reverse to the opposite (bearish).
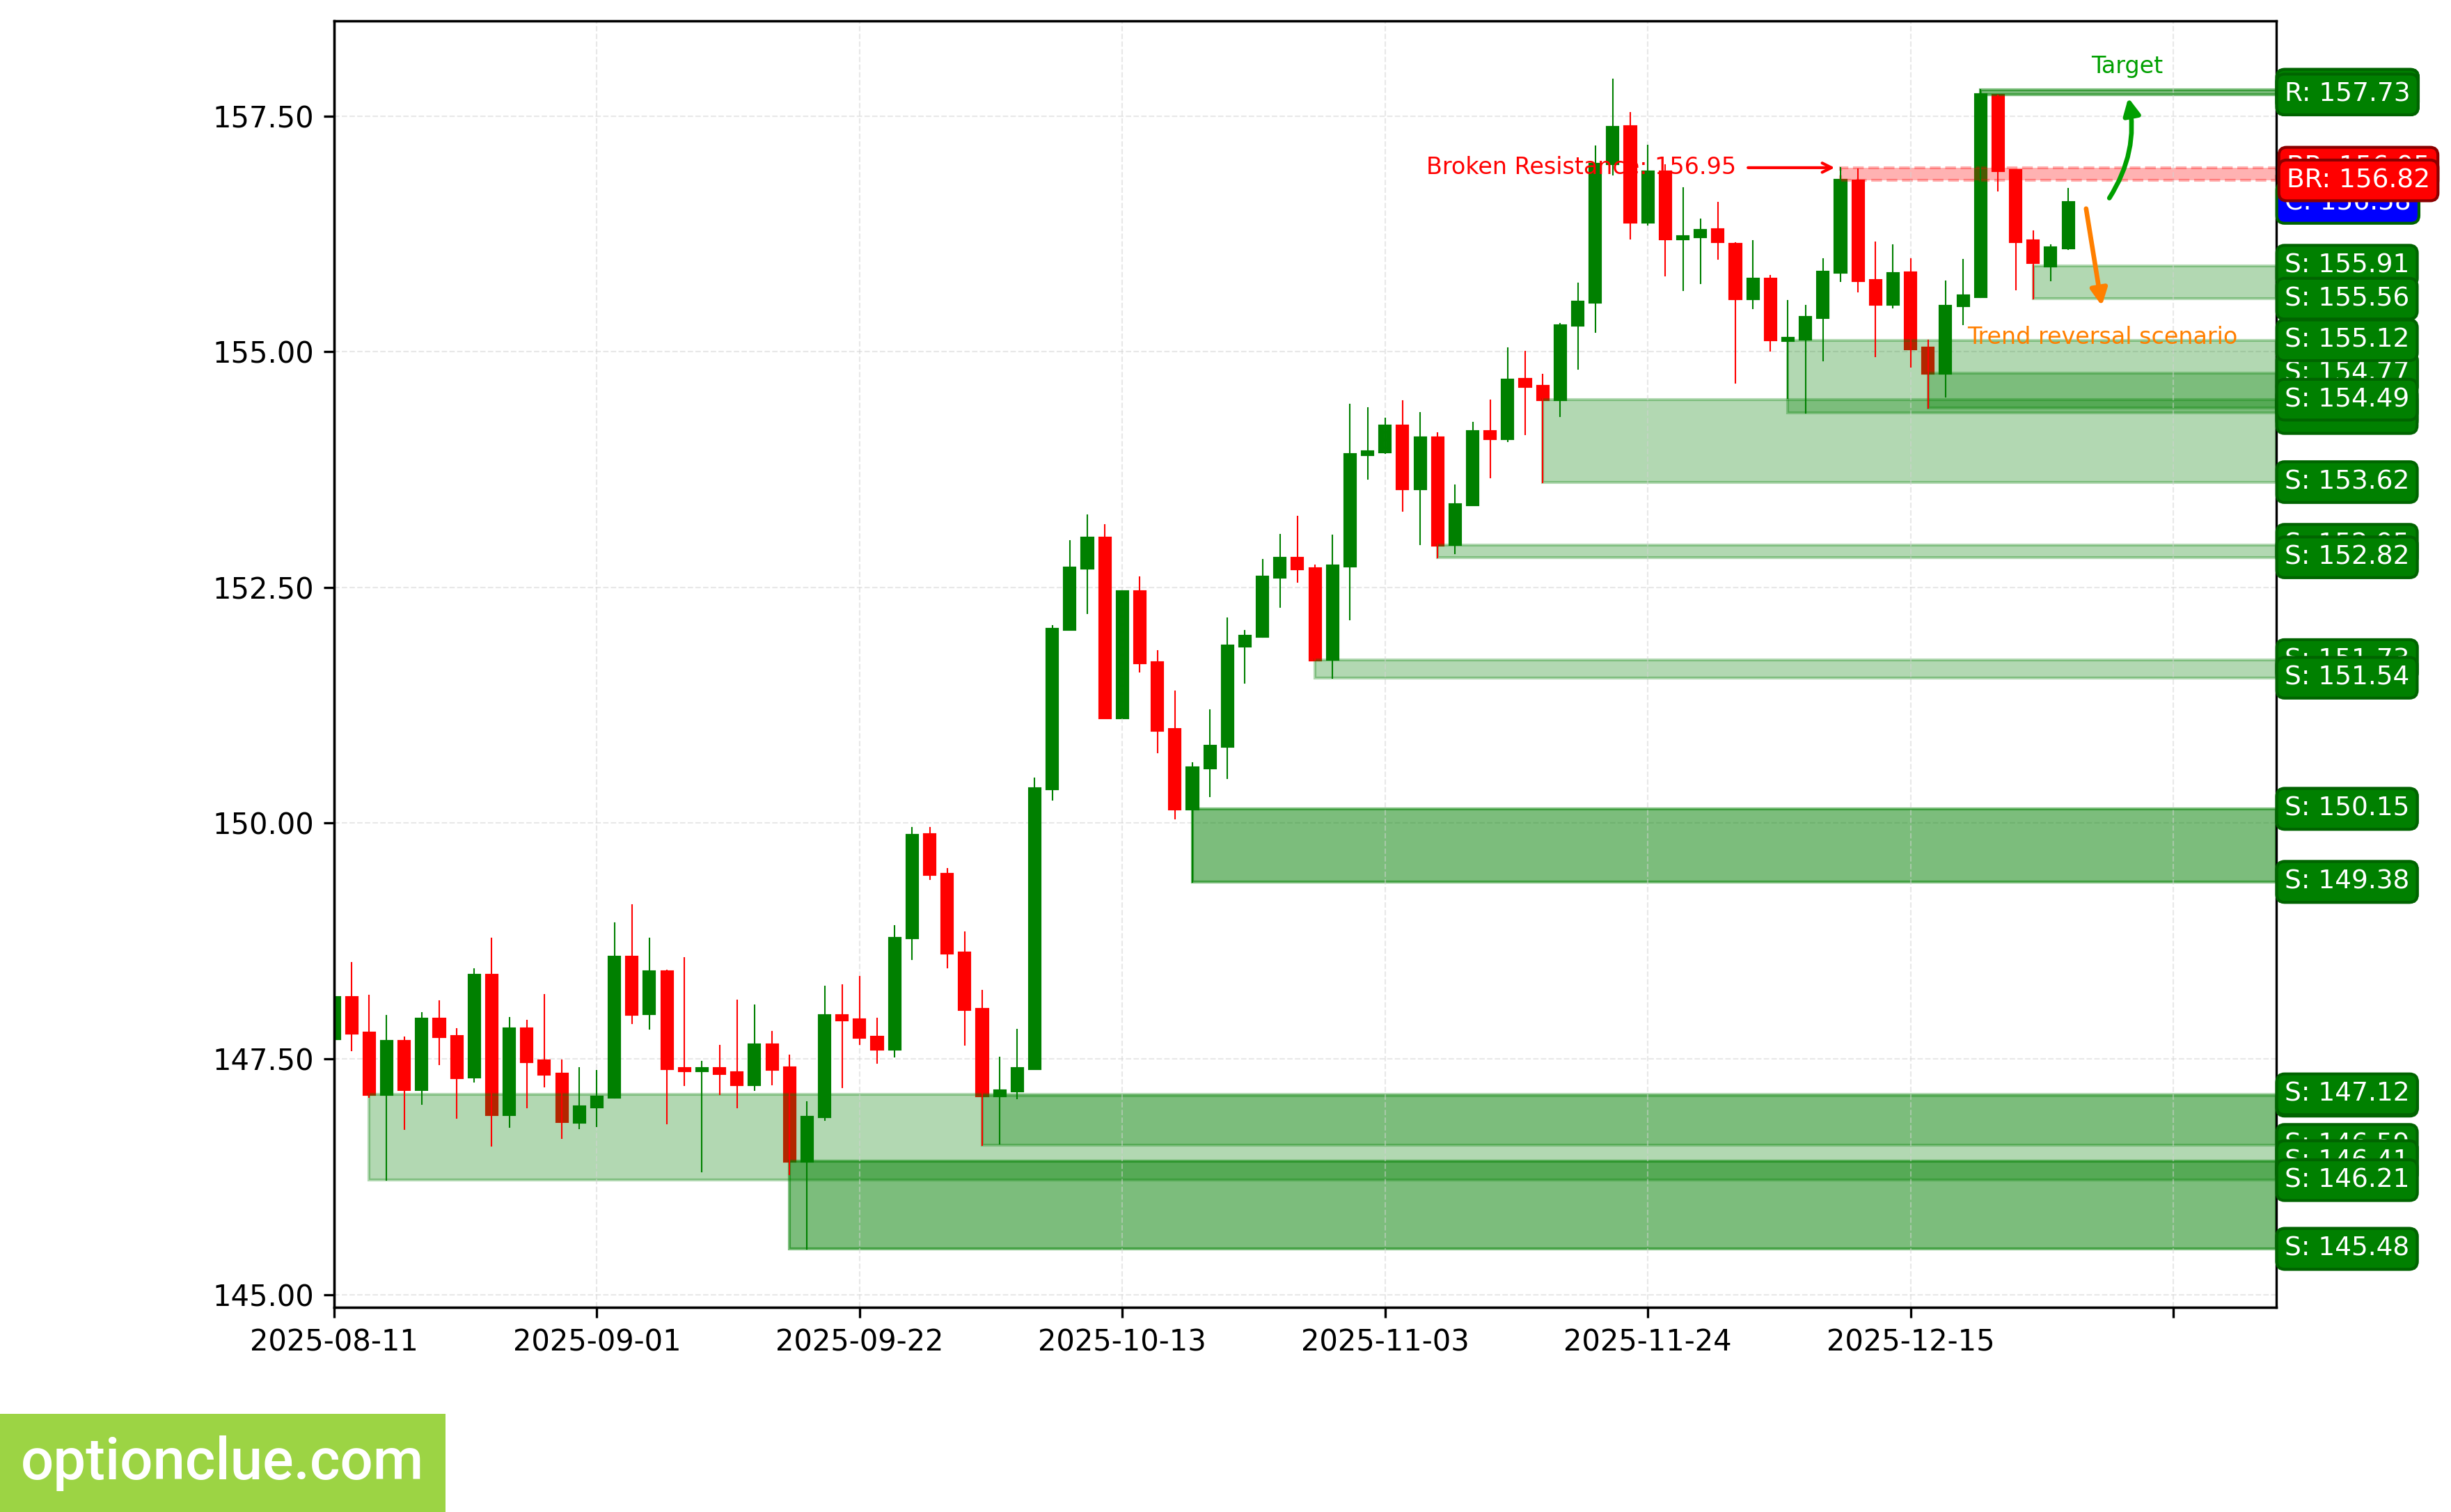
USDJPY. Technical analysis. D1.
Canadian Dollar (USDCAD)
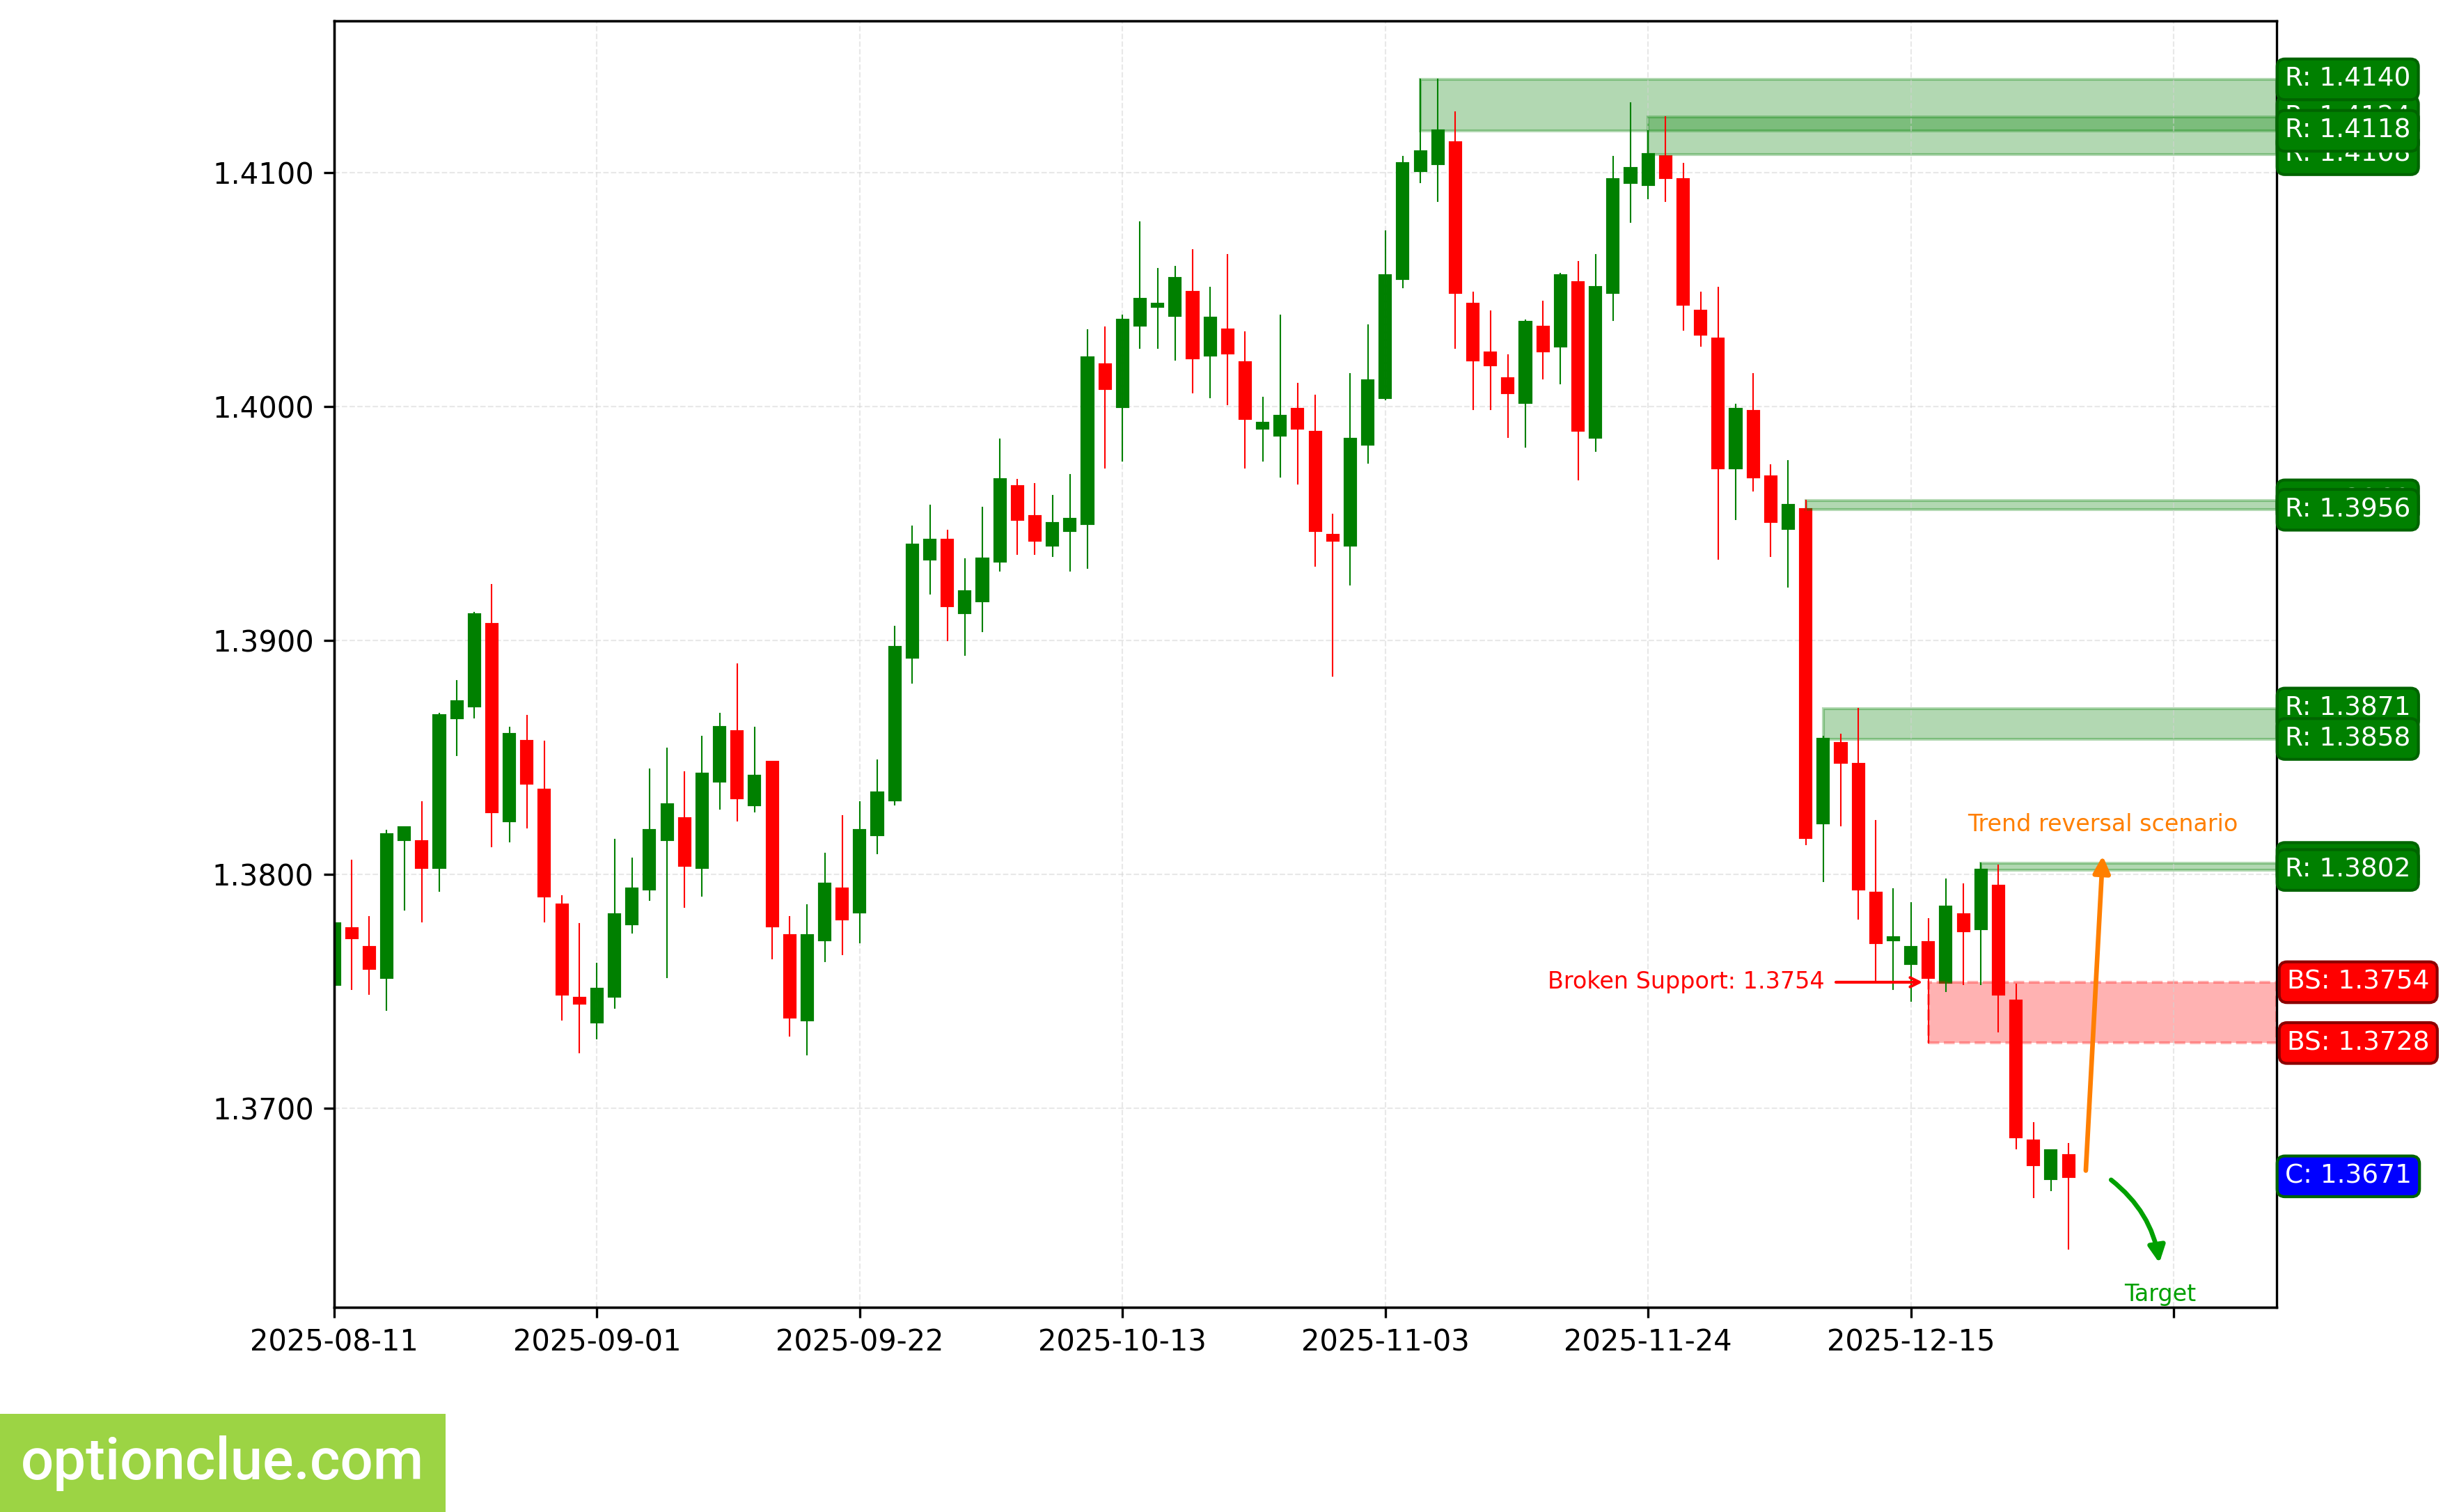
Bearish trend continues, a corrective wave is developing. An entry point for selling on rebound may form after the current correction completes. The last broken level is support (1.3728 — 1.3754). The breakout occurred 4 candlesticks ago.
Intermediate target for the downward movement is the support level with boundaries 1.3573 — 1.3590. In case of successful trend development, a farther target will be at the support level with boundaries 1.3470 — 1.3488.
The potential profit/risk ratio from current prices when setting targets and fixing risks according to daily timeframe levels may be small (approximately 0.4:1). When using a farther target — also small (around 0.9:1). If the next correction completes near the resistance level (1.3802 — 1.3805), the potential profit/risk ratio may be approximately 3:1. For a farther target — more than 4:1. If the next correction completes near the last broken level (1.3728 — 1.3754), the potential profit/risk ratio may be small (approximately 1.2:1). When selecting a farther target — around 2:1.
Short positions will remain relevant, as long as the market remains below the nearest resistance level with boundaries 1.3802 — 1.3805. If the market successfully closes above this nearest resistance, the trend will reverse to the opposite (bullish).
USDCAD. Technical analysis. D1.
Australian Dollar (AUDUSD)
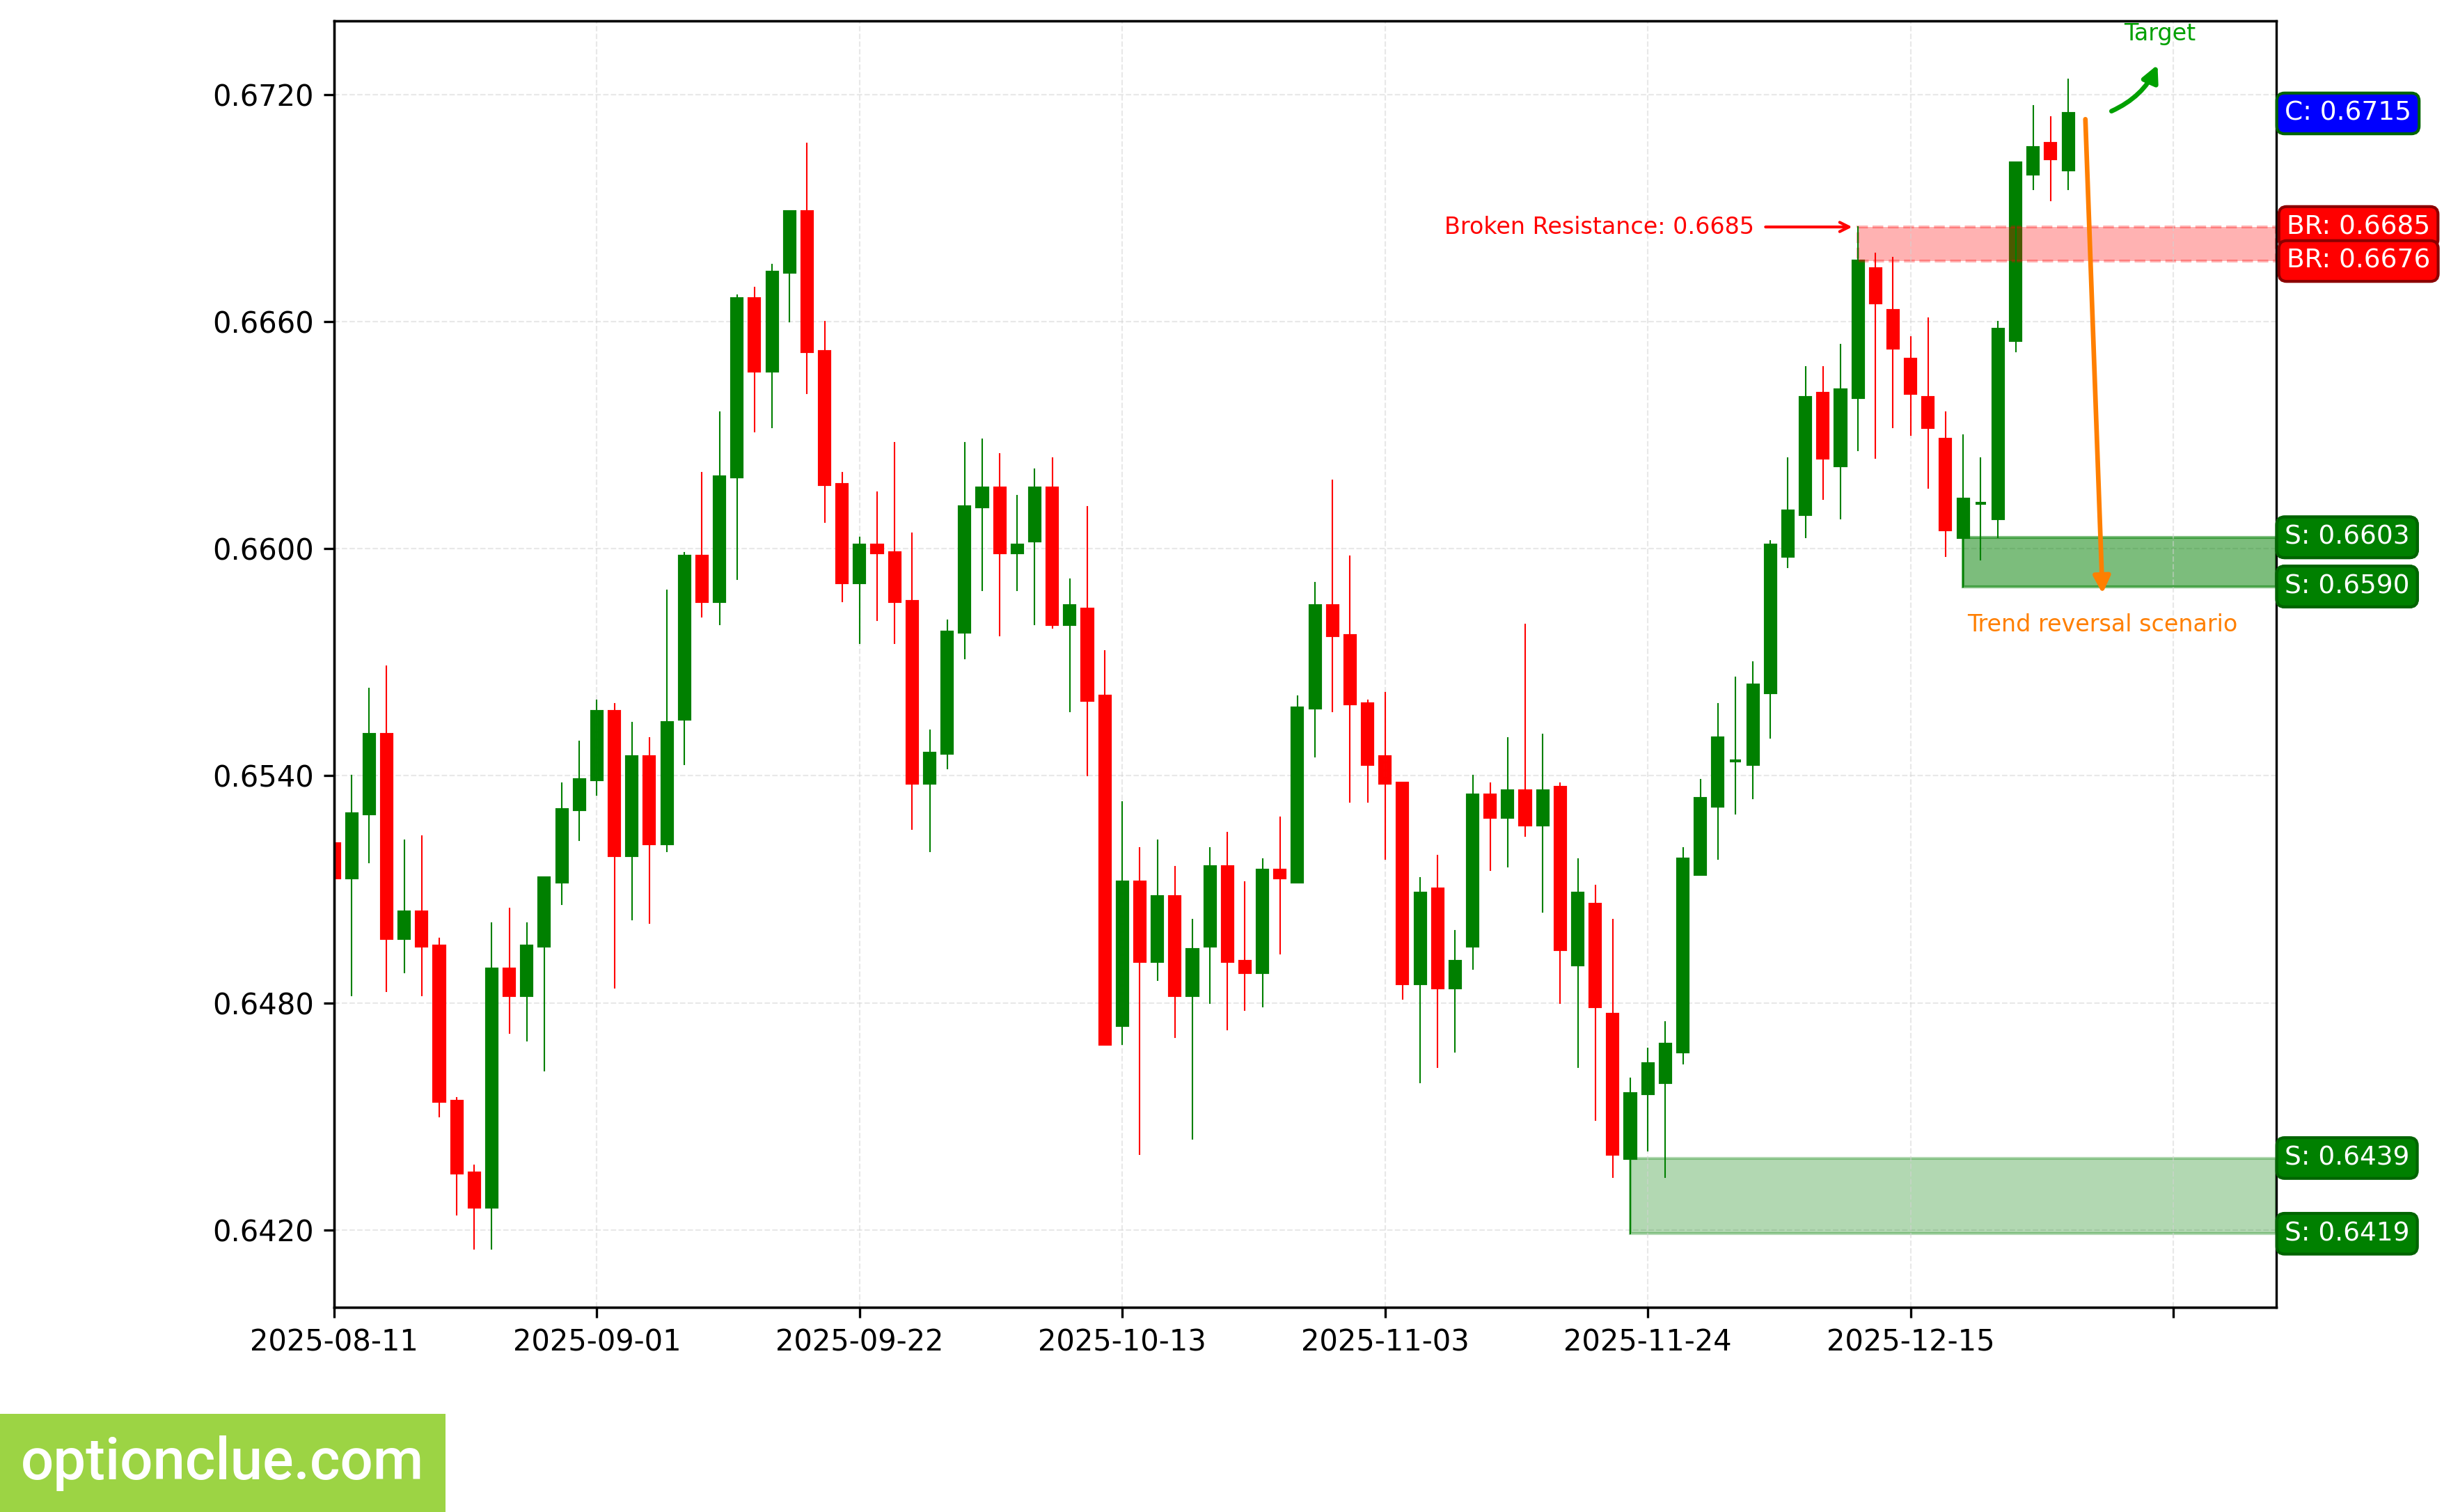
Bullish trend continues, a corrective wave is developing. An entry point for buying on rebound may form after the current correction completes. The last broken level is resistance (0.6676 — 0.6685). The breakout occurred 4 candlesticks ago.
Intermediate target for the upward movement is the resistance level with boundaries 0.6751 — 0.6759. In case of successful trend development, a farther target will be at the resistance level with boundaries 0.6915 — 0.6942.
If the correction completes near the support level (0.6590 — 0.6603), the potential profit/risk ratio may be approximately 2.9:1. When using a farther target — around 6:1. If the correction completes near the last broken level (0.6676 — 0.6685), the potential profit/risk ratio may be small (approximately 0.5:1). When selecting a farther target — approximately 1.7:1.
Long positions will remain relevant, as long as the market is above the nearest support level with boundaries 0.6590 — 0.6603. If the market successfully closes below this nearest support, the trend will reverse to the opposite (bearish).
AUDUSD. Technical analysis. D1.
Bitcoin (BTC)
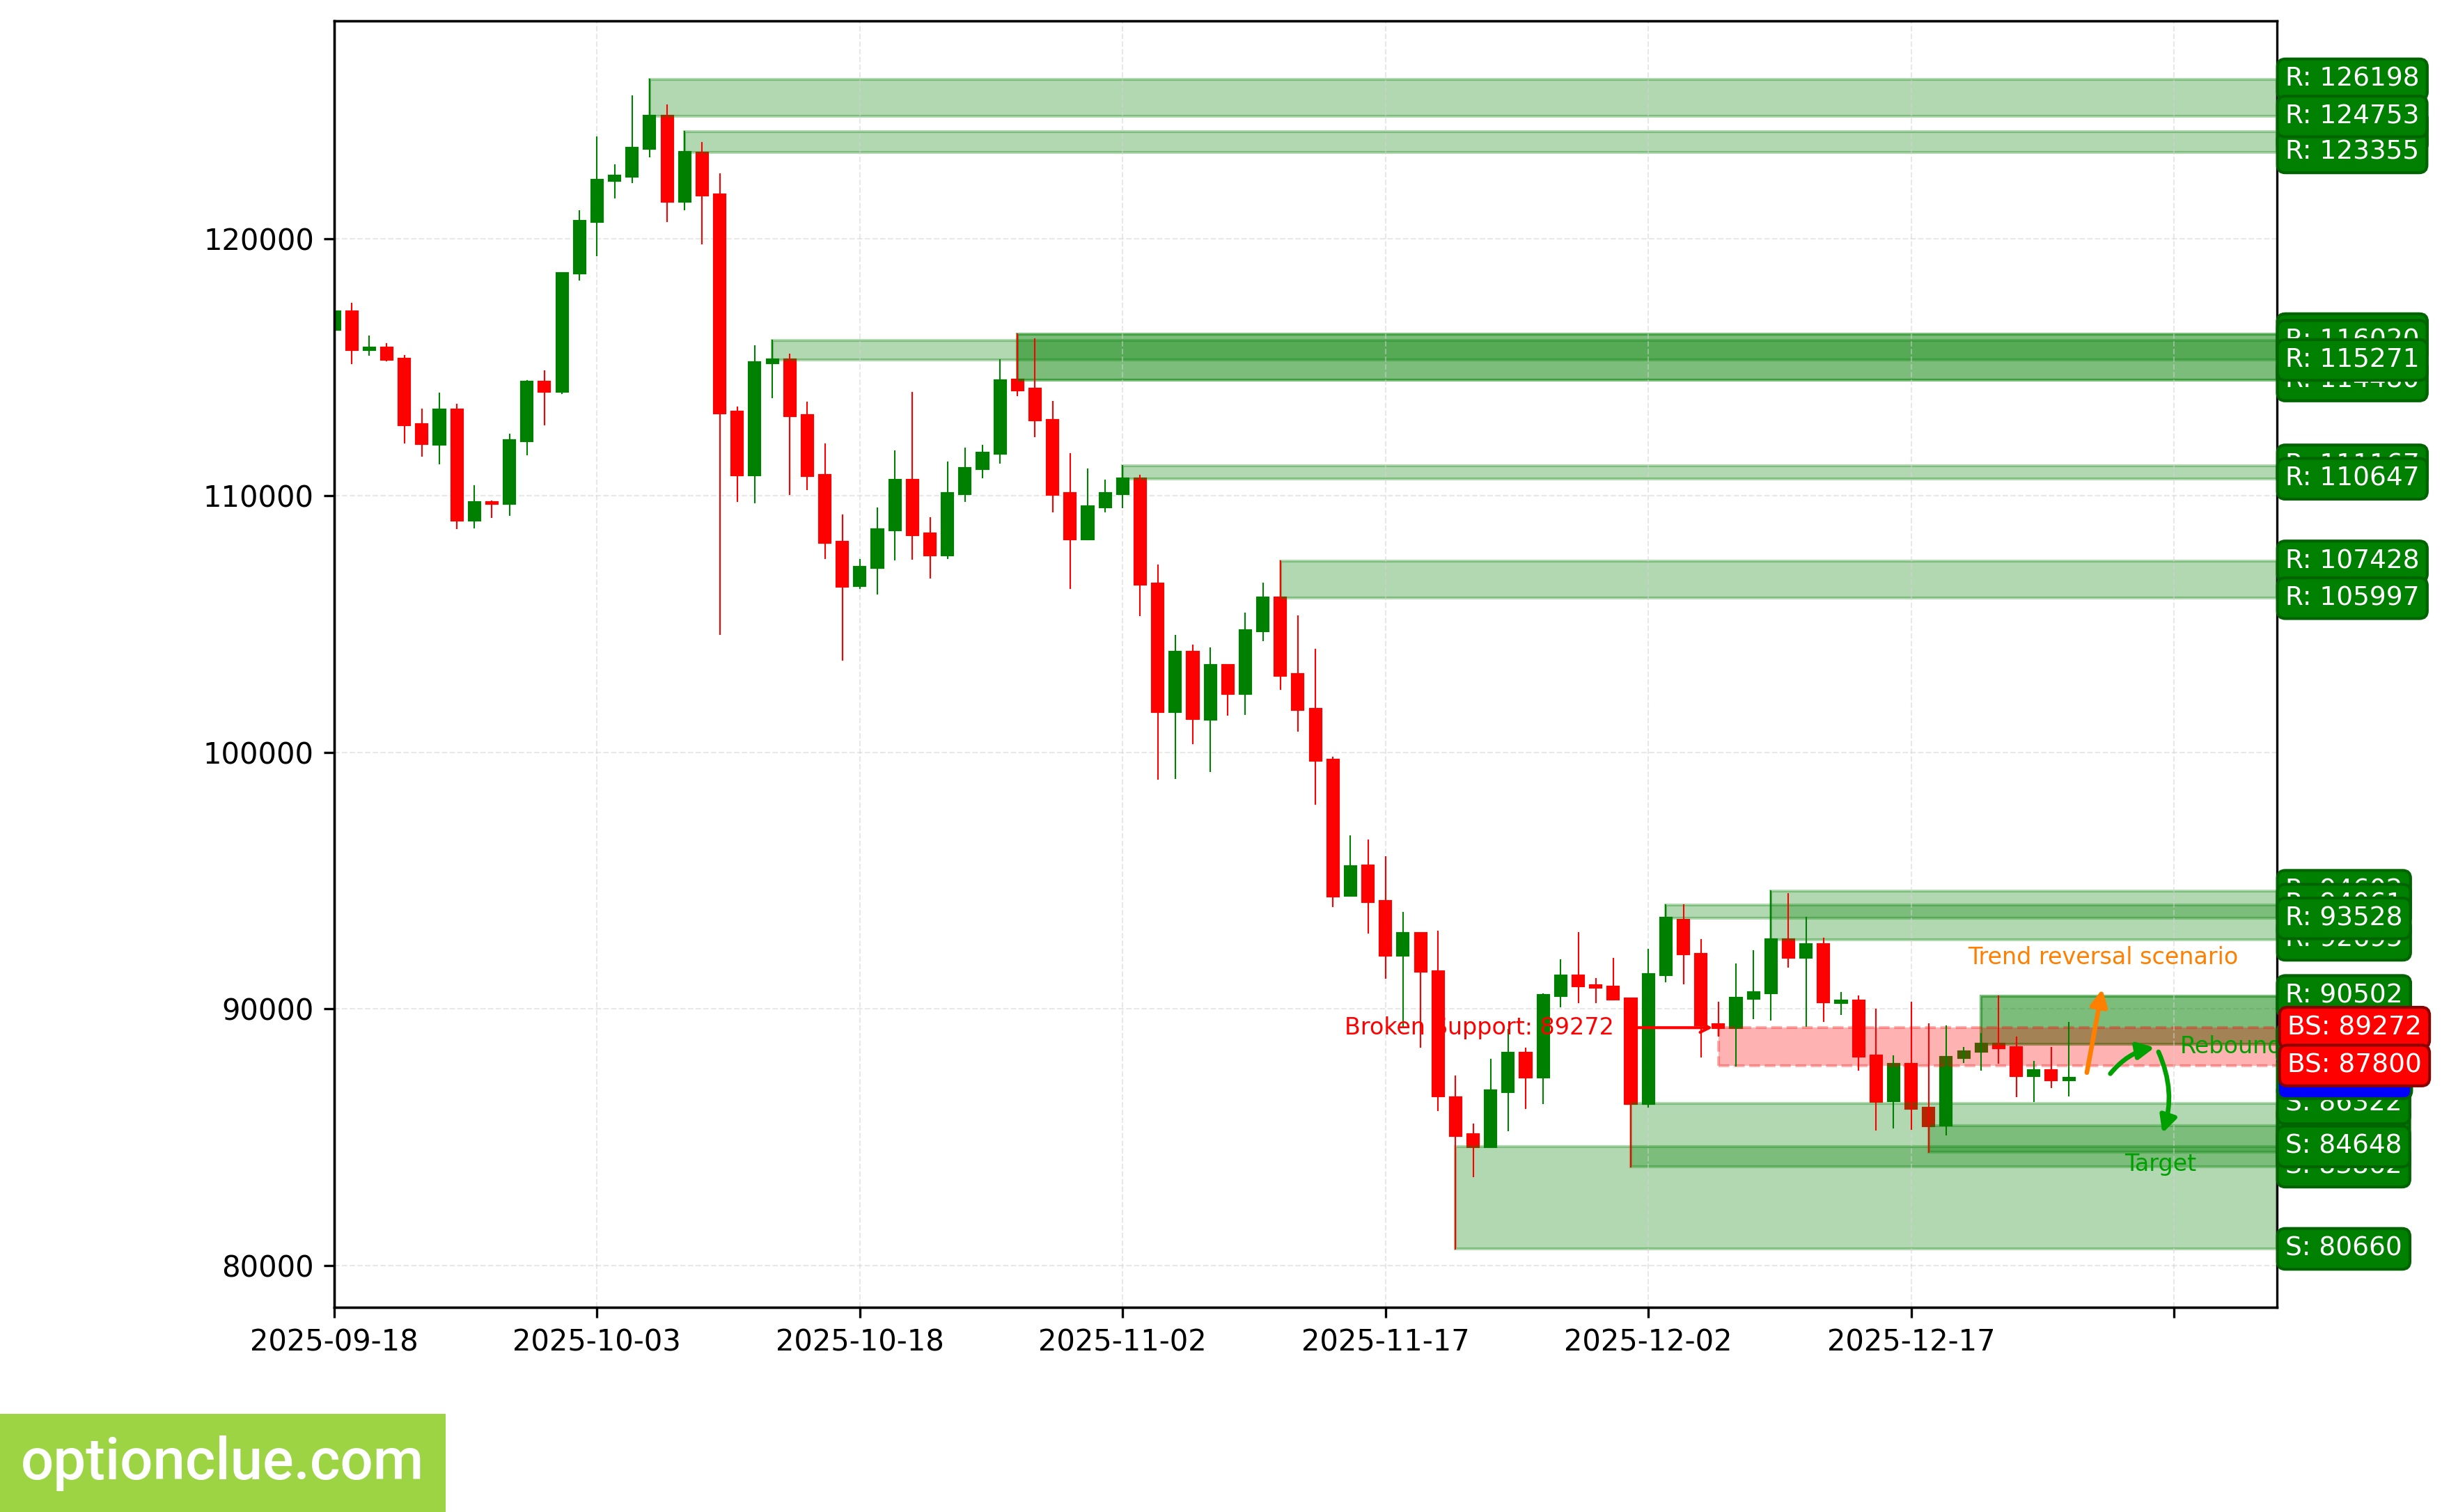
Bearish trend continues, a corrective wave is developing again. An entry point for selling on rebound may form after the current correction completes. The last broken level is support (87800 — 89272). The breakout occurred 12 candlesticks ago.
Intermediate target for the downward movement is the support level with boundaries 84436 — 85463. In case of successful trend development, a farther target will be at the support level with boundaries 74437 — 76272.
If the correction completes near the resistance level (88622 — 90502), the potential profit/risk ratio may be slightly more than 1:1. When using a farther target — more than 3:1. If the correction completes near the last broken level (87800 — 89272), the potential profit/risk ratio may be insignificant (around 0.6:1). When assessing a farther target — more than 2:1.
Short positions will remain relevant, as long as the market remains below the nearest resistance level with boundaries 88622 — 90502. If the market successfully closes above this nearest resistance, the trend will reverse to the opposite (bullish).
BTC. Technical analysis. D1.
Ether (ETH)
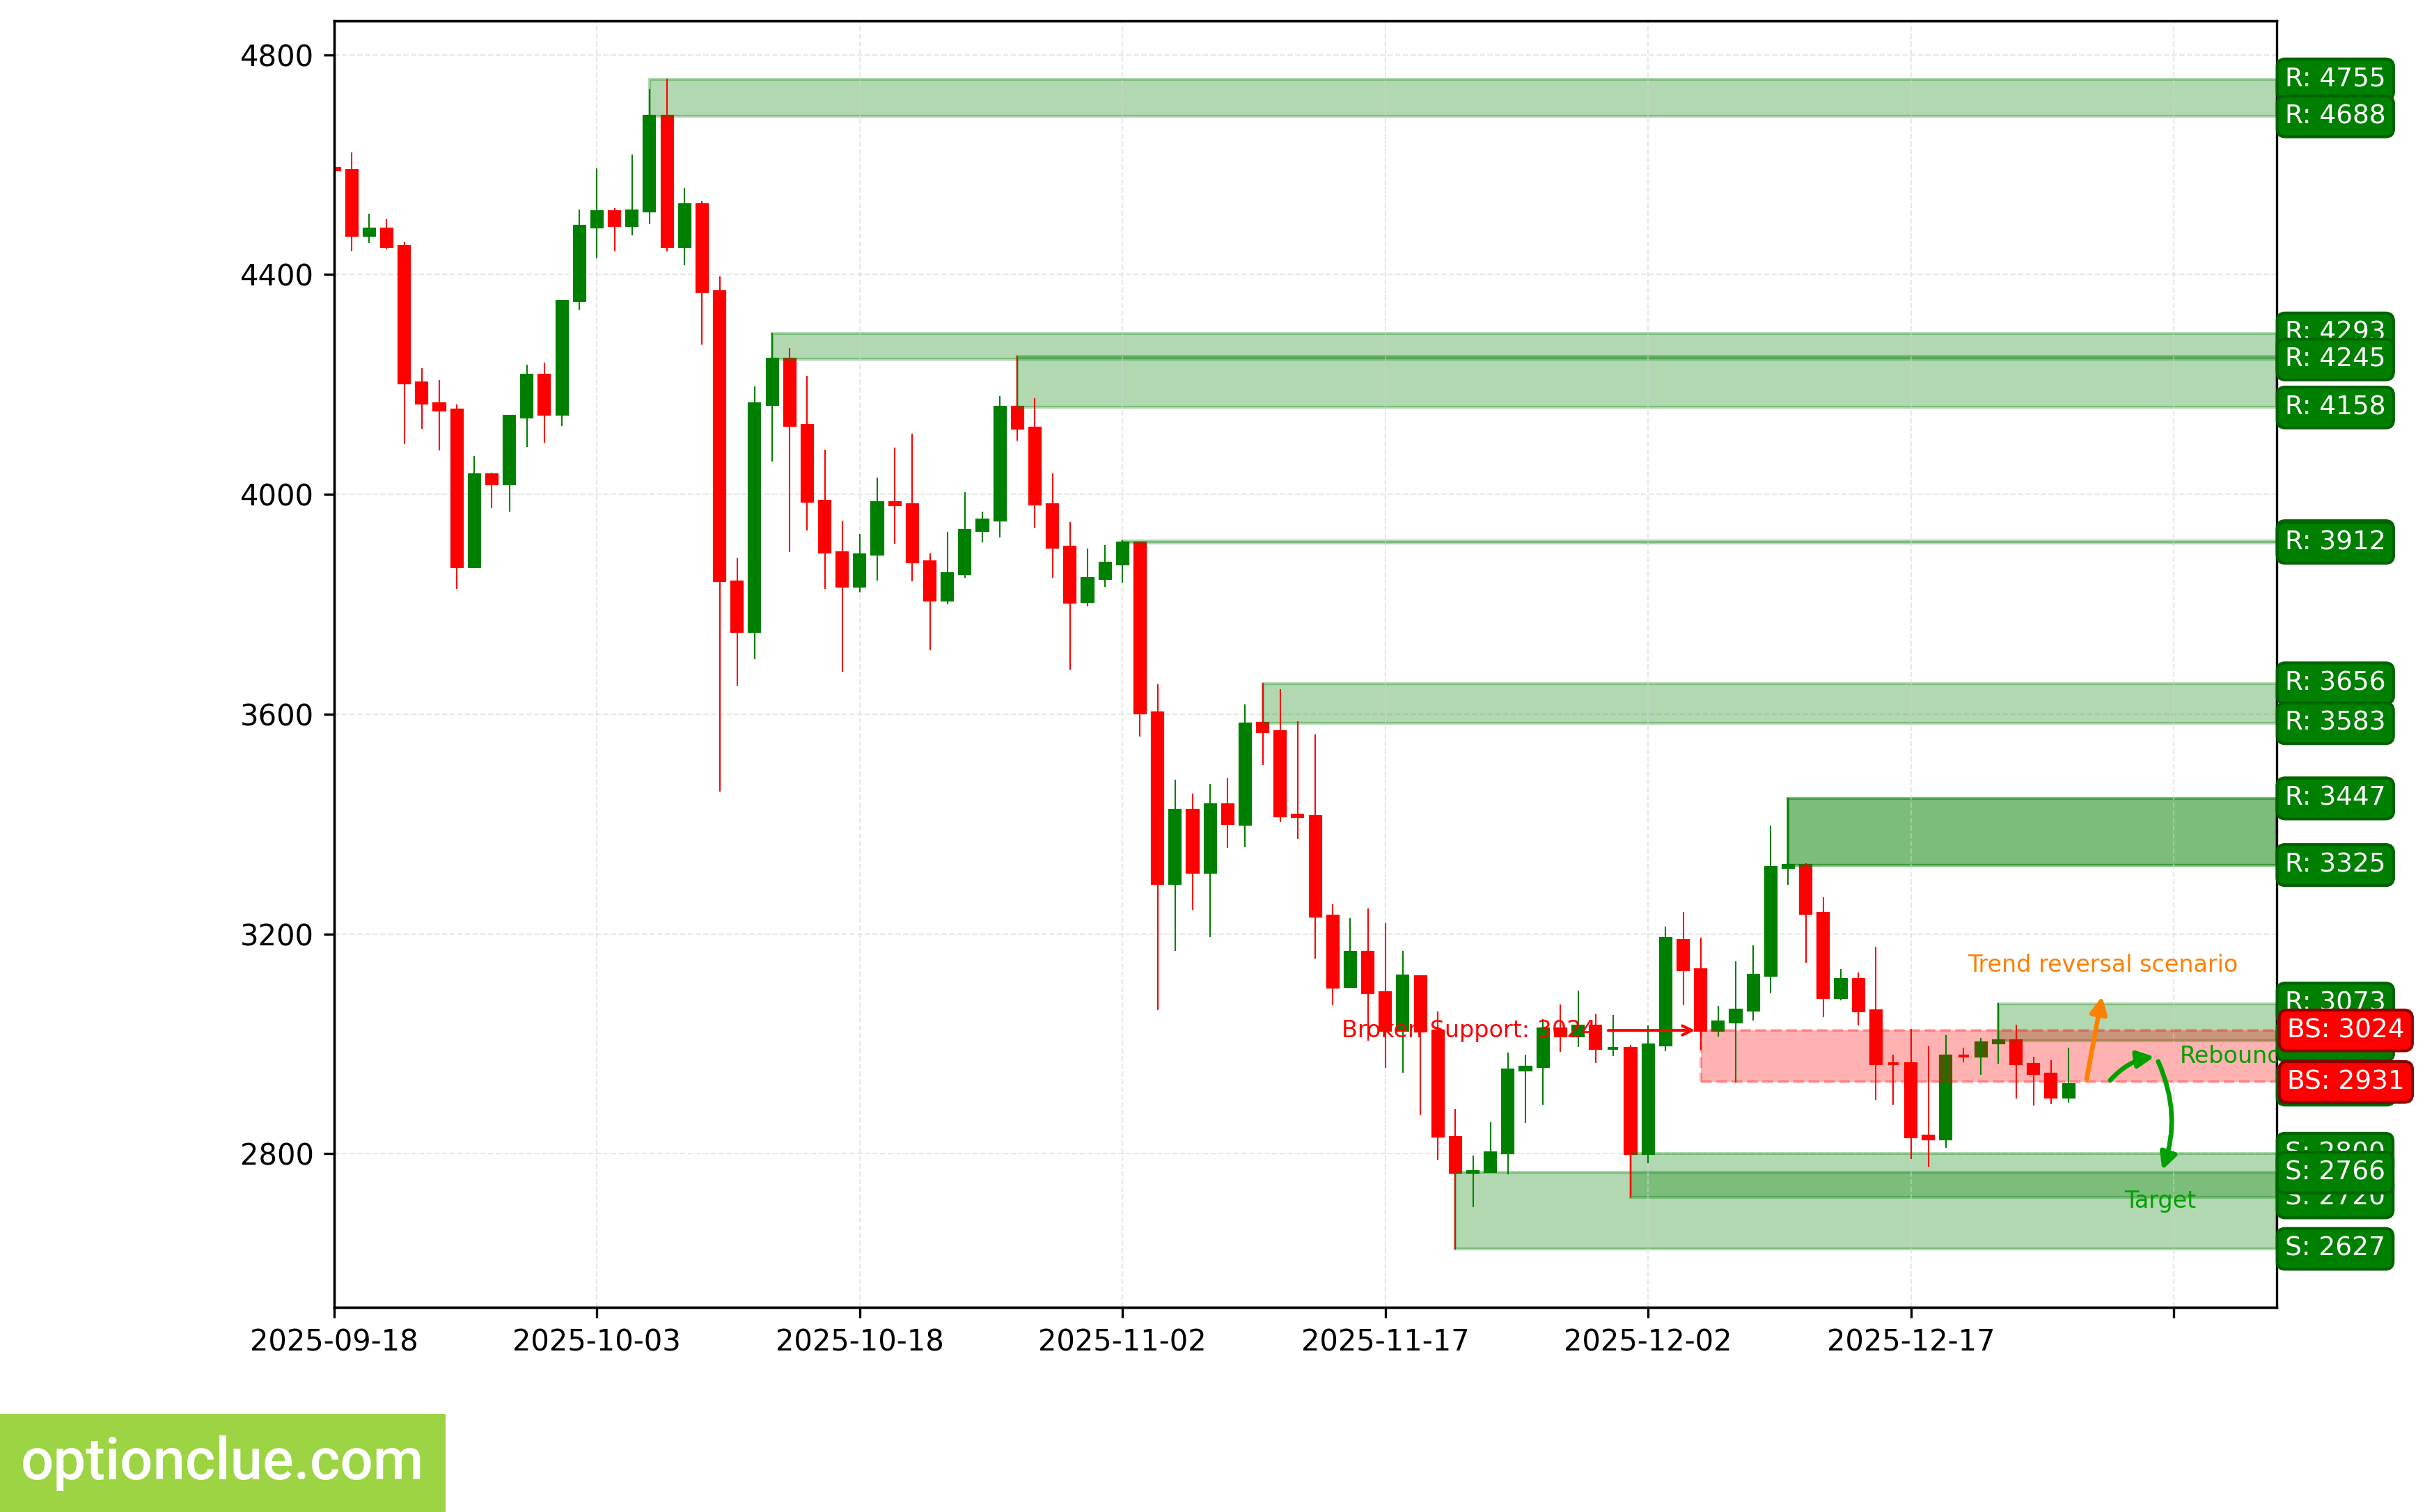
Bearish trend continues, 4 candlesticks ago the correction completed and an entry point for selling on rebound formed, an impulse wave is developing. The last broken level is support (2931 — 3024). The breakout occurred 10 candlesticks ago.
Intermediate target for the downward movement is the support level with boundaries 2720 — 2800. In case of successful trend development, a farther target will be at the support level with boundaries 2476 — 2508.
If the correction completes near the resistance level (3006 — 3073), the potential profit/risk ratio may be approximately 1.5:1. When using a farther target — around 3:1.
Short positions will remain relevant, as long as the market remains below the nearest resistance level with boundaries 3006 — 3073. If the market successfully closes above this nearest resistance, the trend will reverse to the opposite (bullish).
ETH. Technical analysis. D1.
Apple Inc (AAPL)
Bullish trend continues, 3 candlesticks ago the correction completed and an entry point for buying on rebound formed, an impulse wave is developing. The last broken level is resistance (275.25 — 276.70). The breakout occurred 22 candlesticks ago.
Nearest target for the upward movement is the resistance level with boundaries 286.20 — 288.62.
Long positions will remain relevant, as long as the market is above the nearest support level with boundaries 269.56 — 270.84. If the market successfully closes below this support, the trend will reverse to the opposite (bearish).
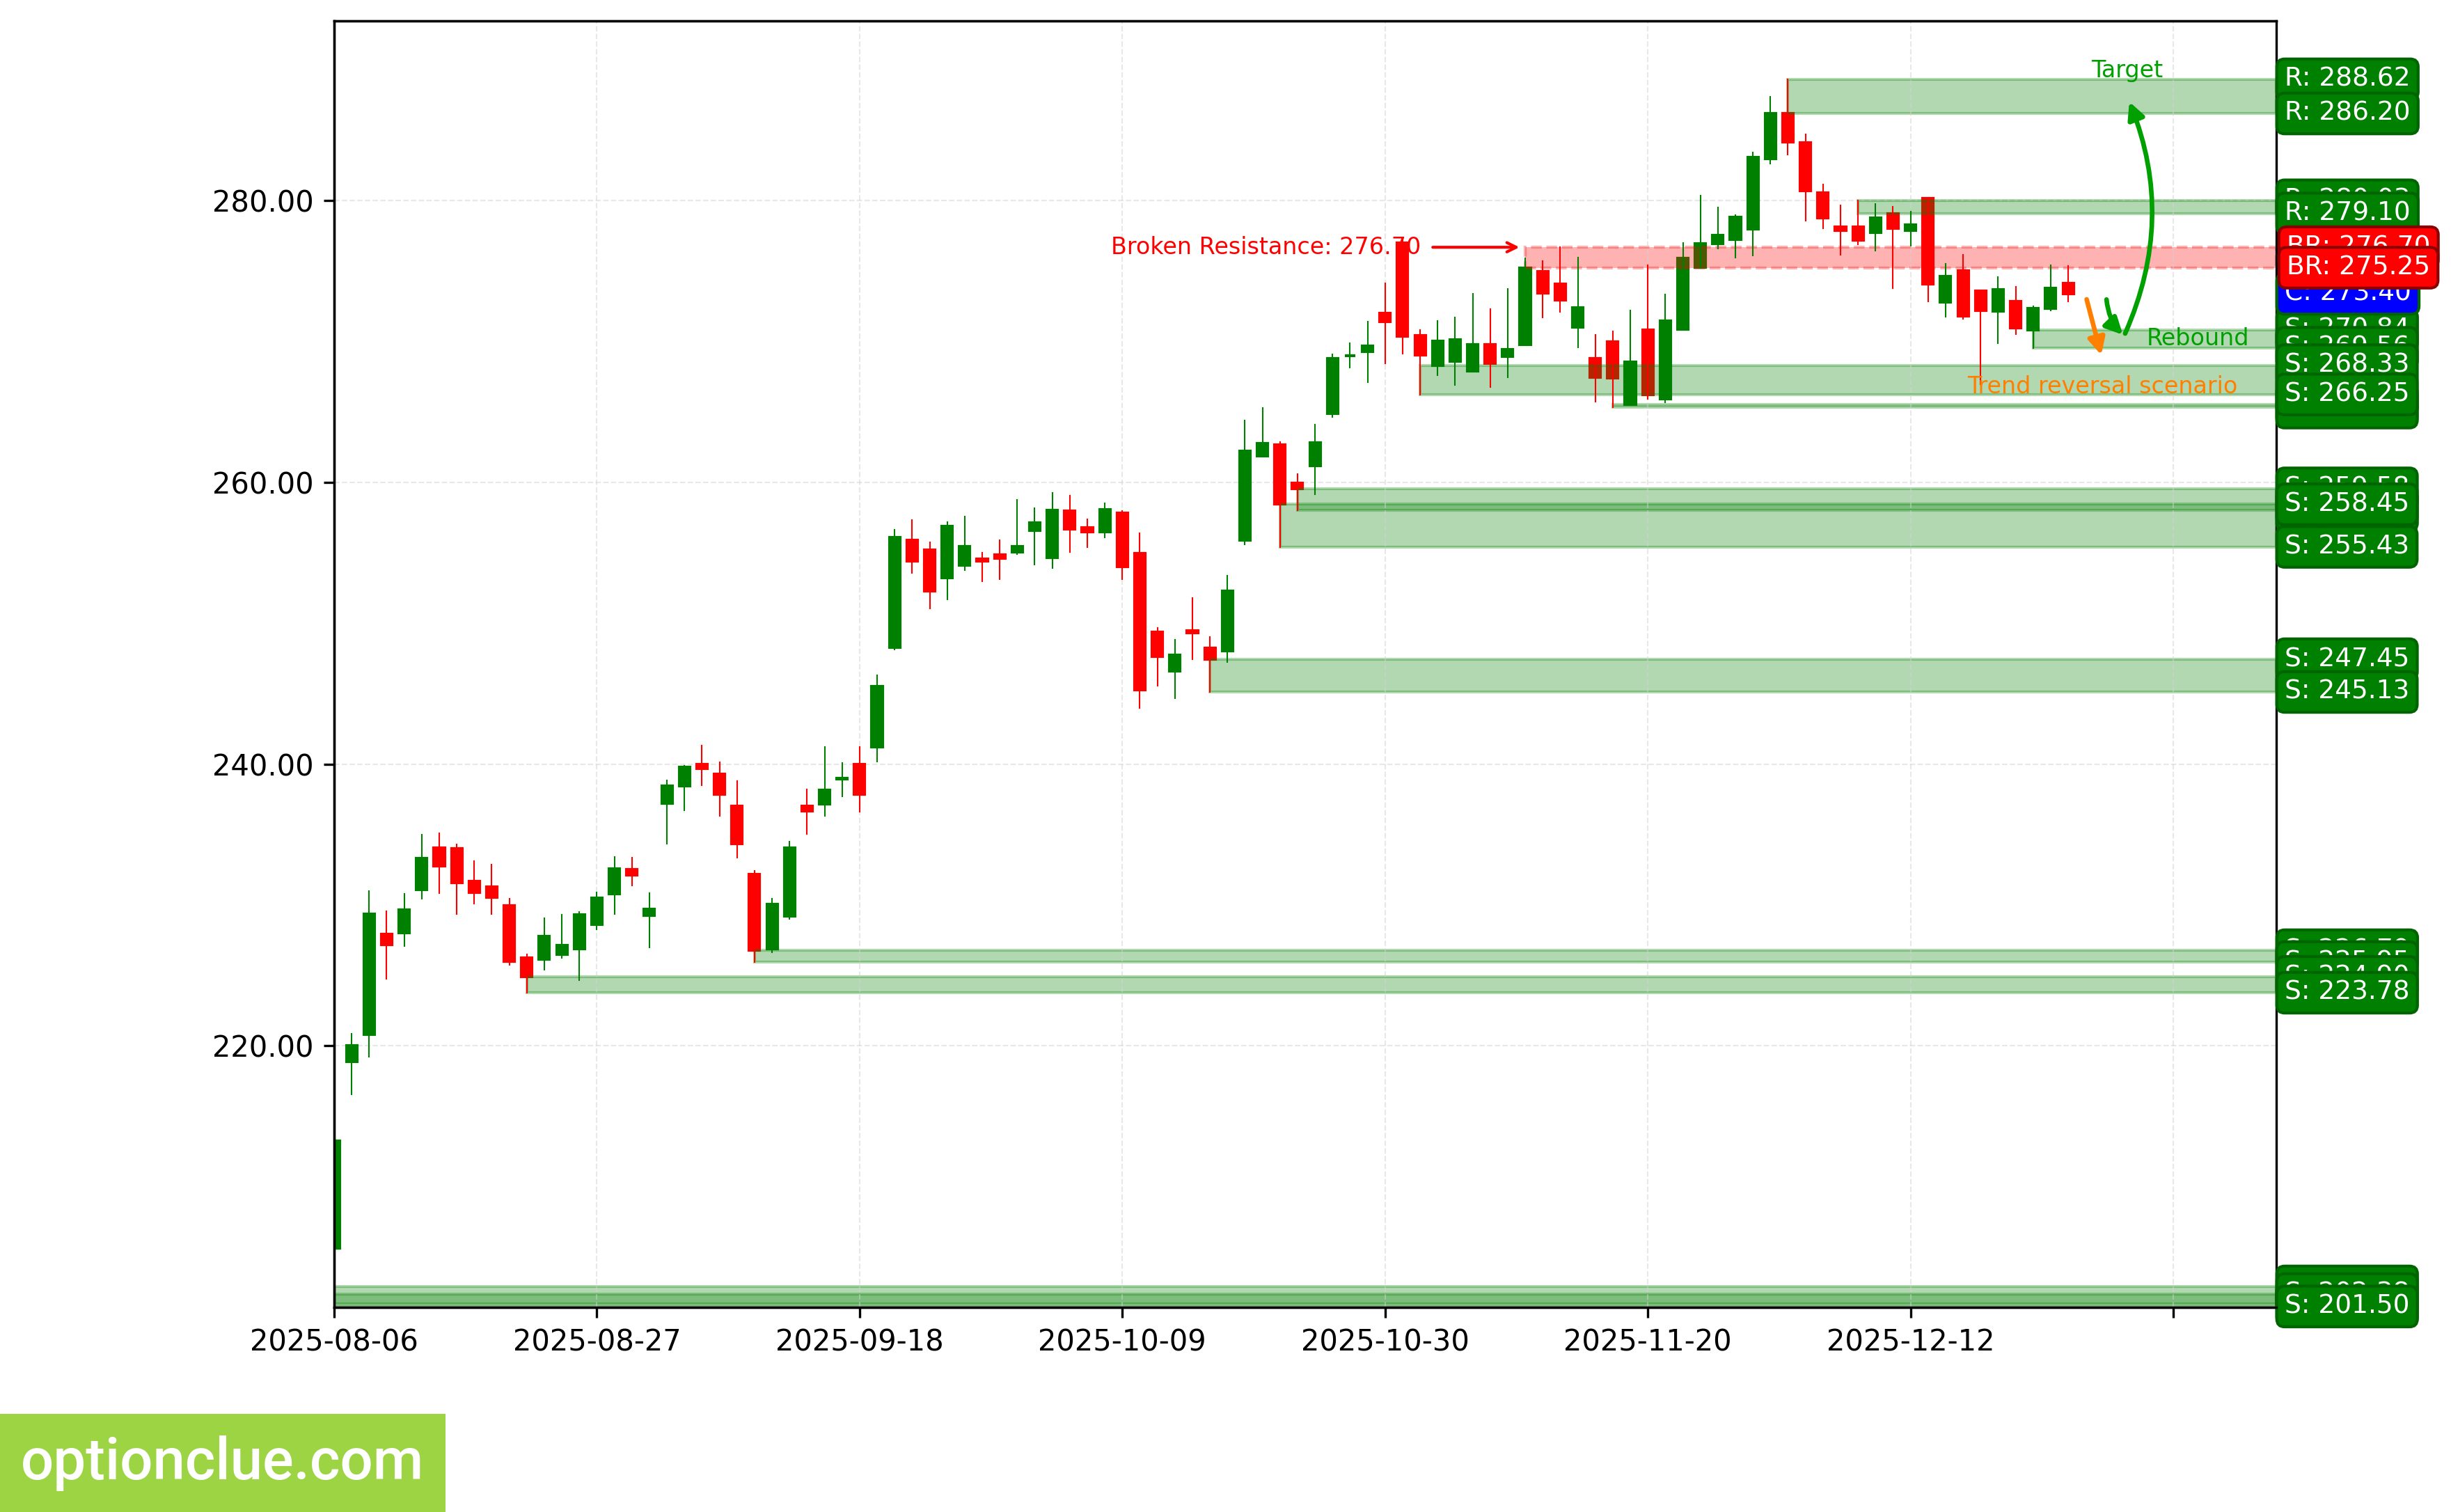
AAPL. Technical analysis. D1.
NVIDIA Corp (NVDA)
Trend has turned bullish, when last week the resistance level (185.56 — 188.00) was broken. The breakout occurred 3 candlesticks ago. An impulse wave is developing.
Intermediate target for the upward movement is the resistance level with boundaries 199.05 — 199.94. In case of successful trend development, a farther target will be at the resistance level with boundaries 208.08 — 211.34.
The potential profit/risk ratio from current prices when setting targets and fixing risks according to daily timeframe levels may be small (around 0.3:1). When using a farther target — also small (approximately 0.7:1). If the correction completes near the support level (170.31 — 170.94), the potential profit/risk ratio may be approximately 5:1. For a farther target — around 7:1. If the correction completes near the last broken level (185.56 — 188.00), the potential profit/risk ratio may be insignificant (around 0.6:1). When selecting a farther target — around 1:1.
Long positions will remain relevant, as long as the market remains above the nearest support level with boundaries 170.31 — 170.94. If the market successfully closes below this support, the trend will reverse to the opposite (bearish).
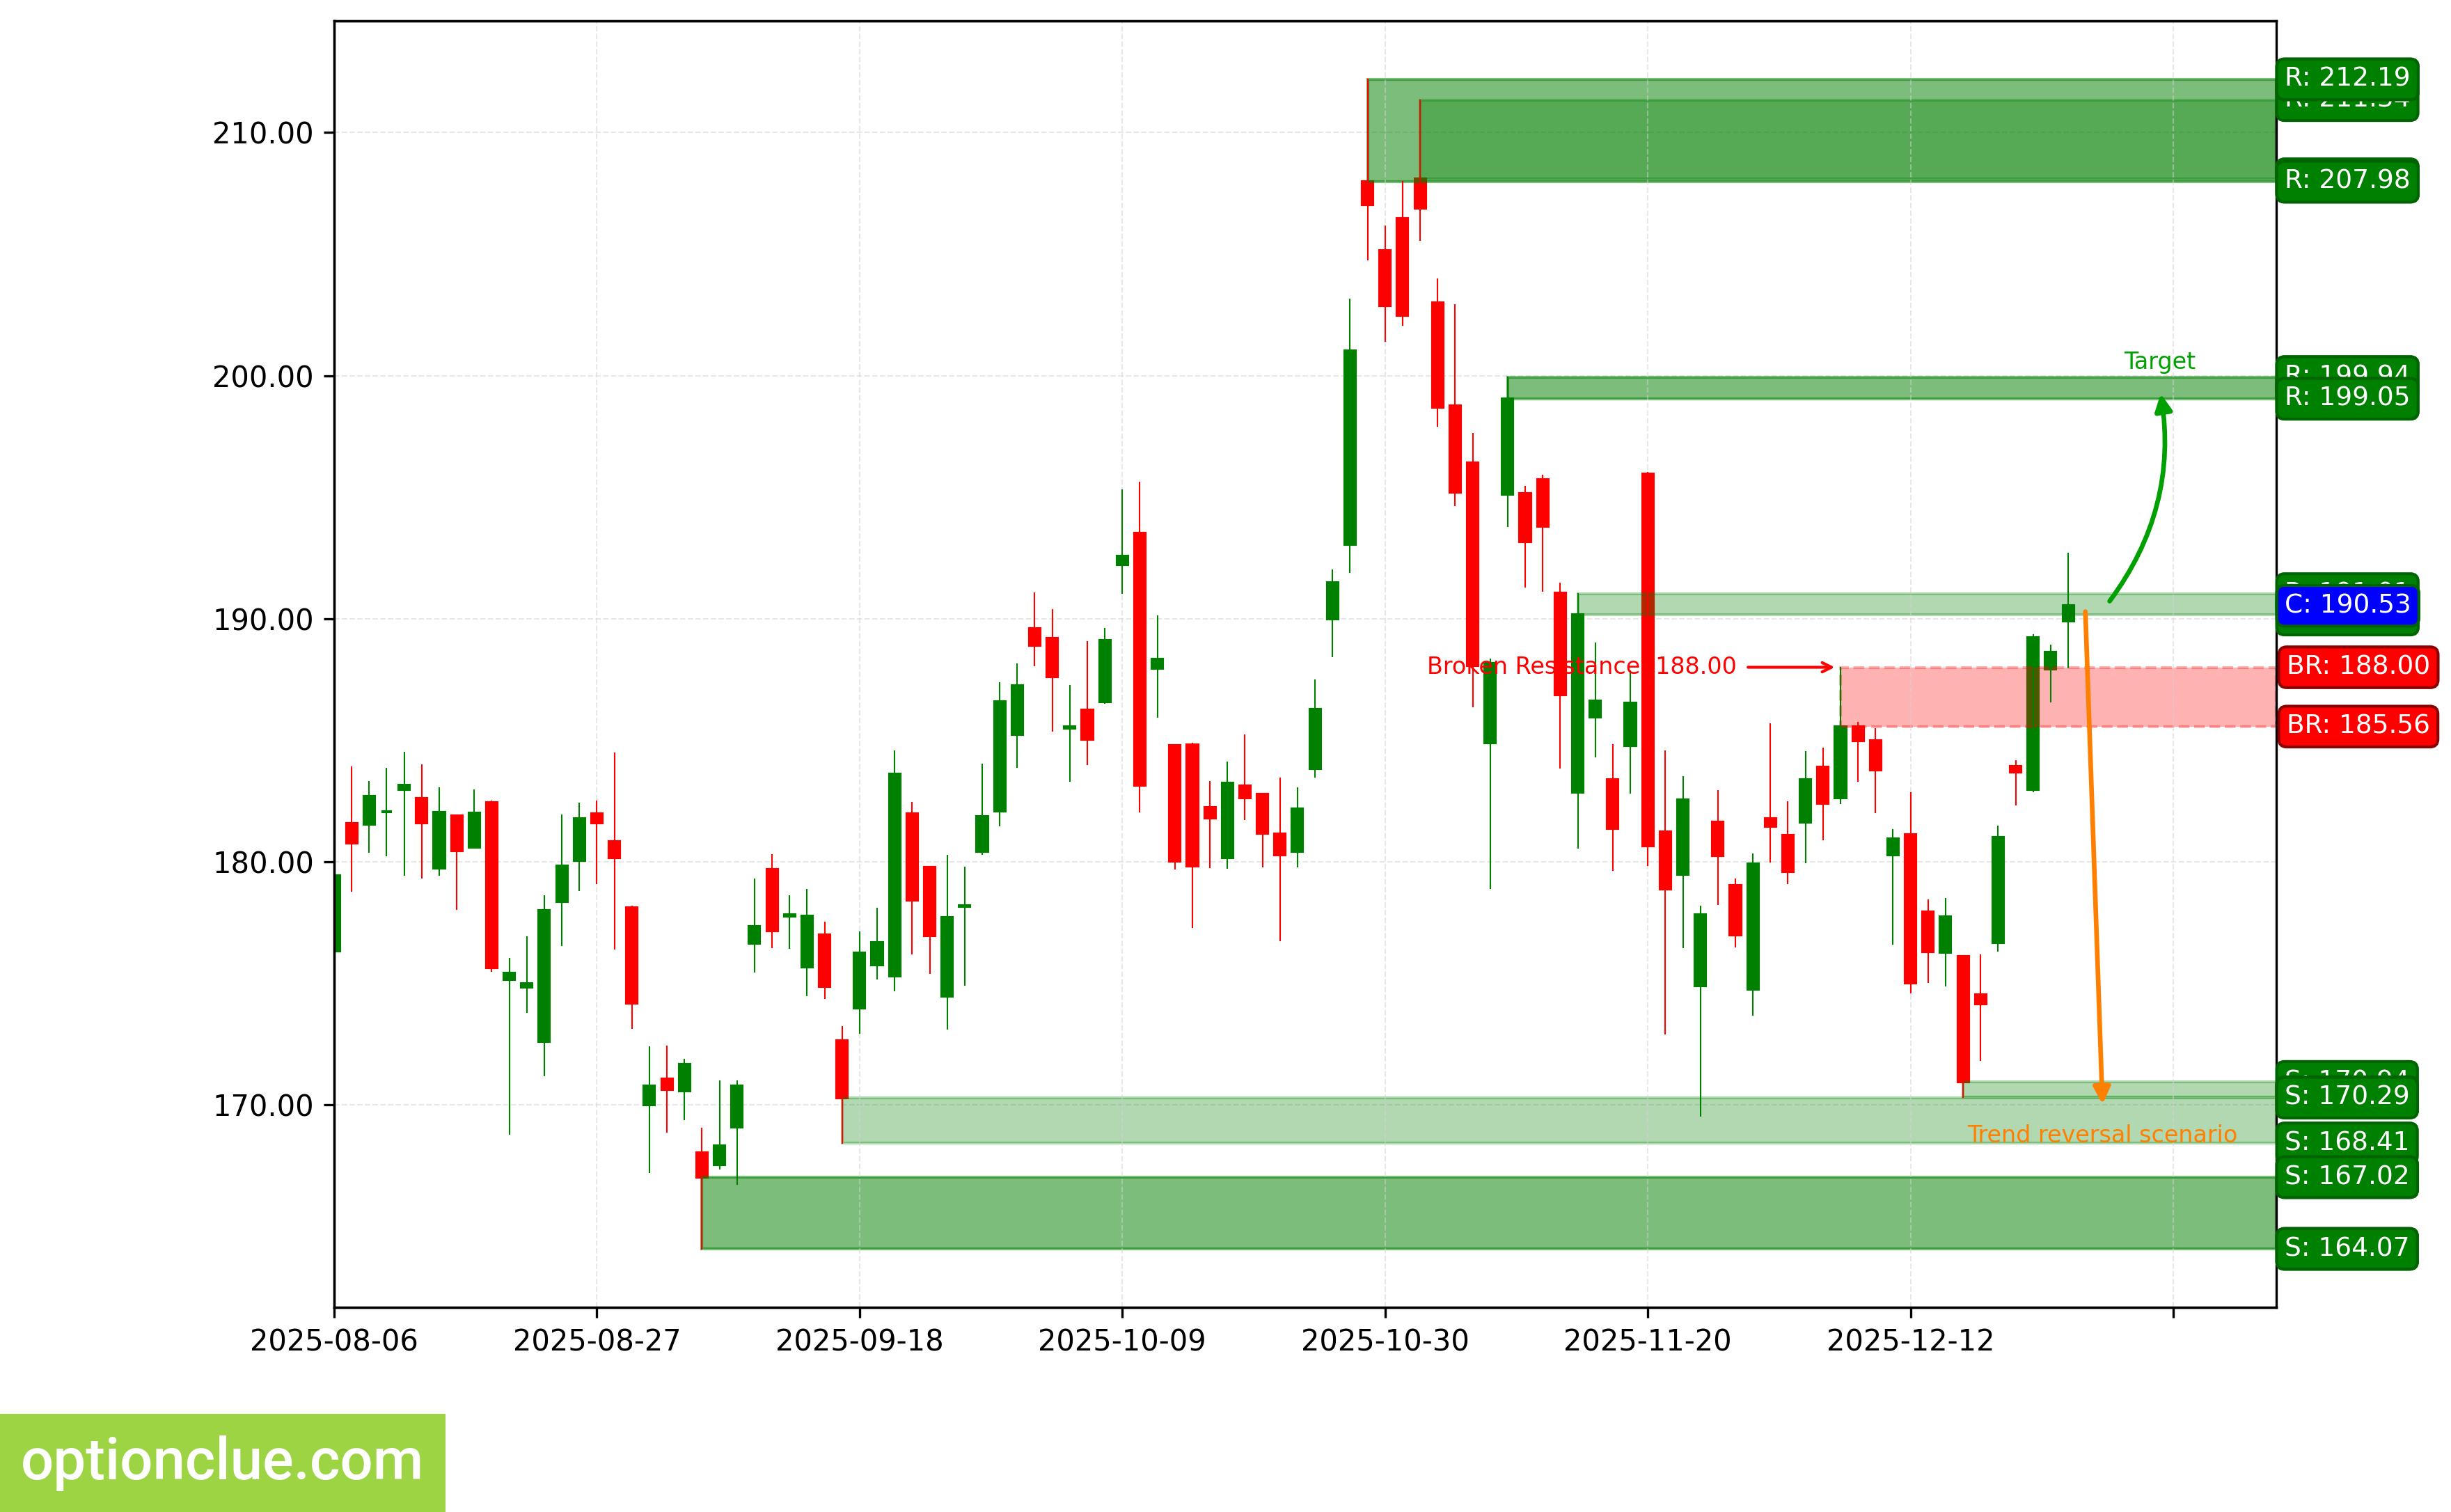
NVDA. Technical analysis. D1.
Tesla Inc (TSLA)
Bullish trend continues, after a weak impulse a corrective wave is developing again. An entry point for buying on rebound may form after the current correction completes. The last broken level is resistance (442.15 — 442.49).
Upon resumption of the upward movement, the intermediate target will be the nearest resistance level. In case of successful trend development, a farther target will be at the next resistance level.
Long positions will remain relevant, as long as the market is above the nearest support level with boundaries 465.83 — 467.26. If the market successfully closes below this support, the trend will reverse to the opposite (bearish).
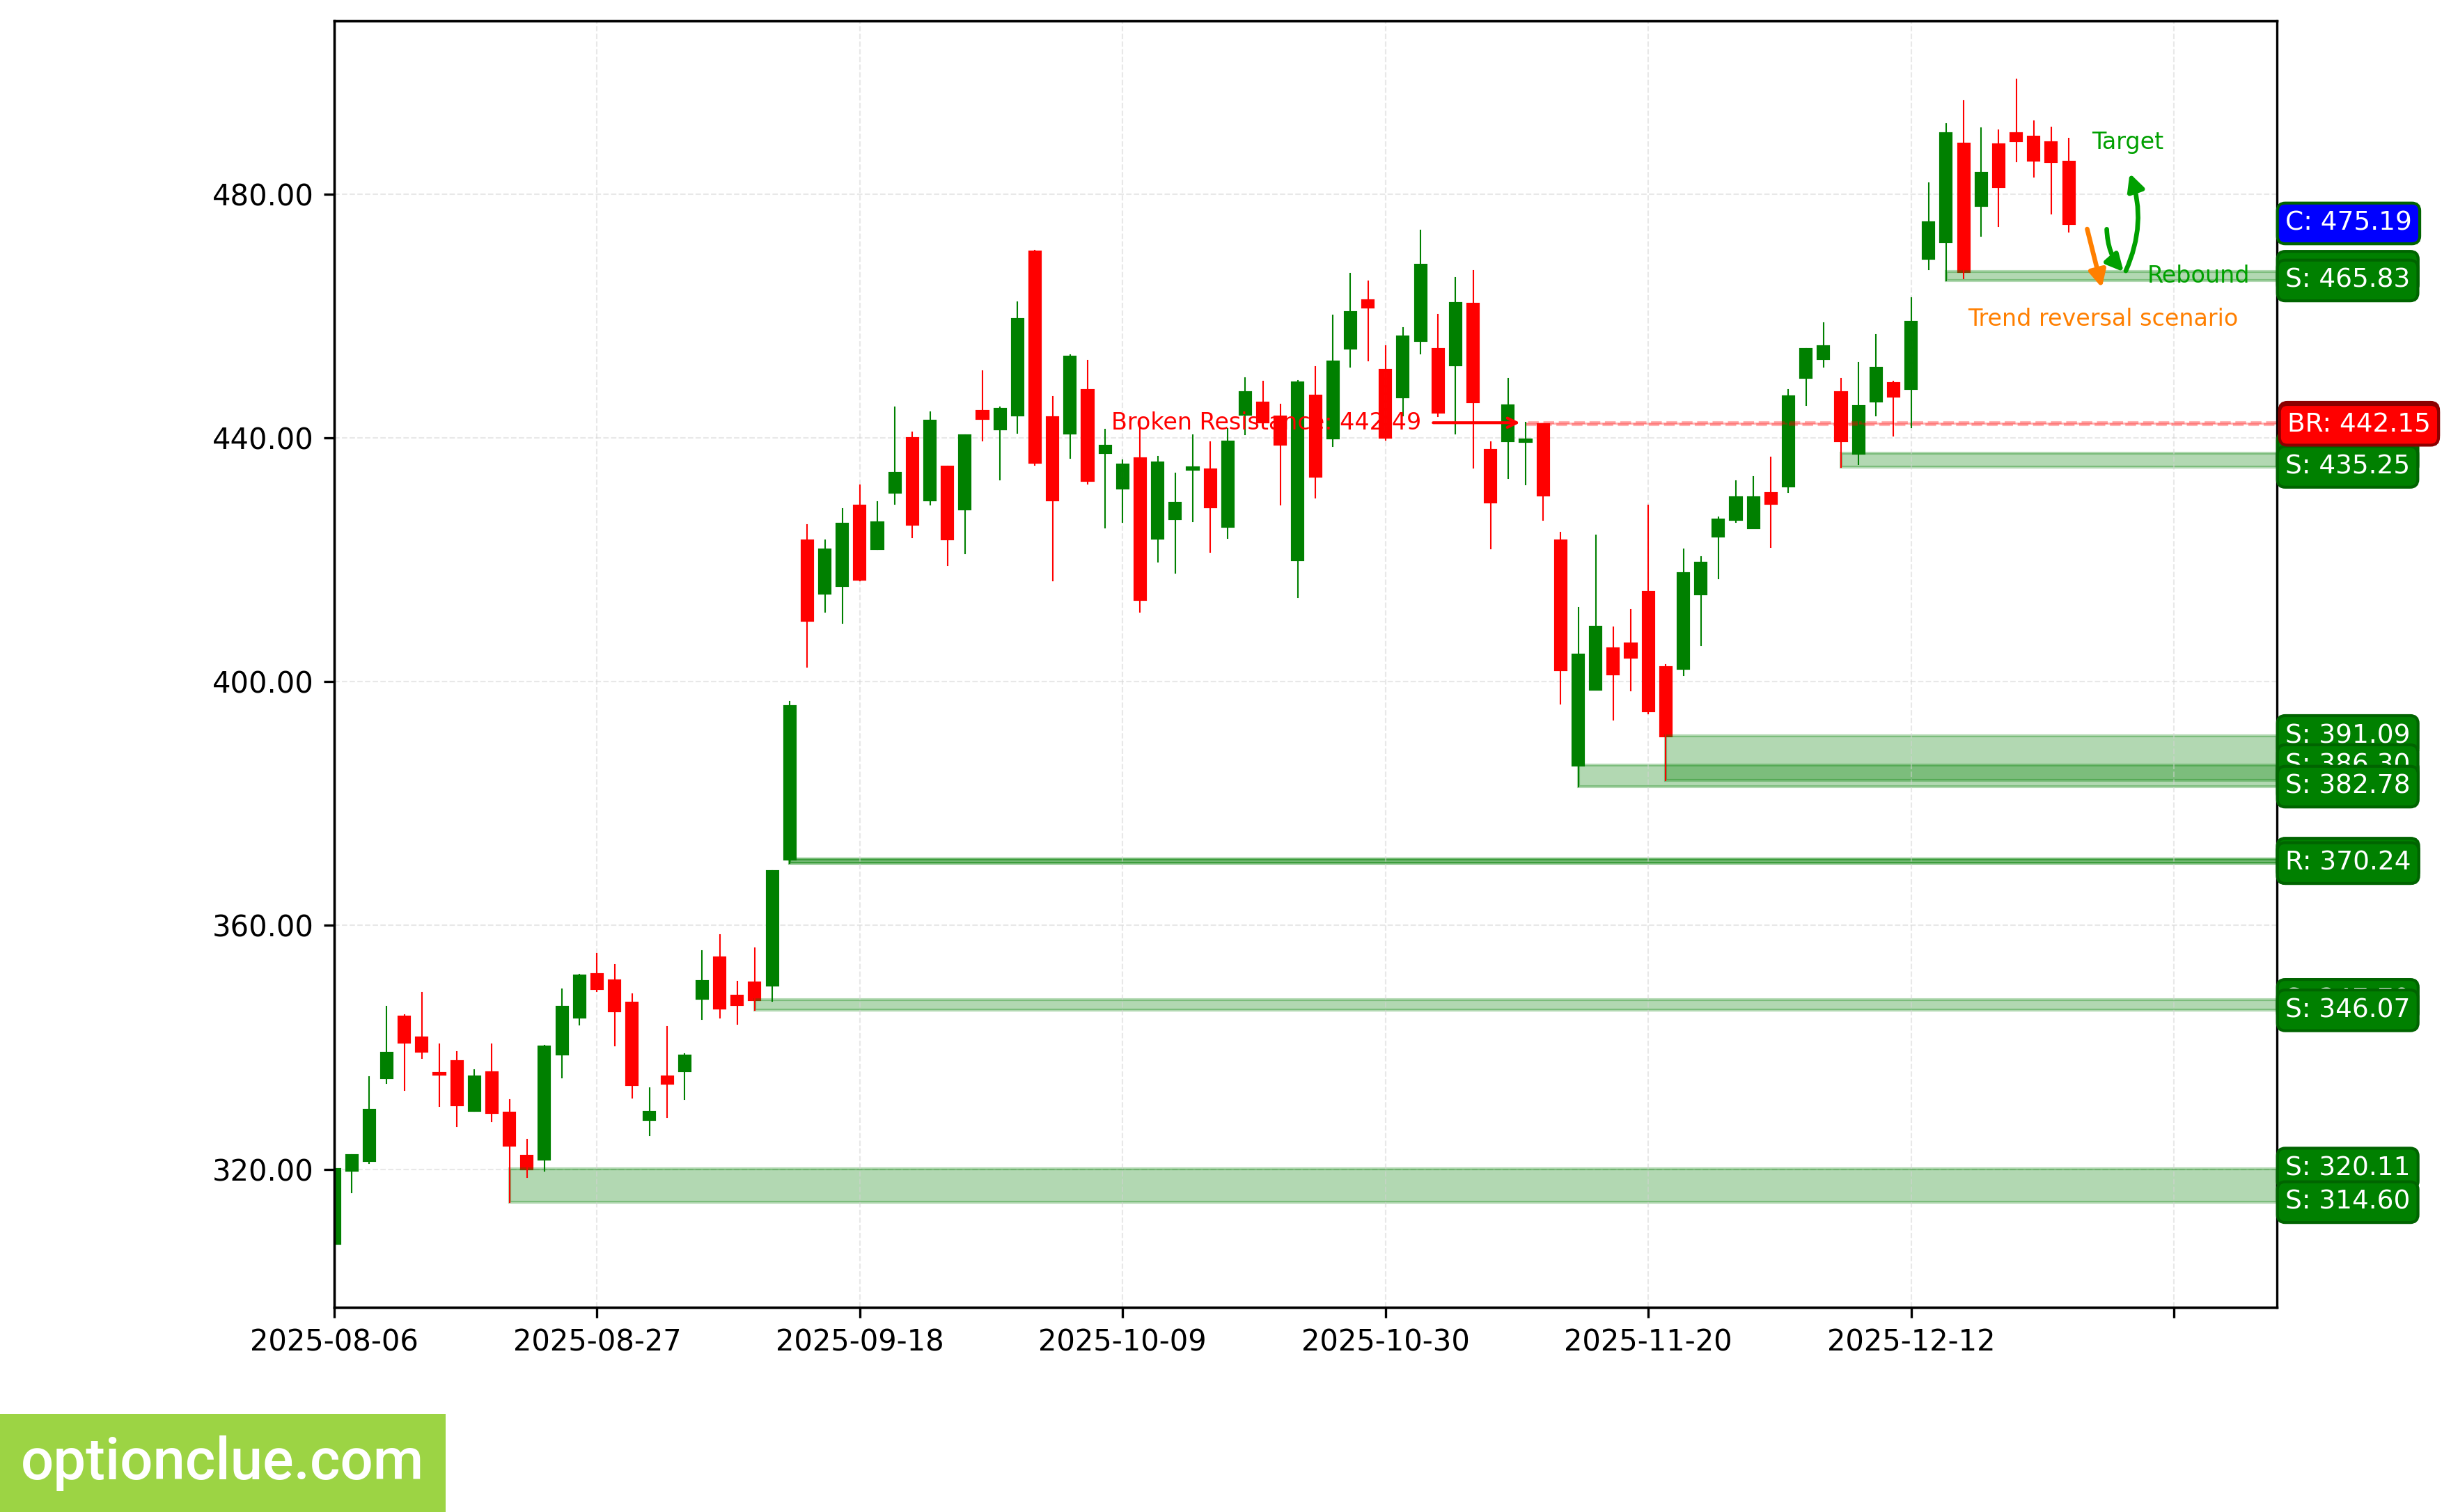
TSLA. Technical analysis. D1.
Summary
From the perspective of medium-term trading, financial instruments with correction close to completion on Daily and/or potentially the most promising profit-to-risk ratios include: EURUSD, GBPUSD, USDCHF, AAPL, TSLA. In the near future, they may be worth attention depending on the depth of market correction: USDCAD, AUDUSD.
The remaining financial instruments may also be interesting, but on these markets rebound signals on Daily are likely to appear no earlier than in a week.