
Analyzing the markets using technical analysis. We focus on key horizontal support and resistance levels.
Key Topics
- Euro (EURUSD)
- British Pound (GBPUSD)
- Swiss Franc (USDCHF)
- Japanese Yen (USDJPY)
- Canadian Dollar (USDCAD)
- Australian Dollar (AUDUSD)
- New Zealand Dollar (NZDUSD)
- Bitcoin (BTC)
- Ether (ETH)
- Apple Inc (AAPL)
- NVIDIA Corp (NVDA)
- Tesla Inc (TSLA)
- Summary
Euro (EURUSD)
The trend changed to bearish when the support level (1.1725 — 1.1744) was broken last week.
A correction is forming on the daily timeframe. A sell entry point on a rebound may appear after its completion.
If it completes near the last broken level, the potential reward/risk ratio could be around 1-1.5. If the downward movement resumes, the first target will be the support level with boundaries at 1.1606 — 1.1638.
If the trend develops successfully, a more distant target will be near the support level 1.1573 — 1.1618. Short positions will remain relevant as long as the market stays below the nearest resistance level with boundaries at 1.1815 — 1.1819.
A break above this level would signal a trend reversal.
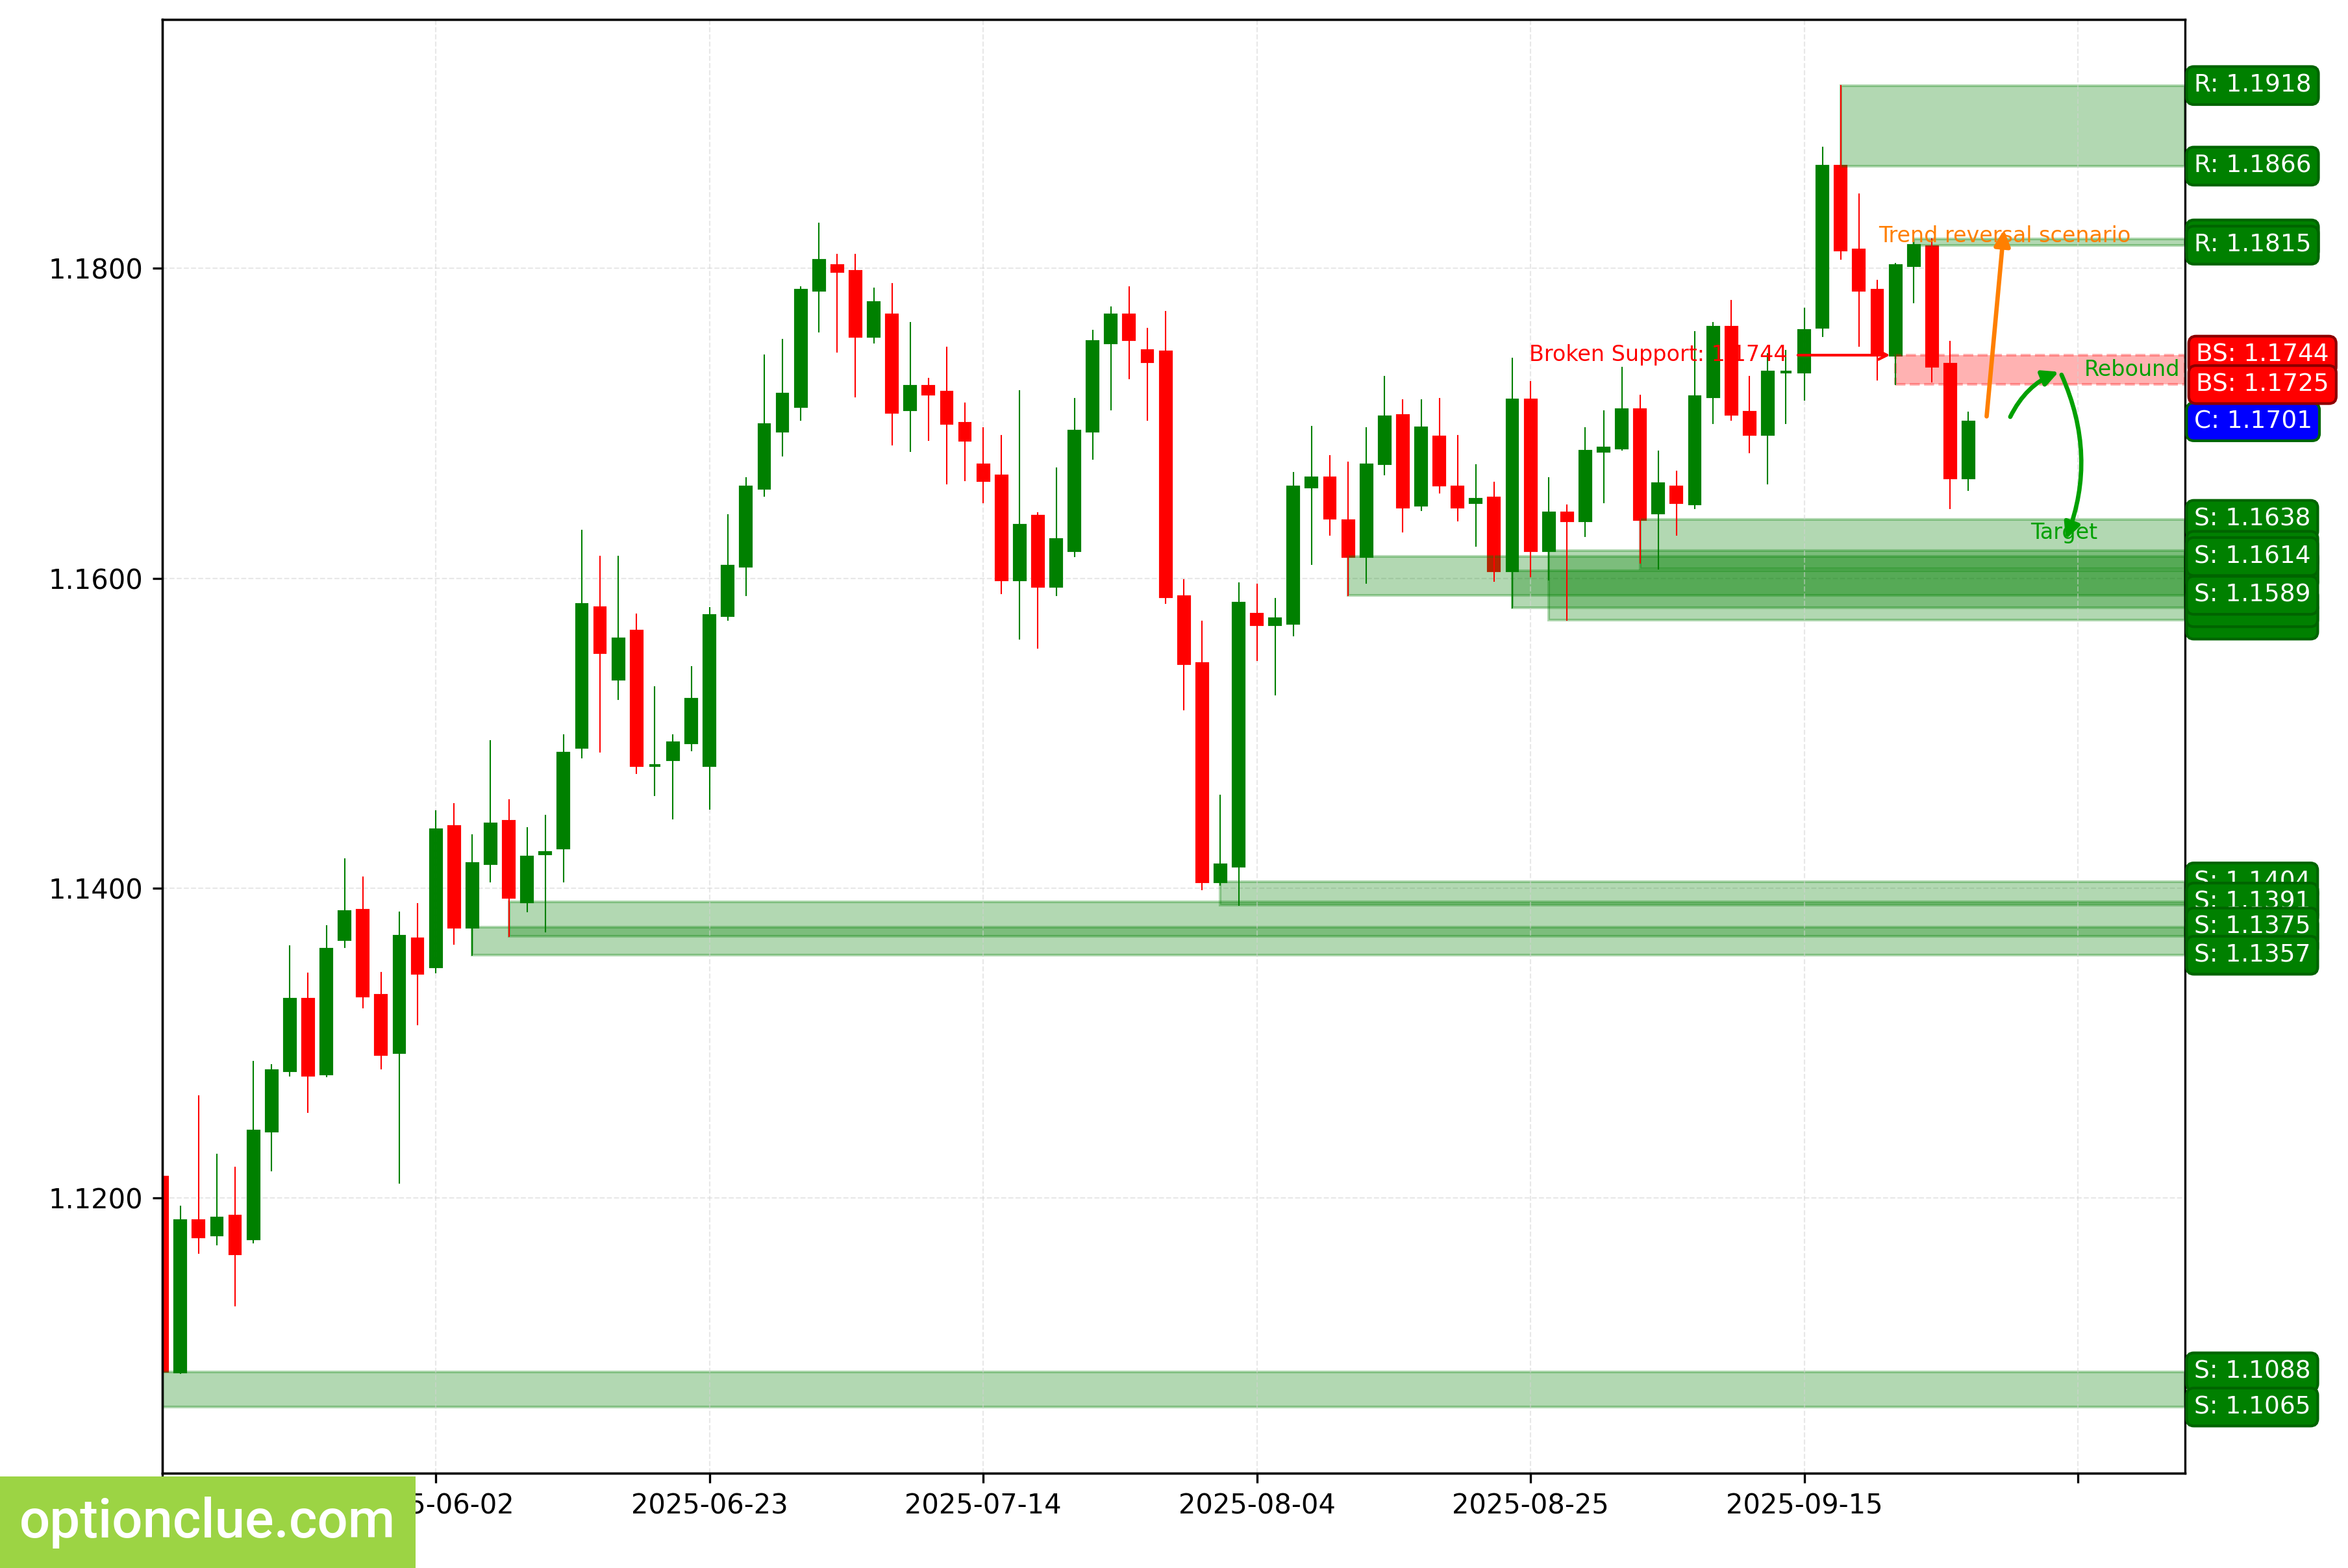
EURUSD. Technical analysis. D1.
British Pound (GBPUSD)
The bearish trend continues; a corrective wave is developing. A sell entry point on a rebound may appear after its completion.
If the downward movement resumes, the first target will be the support level with boundaries at 1.3330 — 1.3387. If the trend develops successfully, a more distant target will be at the support level with boundaries at 1.3138 — 1.3205.
Short positions will remain relevant as long as the market stays below the nearest resistance level with boundaries at 1.3522 — 1.3536.
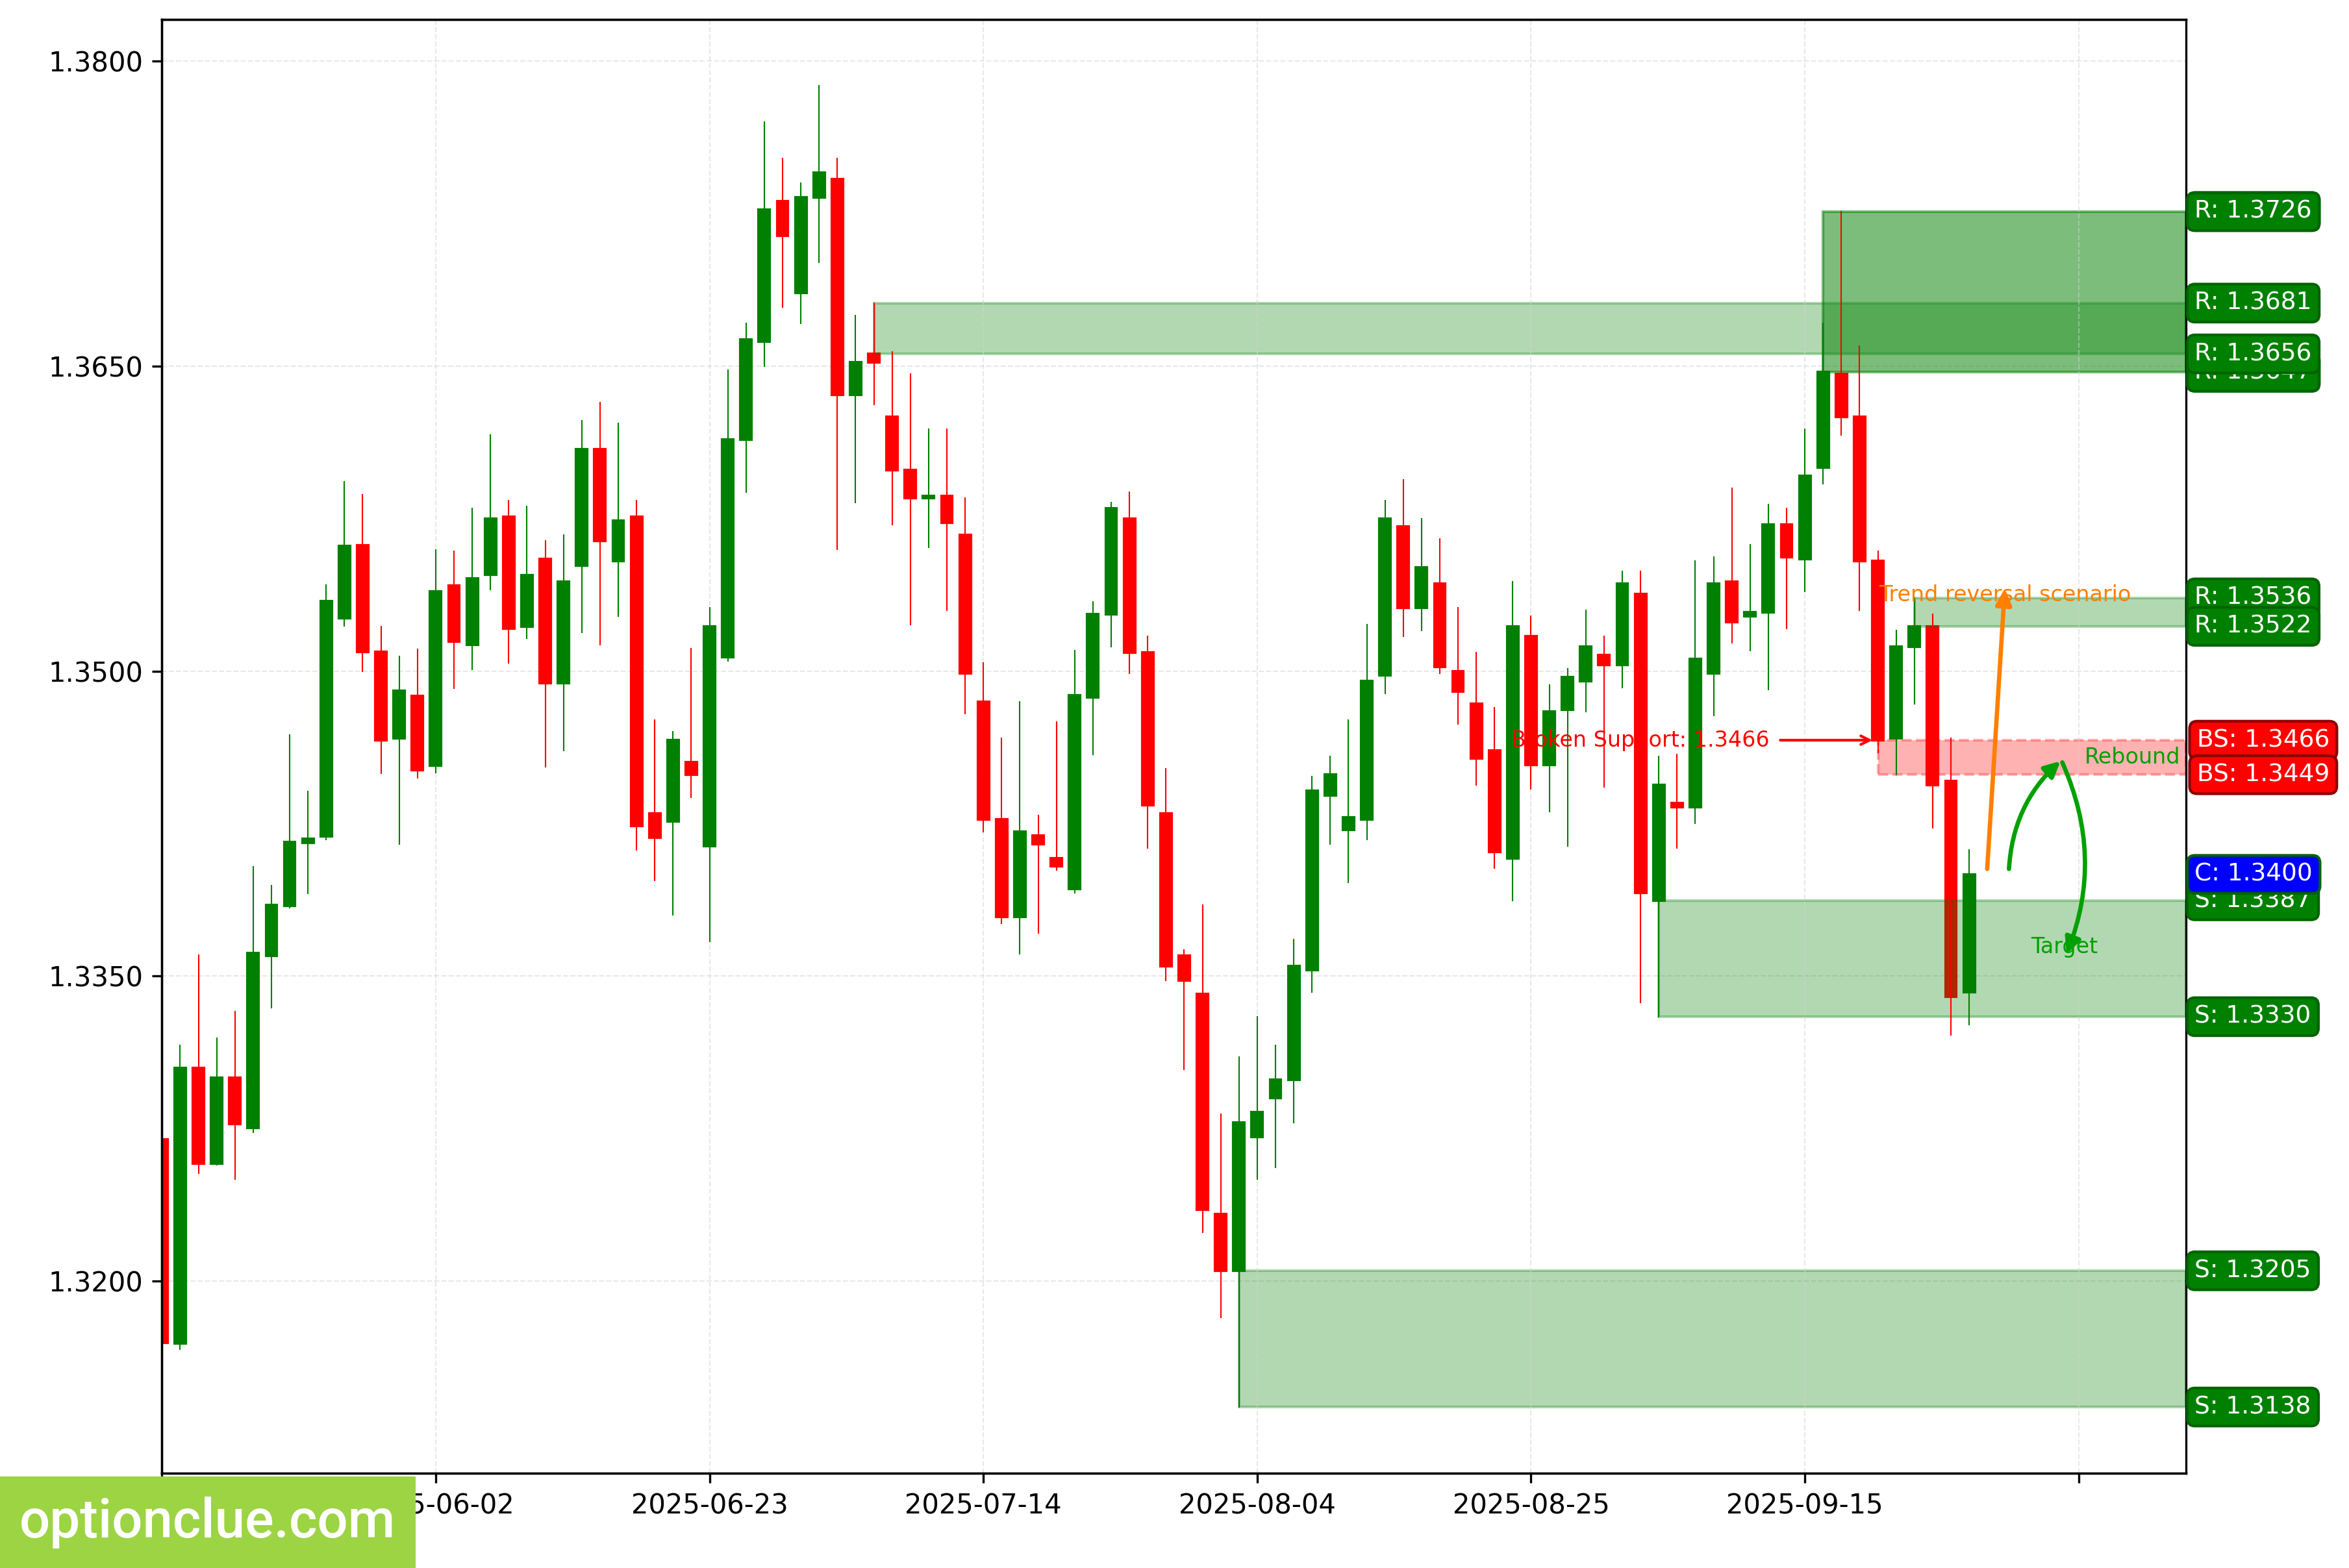
GBPUSD. Technical analysis. D1.
Swiss Franc (USDCHF)
The trend changed to an uptrend when the resistance level (0.7953 —
0.7972) was broken last week. A corrective wave is developing on the daily timeframe.
A buy entry point on a rebound may appear after its completion. If the upward movement resumes, the first target will be the resistance level with boundaries at 0.8053 — 0.8072.
If the trend develops successfully, a more distant target will be at the resistance level with boundaries at 0.8058 — 0.8076. If the correction completes near the last broken level (0.7953 — 0.7972), the potential reward/risk ratio will be around 1-1.5.
Buy signals will remain relevant as long as the market stays above the nearest support level with boundaries at 0.7906 — 0.7910.
USDCHF. Technical analysis. D1.
Japanese Yen (USDJPY)
The trend changed to bullish when the resistance level (147.99 — 148.37) was broken last week. A corrective wave is developing on the daily timeframe.
A buy entry point on a rebound may appear after its completion. The first target for the upward movement will be the resistance with boundaries at 150.74 — 150.91.
If the trend develops successfully, a more distant target will be at the 154.41 — 154.80 level. If the correction completes near the last broken level (147.99 — 148.37), the potential reward/risk ratio will be around 2-3.
Buy signals will remain relevant as long as the market stays above the nearest daily timeframe support level with boundaries at 147.44 — 147.62.
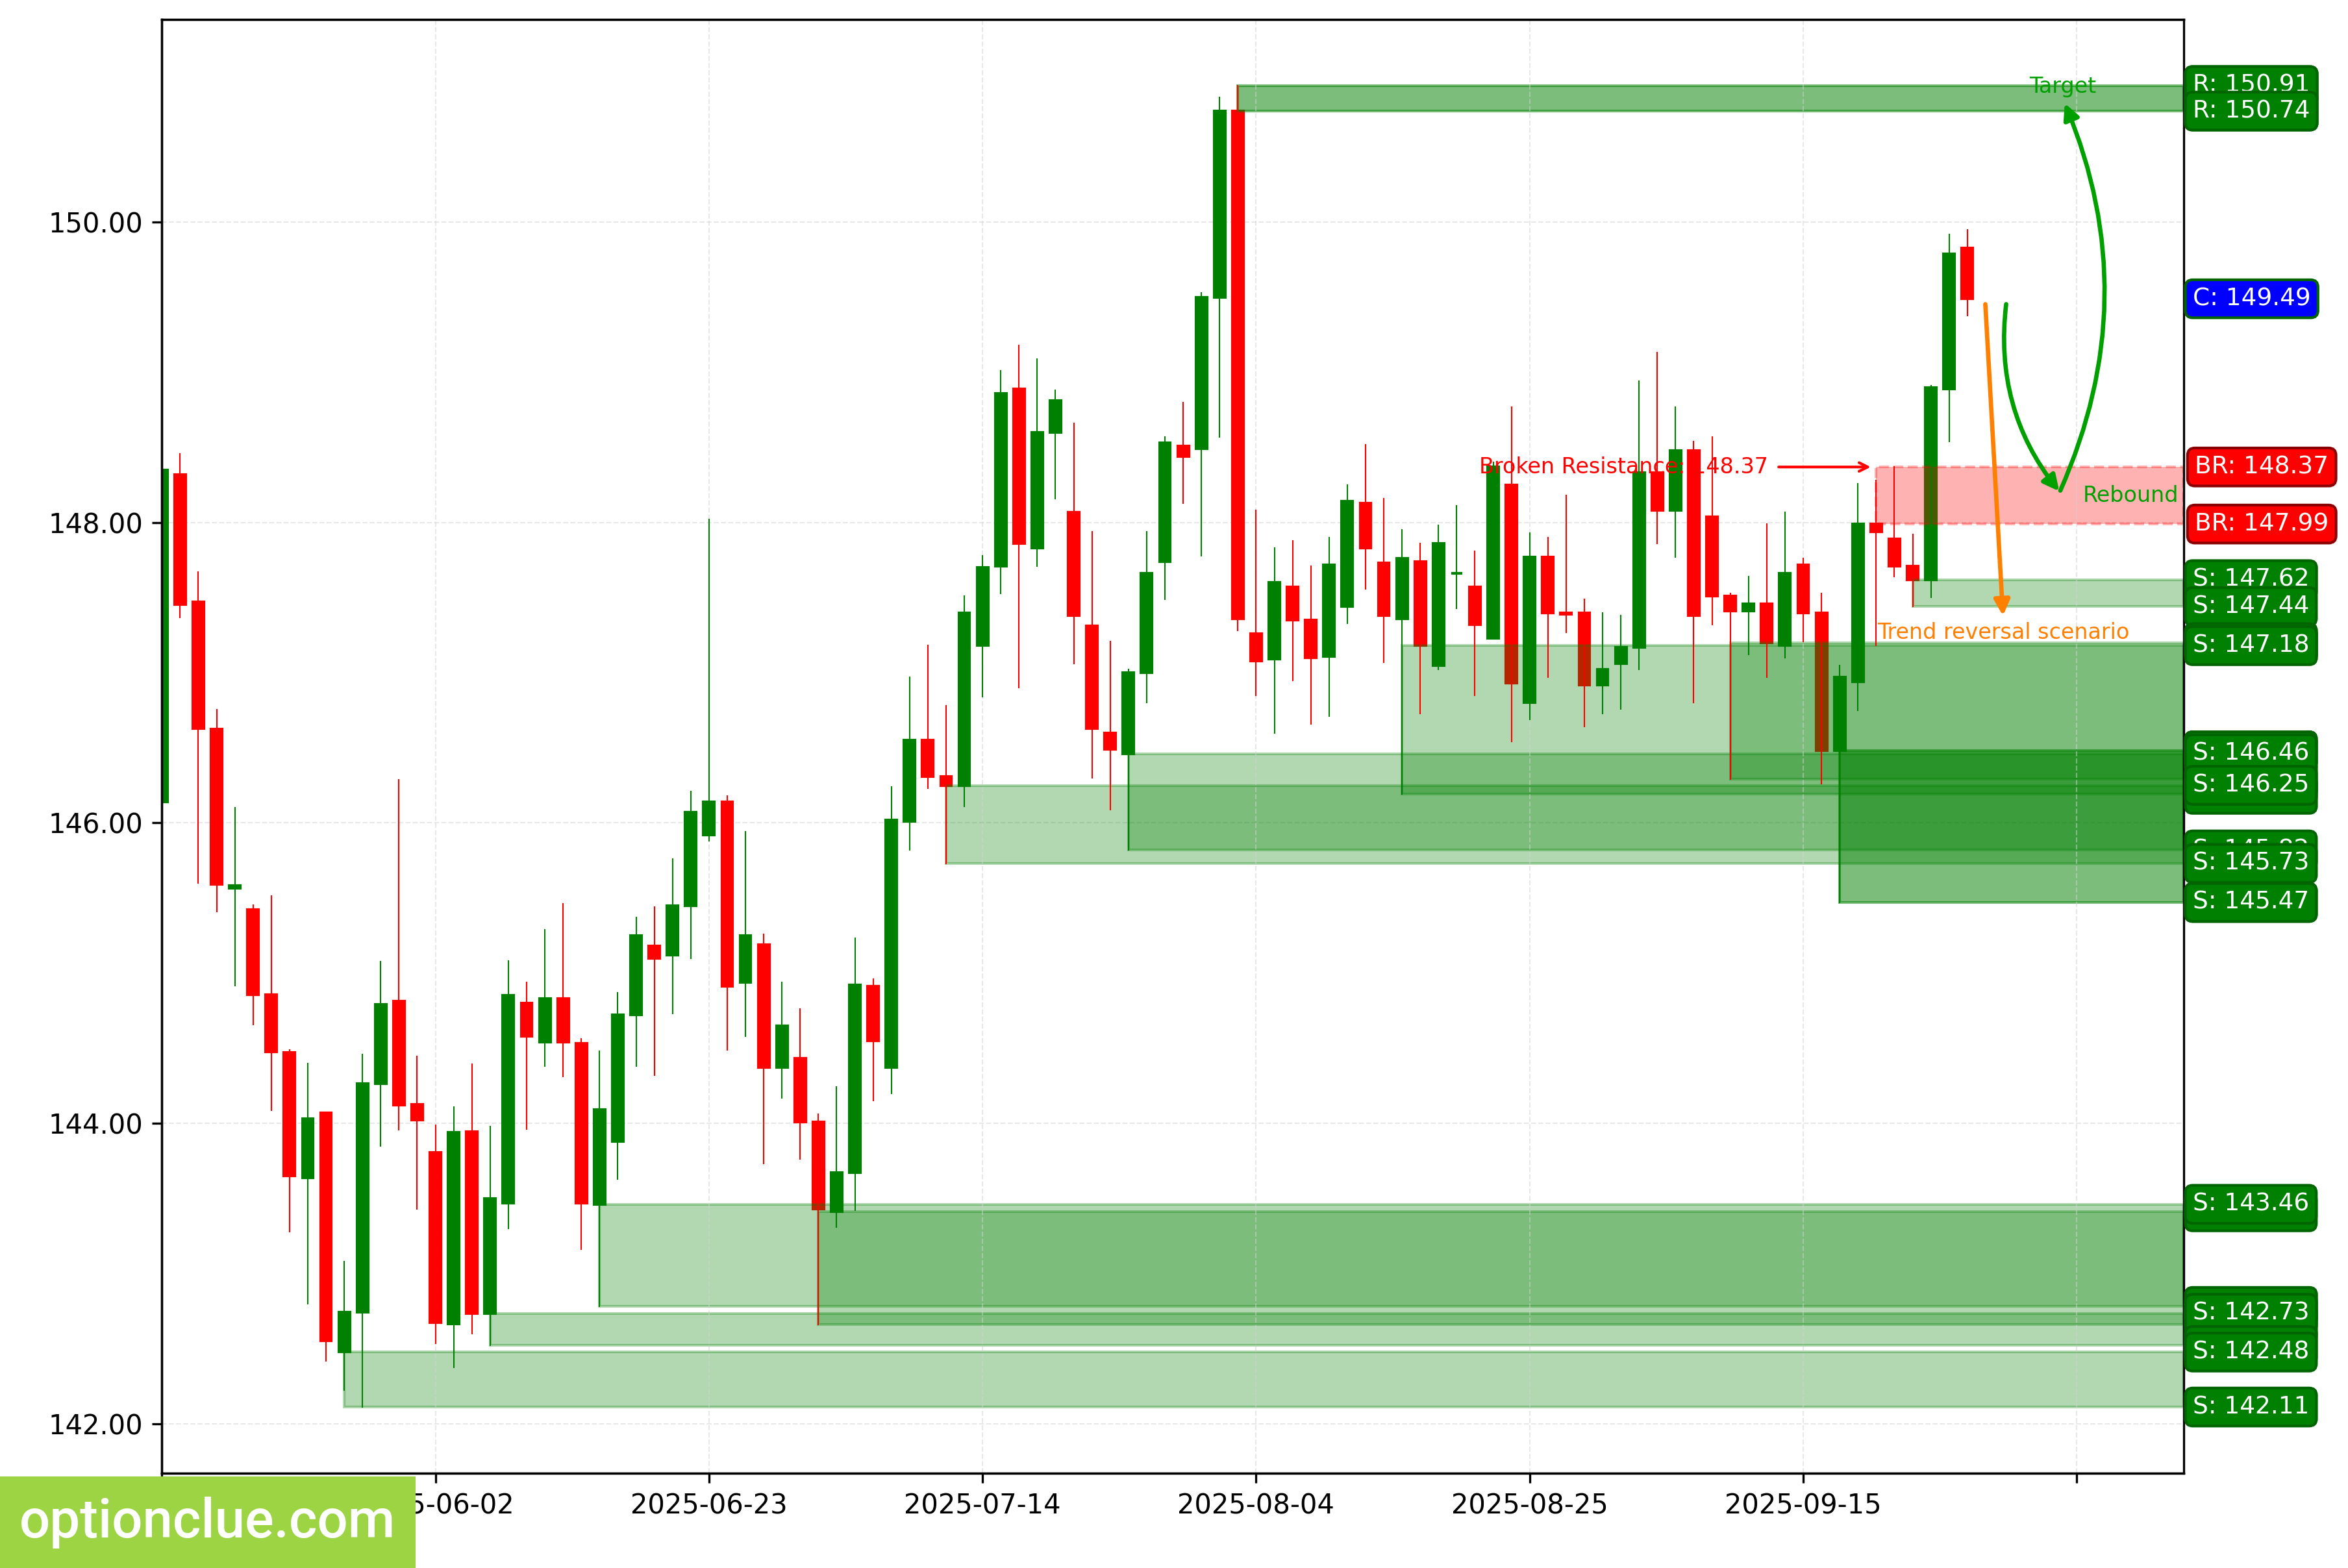
USDJPY. Technical analysis. D1.
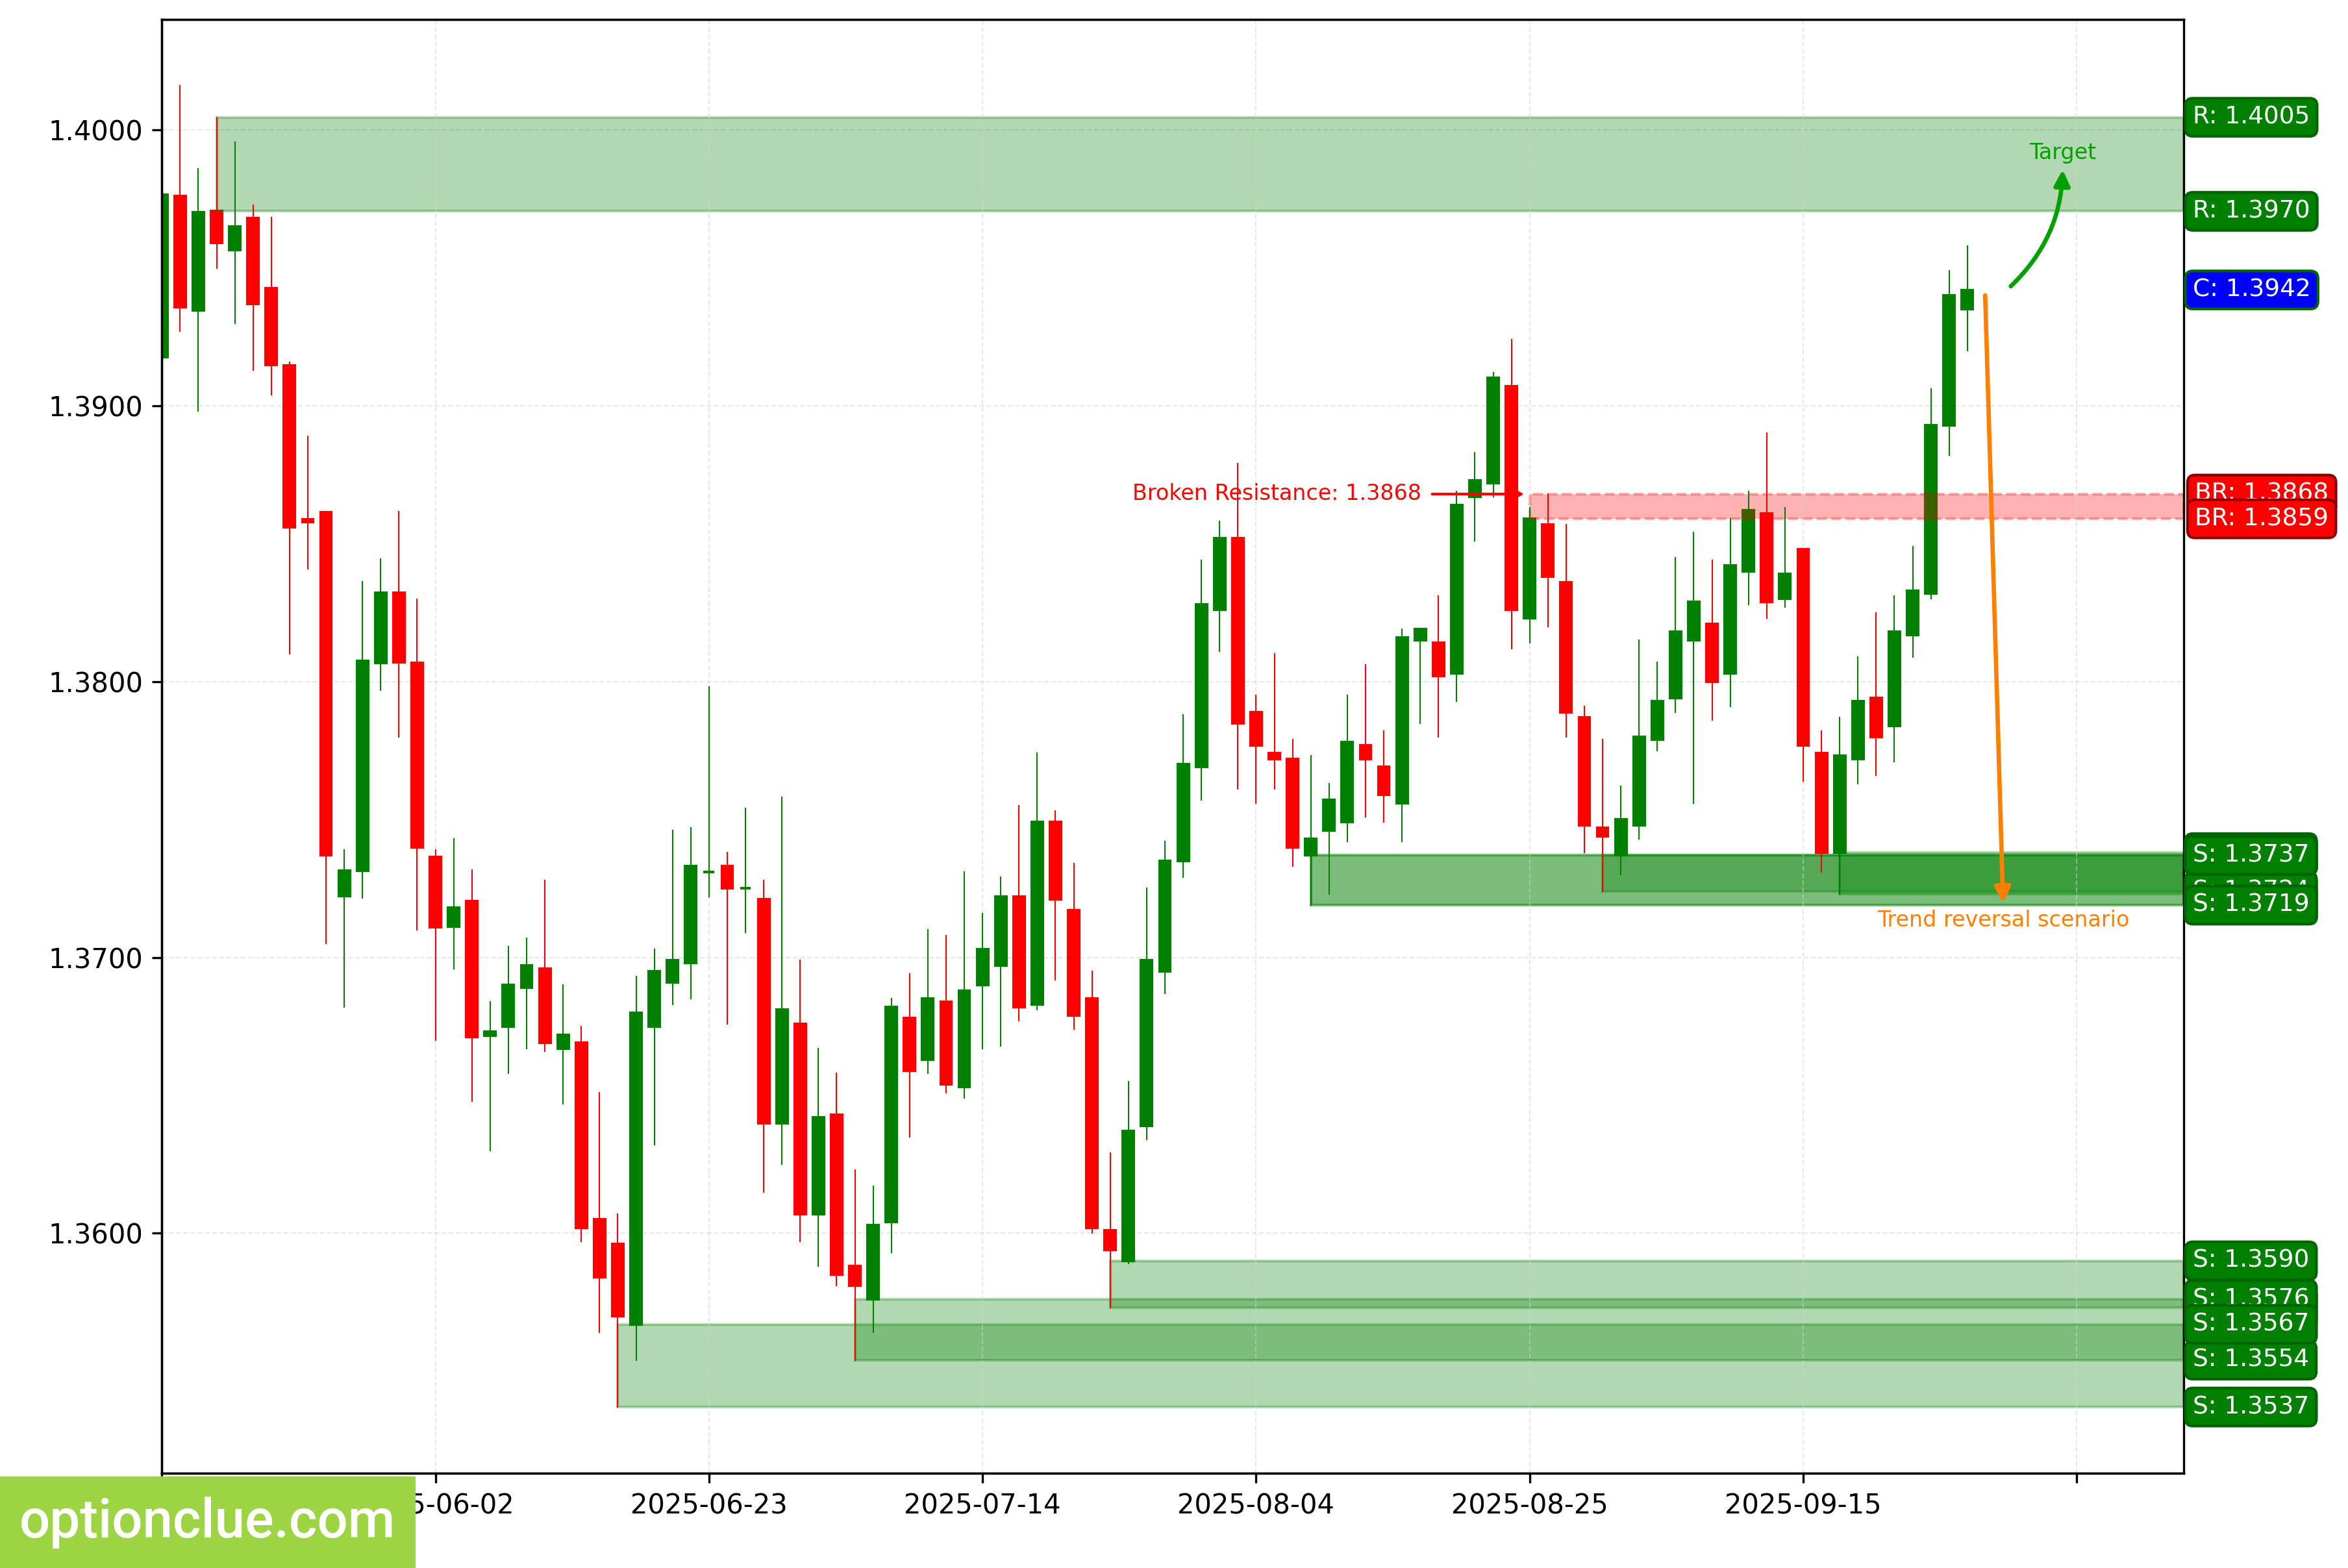
Canadian Dollar (USDCAD)
The trend changed to an uptrend when the resistance level (1.3859 — 1.3868) was broken last week. An impulse wave is developing on the daily timeframe.
A buy entry point on a rebound may appear after the formation
of a complete correction. The nearest target is the resistance with boundaries at 1.3971 — 1.4005.
A more distant target is at the resistance level with
boundaries at 1.4385 — 1.4415. Buy signals will remain relevant as long as the market stays above the nearest support level with boundaries at 1.3723 — 1.3738.
USDCAD. Technical analysis. D1.
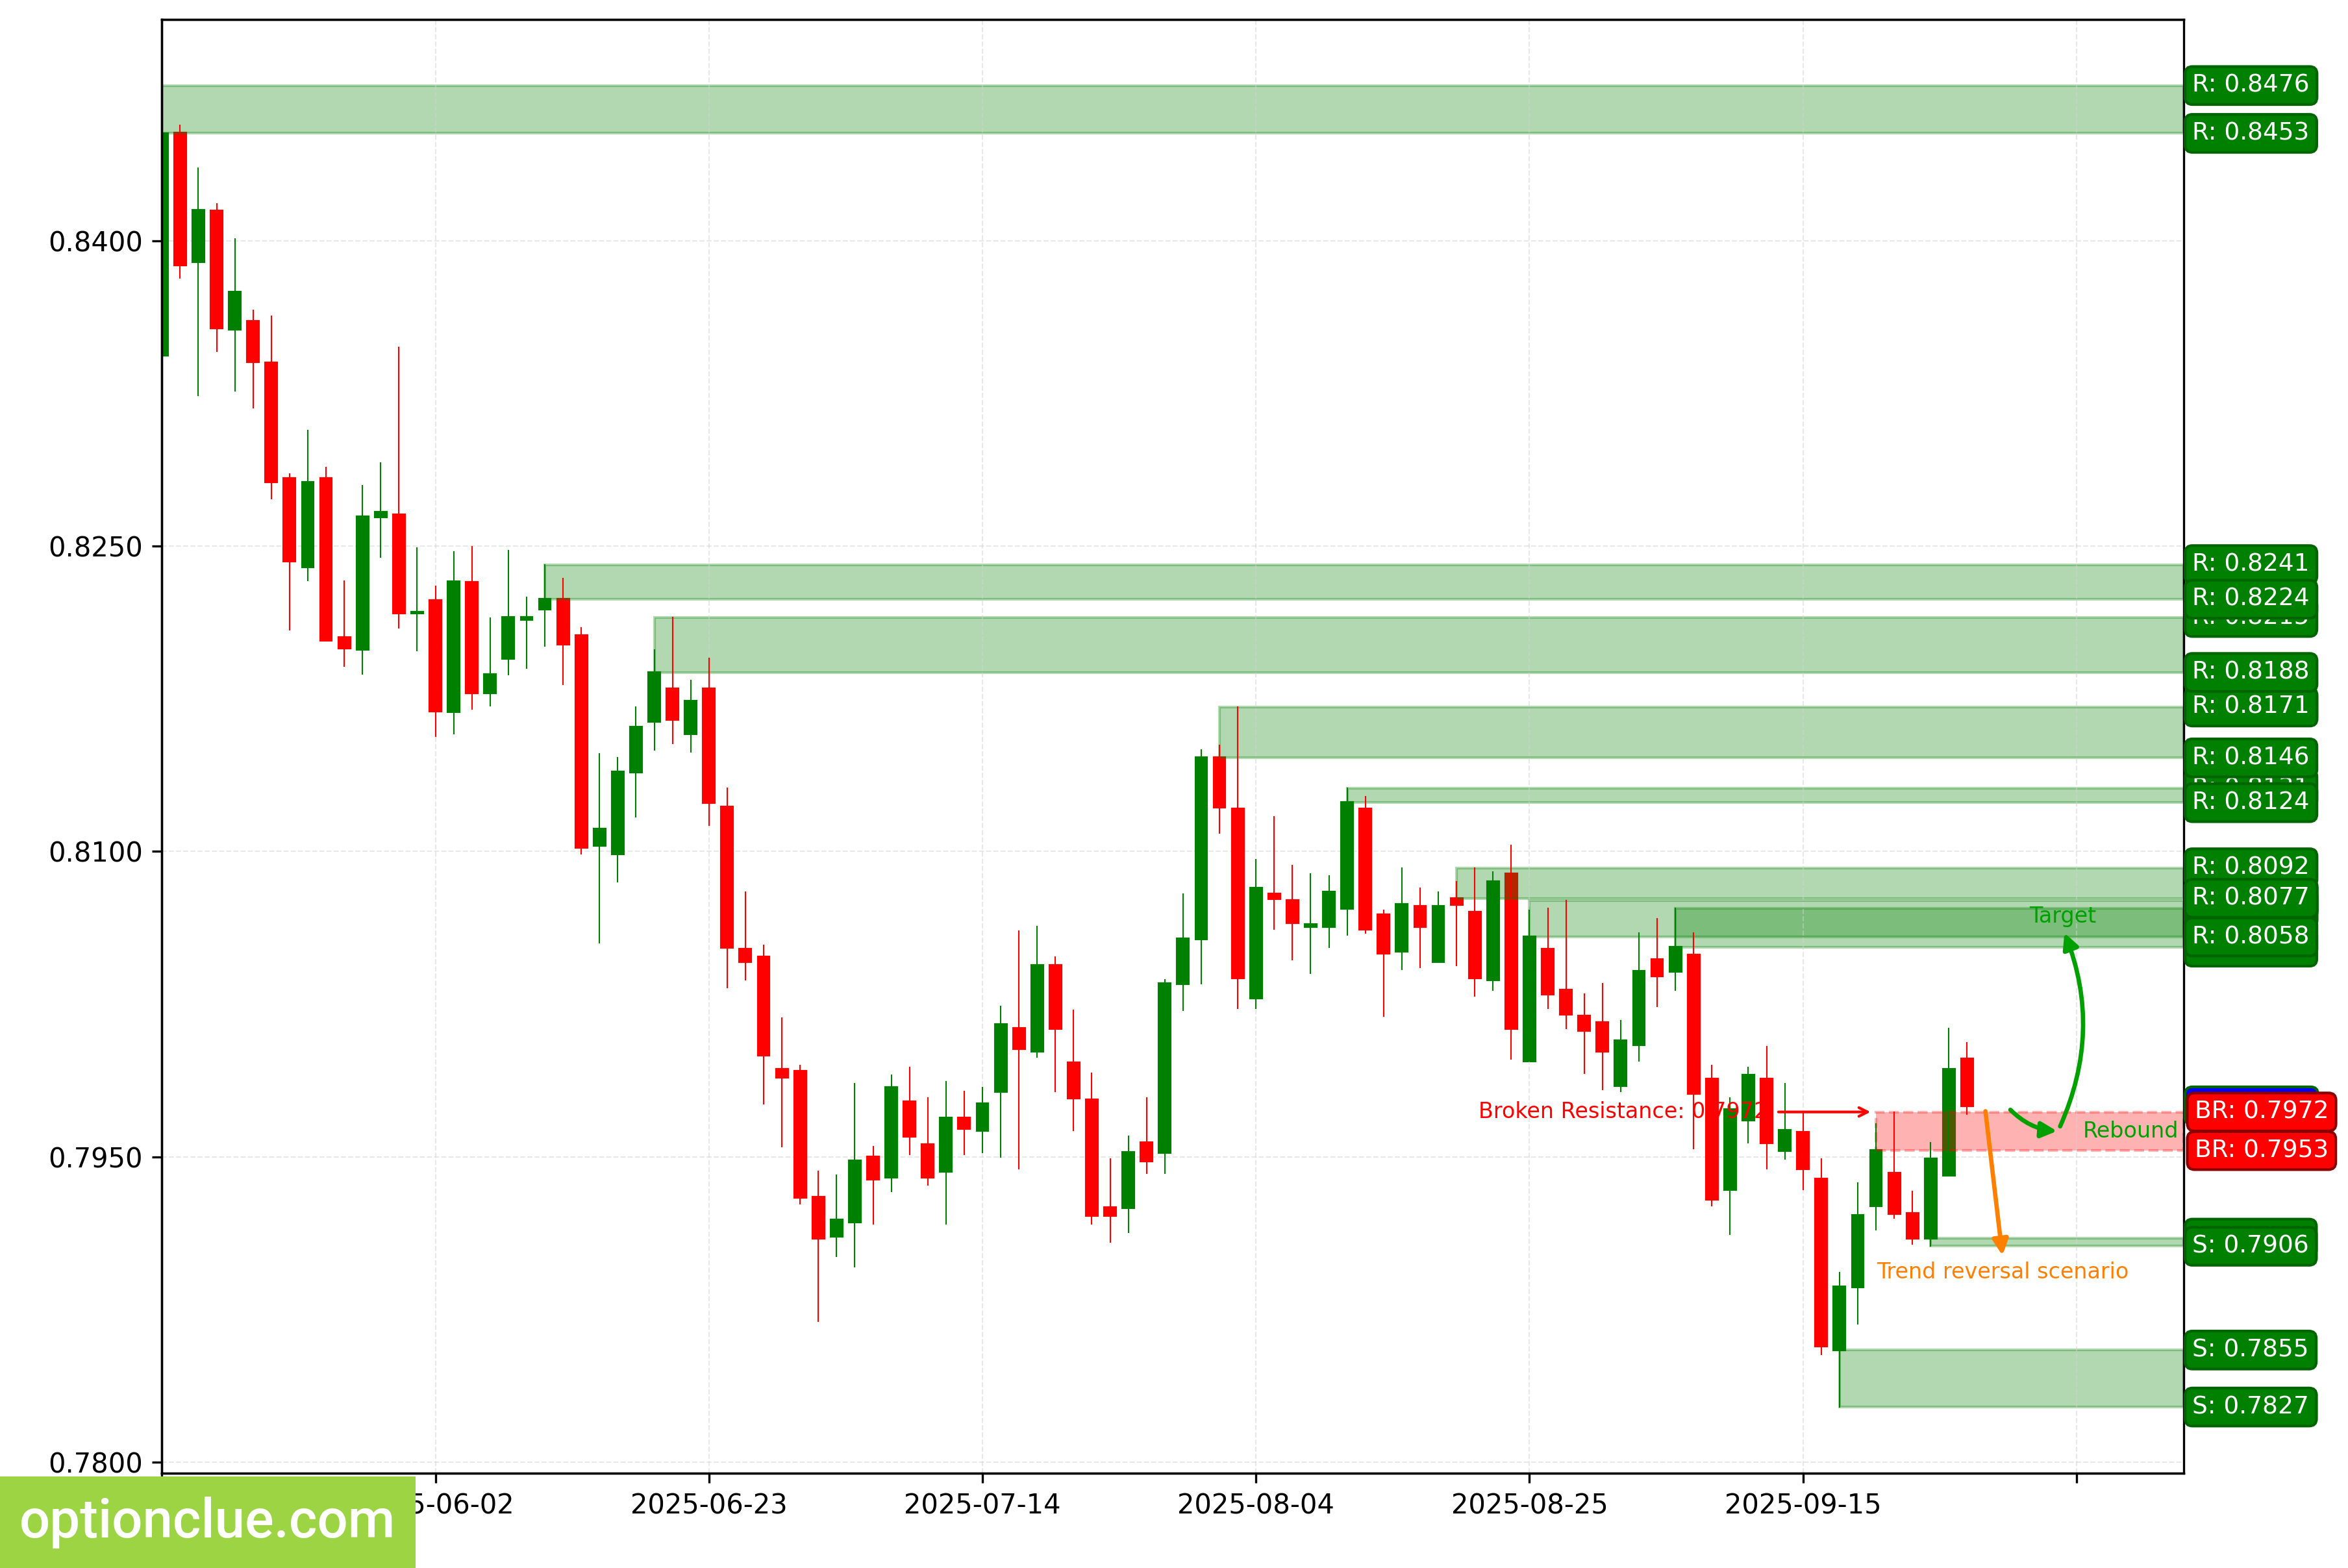
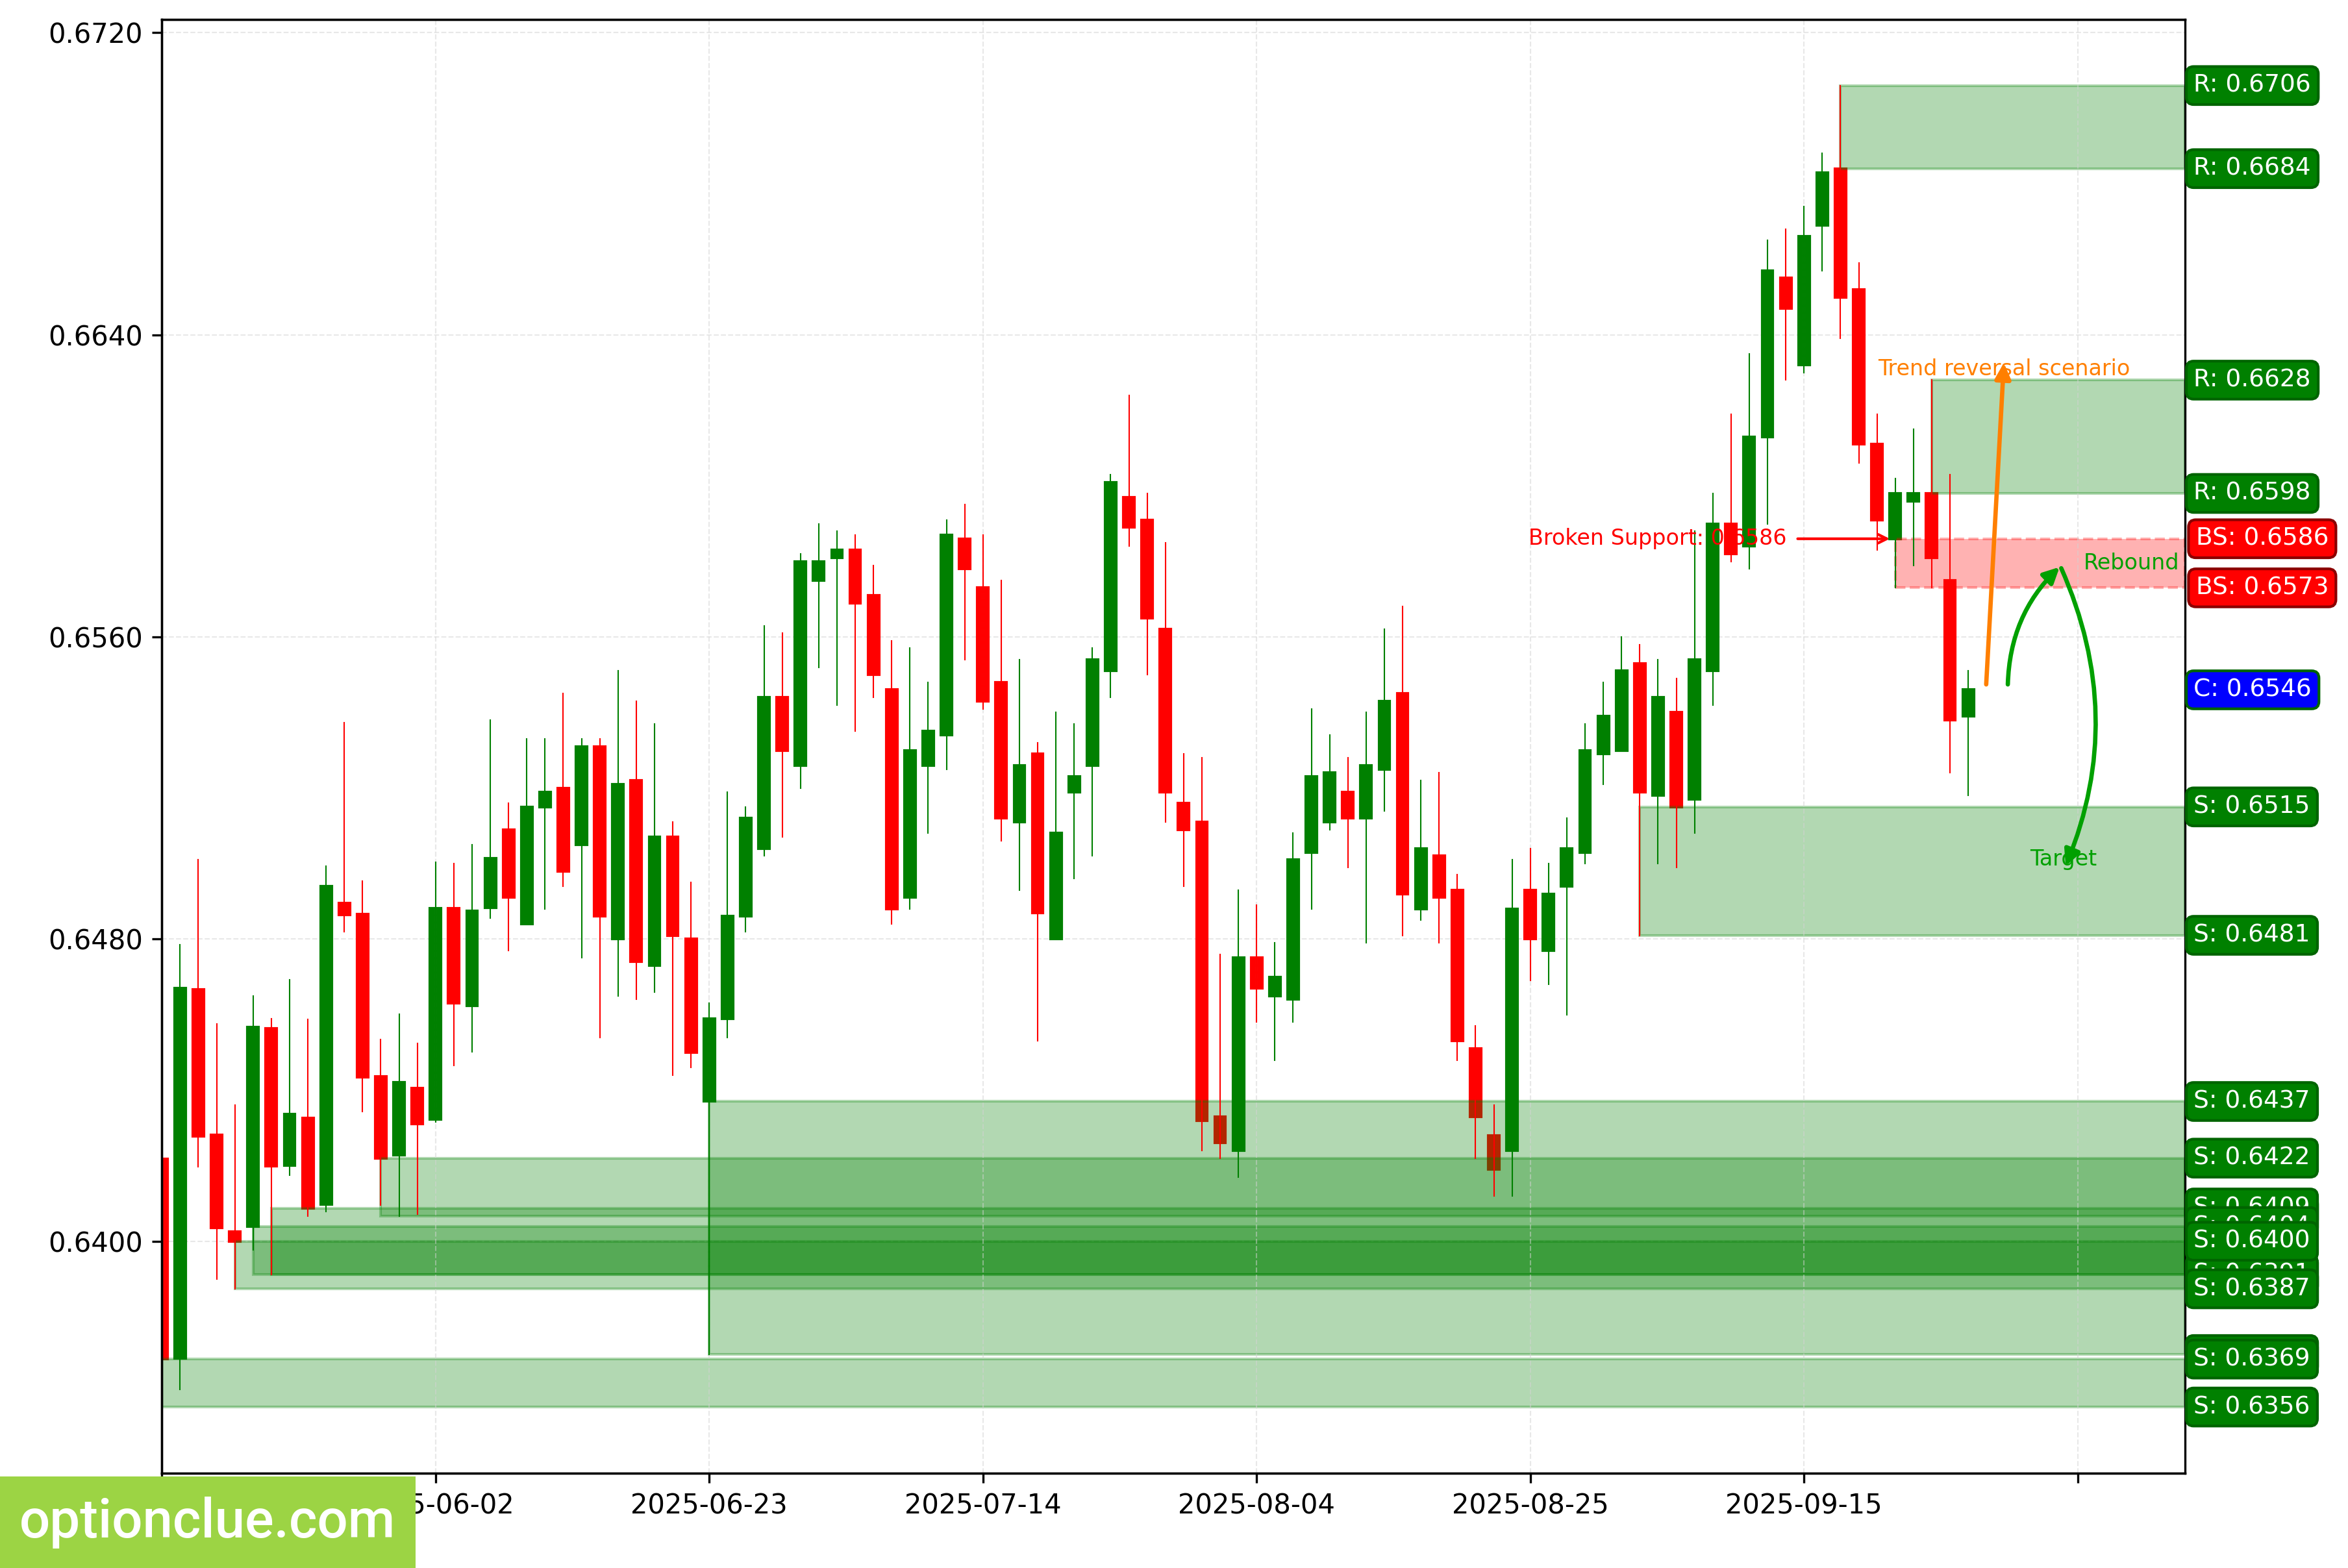
Australian Dollar (AUDUSD)
The trend changed to bearish when the support level (0.6573 — 0.6586) was broken last week.
A corrective wave is developing on the daily timeframe. A buy entry point on a rebound may appear after its completion.
If the downward movement resumes, the first target will be the support level with boundaries at 0.6481 — 0.6515. If the trend develops successfully, a more distant target will be at the support level with boundaries at 0.6370 — 0.6437.
If the correction completes near the last broken level (0.6573 — 0.6586), the potential reward/risk ratio will be around 1-2.5. Short positions will remain relevant as long as the price stays below the nearest resistance level with boundaries at 0.6598 — 0.6628.
AUDUSD. Technical analysis. D1.
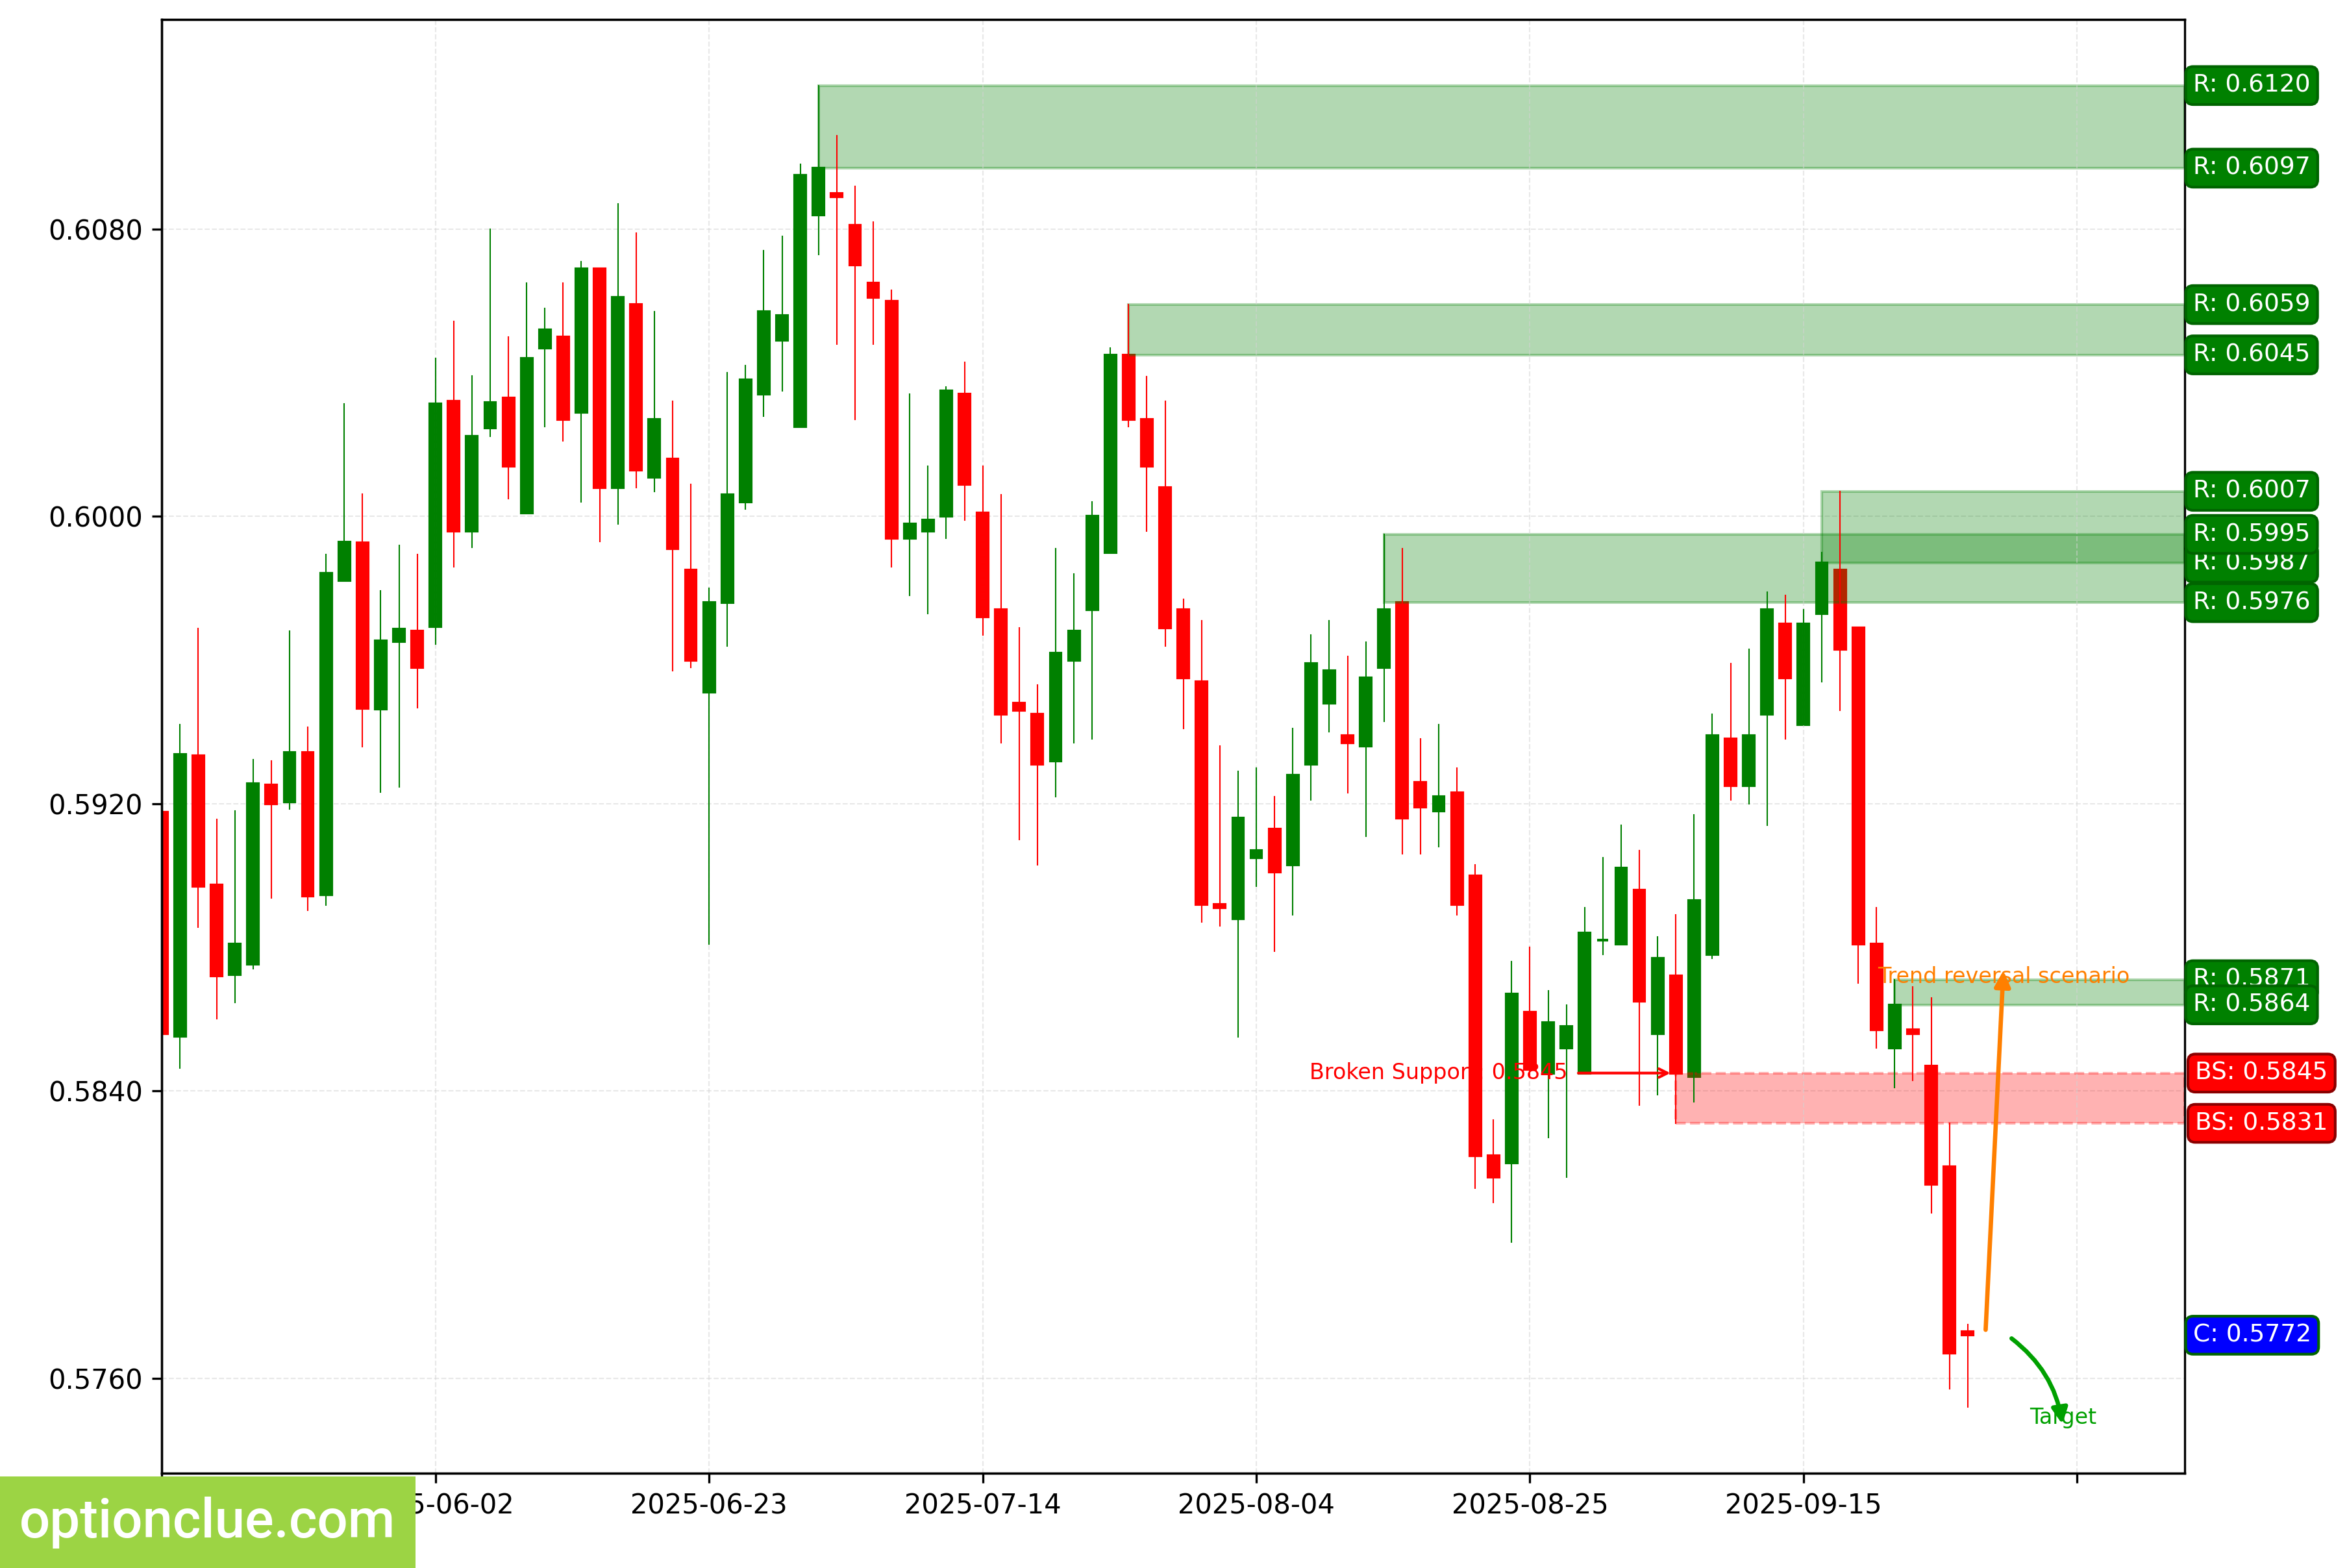
New Zealand Dollar (NZDUSD)
The trend changed to a downtrend when the support level (0.5831 — 0.5845) was broken last week.
An impulse wave is developing on the daily timeframe. A buy entry point on a rebound may appear after the formation of a complete correction.
The nearest target is the support level with boundaries at 0.5485 — 0.5528. Short positions will remain relevant as long as the market stays below the resistance level with boundaries at 0.5864 — 0.5871.
NZDUSD. Technical analysis. D1.
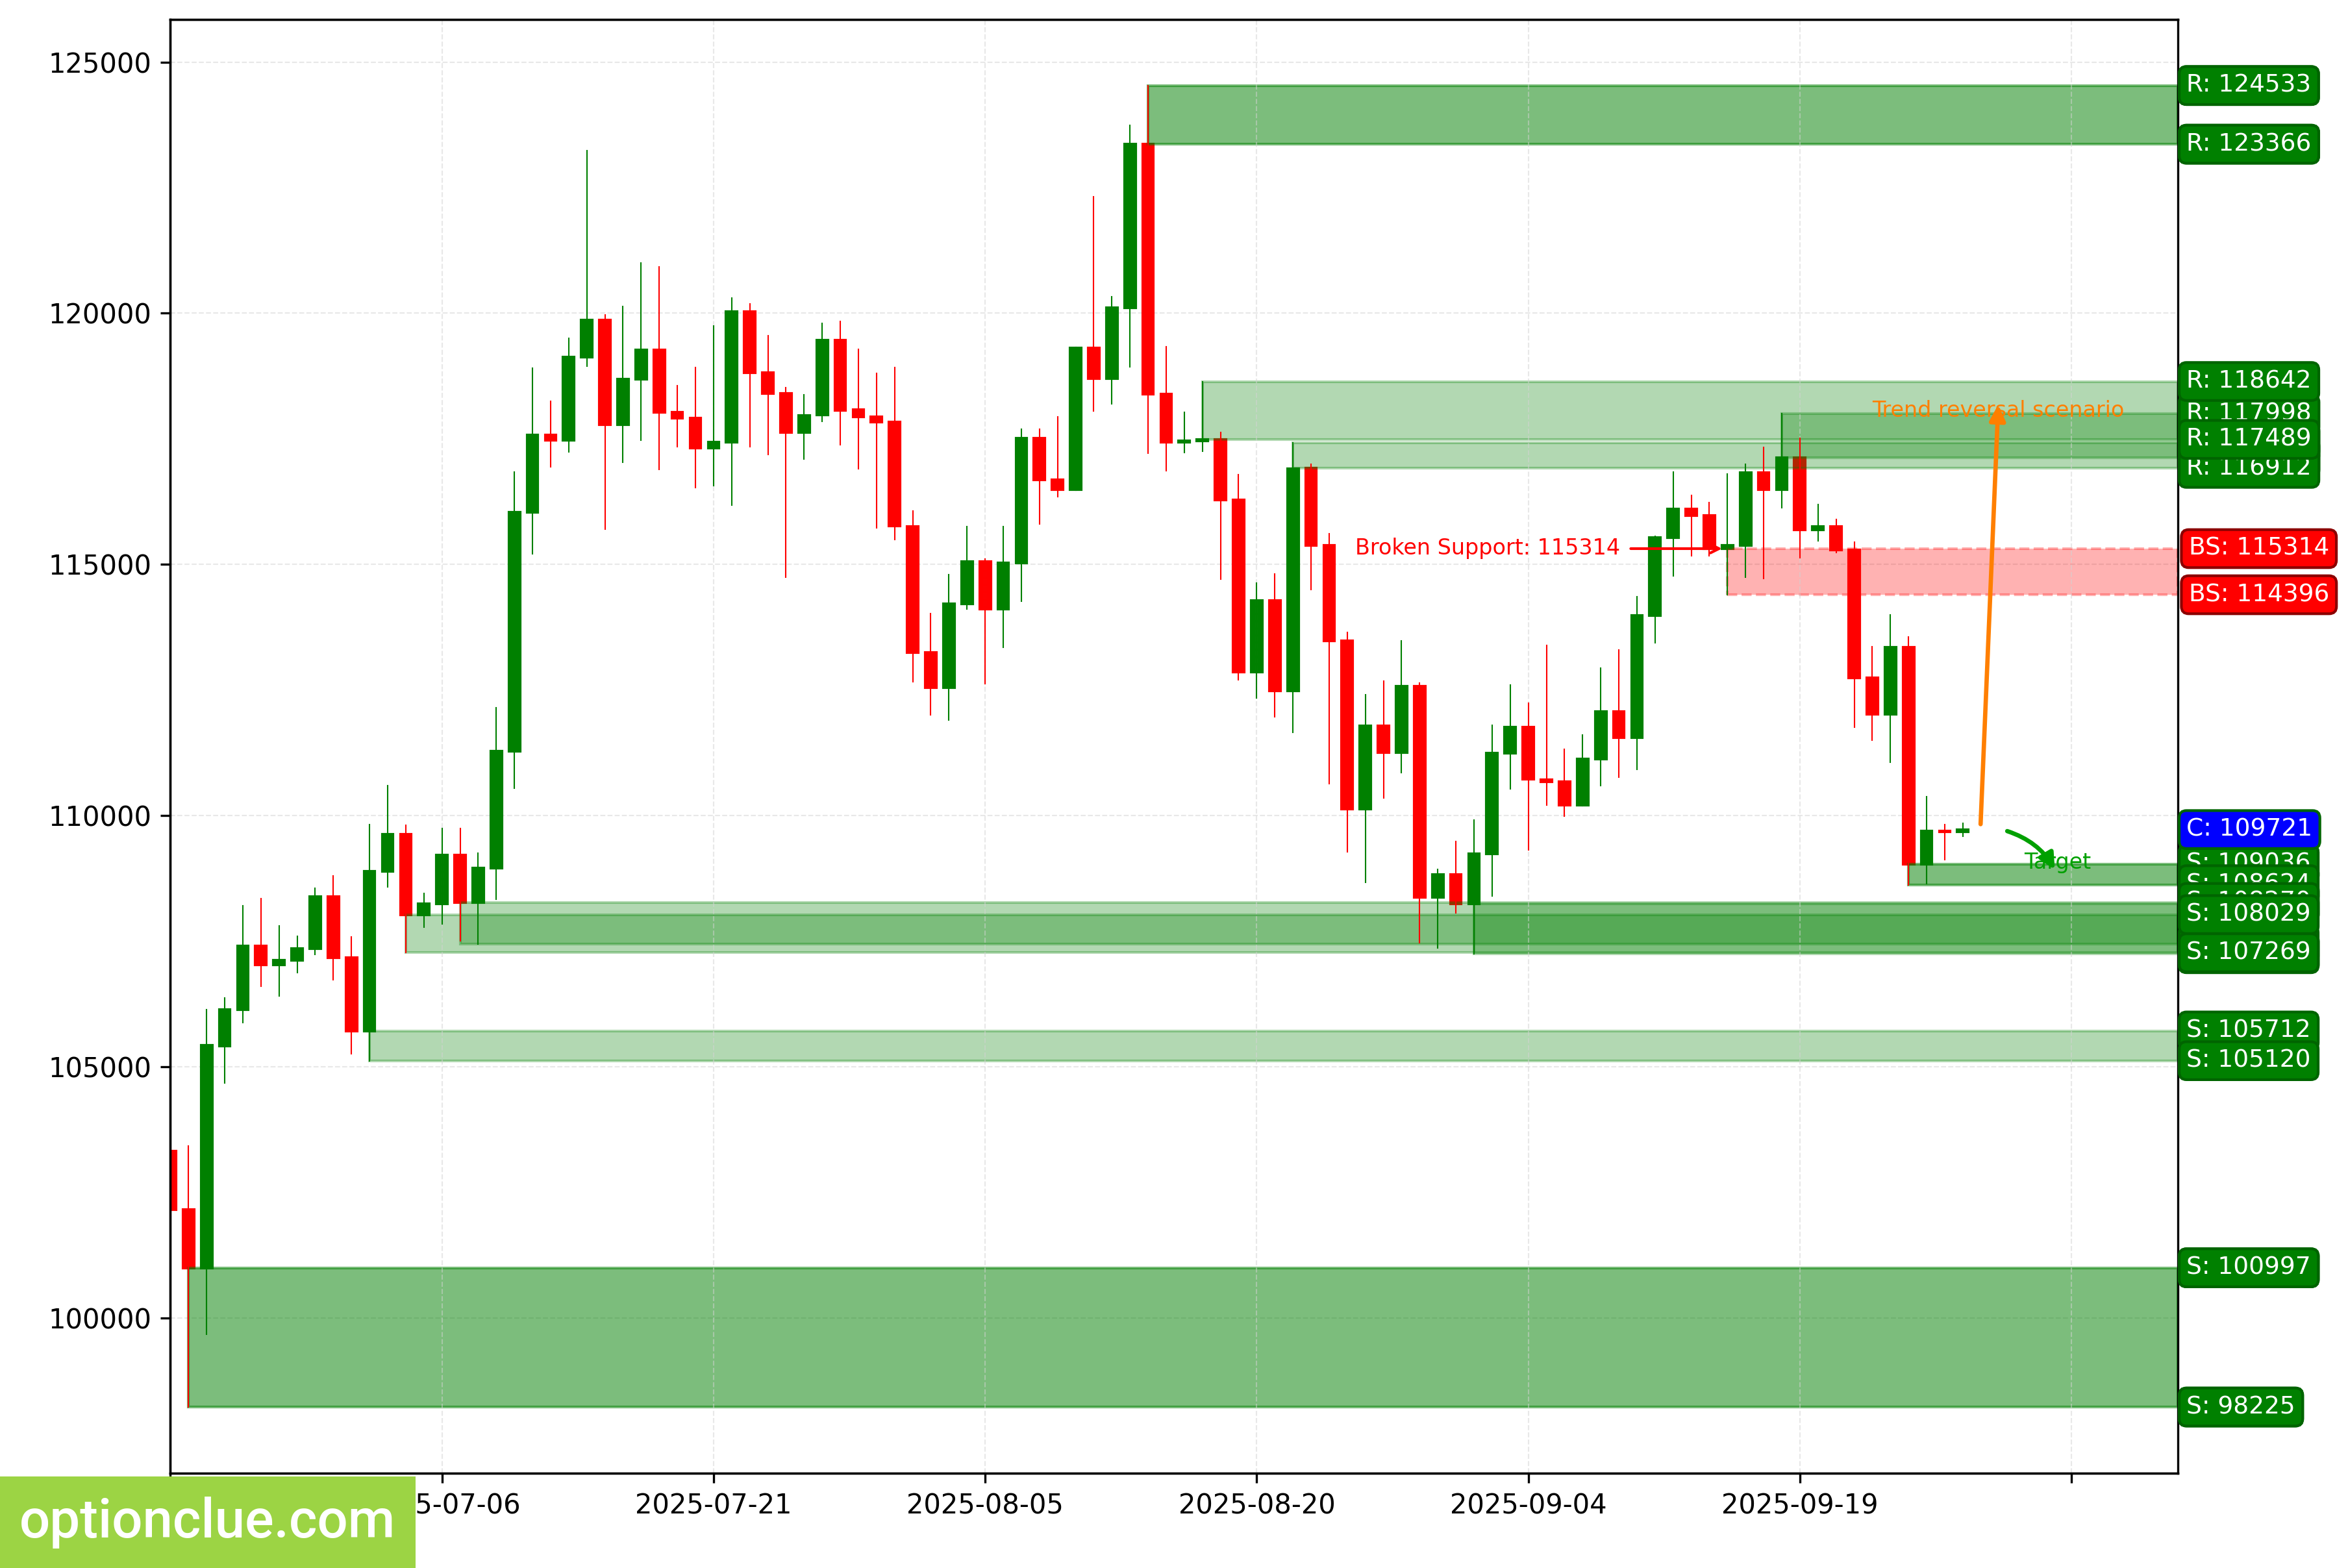
Bitcoin (BTC)
The trend changed to a downtrend when the support level (114396 — 115314) was broken last week.
A correction is developing on the daily timeframe. A short entry point on a rebound may appear after its completion.
The nearest target is the support level with boundaries at 108624 — 109036. If the trend develops successfully, a more distant target
will be at the support level with boundaries at 107250 — 108248.
Short positions will remain relevant as long as the market stays below the nearest resistance level with boundaries at 117118 — 117998.
BTC. Technical analysis. D1.
Ether (ETH)
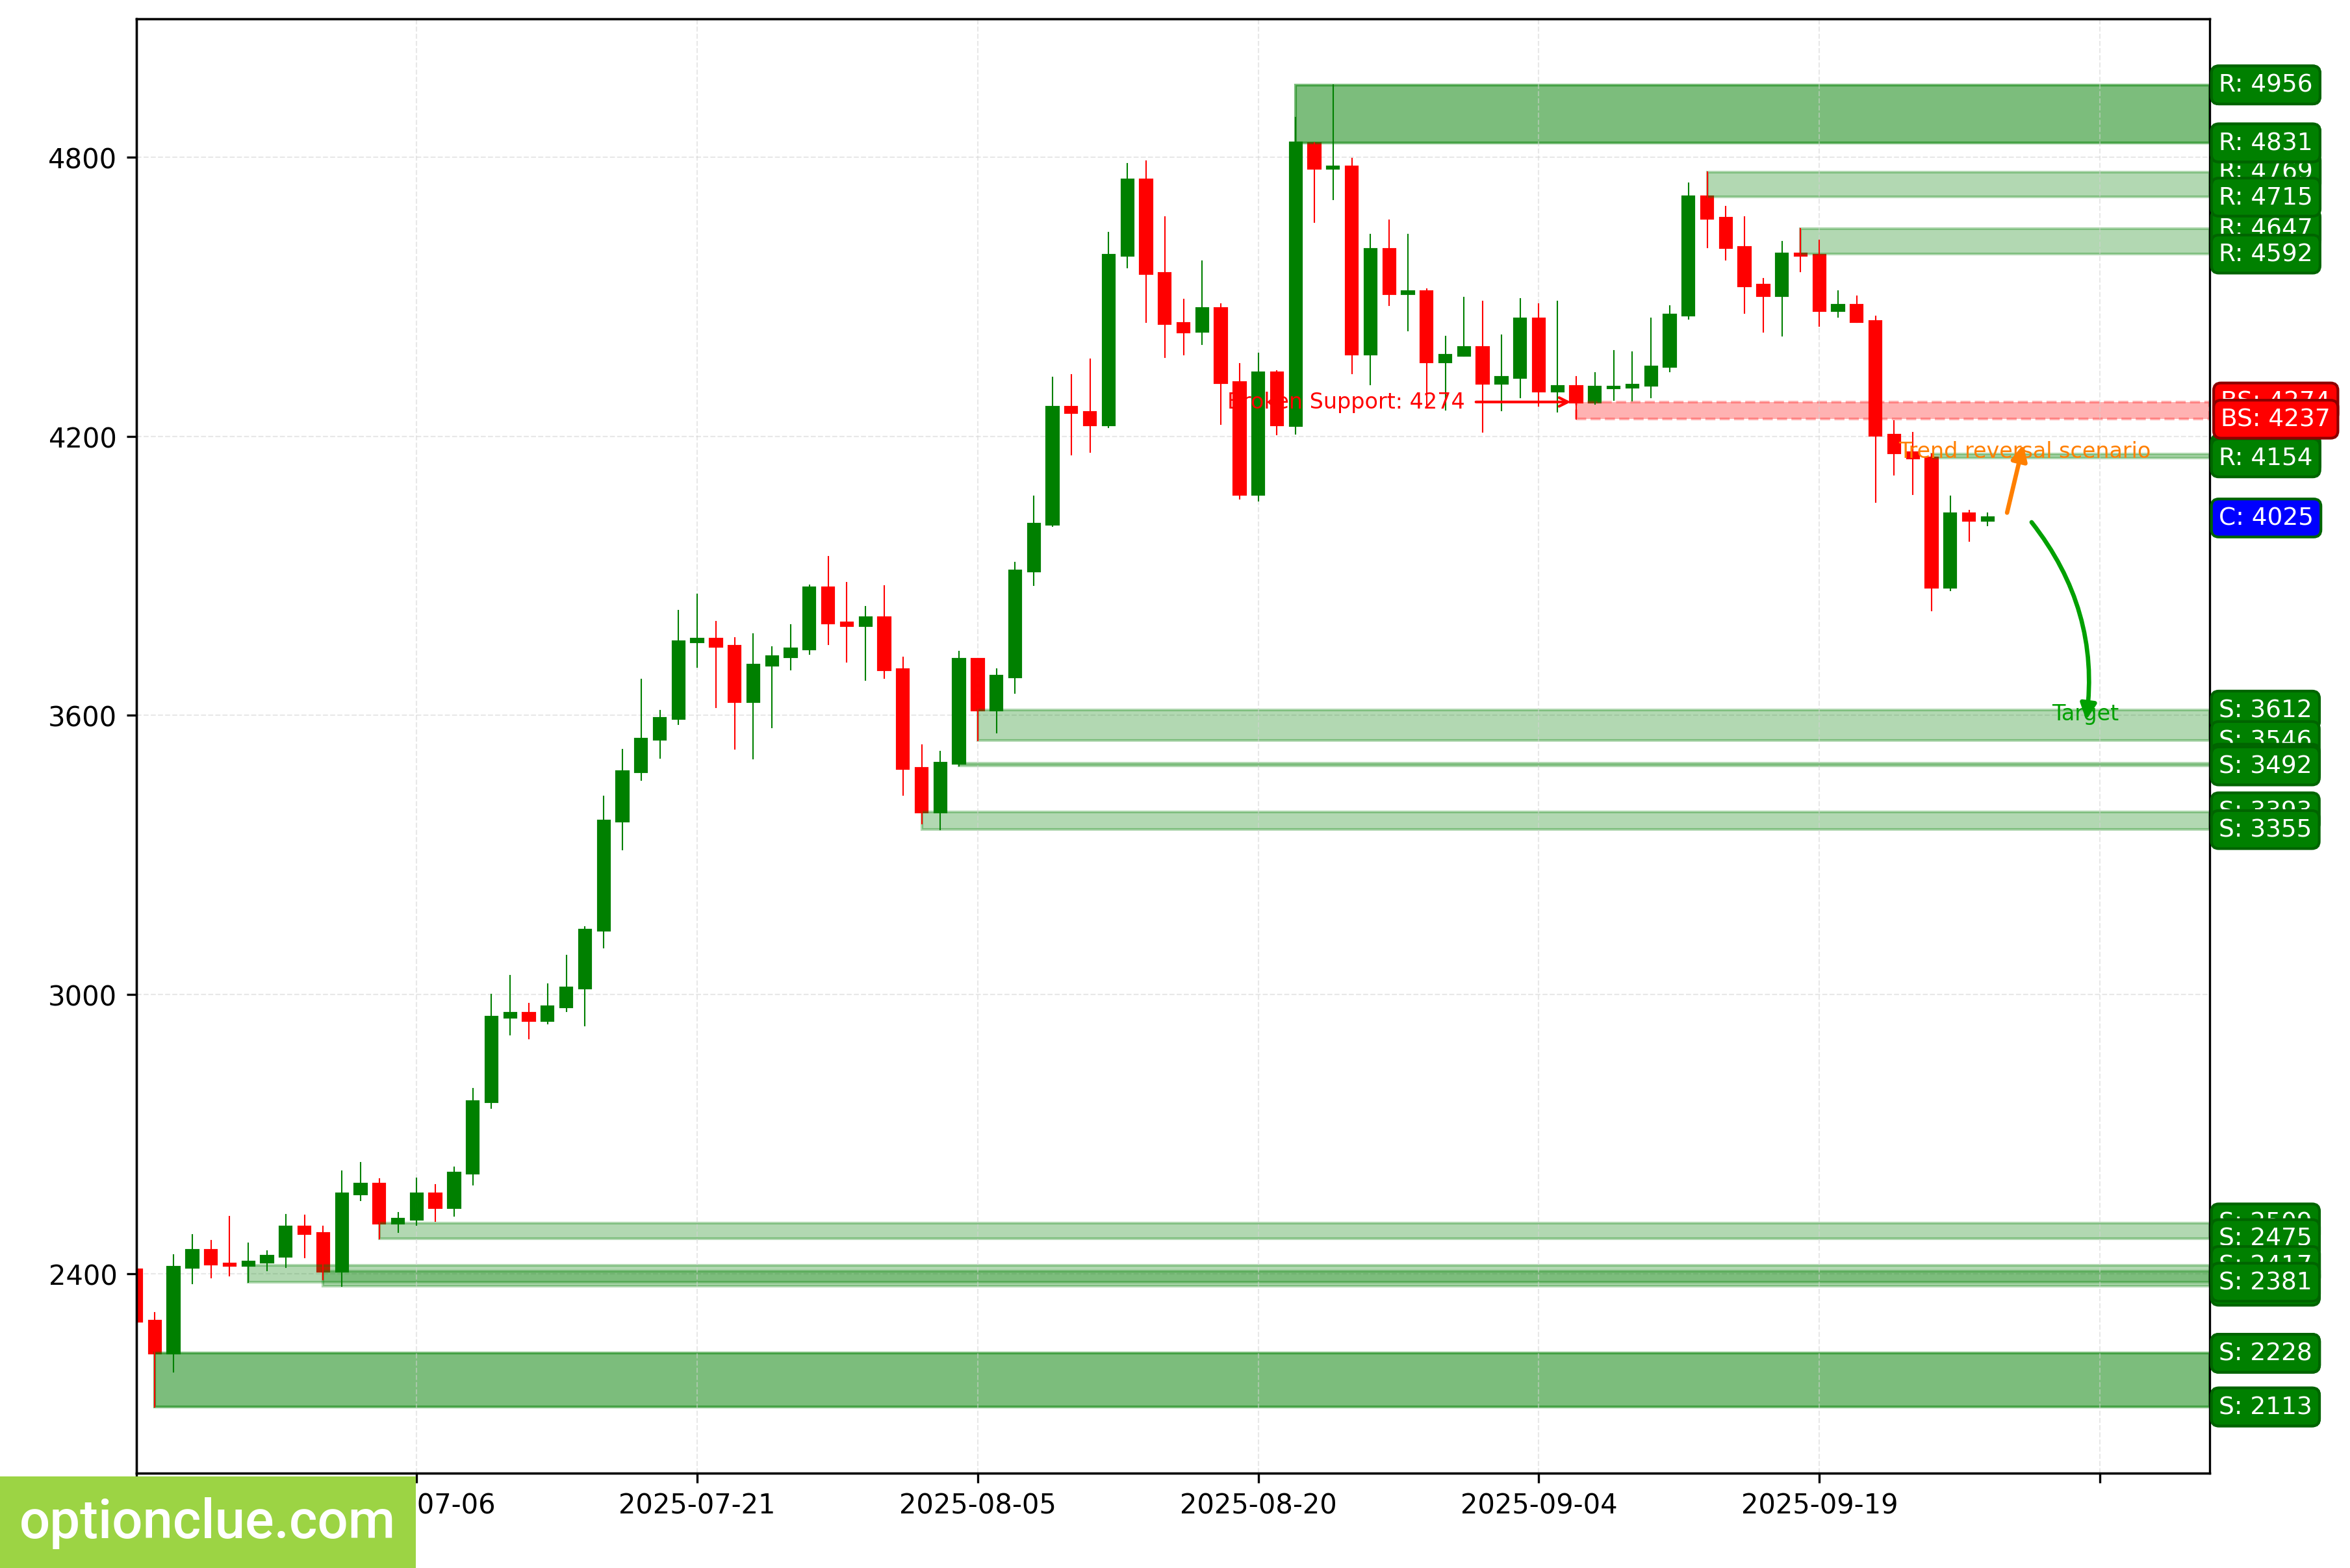
The trend changed to bearish when the support level (4237 — 4274) was broken last week. A correction is developing on the daily timeframe.
An entry point on a rebound may appear after its completion. If the downward movement resumes, the first target will be the support level with boundaries at 3546 — 3612.
If the trend develops successfully, a more distant target will be at the support level with boundaries at 3492 — 3497. Short positions will remain relevant as long as the market stays below the nearest resistance level with boundaries at 4154 — 4163.
ETH. Technical analysis. D1.
Apple Inc (AAPL)
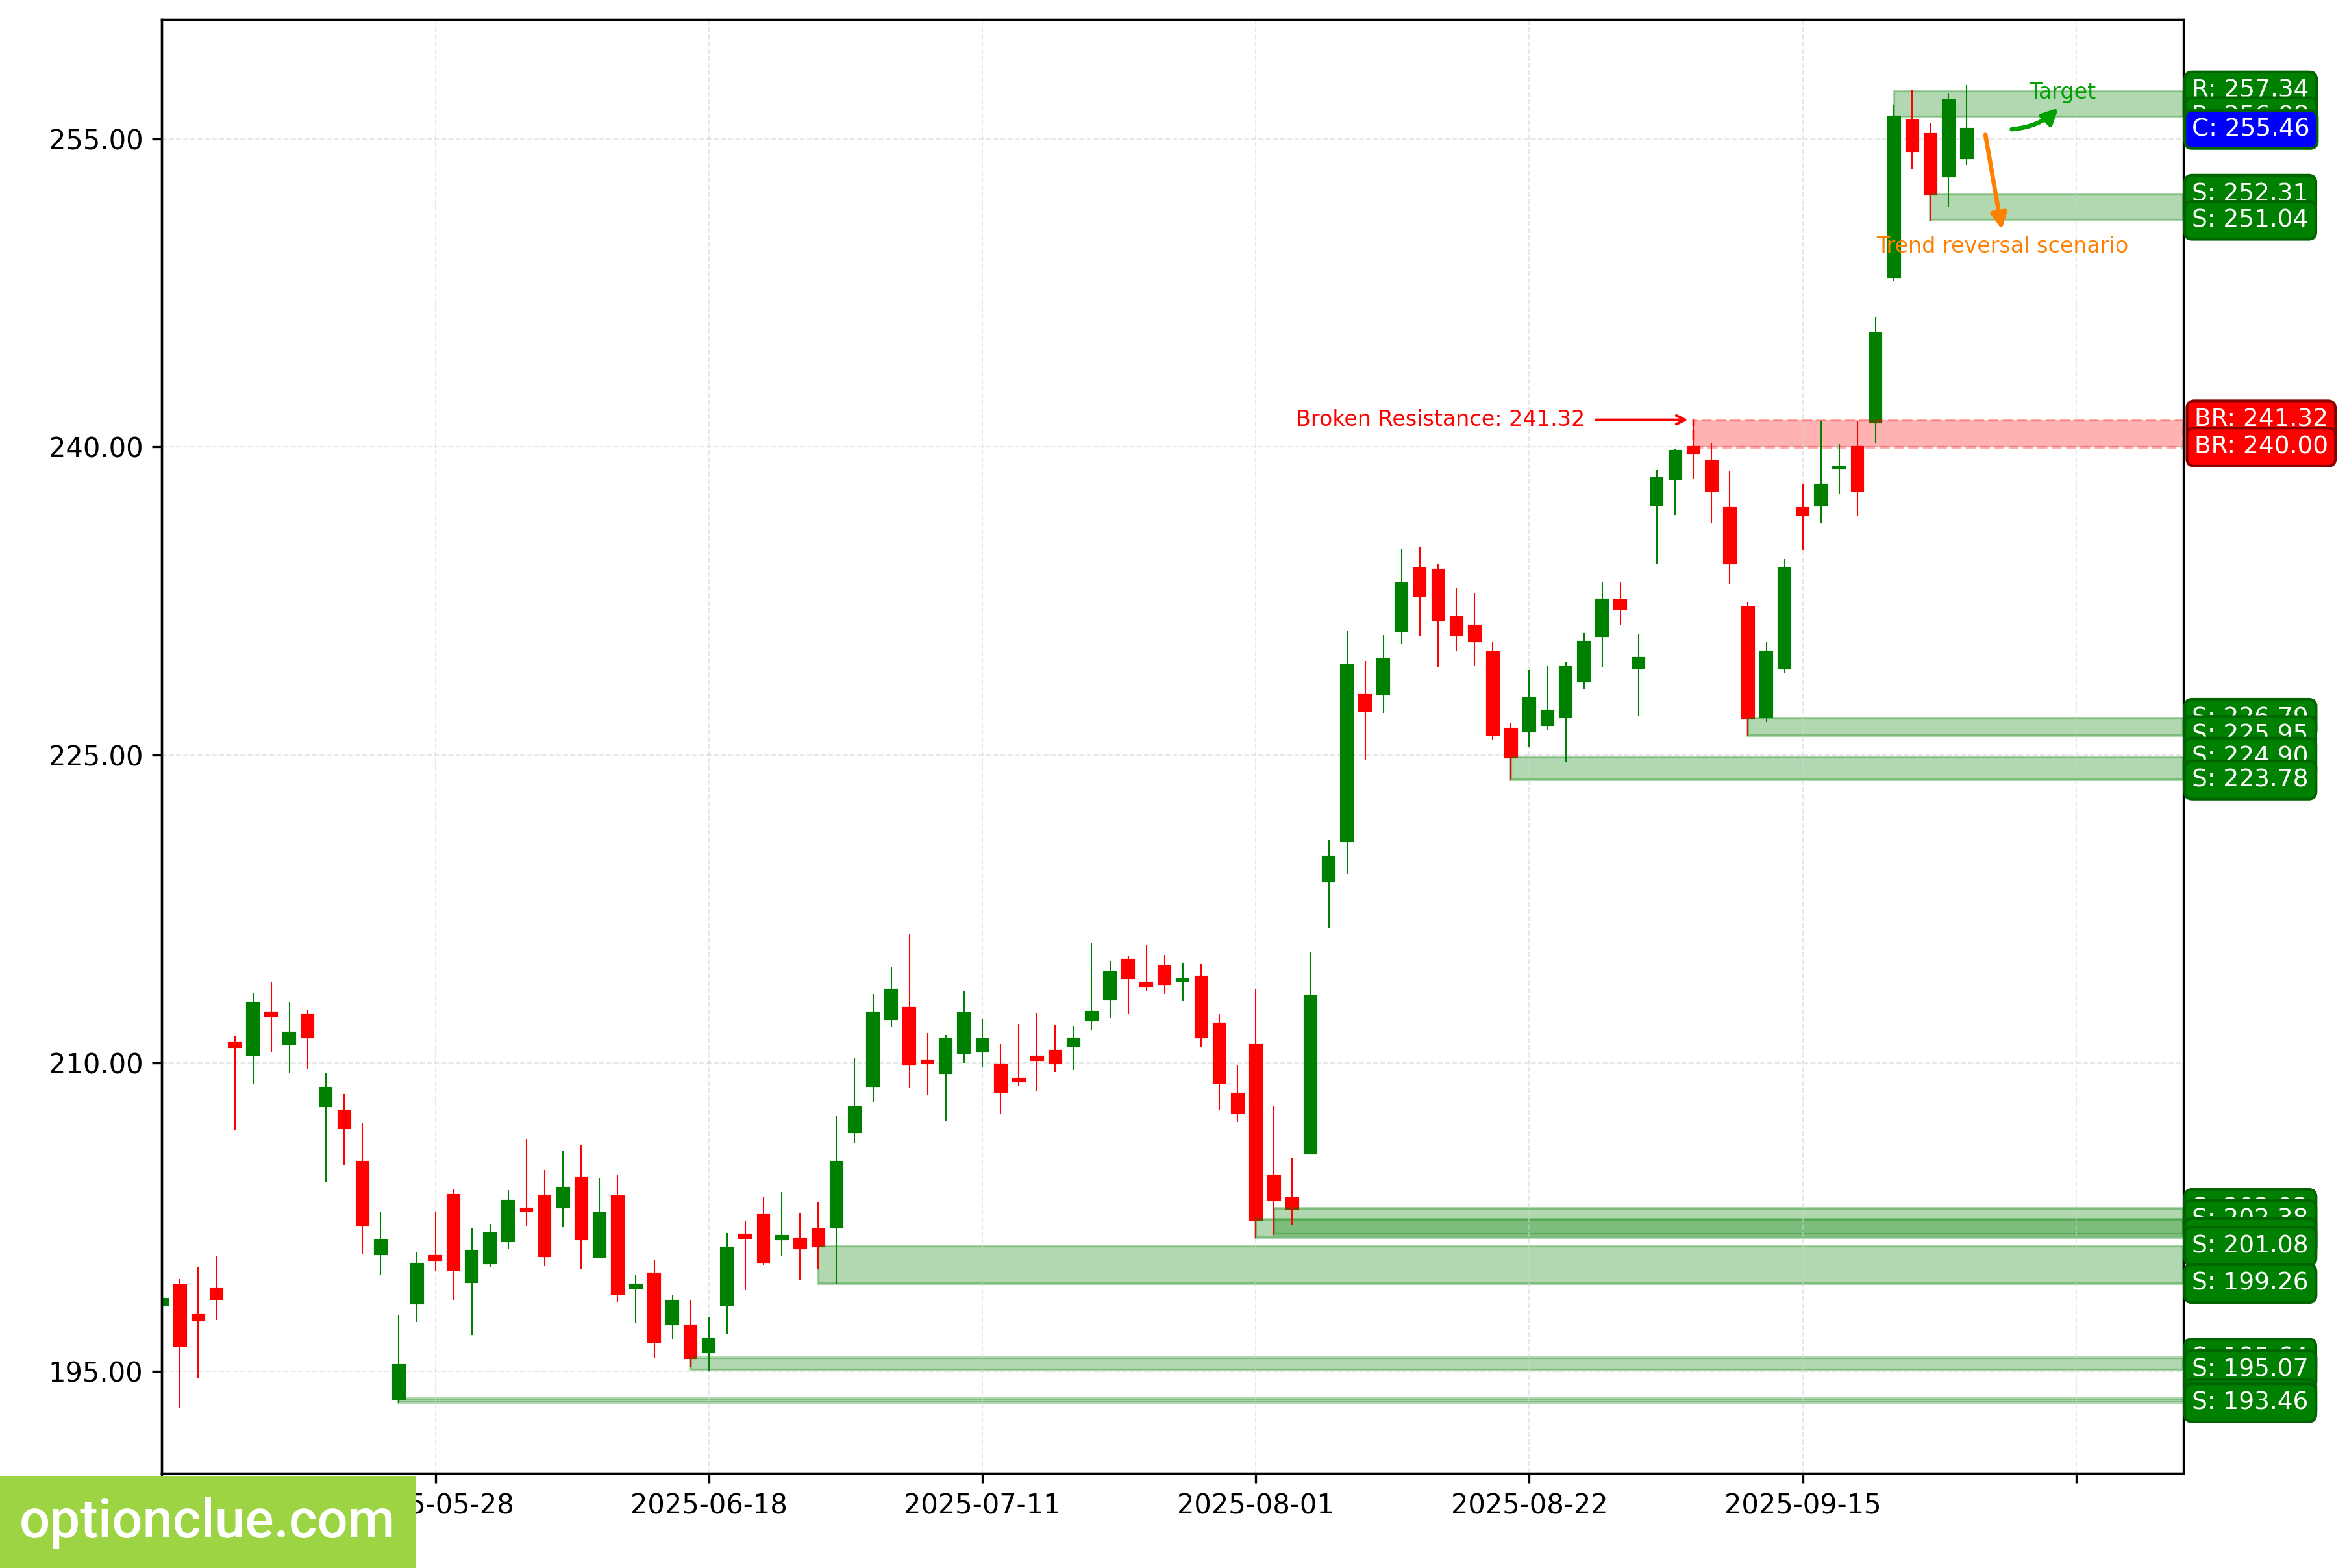
The market remains in a bullish trend; a corrective wave is developing.
The price is consolidating after a sharp rise. Until there is a breakout from the consolidation, either of support or resistance, new entry points on the daily timeframe look unattractive due to a low potential reward-to-risk ratio.
The nearest target is the resistance level with boundaries at 256.08 — 257.34. If the trend develops successfully, a more distant target will be at the resistance level with boundaries at 259.02 — 260.10.
Long positions will remain relevant as long as the market stays above the nearest support level with boundaries at 251.04 —
252.31. In the event of a confirmed breakout of this price zone, the medium-term trend will turn bearish.
AAPL. Technical analysis. D1.
NVIDIA Corp (NVDA)
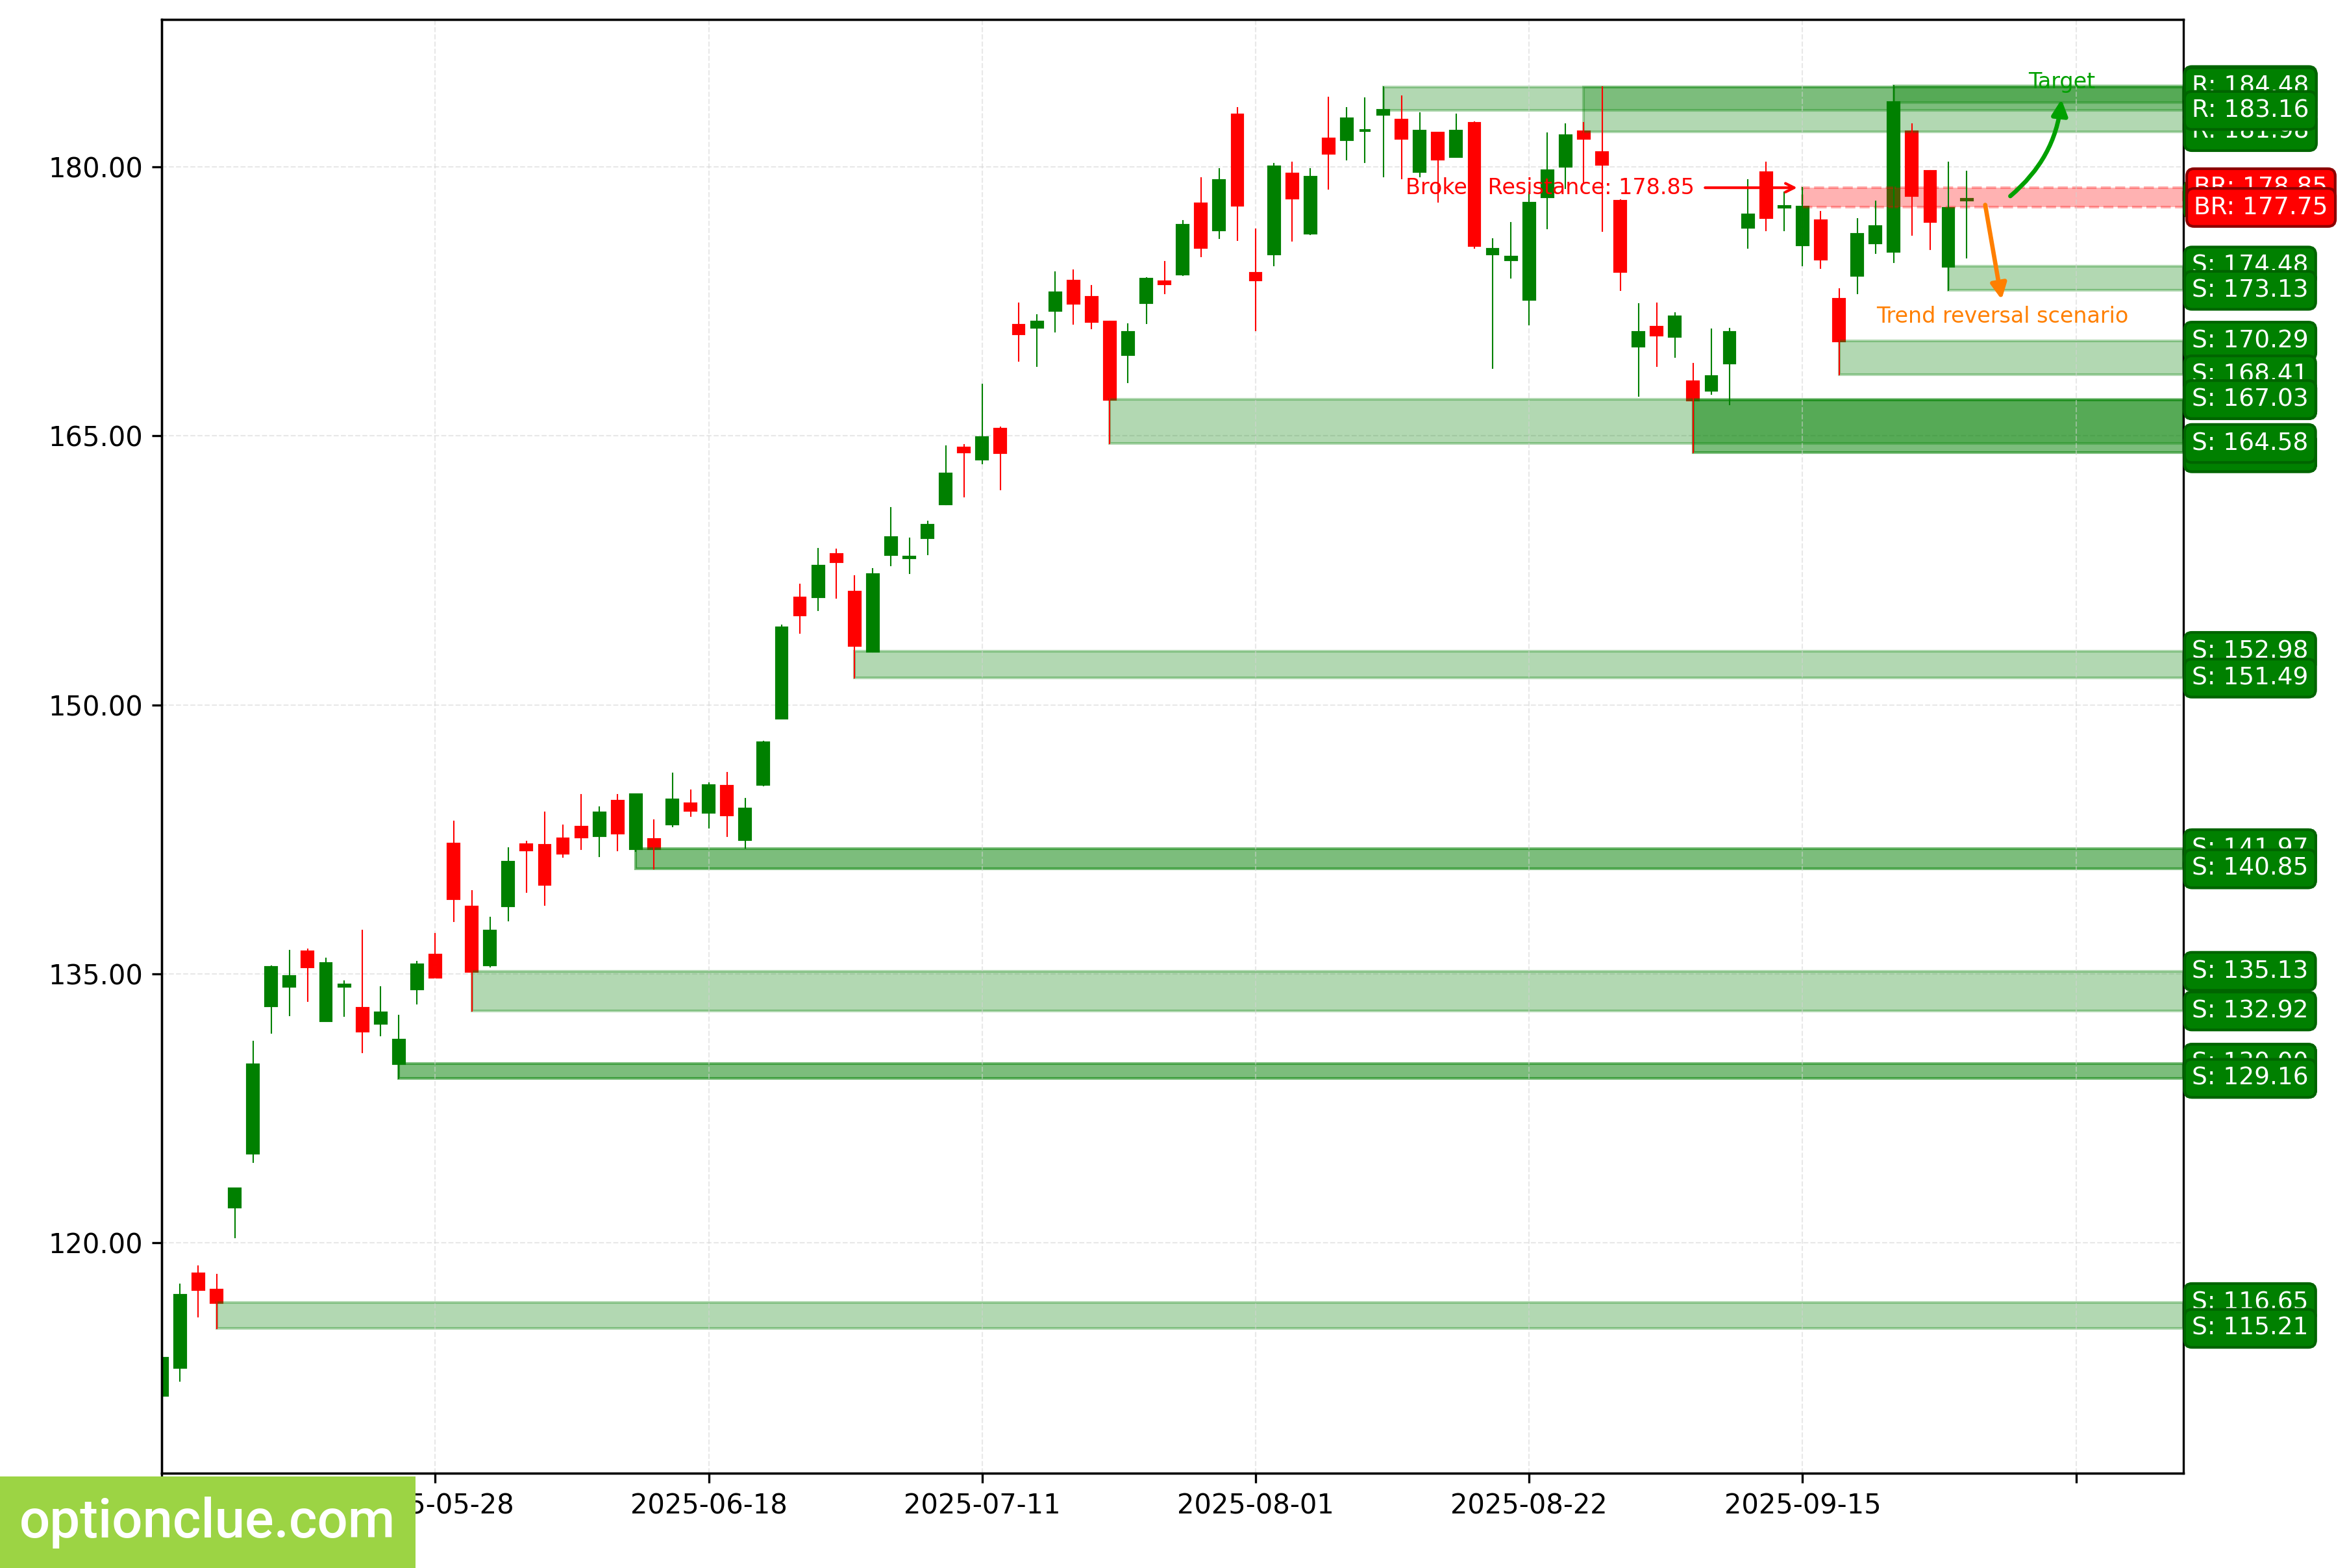
The trend changed to bullish when the resistance level (177.75 — 178.85) was broken last week.
An impulse wave is developing on the daily timeframe. A buy entry point on a rebound may appear after the formation of a complete correction.
An intermediate target for the upward movement is the resistance level with boundaries at 183.61 — 184.55. Long positions will remain relevant as long as the market stays above the nearest support level with boundaries at 173.13 — 174.48.
NVDA. Technical analysis. D1.
Tesla Inc (TSLA)
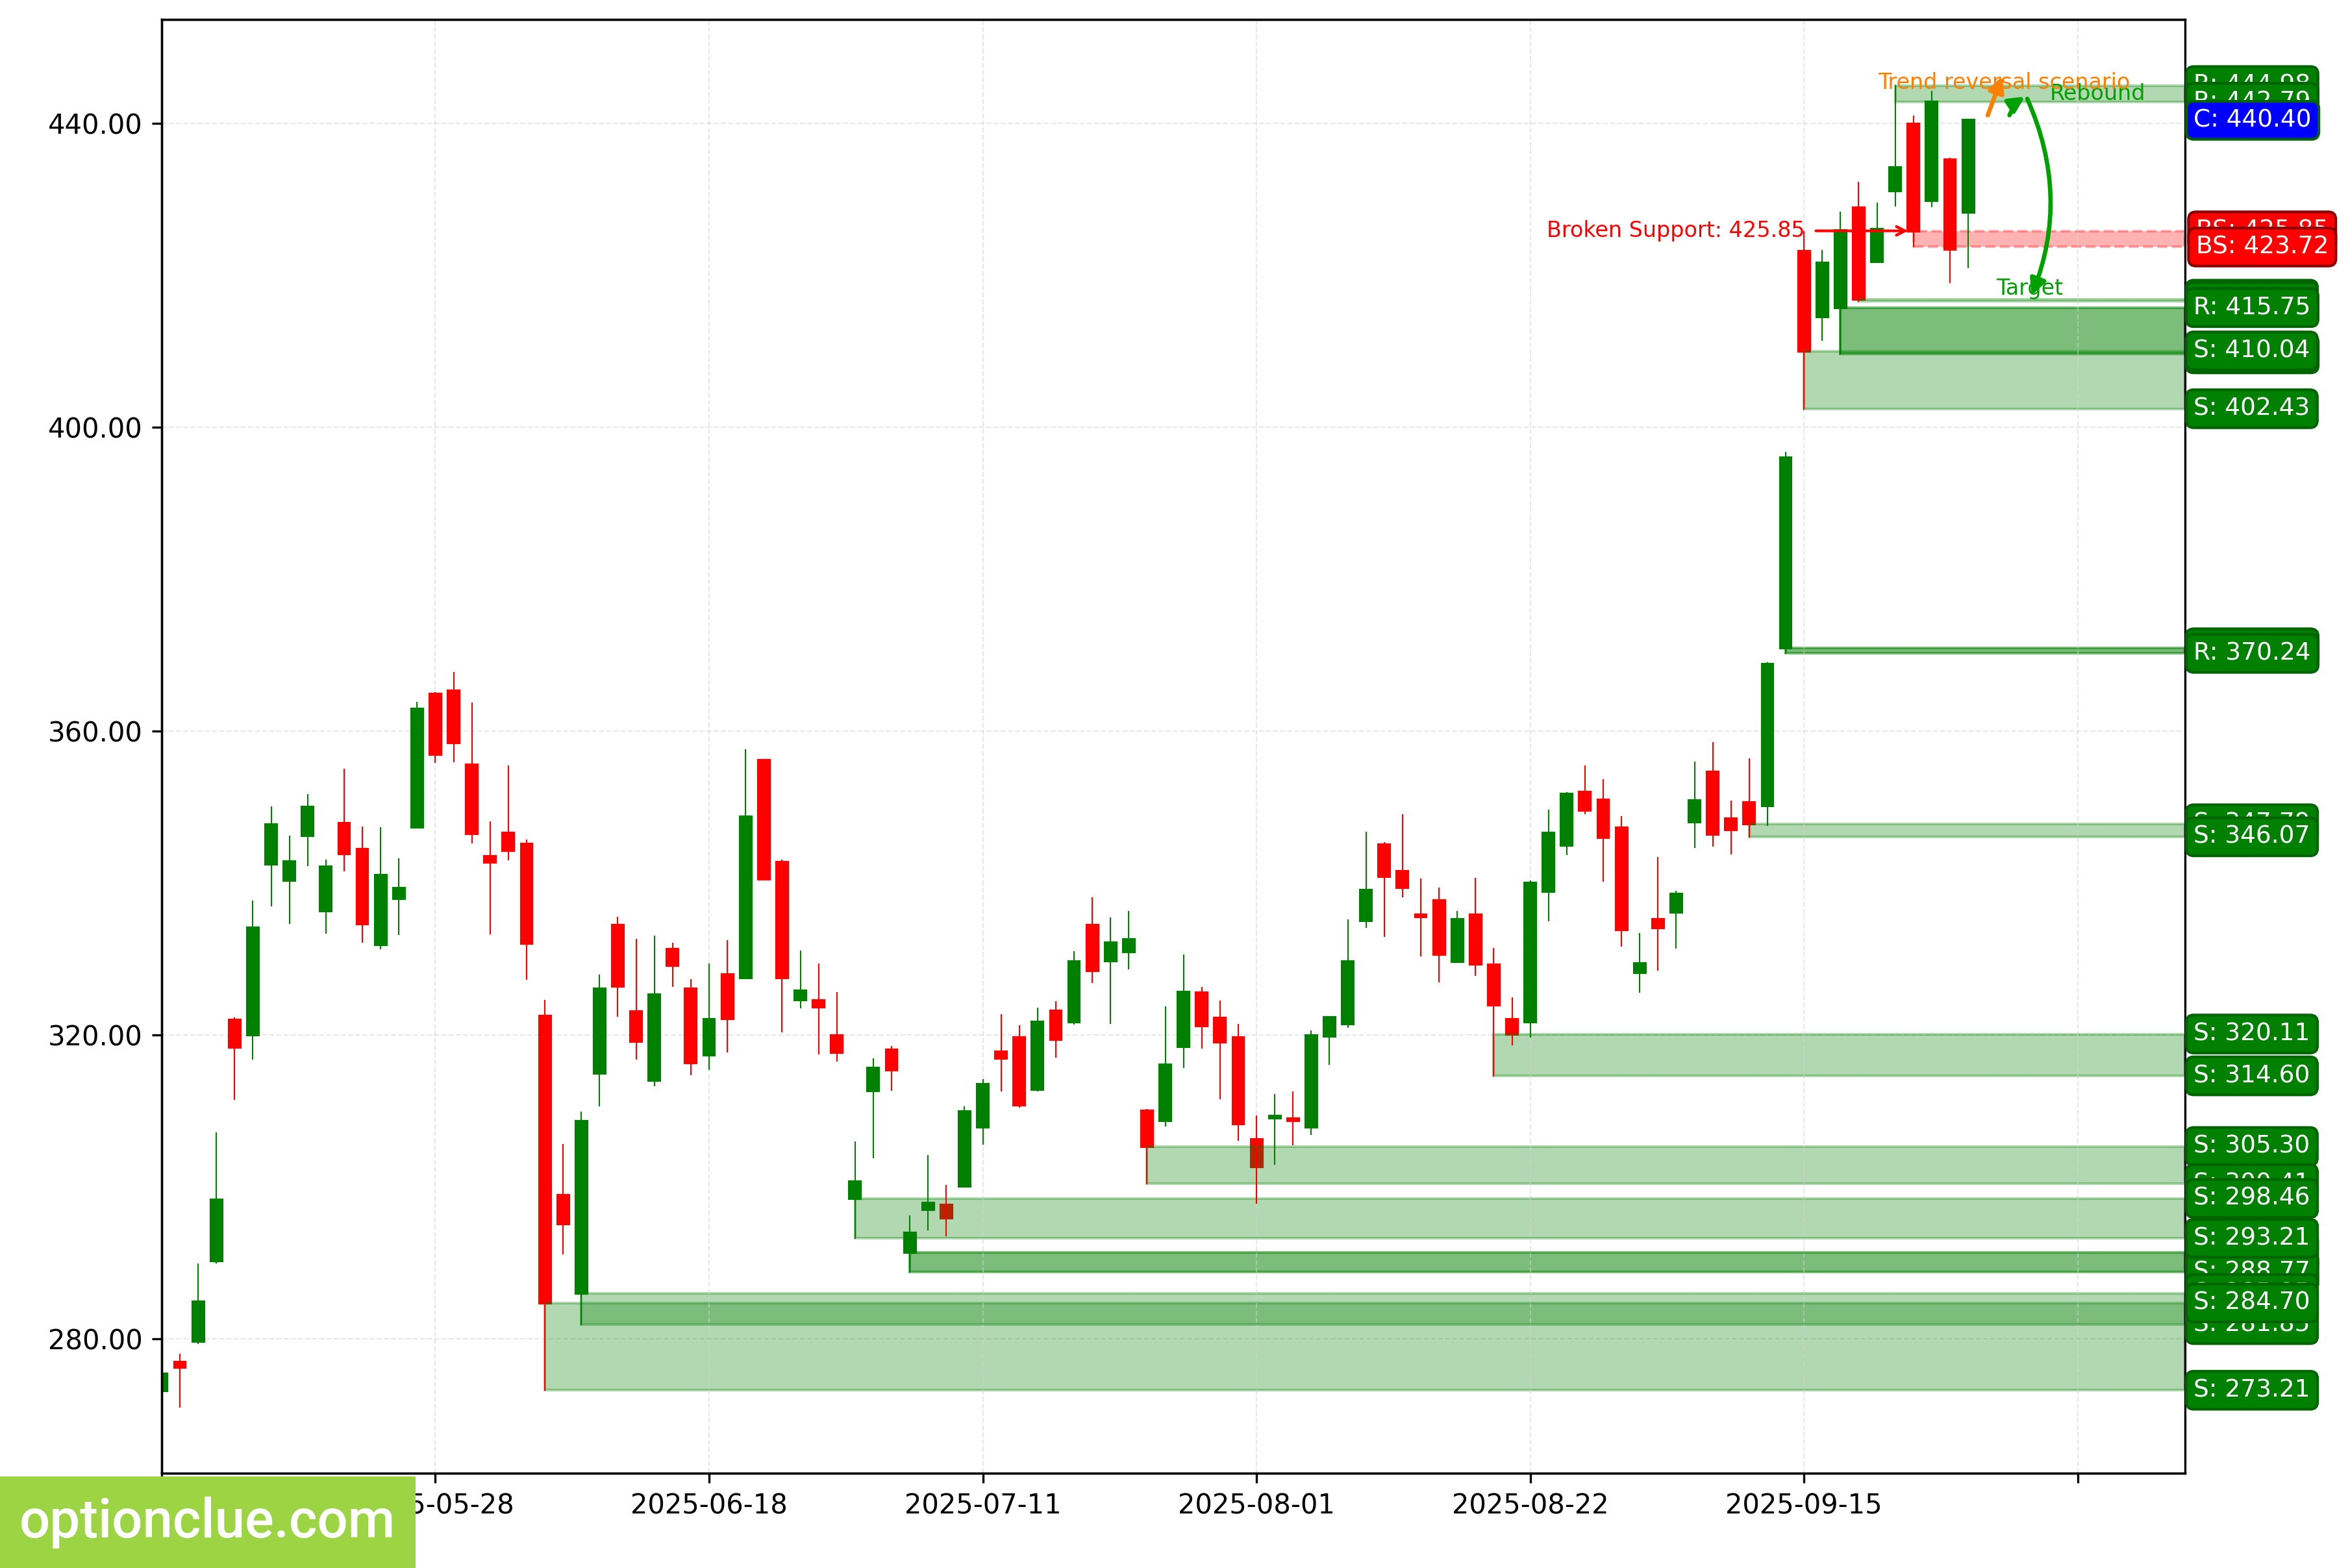
The trend changed to bearish when the support level (423.72 — 425.85) was broken last week.
However, the price continues to consolidate after a sharp rise. Until there is a breakout from the consolidation, either of support or resistance, new entry points on the daily timeframe look unattractive due to a low potential reward-to-risk ratio.
For the downward movement, the first target will be the support level with boundaries at 416.56 — 416.85, and the next at 409.67 — 415.75. Short positions will remain relevant as long as the market stays below the nearest resistance level with boundaries at 442.79 — 444.98.
TSLA. Technical analysis. D1.
Summary
In the medium term, EURUSD, GBPUSD, USDCHF, USDJPY, and AUDUSD stand out with a correction on the daily timeframe that is nearing completion.
The other assets may be of interest depending on the depth of the market correction, or the direction of the breakout from
consolidation (TSLA, AAPL).