
Weekly technical breakdown: daily levels and actionable setups. For each asset we provide context, entry conditions, and invalidation of trading ideas.
Key topics
- Euro (EURUSD)
- British Pound (GBPUSD)
- Swiss franc (USDCHF)
- Japanese yen (USDJPY)
- Canadian dollar (USDCAD)
- Australian dollar (AUDUSD)
- New Zealand dollar (NZDUSD)
- Bitcoin (BTC)
- Ether (ETH)
- Apple Inc (AAPL)
- NVIDIA Corp (NVDA)
- Tesla Inc (TSLA)
- Summary
Euro (EURUSD)
The market remains in a bearish trend. The last broken level is support (1.1645 — 1.1665). The correction ended 6 days ago, after which the price declined and an impulse wave developed.
A corrective wave is forming again. The interim target for the down move is the support level at 1.1576 — 1.1598.
If the market breaks this support, the next target can be the support level at 1.1540 — 1.1568. A sell entry on a rebound may appear after the current correction completes on the daily timeframe.
If the new correction ends near the last broken level (1.1645 — 1.1665), the potential reward/risk ratio may be low (about 0.7:1). If the market corrects to the resistance level (1.1687 — 1.1728), the potential reward/risk can be about 3:1.
Short positions will remain valid as long as the market stays below the nearest resistance level on the daily timeframe at 1.1687 — 1.1728.
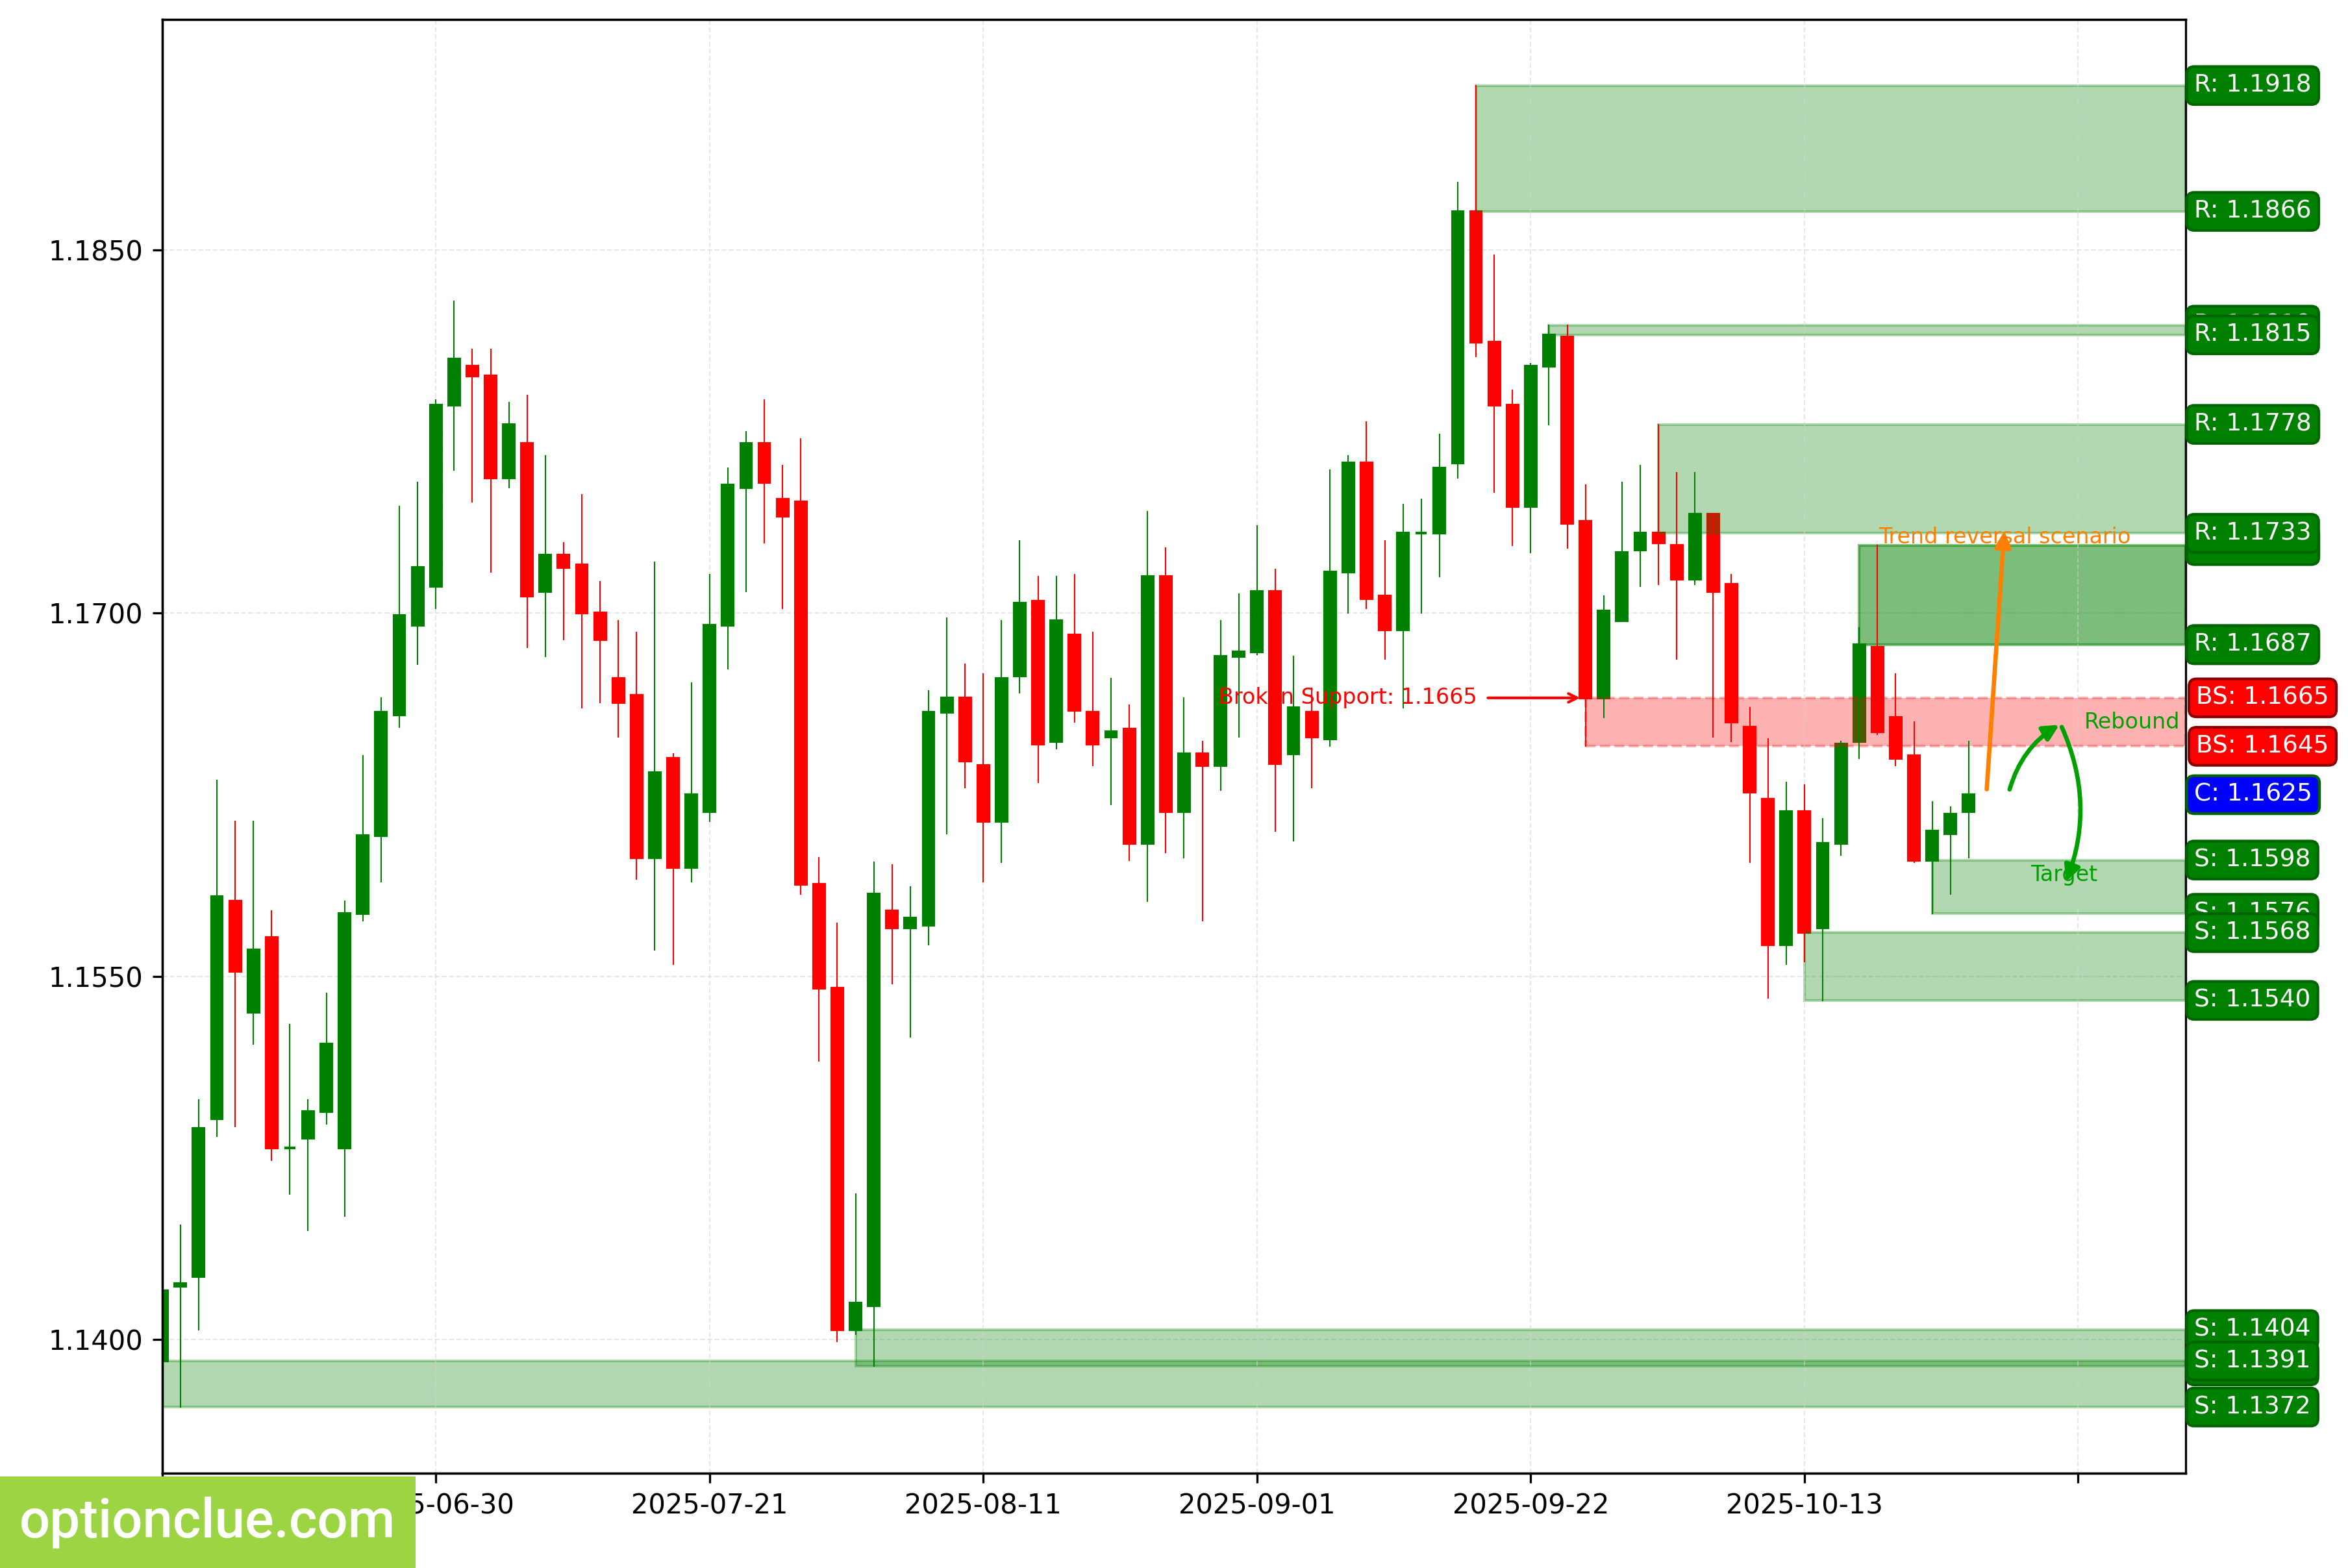
EURUSD. Technical analysis. D1.
British Pound (GBPUSD)
The bullish trend continues, a corrective wave is developing. The last broken level is resistance (1.3358 — 1.3370). The breakout occurred 7 days ago. A buy entry on a rebound may appear after the current correction ends.
If the up move resumes, the first target can be resistance at 1.3436 — 1.3471. If the trend develops successfully, the next target can be the resistance level at 1.3484 — 1.3490.
If the correction ends near the support level (1.3245 — 1.3316), the potential reward/risk can be about 3:1.
Long positions will remain valid as long as the market is above the nearest support level at 1.3245 — 1.3316. A break of this level would indicate a trend reversal.
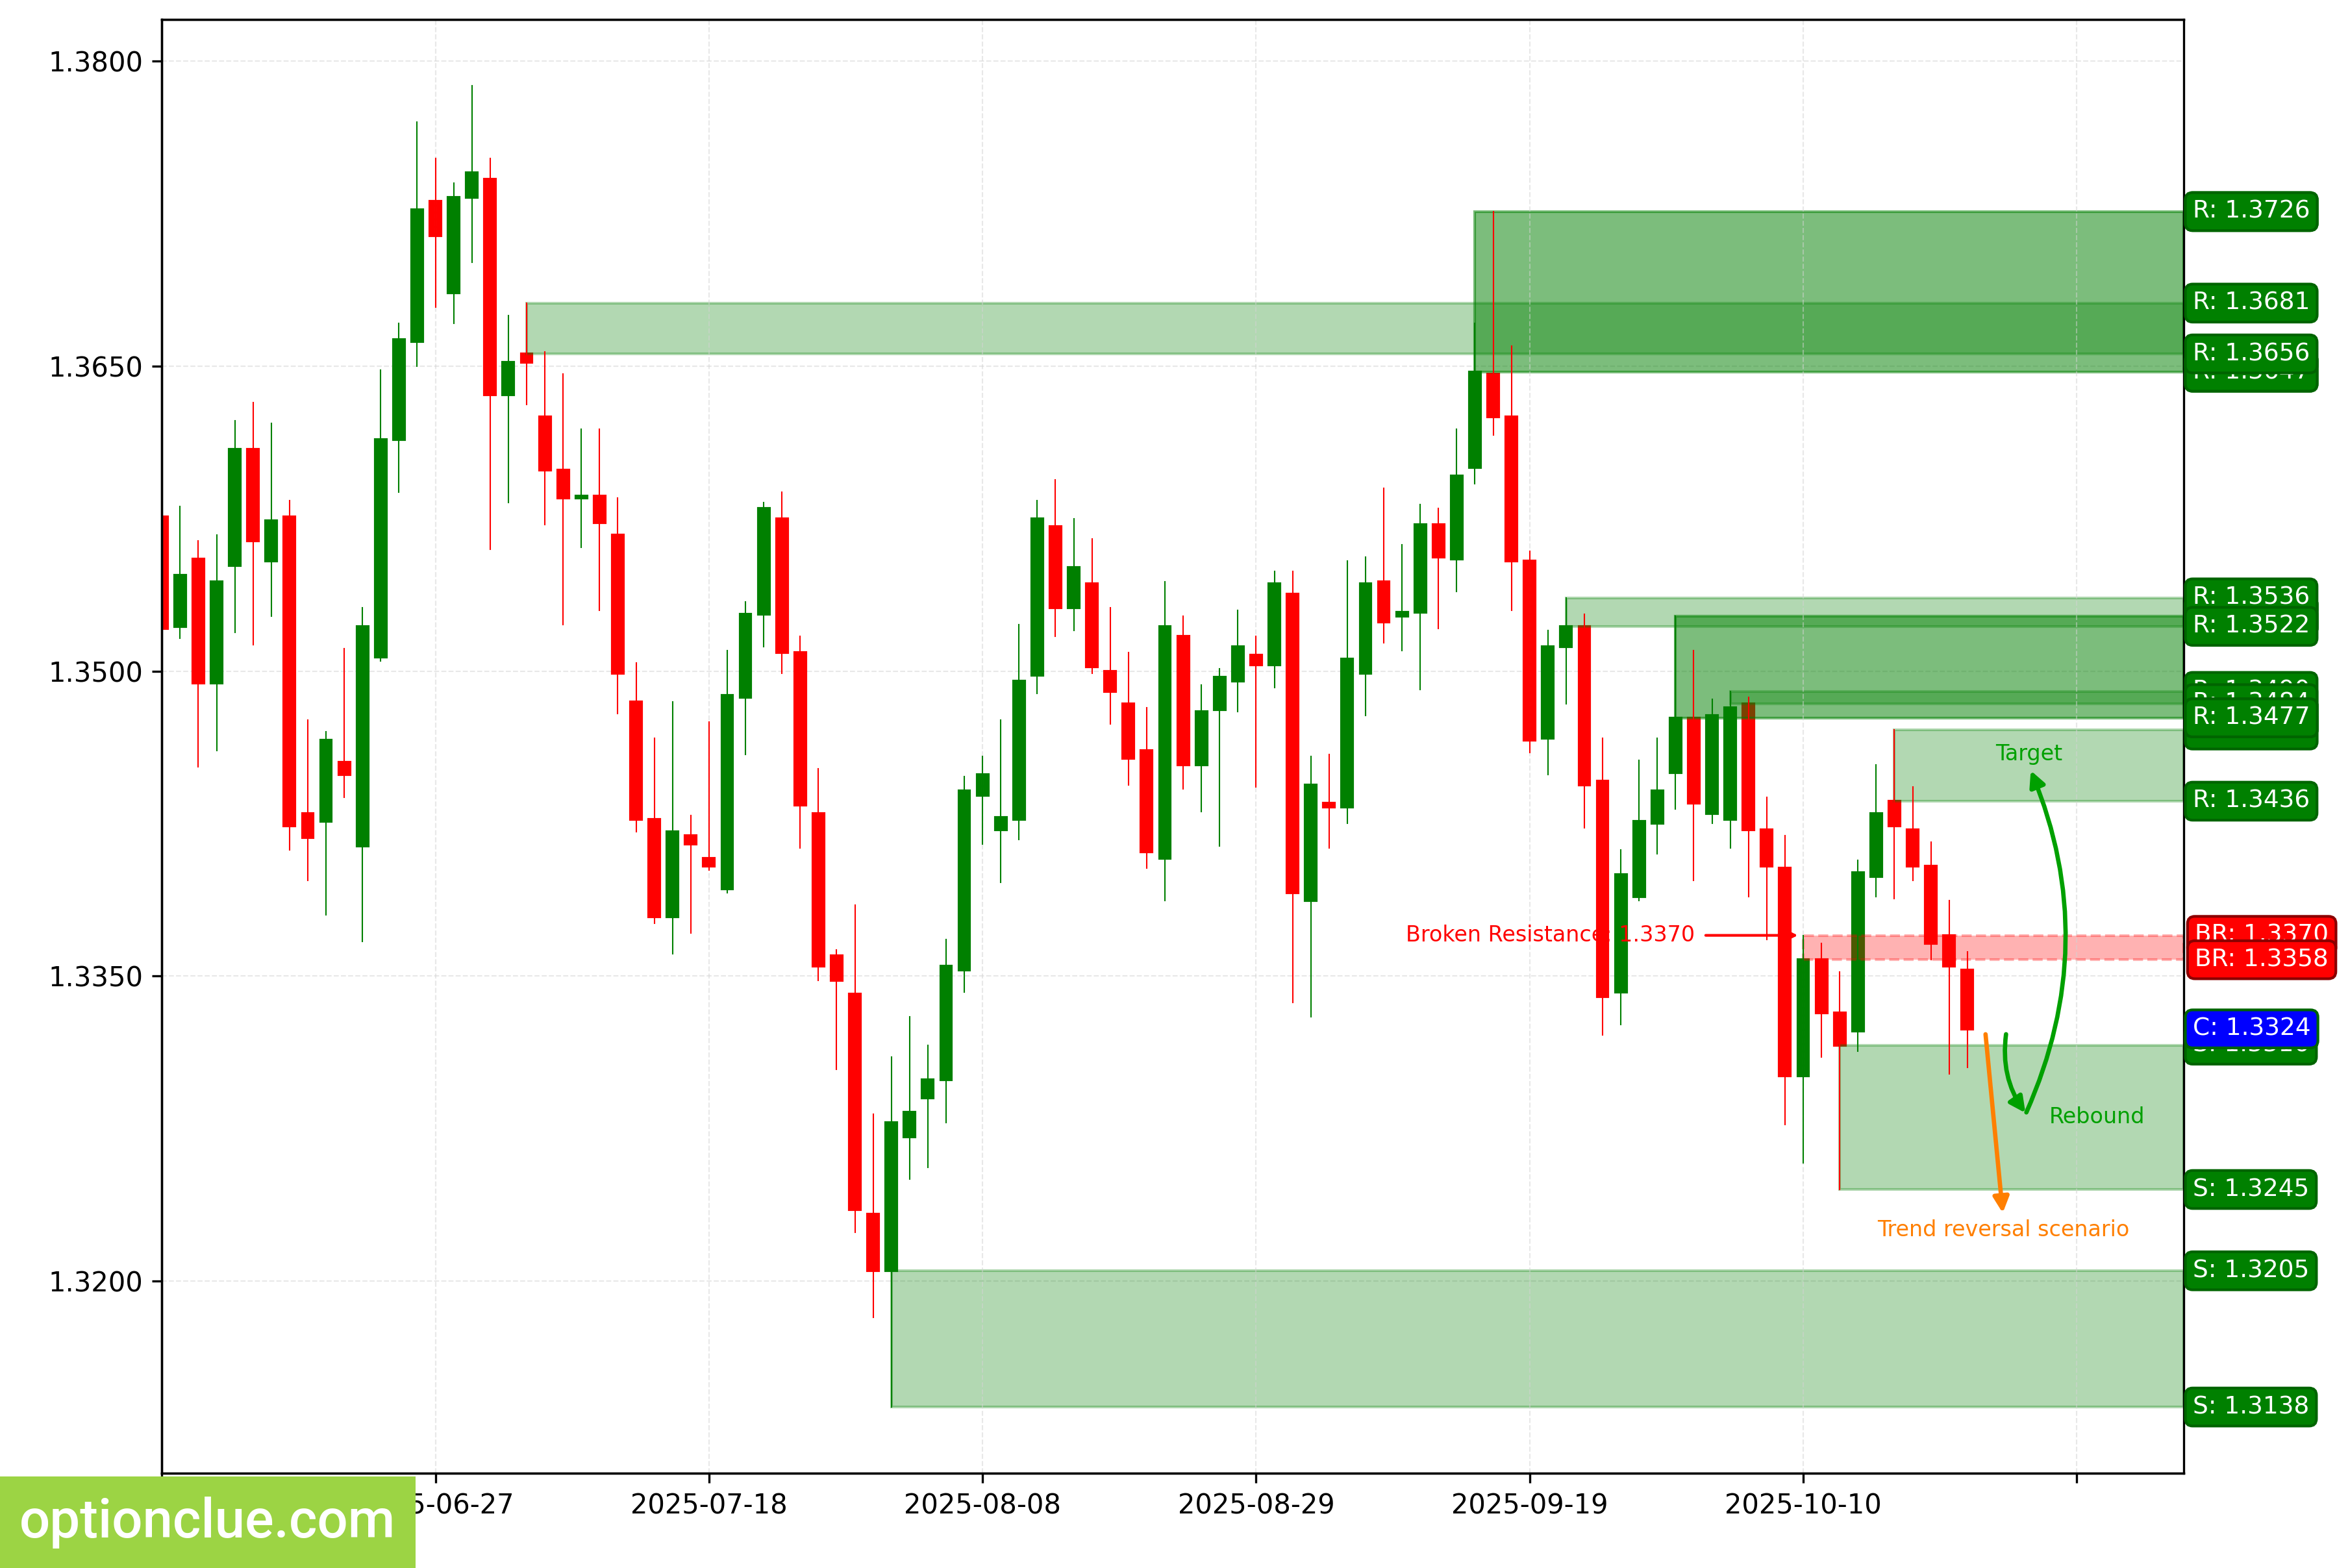
GBPUSD. Technical analysis. D1.
Swiss franc (USDCHF)
The bearish trend continues. The last broken level is support (0.7987 — 0.7989). The breakout occurred 8 days ago. The correction ended 3 days ago. An impulse wave is developing.
The interim target for the down move is the support level at 0.7870 — 0.7917. If the trend develops successfully, the next target can be the support level at 0.7827 — 0.7855.
Short positions will remain valid as long as the market remains below the nearest resistance level at 0.7961 — 0.7986.
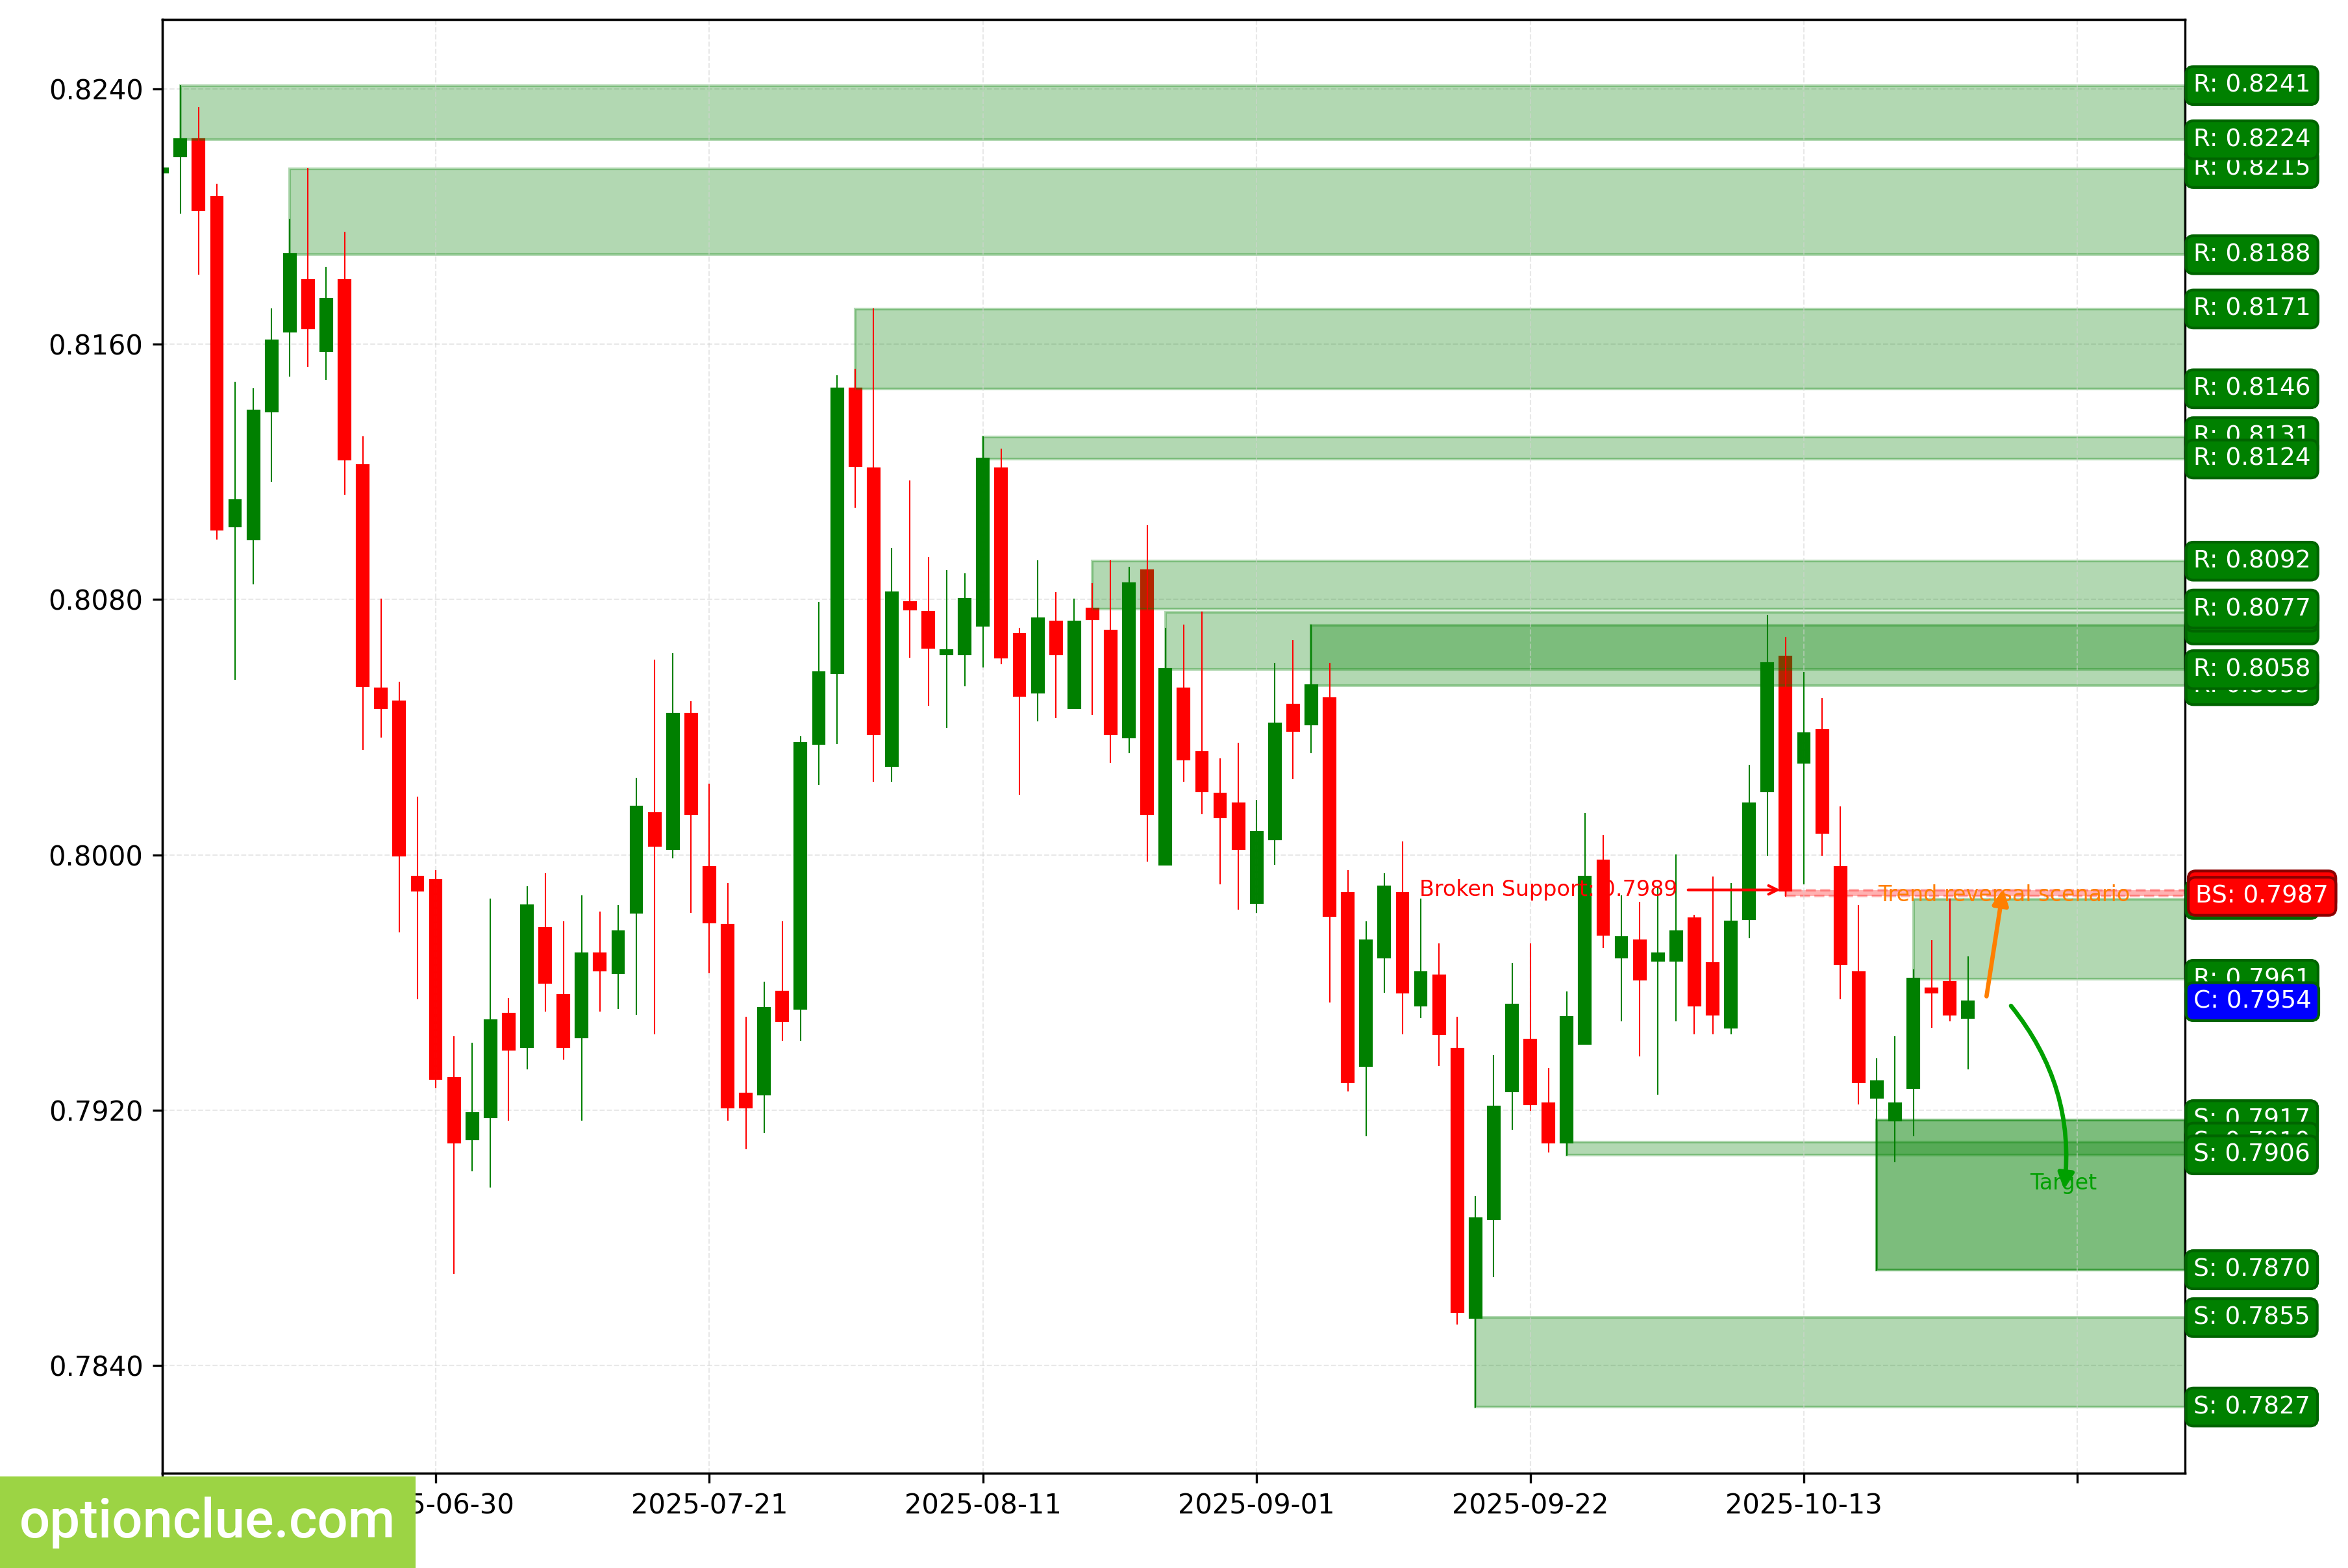
USDCHF. Technical analysis. D1.
Japanese yen (USDJPY)
The bullish trend continues. The last broken level is resistance (152.27 — 152.61). The breakout occurred 1 day ago; an impulse wave is developing. New buy entries on a rebound on the daily timeframe will appear after a correction forms.
The interim target for the up move is the resistance level at 154.41 — 154.80. If the market secures above this resistance, it will open the way toward target #2 — the resistance level at 155.18 — 155.89.
If the correction ends near the last broken level (152.27 — 152.61), the potential reward/risk can be low, less than 1:1. If the market corrects to the support level (149.36 — 150.36), the potential reward/risk can be significantly higher.
Long positions will remain valid as long as the market is above the support level at 149.36 — 150.36.
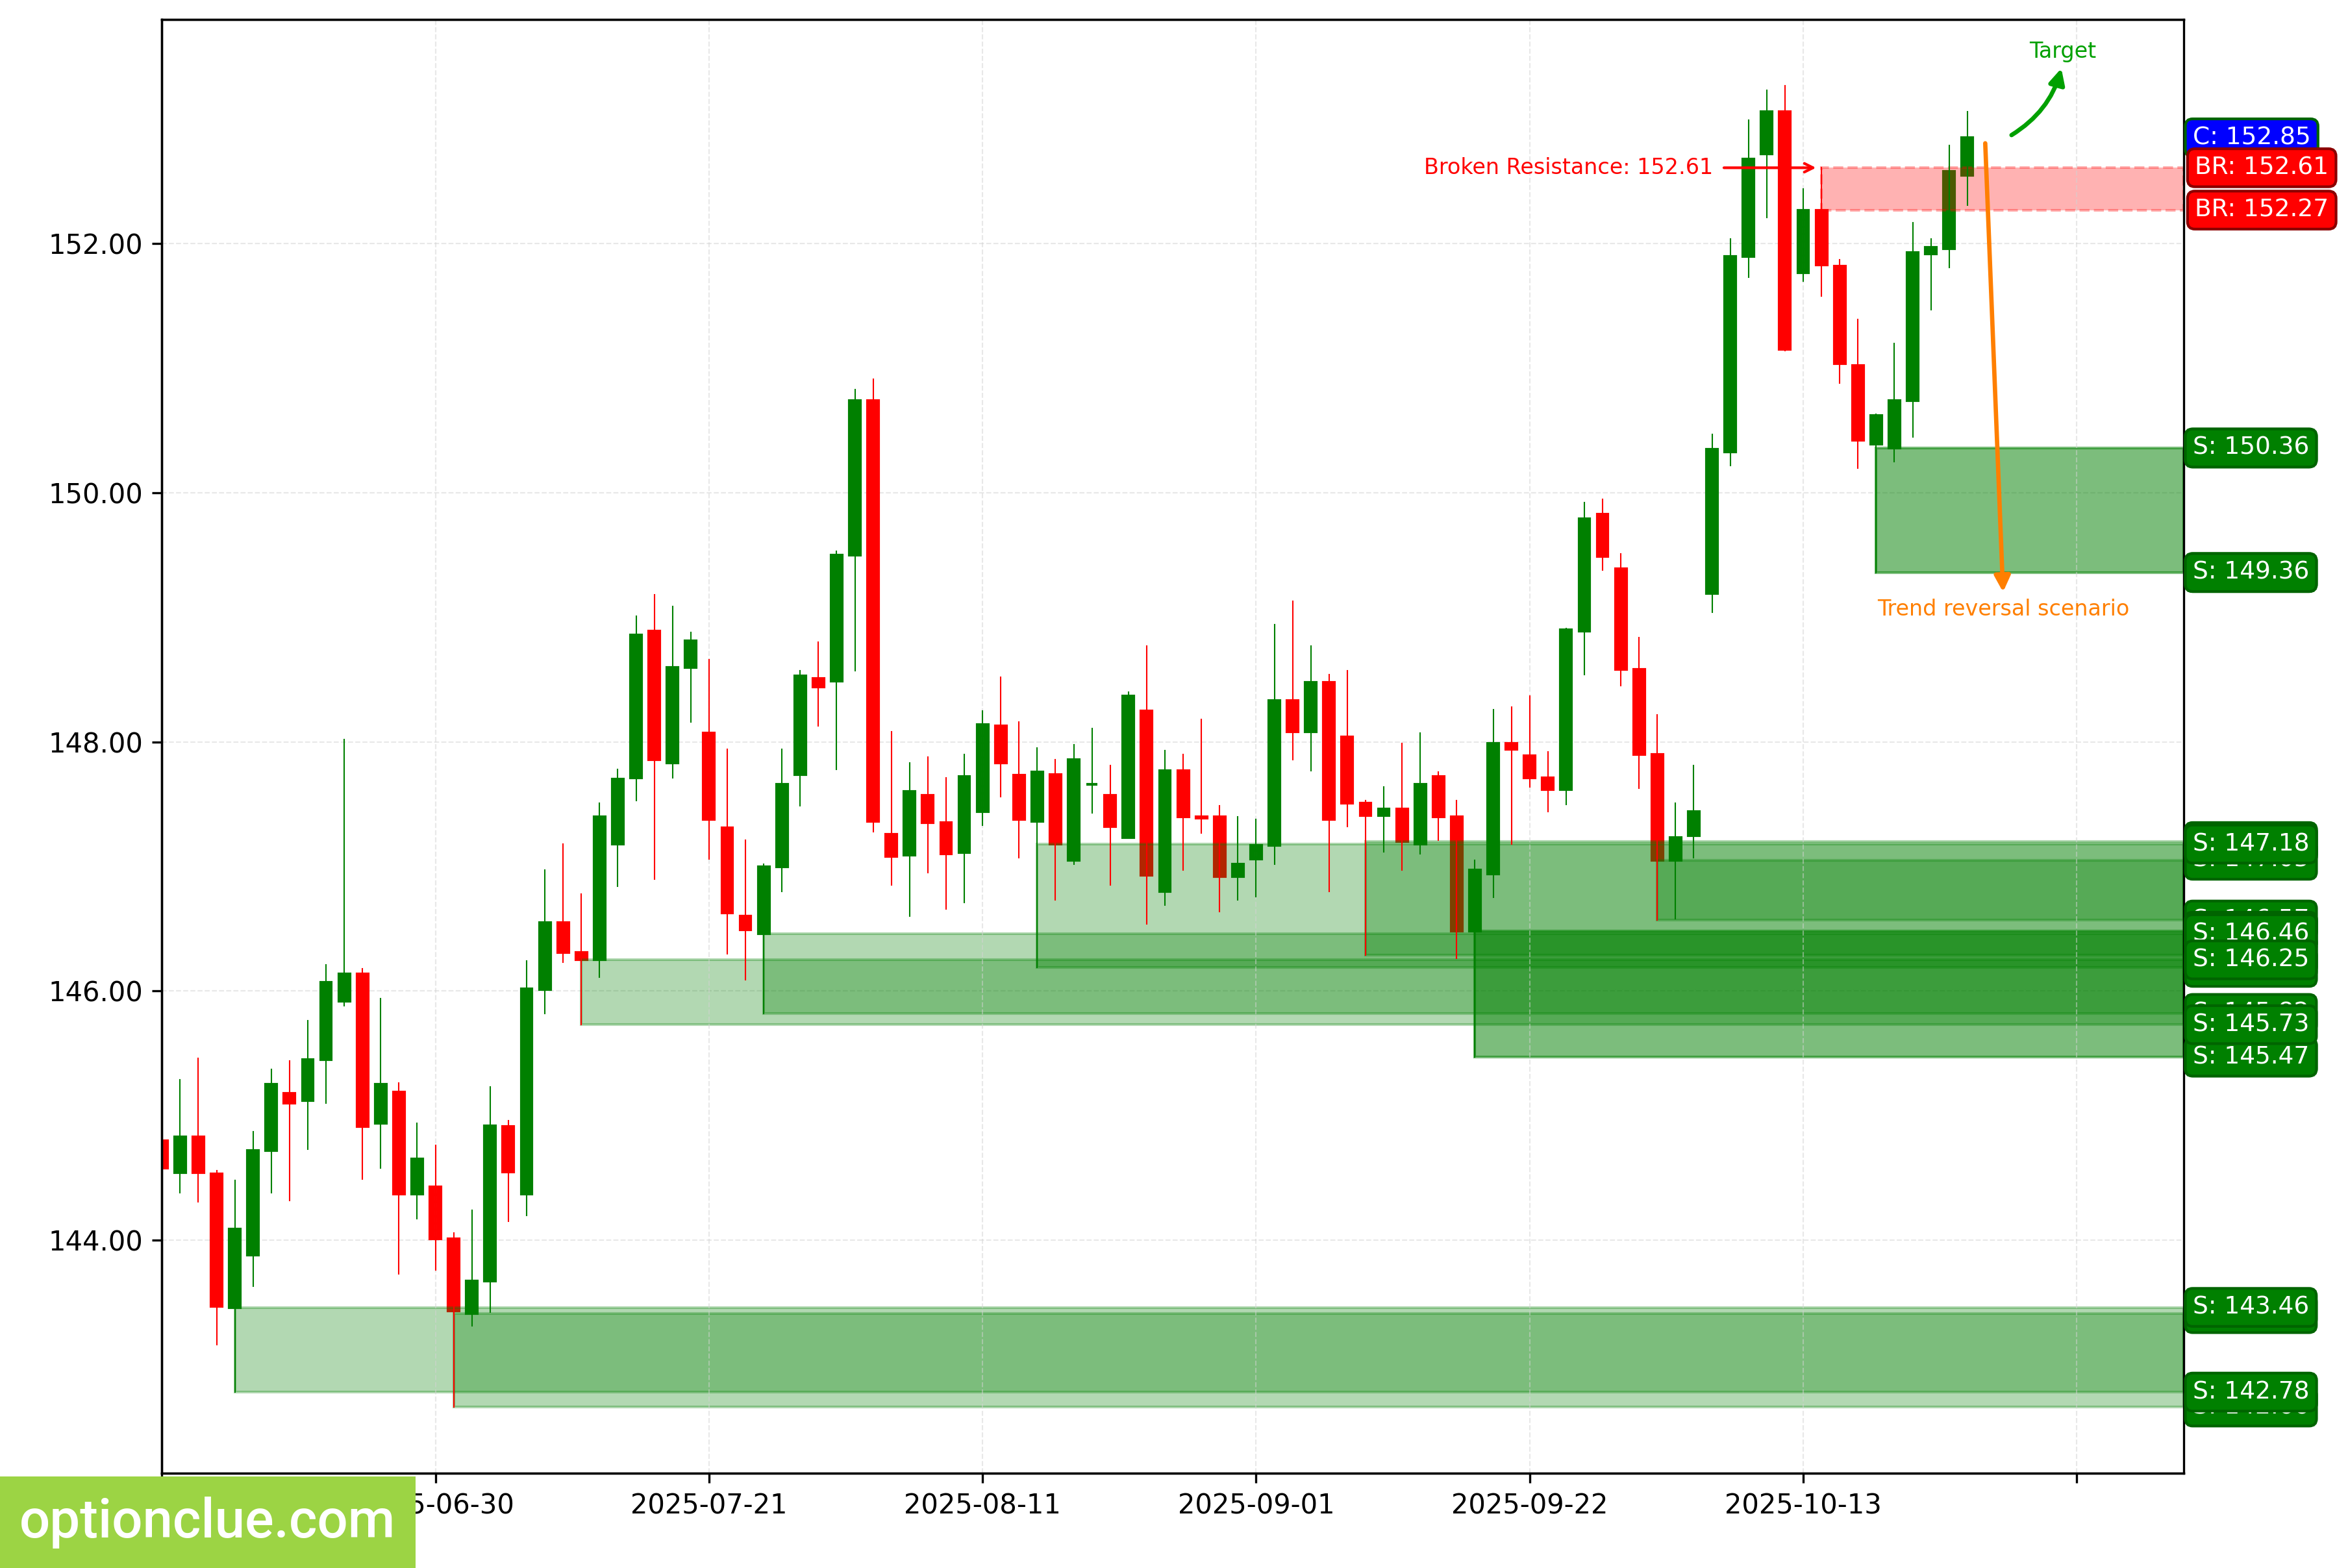
USDJPY. Technical analysis. D1.
Canadian dollar (USDCAD)
The bullish trend continues, a corrective wave is developing. The last broken level is resistance (1.3966 — 1.3986). The breakout occurred 11 days ago. A buy entry on a rebound may appear after the current correction on the daily timeframe ends.
The interim target for the up move is the resistance level at 1.4036 — 1.4065. If the market secures above this resistance, it will open the way toward target #2 — the resistance level at 1.4385 — 1.4415.
If the new correction ends near the last broken level (1.3966 — 1.3986), the potential reward/risk can be low (about 1:1). If the market corrects to the support level (1.3930 — 1.3941), the potential reward/risk can be about 4:1.
Long positions will remain valid as long as the market is above the nearest support level on the daily timeframe at 1.3930 — 1.3941.
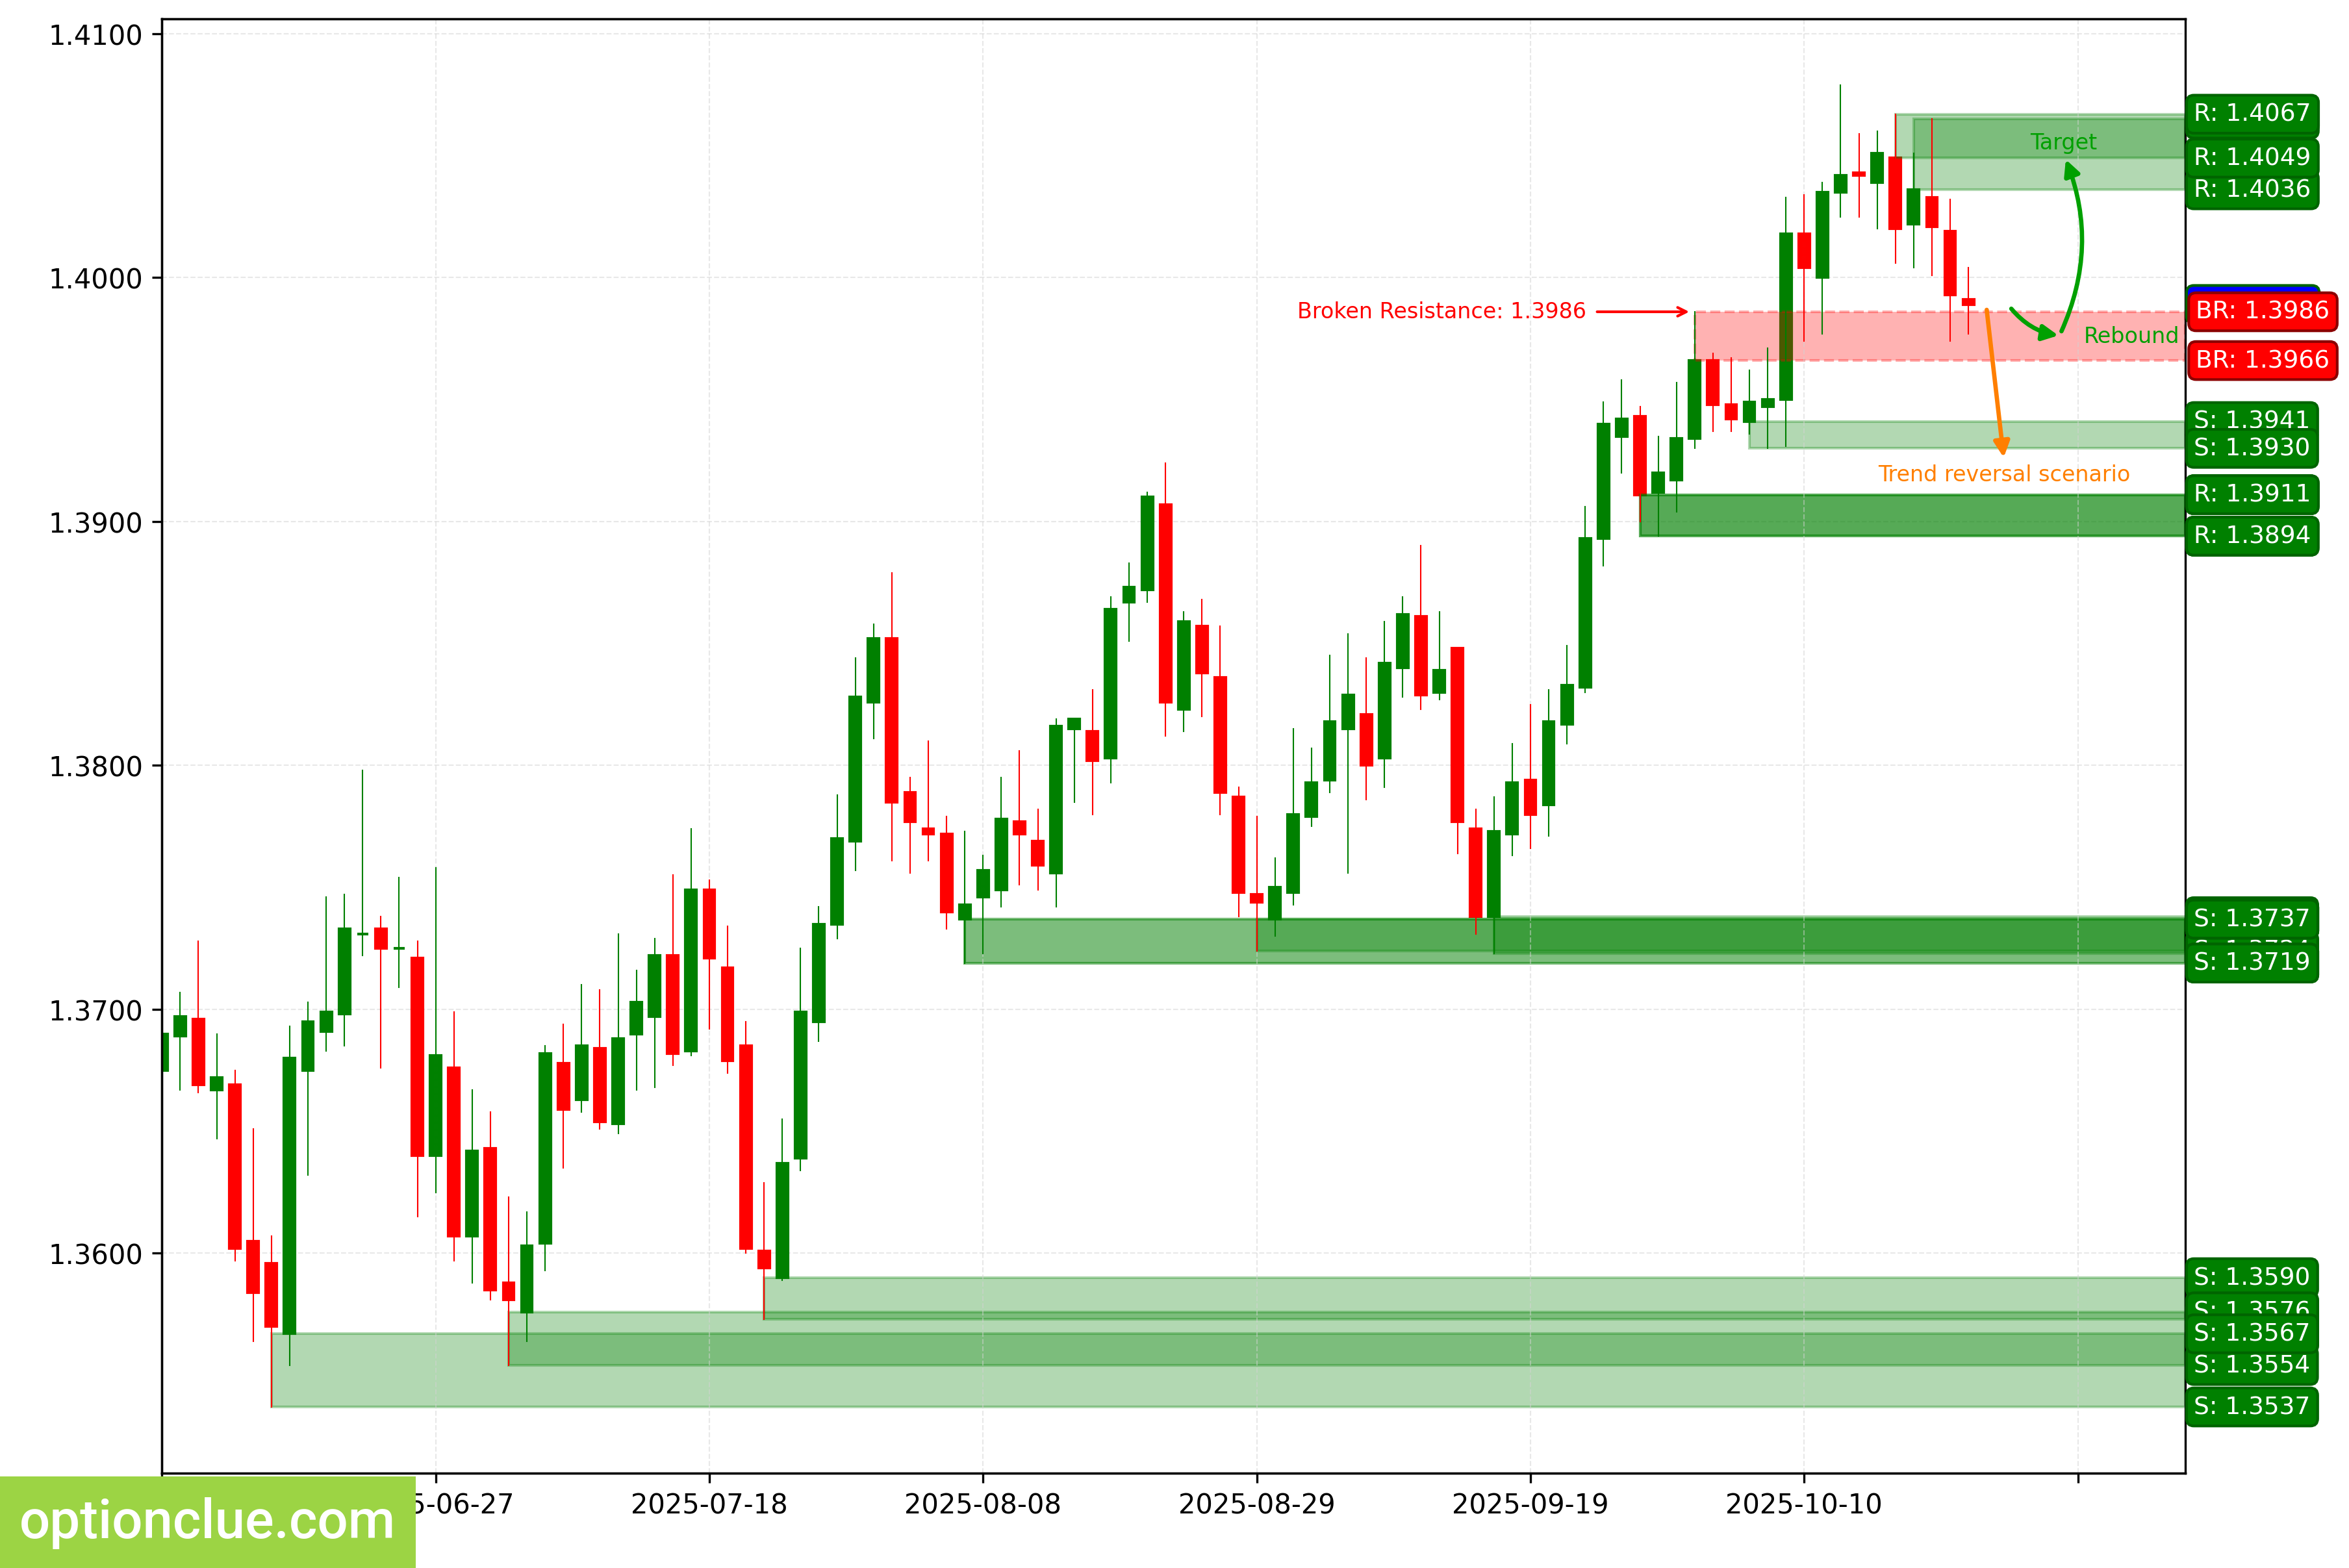
USDCAD. Technical analysis. D1.
Australian dollar (AUDUSD)
The market remains in a bearish trend, however price continues to consolidate. A correction toward the nearest resistance is forming on the daily timeframe. A sell entry on a rebound may appear after it completes.
If the down move resumes, the first target can be the support level at 0.6441 — 0.6482. If the trend develops successfully, the next target can be the support level at 0.6370 — 0.6437.
Short positions will remain valid as long as the market remains below the nearest resistance level at 0.6512 — 0.6525.
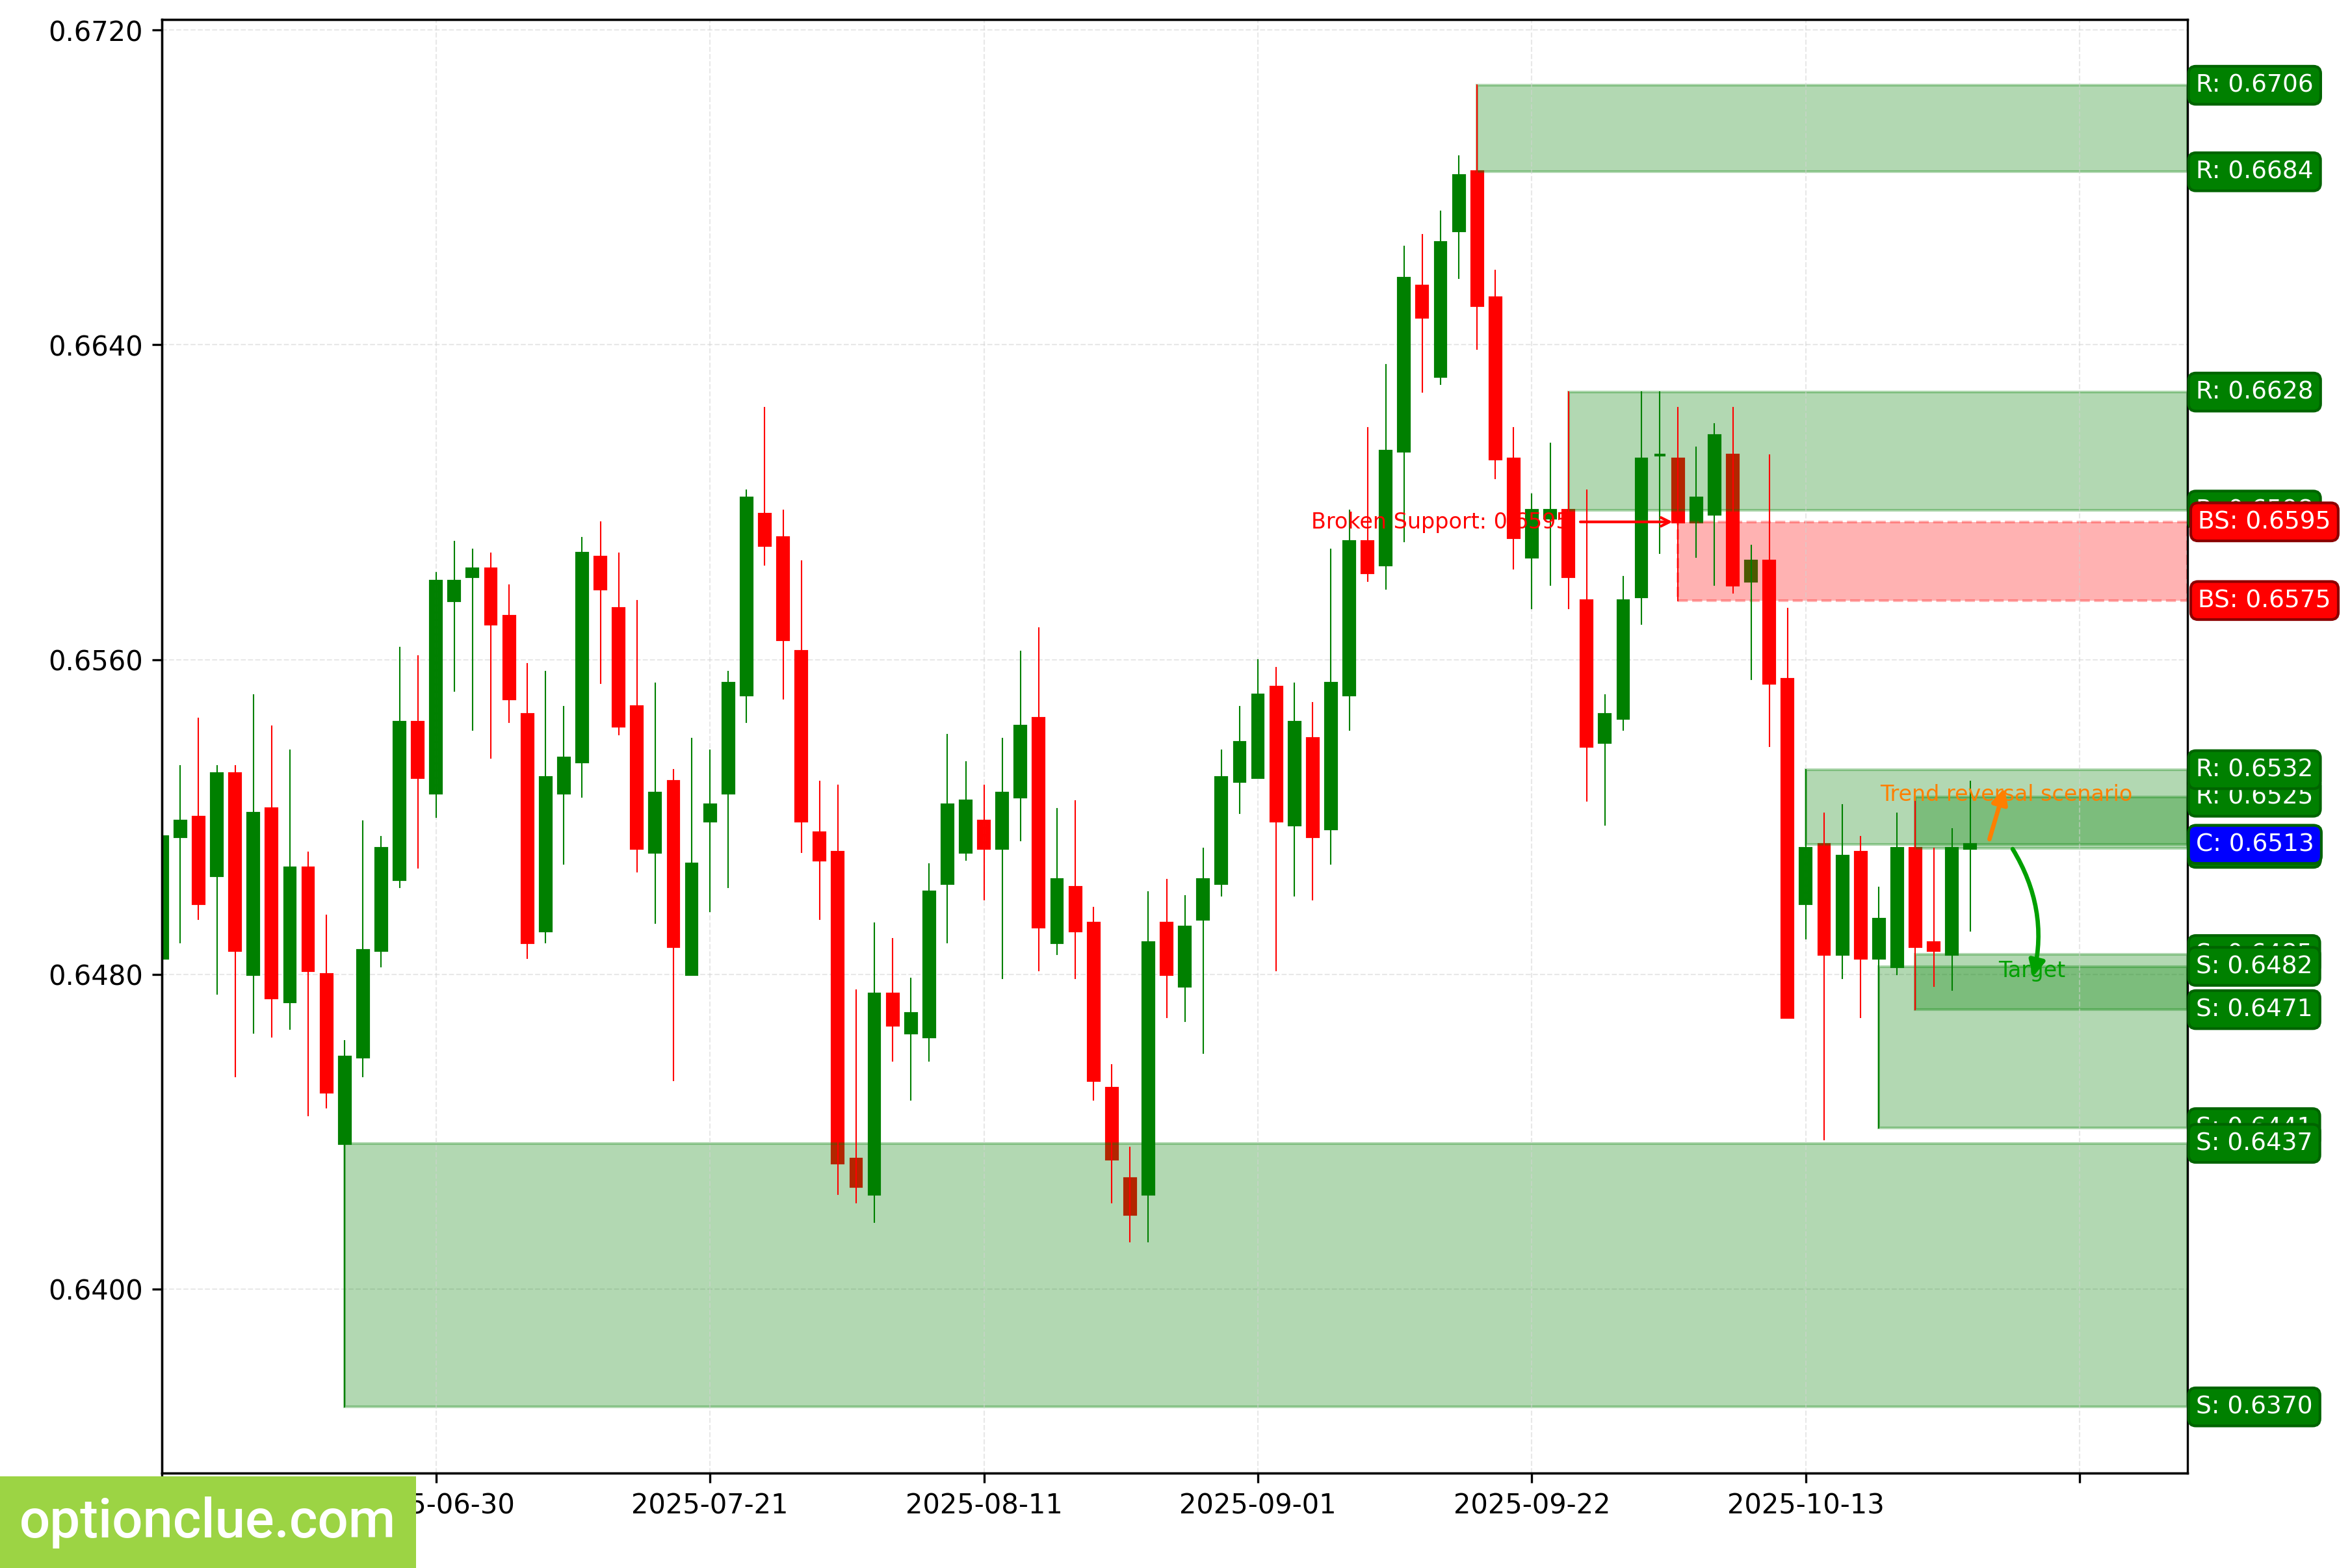
AUDUSD. Technical analysis. D1.
New Zealand dollar (NZDUSD)
The bearish trend continues, a corrective wave is developing. The last broken level is support (0.5752 — 0.5763). The breakout occurred 12 days ago. The correction likely ended on Friday.
The interim target for the down move is the support level at 0.5681 — 0.5713. If the trend develops successfully, the next target can be the support level at 0.5485 — 0.5528.
Short positions will remain valid as long as the market remains below the nearest resistance level at 0.5744 — 0.5760.
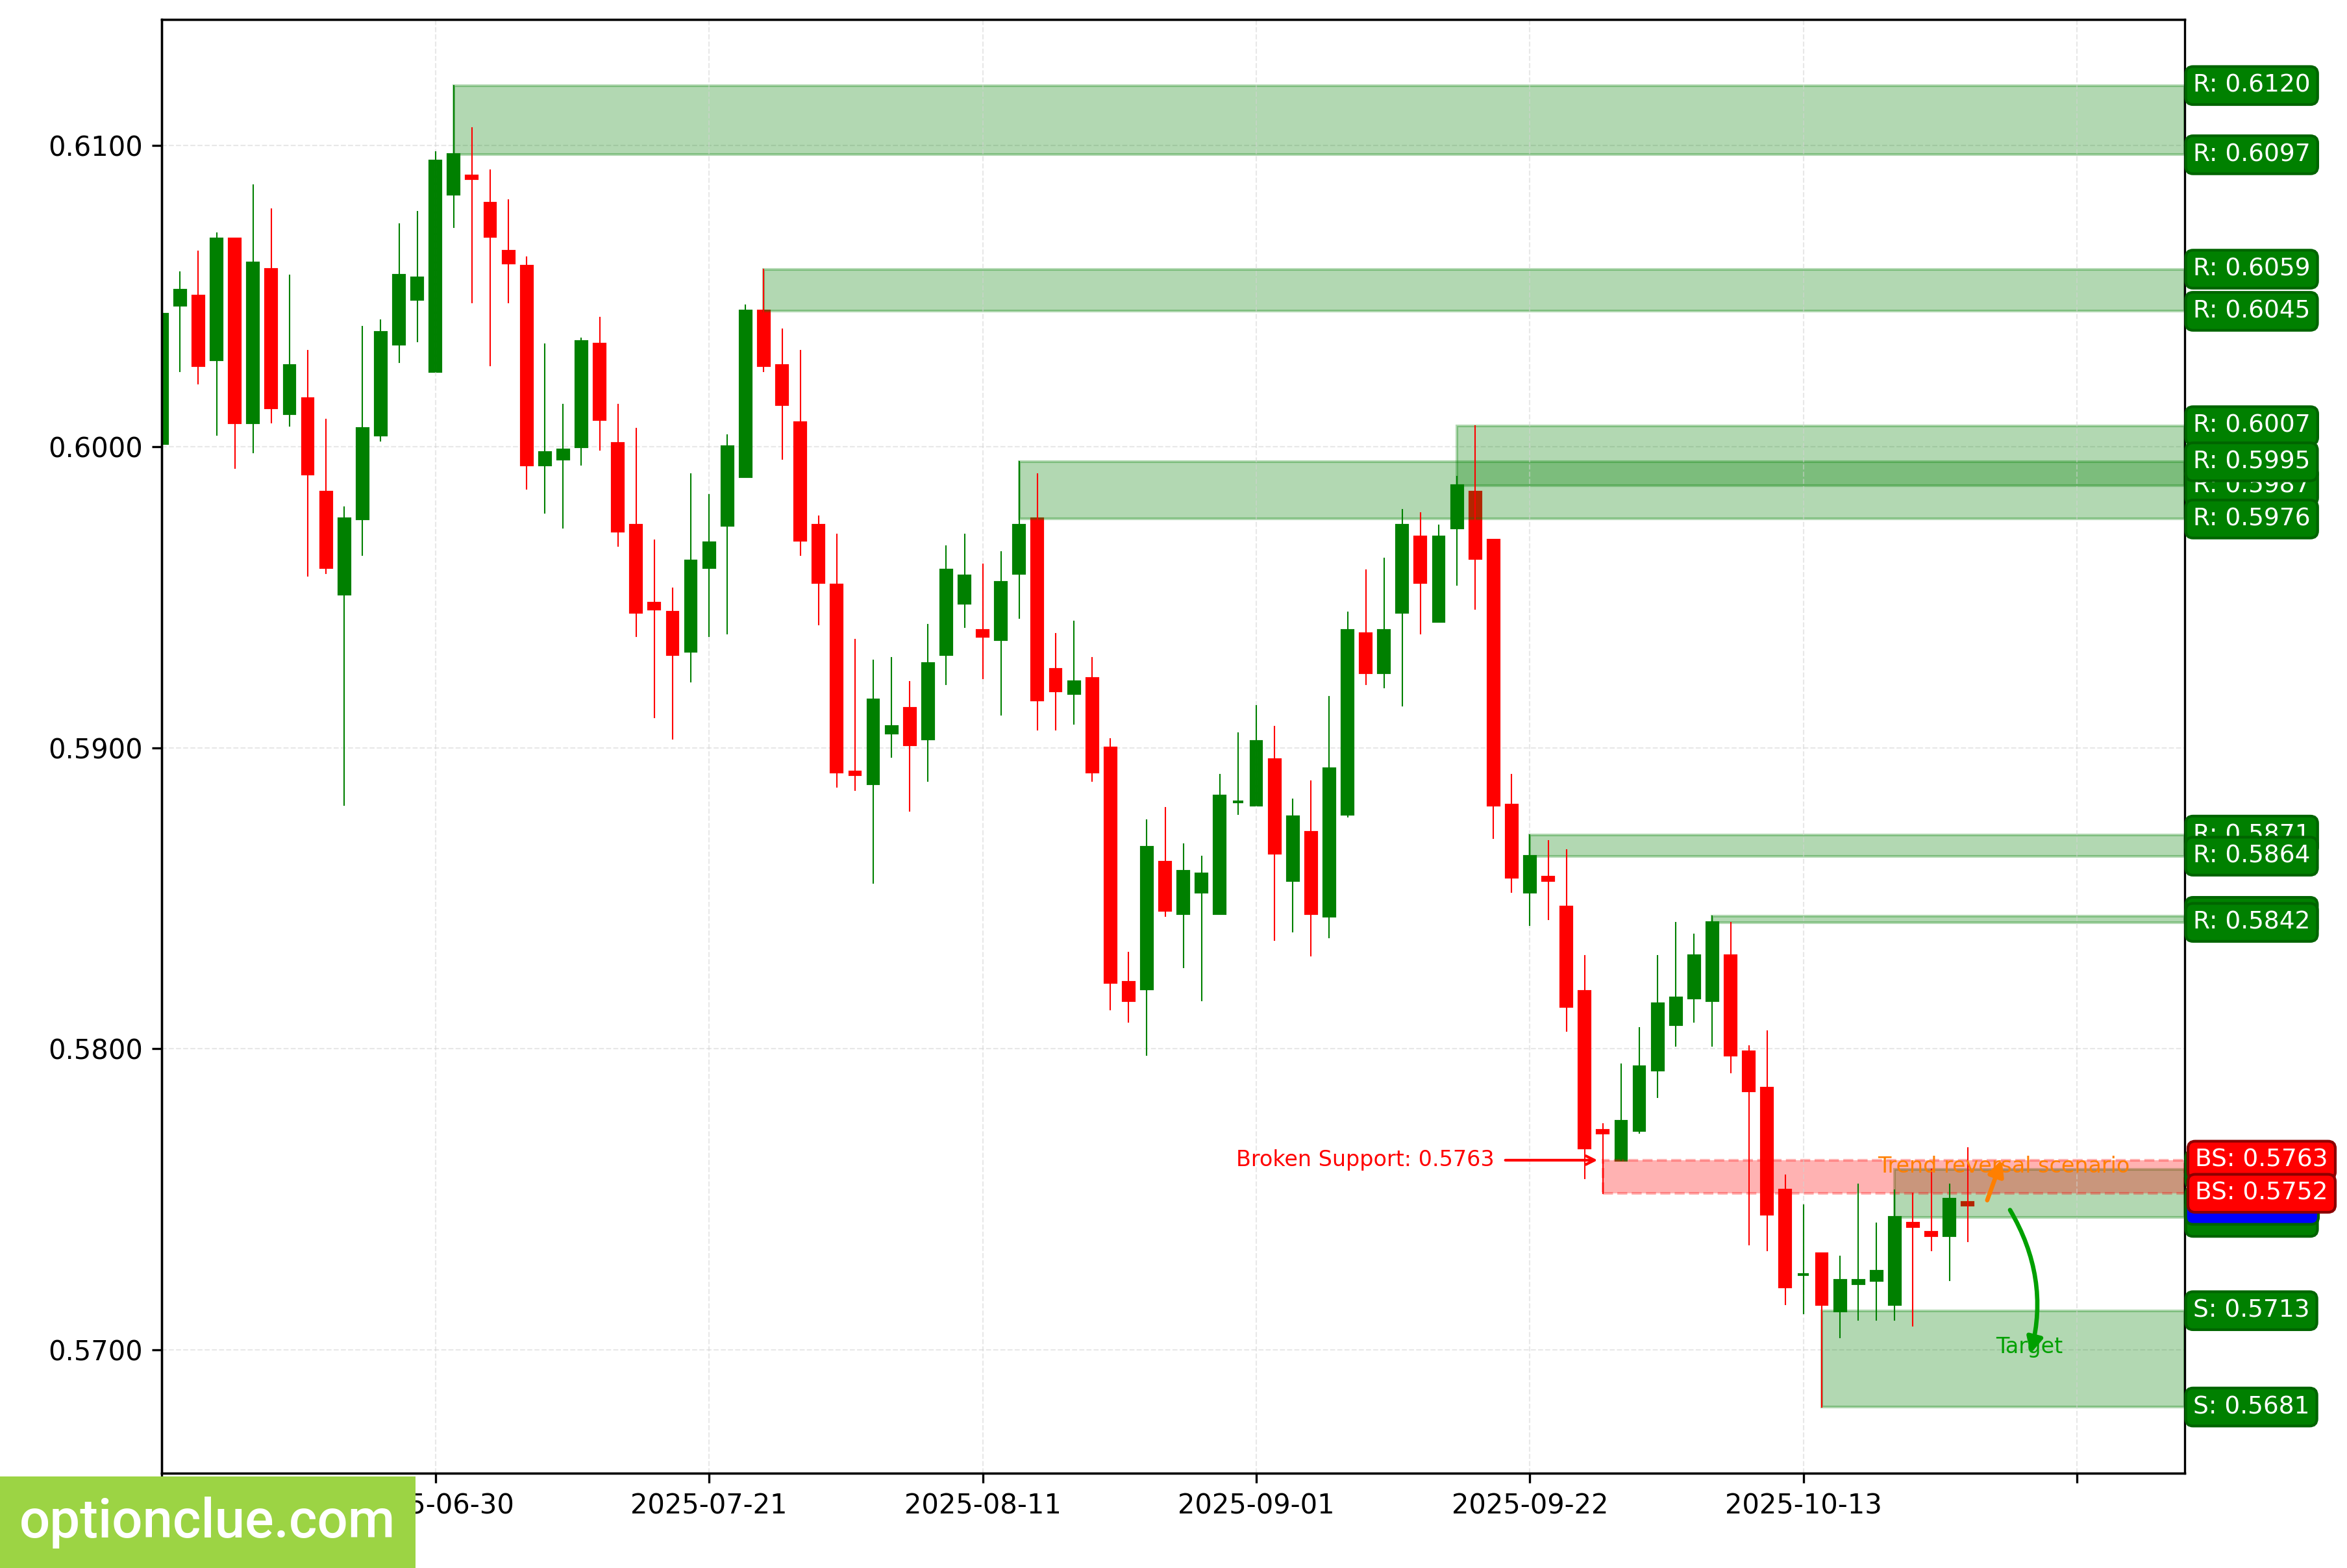
NZDUSD. Technical analysis. D1.
Bitcoin (BTC)
The market remains in a bearish trend; the correction ended 6 days ago, after which a short impulse wave developed; a new correction is now forming.
The interim target for the down move is the support level at 106639 — 107586. If the market breaks this support, the next target can be the support level at 103517 — 106462.
If the new correction ends near the resistance level (110568 — 114082), the potential reward/risk can be about 1.8:1.
Short positions will remain valid as long as the market is below the nearest resistance level at 110568 — 114082.
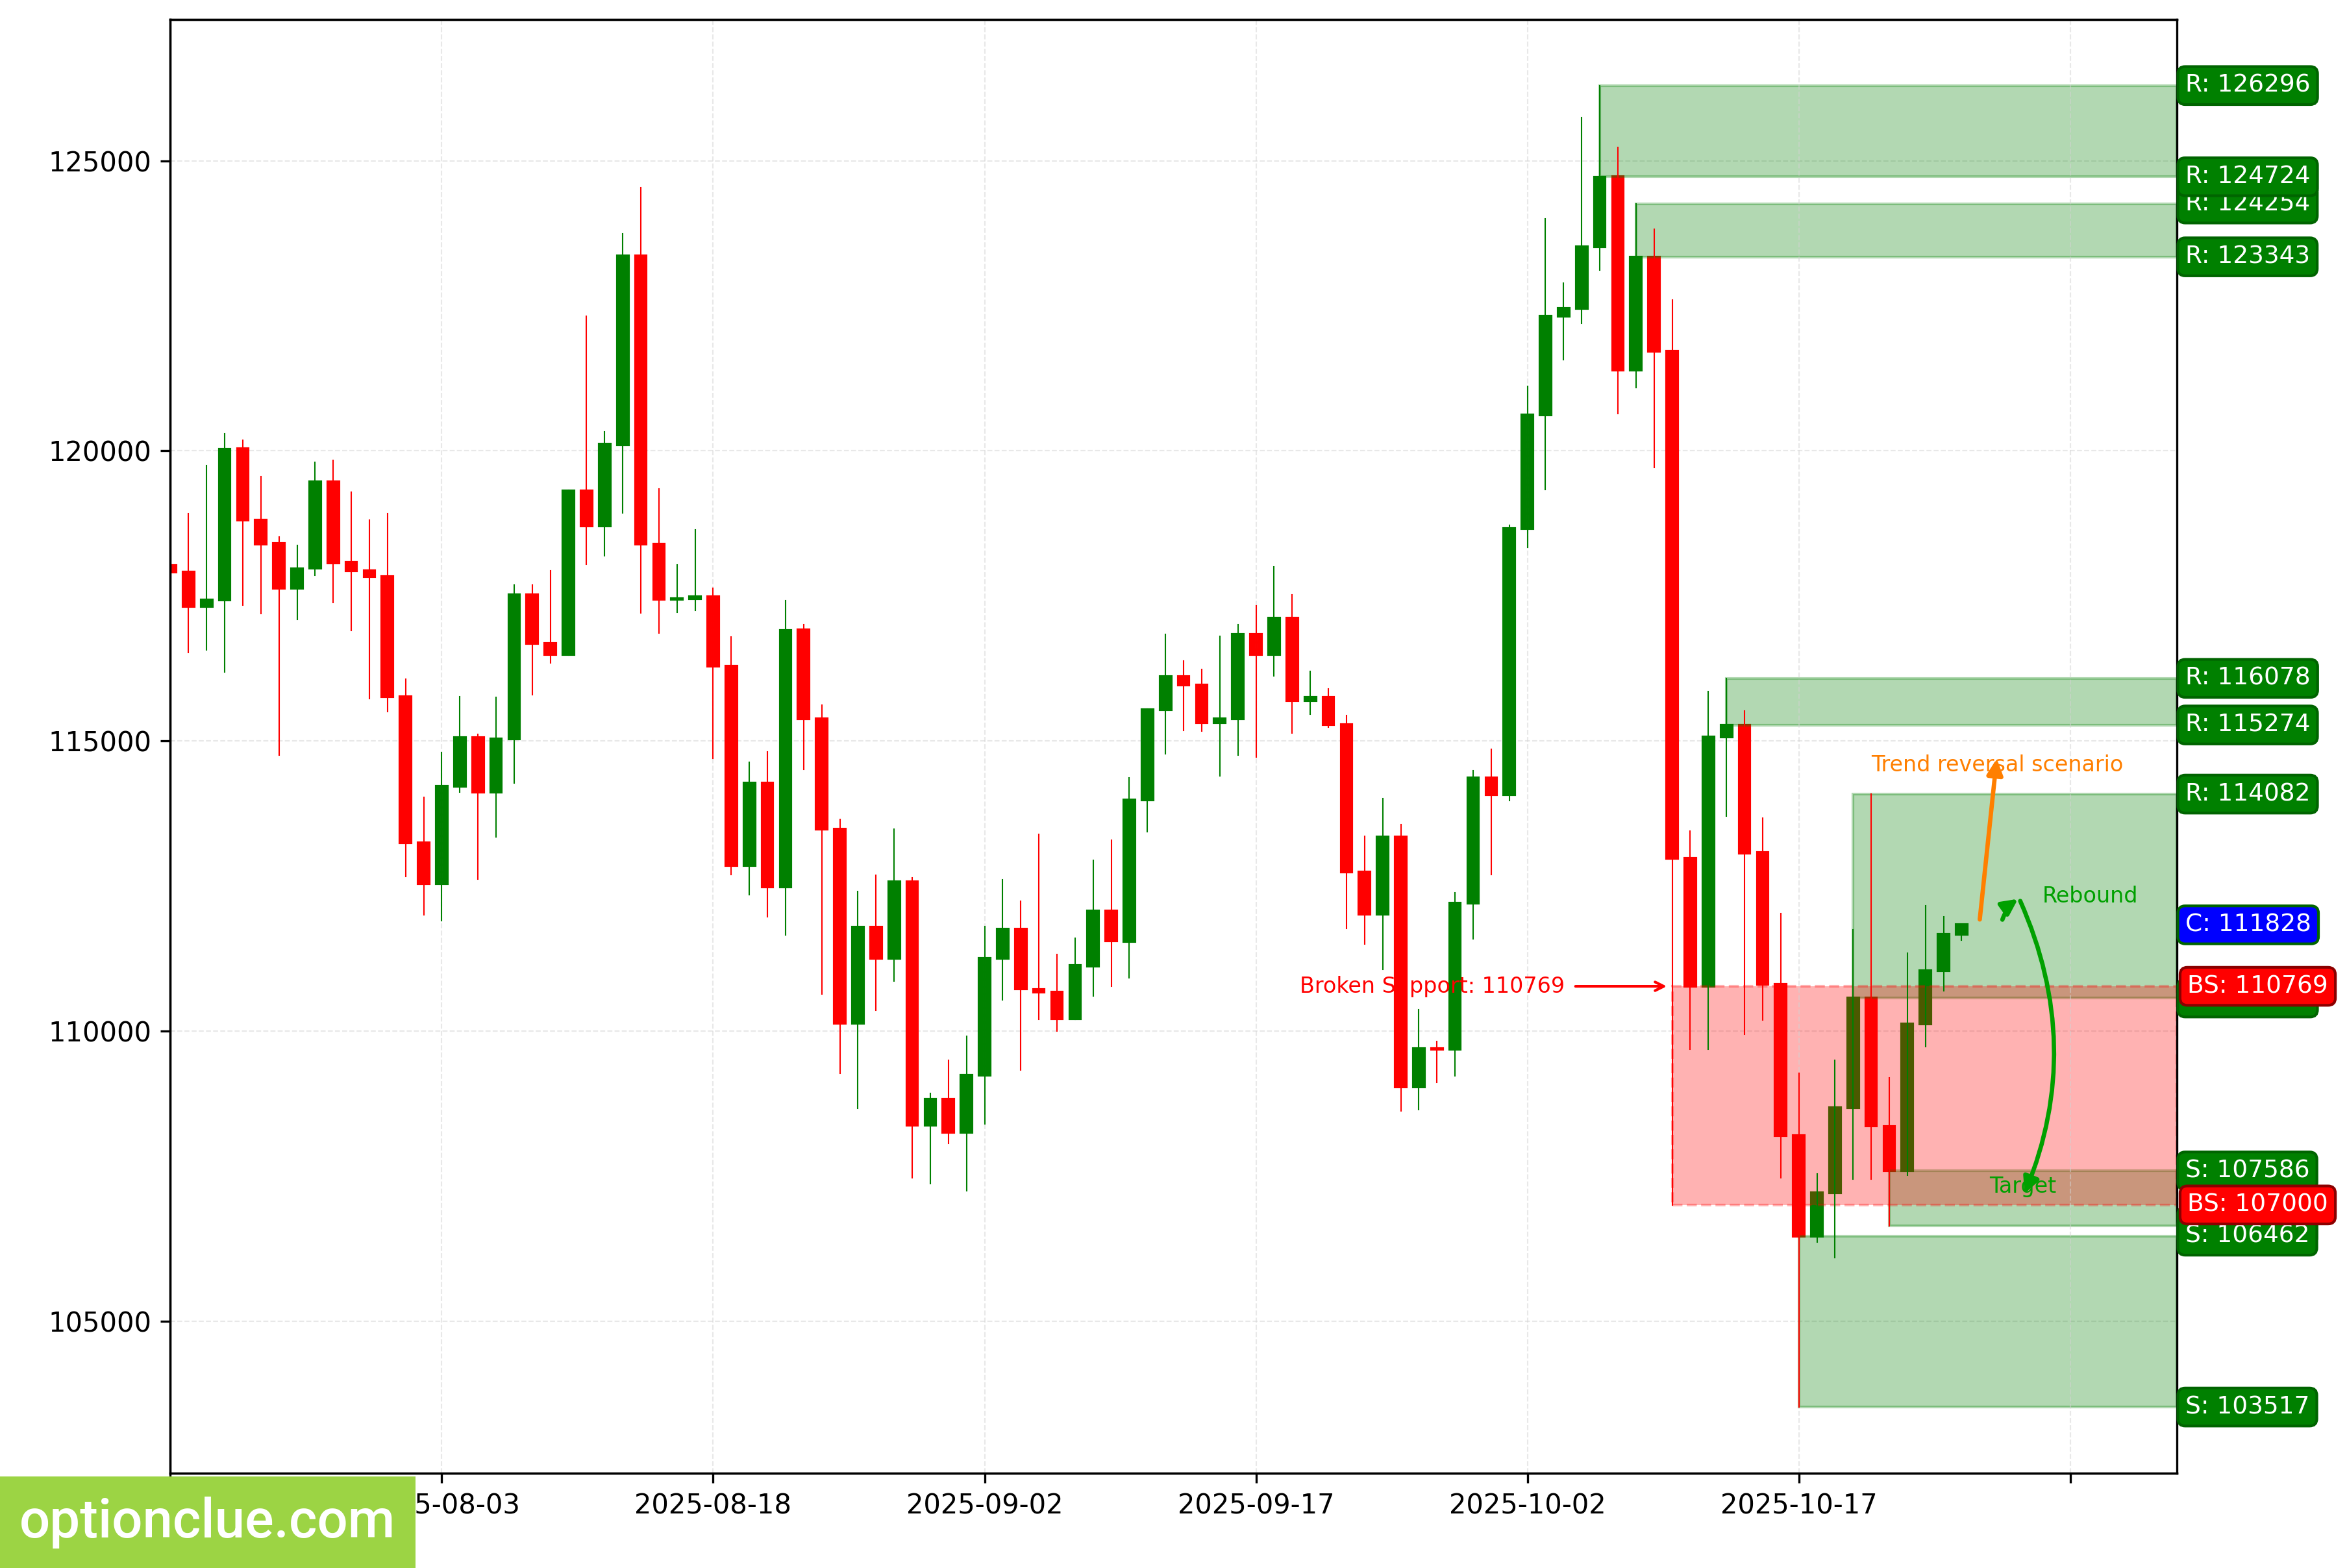
BTC. Technical analysis. D1.
Ether (ETH)
The bearish trend continues, a correction is forming on the daily timeframe. A sell entry on a rebound may form after the current correction ends.
If the down move resumes, the first target can be the support level at 3711 — 3806. If the trend develops successfully, the next target can be the support level at 3674 — 3833.
If the correction ends near the resistance level (3984 — 4113), the potential reward/risk can be about 3.5:1.
Short positions will remain valid as long as the market is below the resistance level on the daily timeframe at 3984 — 4113.
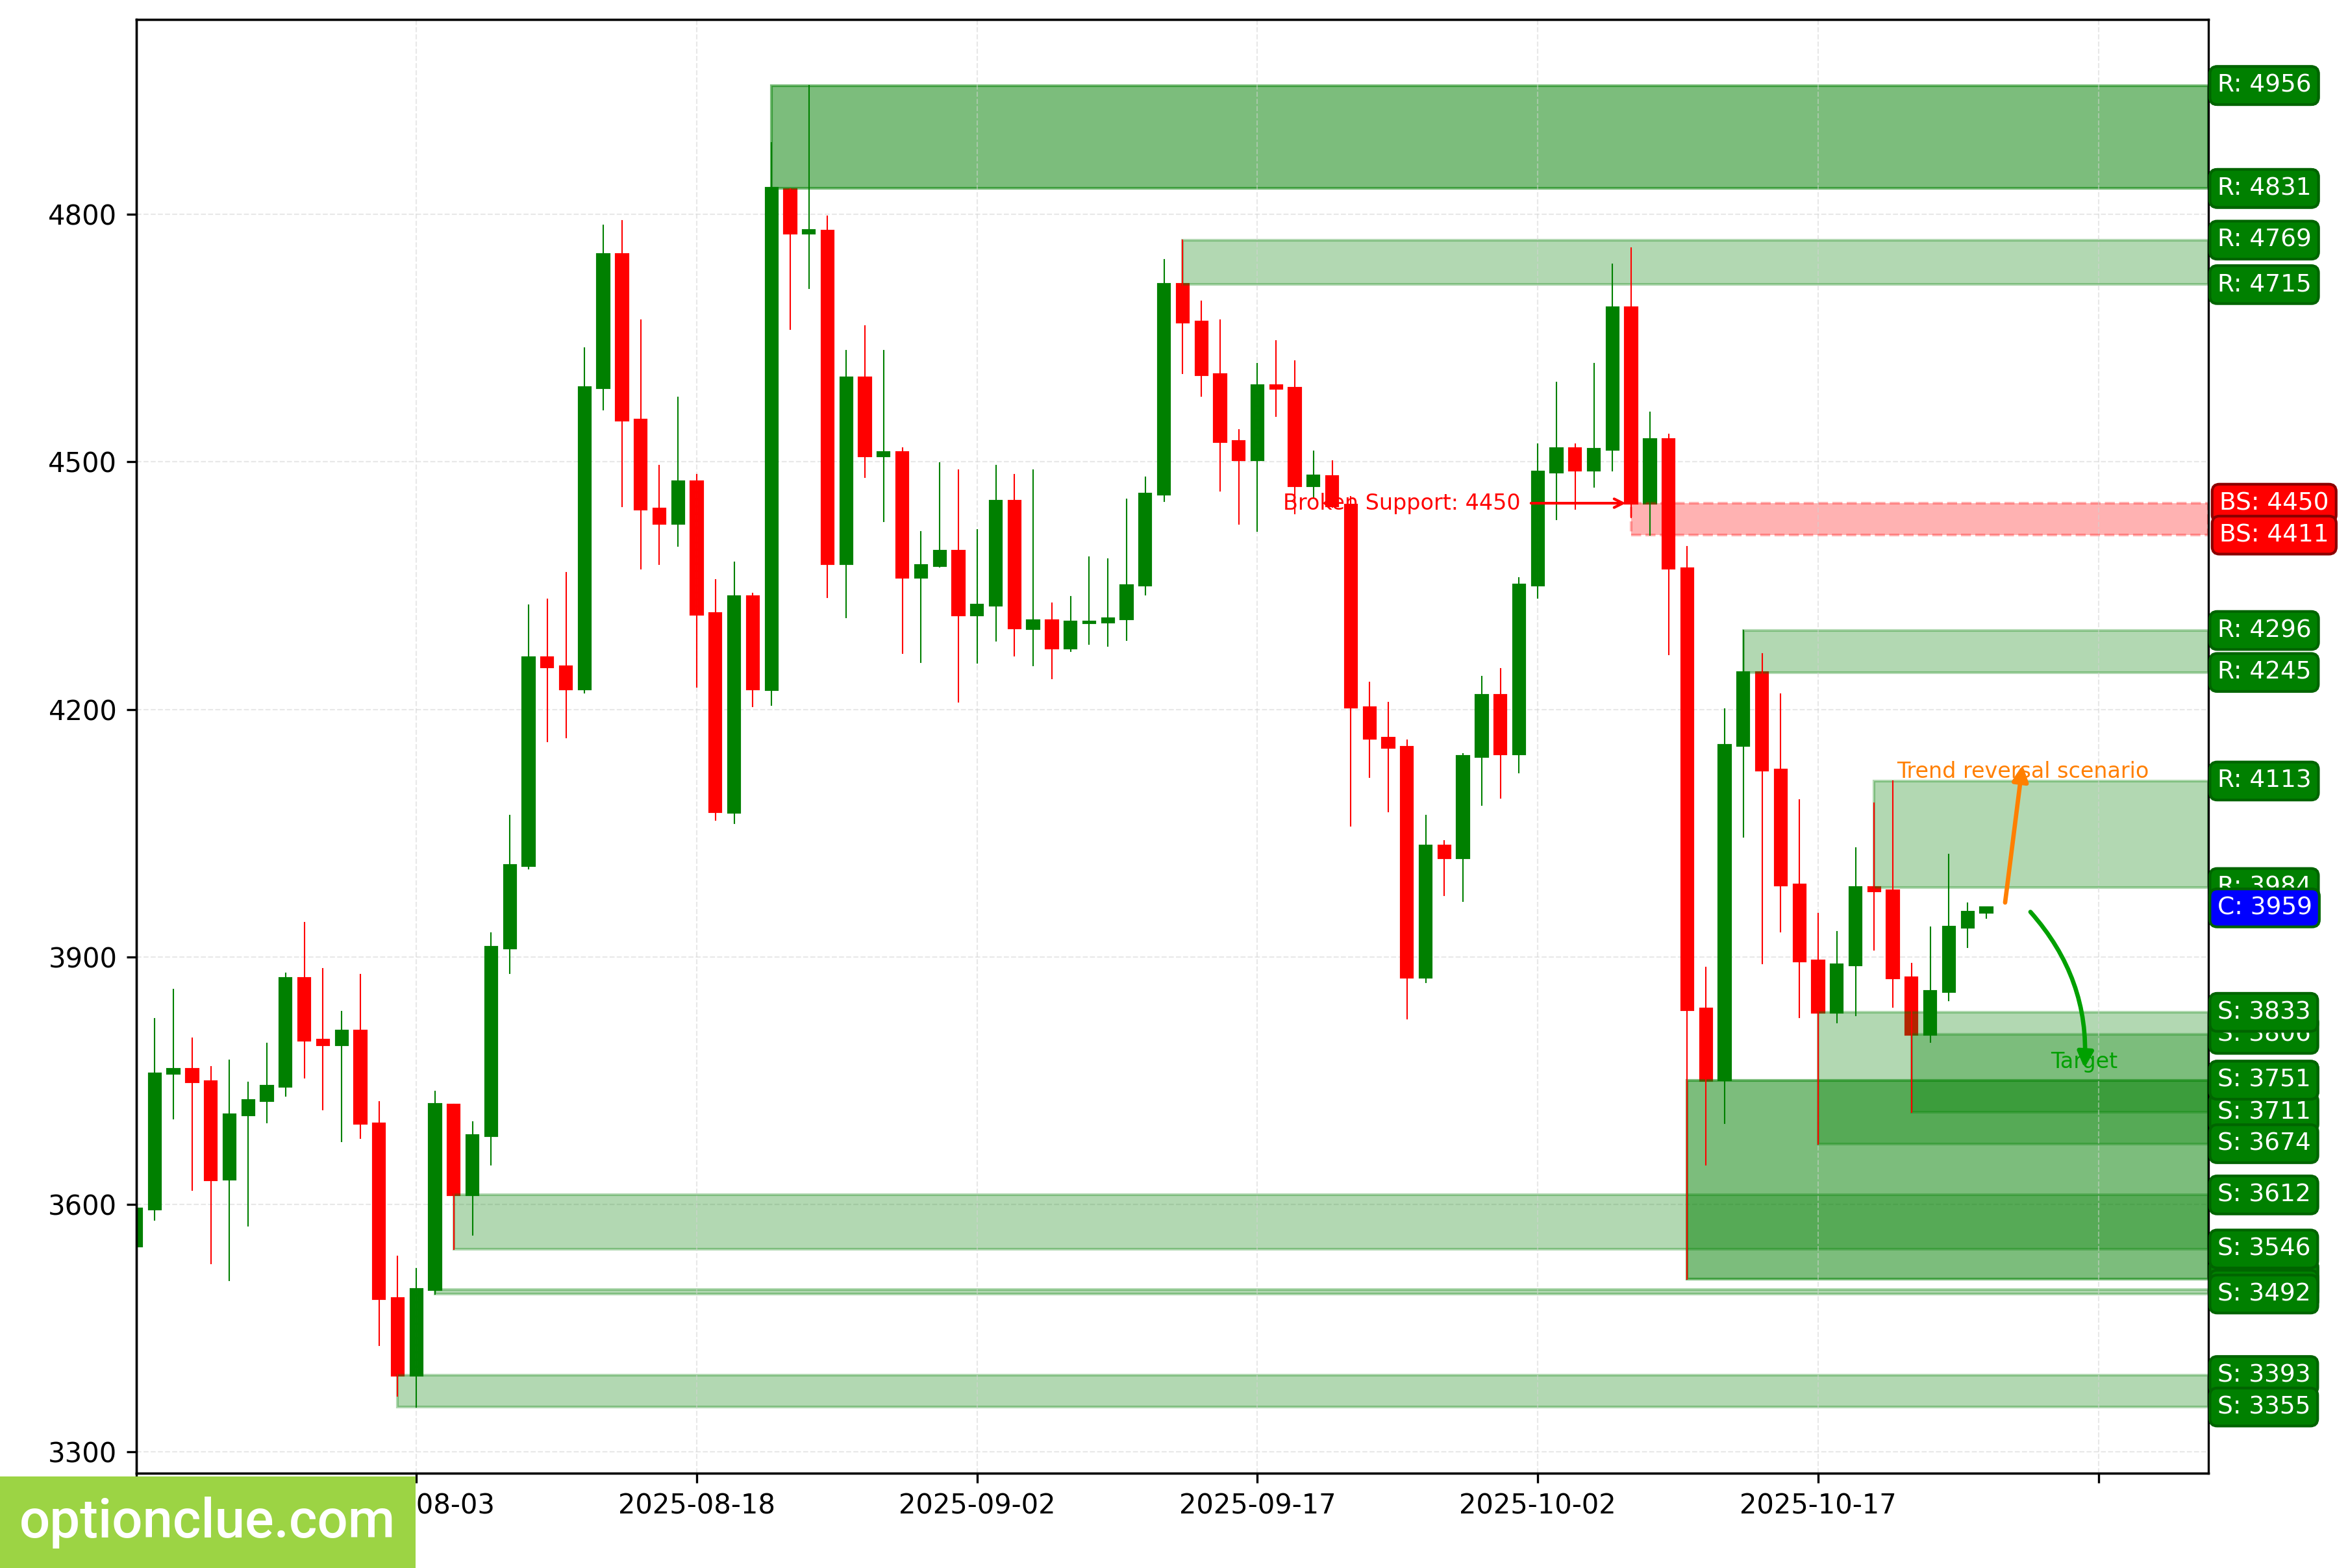
ETH. Technical analysis. D1.
Apple Inc (AAPL)
The bullish trend continues, the last broken level is resistance (249.49 — 251.82). The breakout occurred 6 days ago; an impulse wave is developing. A buy entry on a rebound may appear after a new correction forms.
Long positions will remain valid as long as the market is above the nearest support level at 255.43 — 258.45.
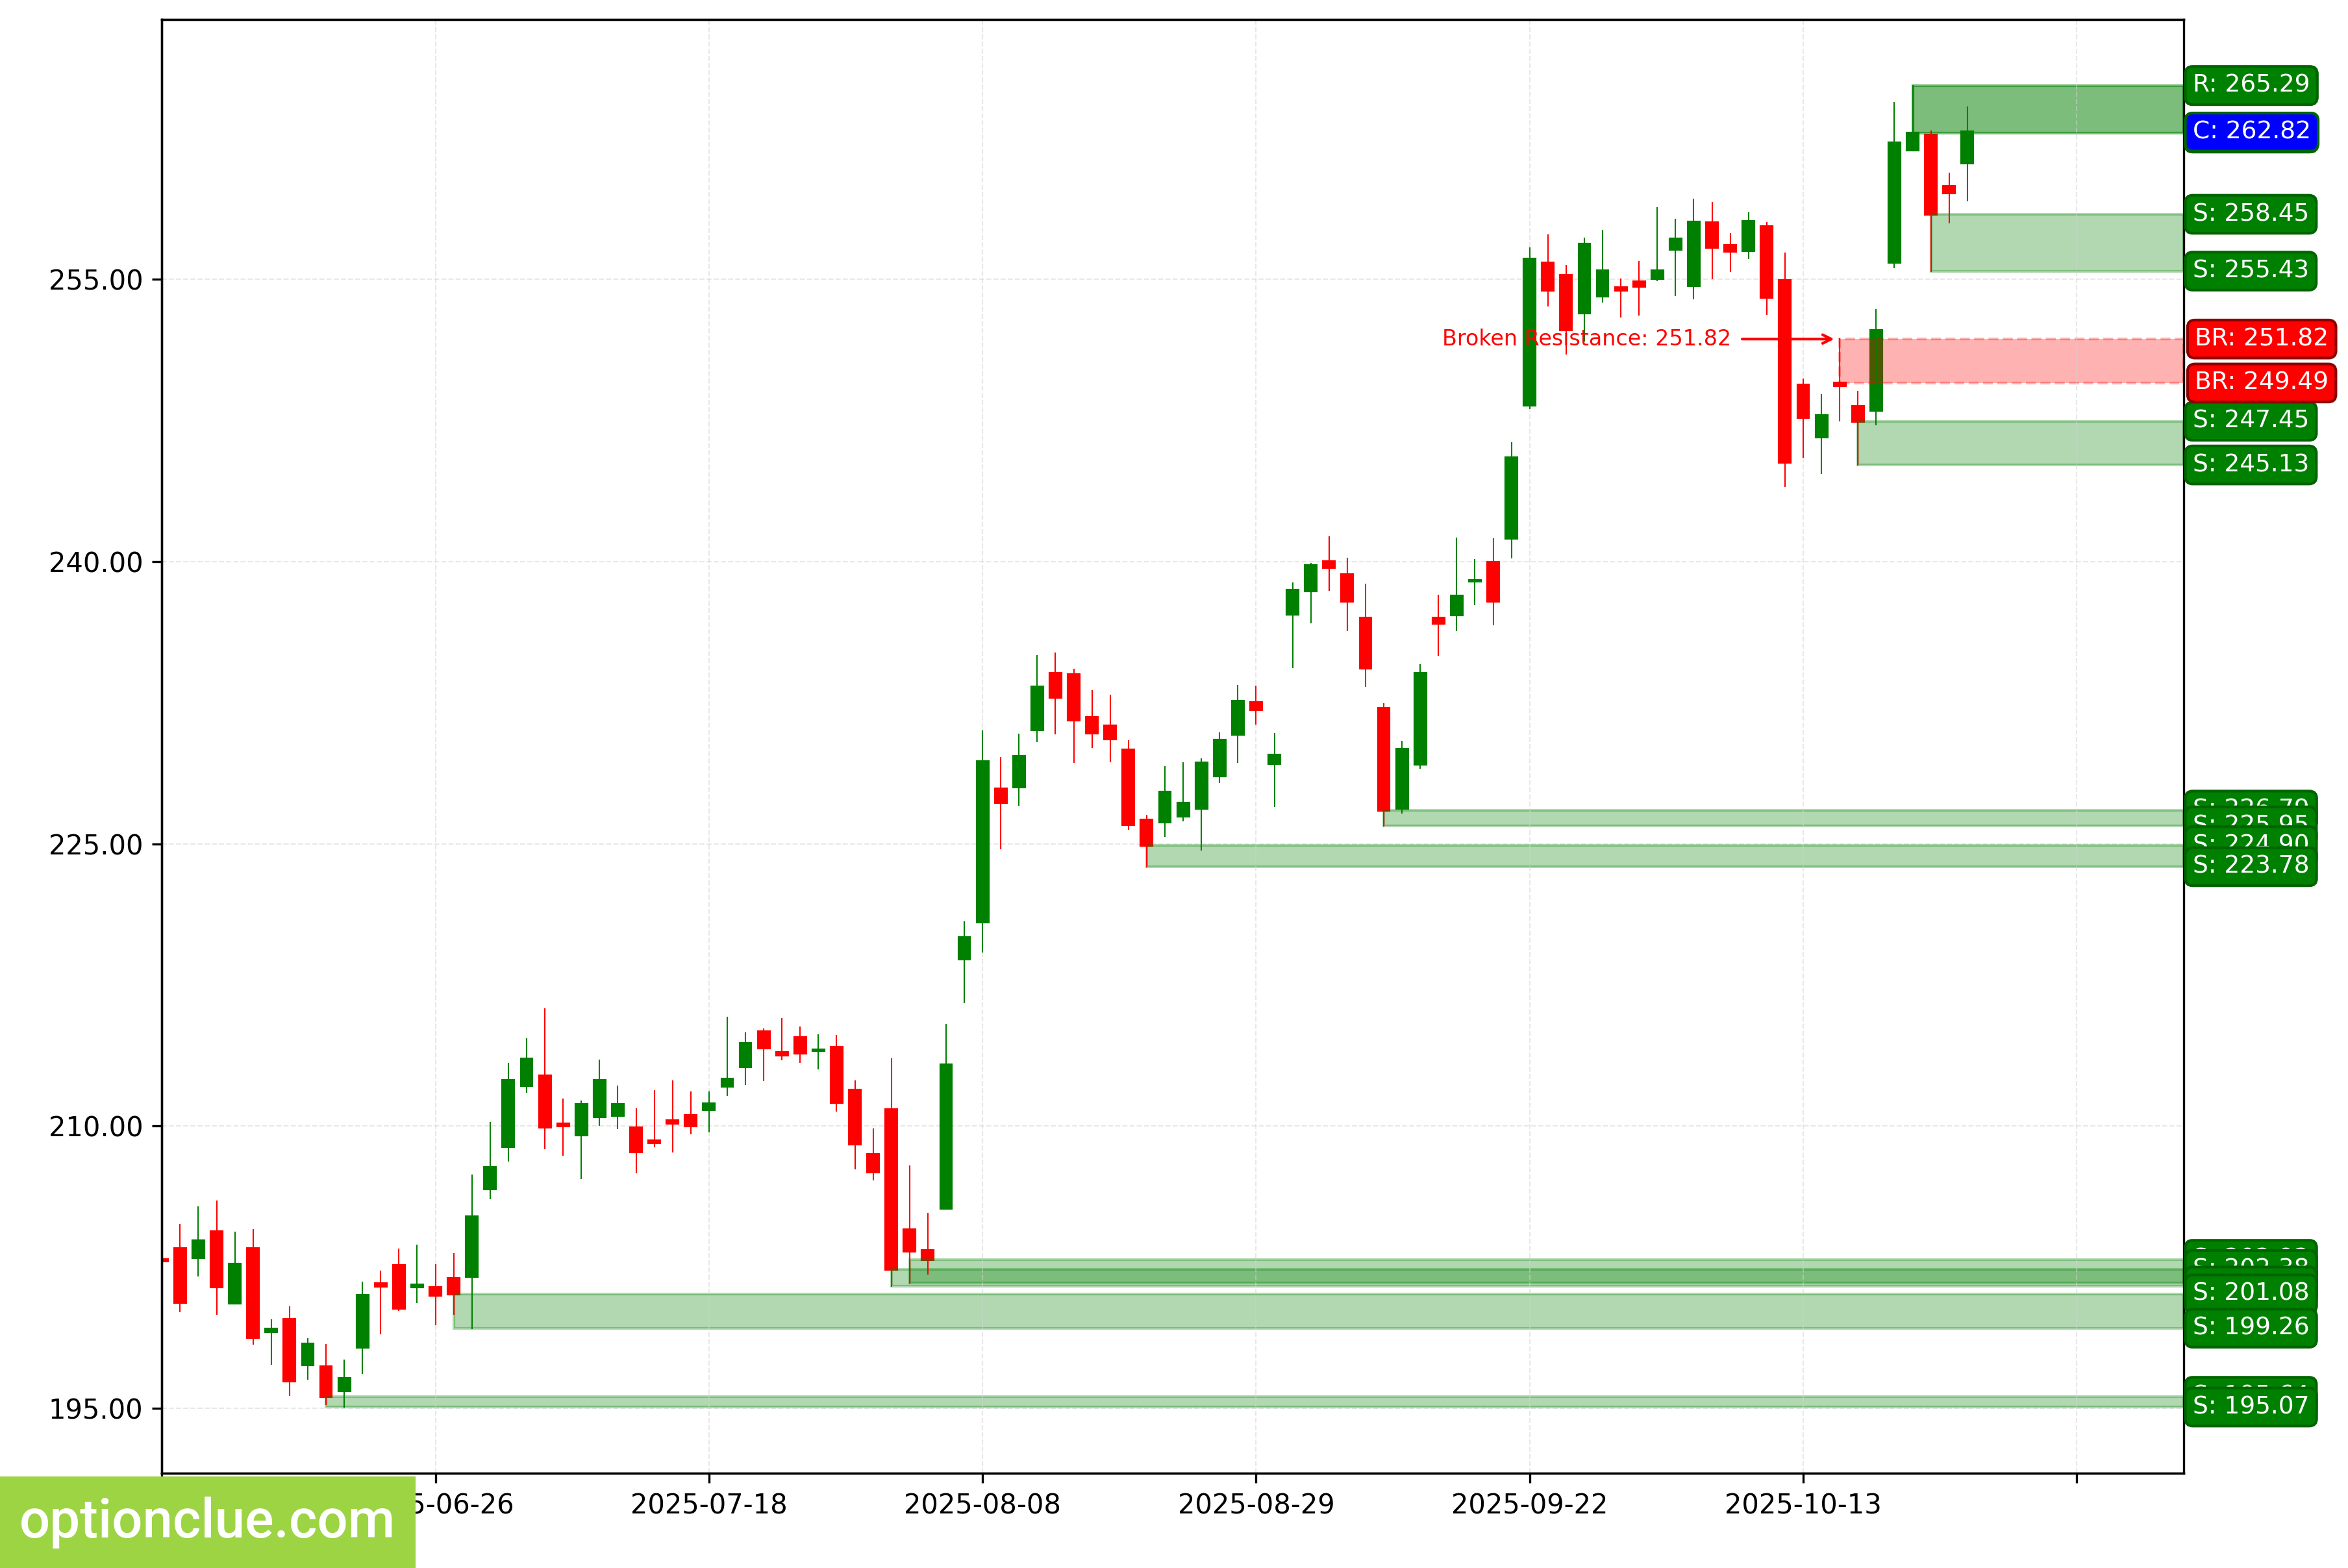
AAPL. Technical analysis. D1.
NVIDIA Corp (NVDA)
The trend turned bullish when the resistance level (183.22 — 185.20) was broken last week. An impulse wave is developing. New buy entries on a rebound on the daily timeframe will appear after a correction forms.
The interim target for the up move is the resistance level at 193.51 — 195.62.
If the correction ends near the last broken level (183.22 — 185.20), the potential reward/risk can be low (about 1:1). If the market corrects to the support level (176.76 — 180.28), the potential reward/risk can be about 5:1.
Long positions will remain valid as long as the market is above the nearest support level on the daily timeframe at 176.76 — 180.28. A decisive break of this level would signal a reversal of the medium-term trend.
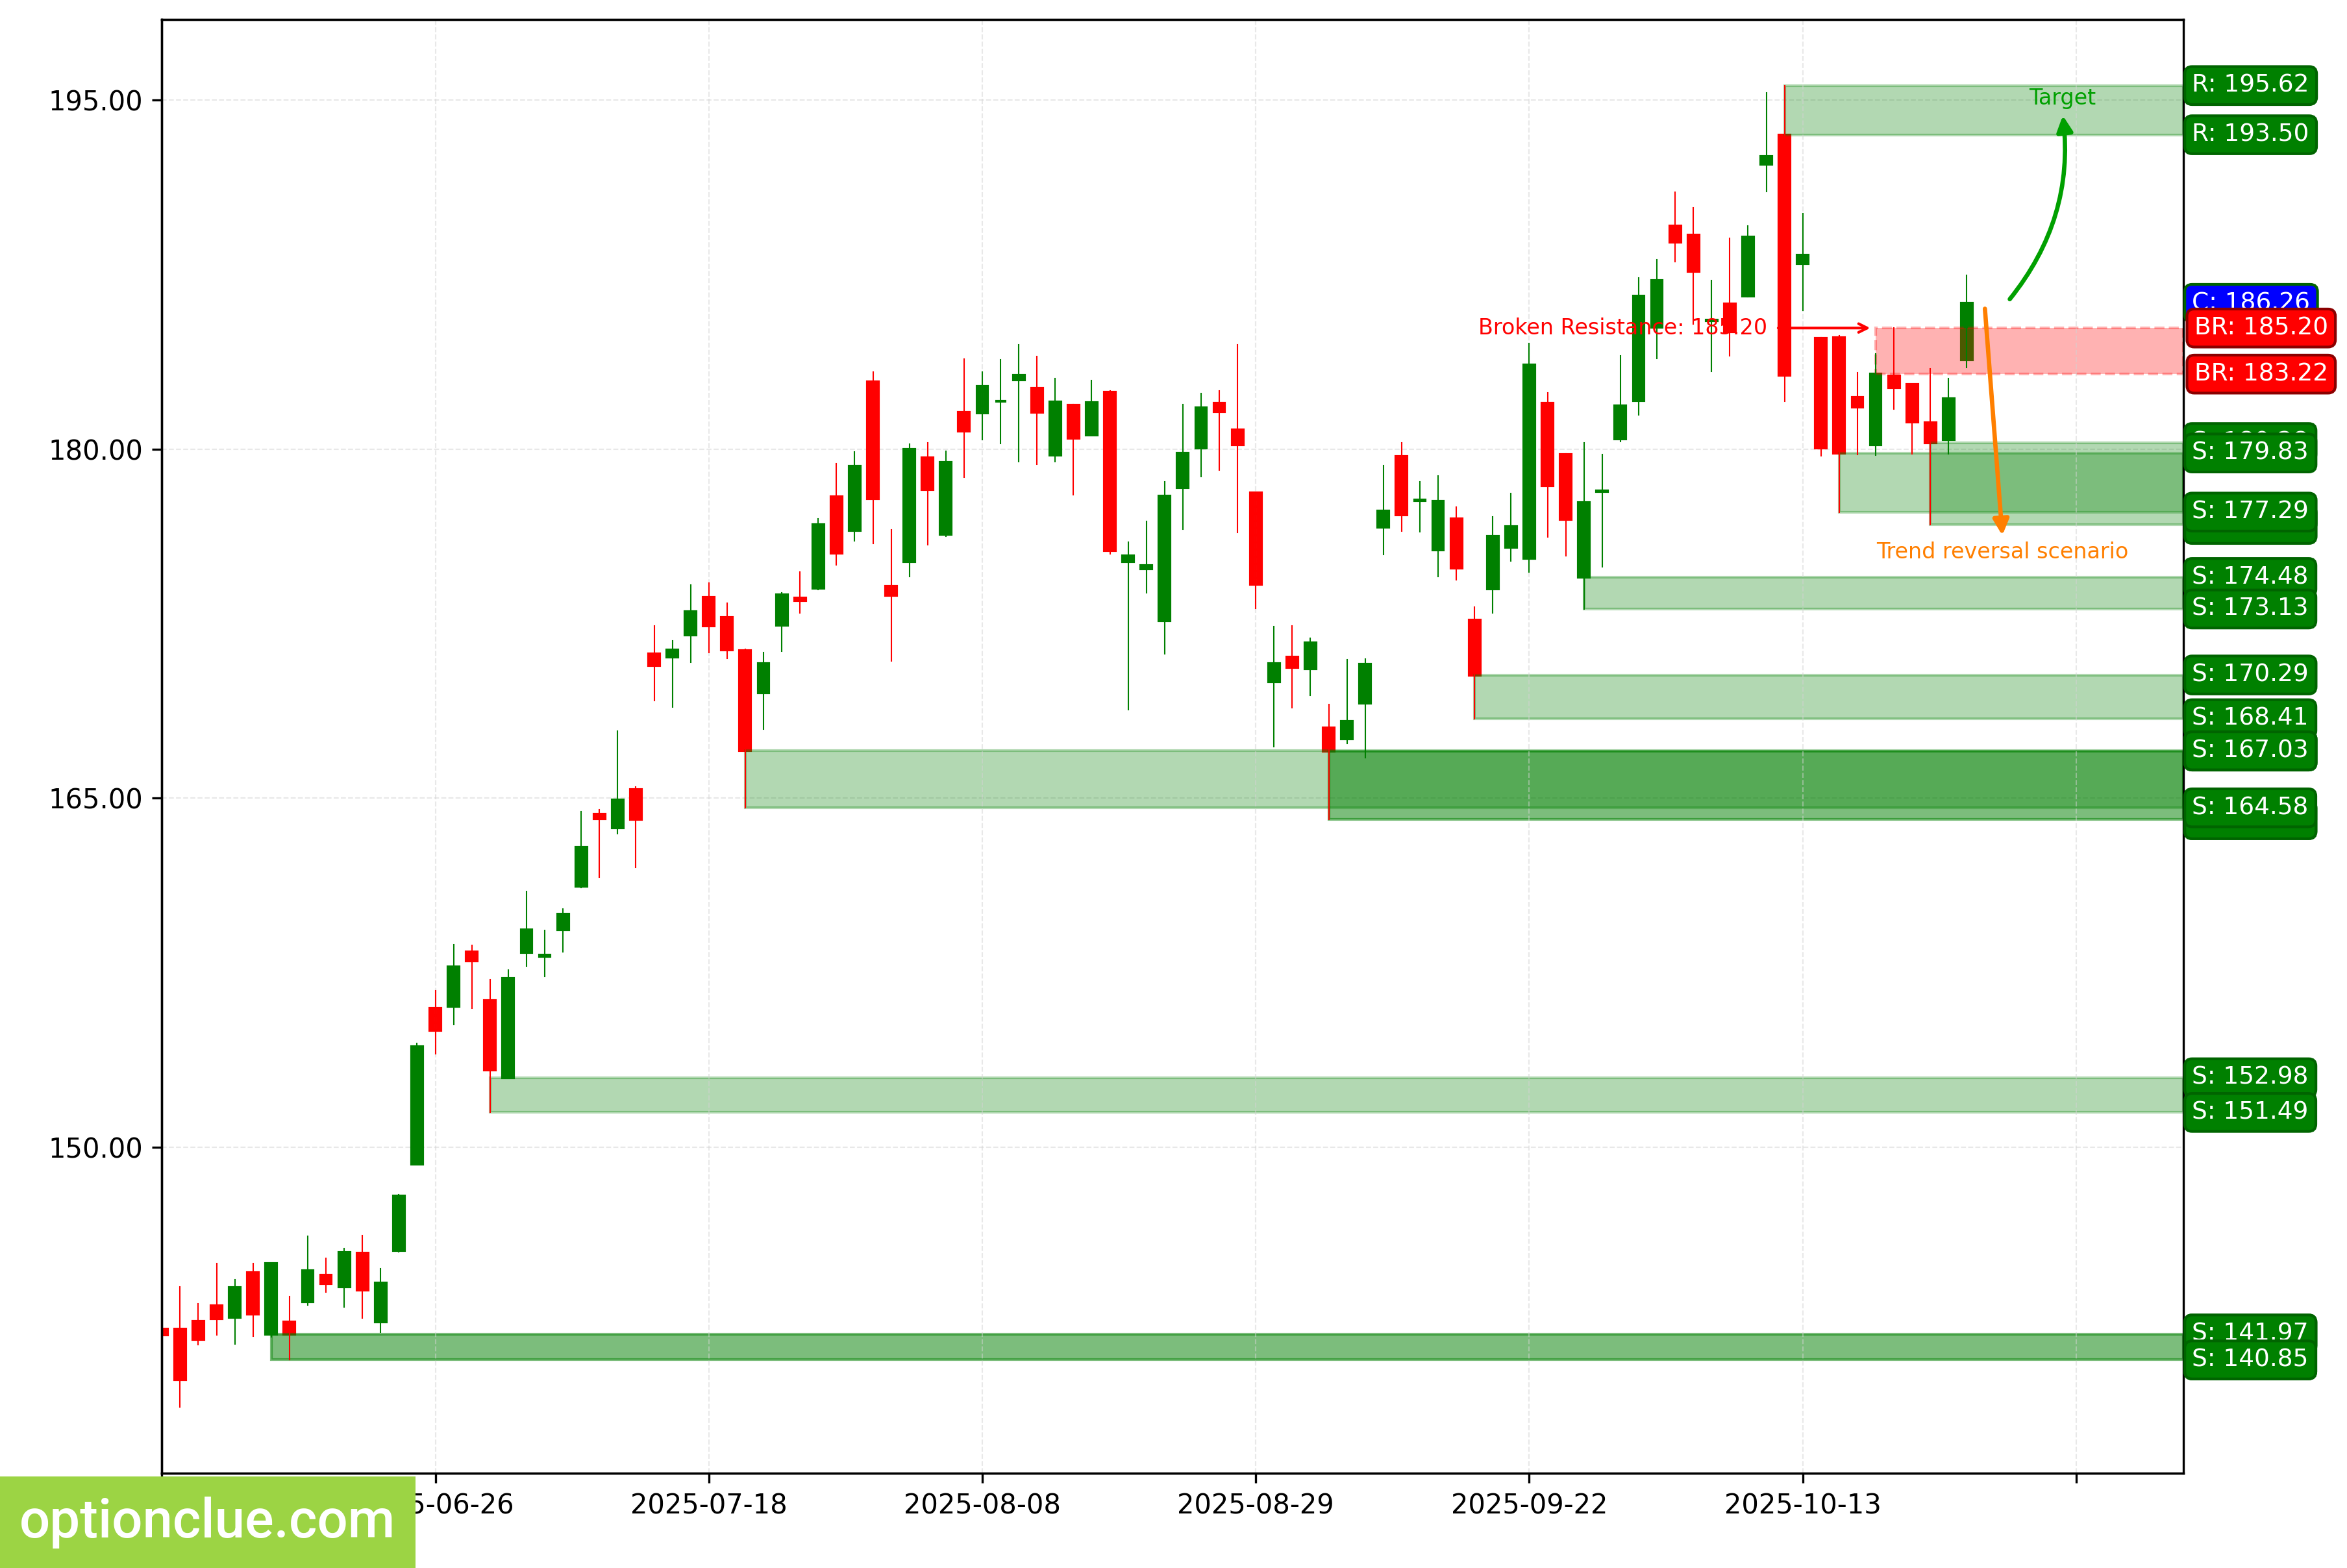
NVDA. Technical analysis. D1.
Tesla Inc (TSLA)
The trend turned bullish when the resistance level (435.90 — 440.51) was broken last week. A corrective wave is forming now.
The interim target for the up move is the resistance level at 448.98 — 451.68. If the market secures above this resistance, it will open the way toward target #2 — the resistance level at 453.25 — 453.55.
If the new correction ends near the support level (413.90 — 420.00), the potential reward/risk can be about 4:1.
A buy entry on a rebound may appear after the current correction on the daily timeframe ends. Long positions will remain valid as long as the market is above the nearest support level on the daily timeframe at 413.90 — 420.00.
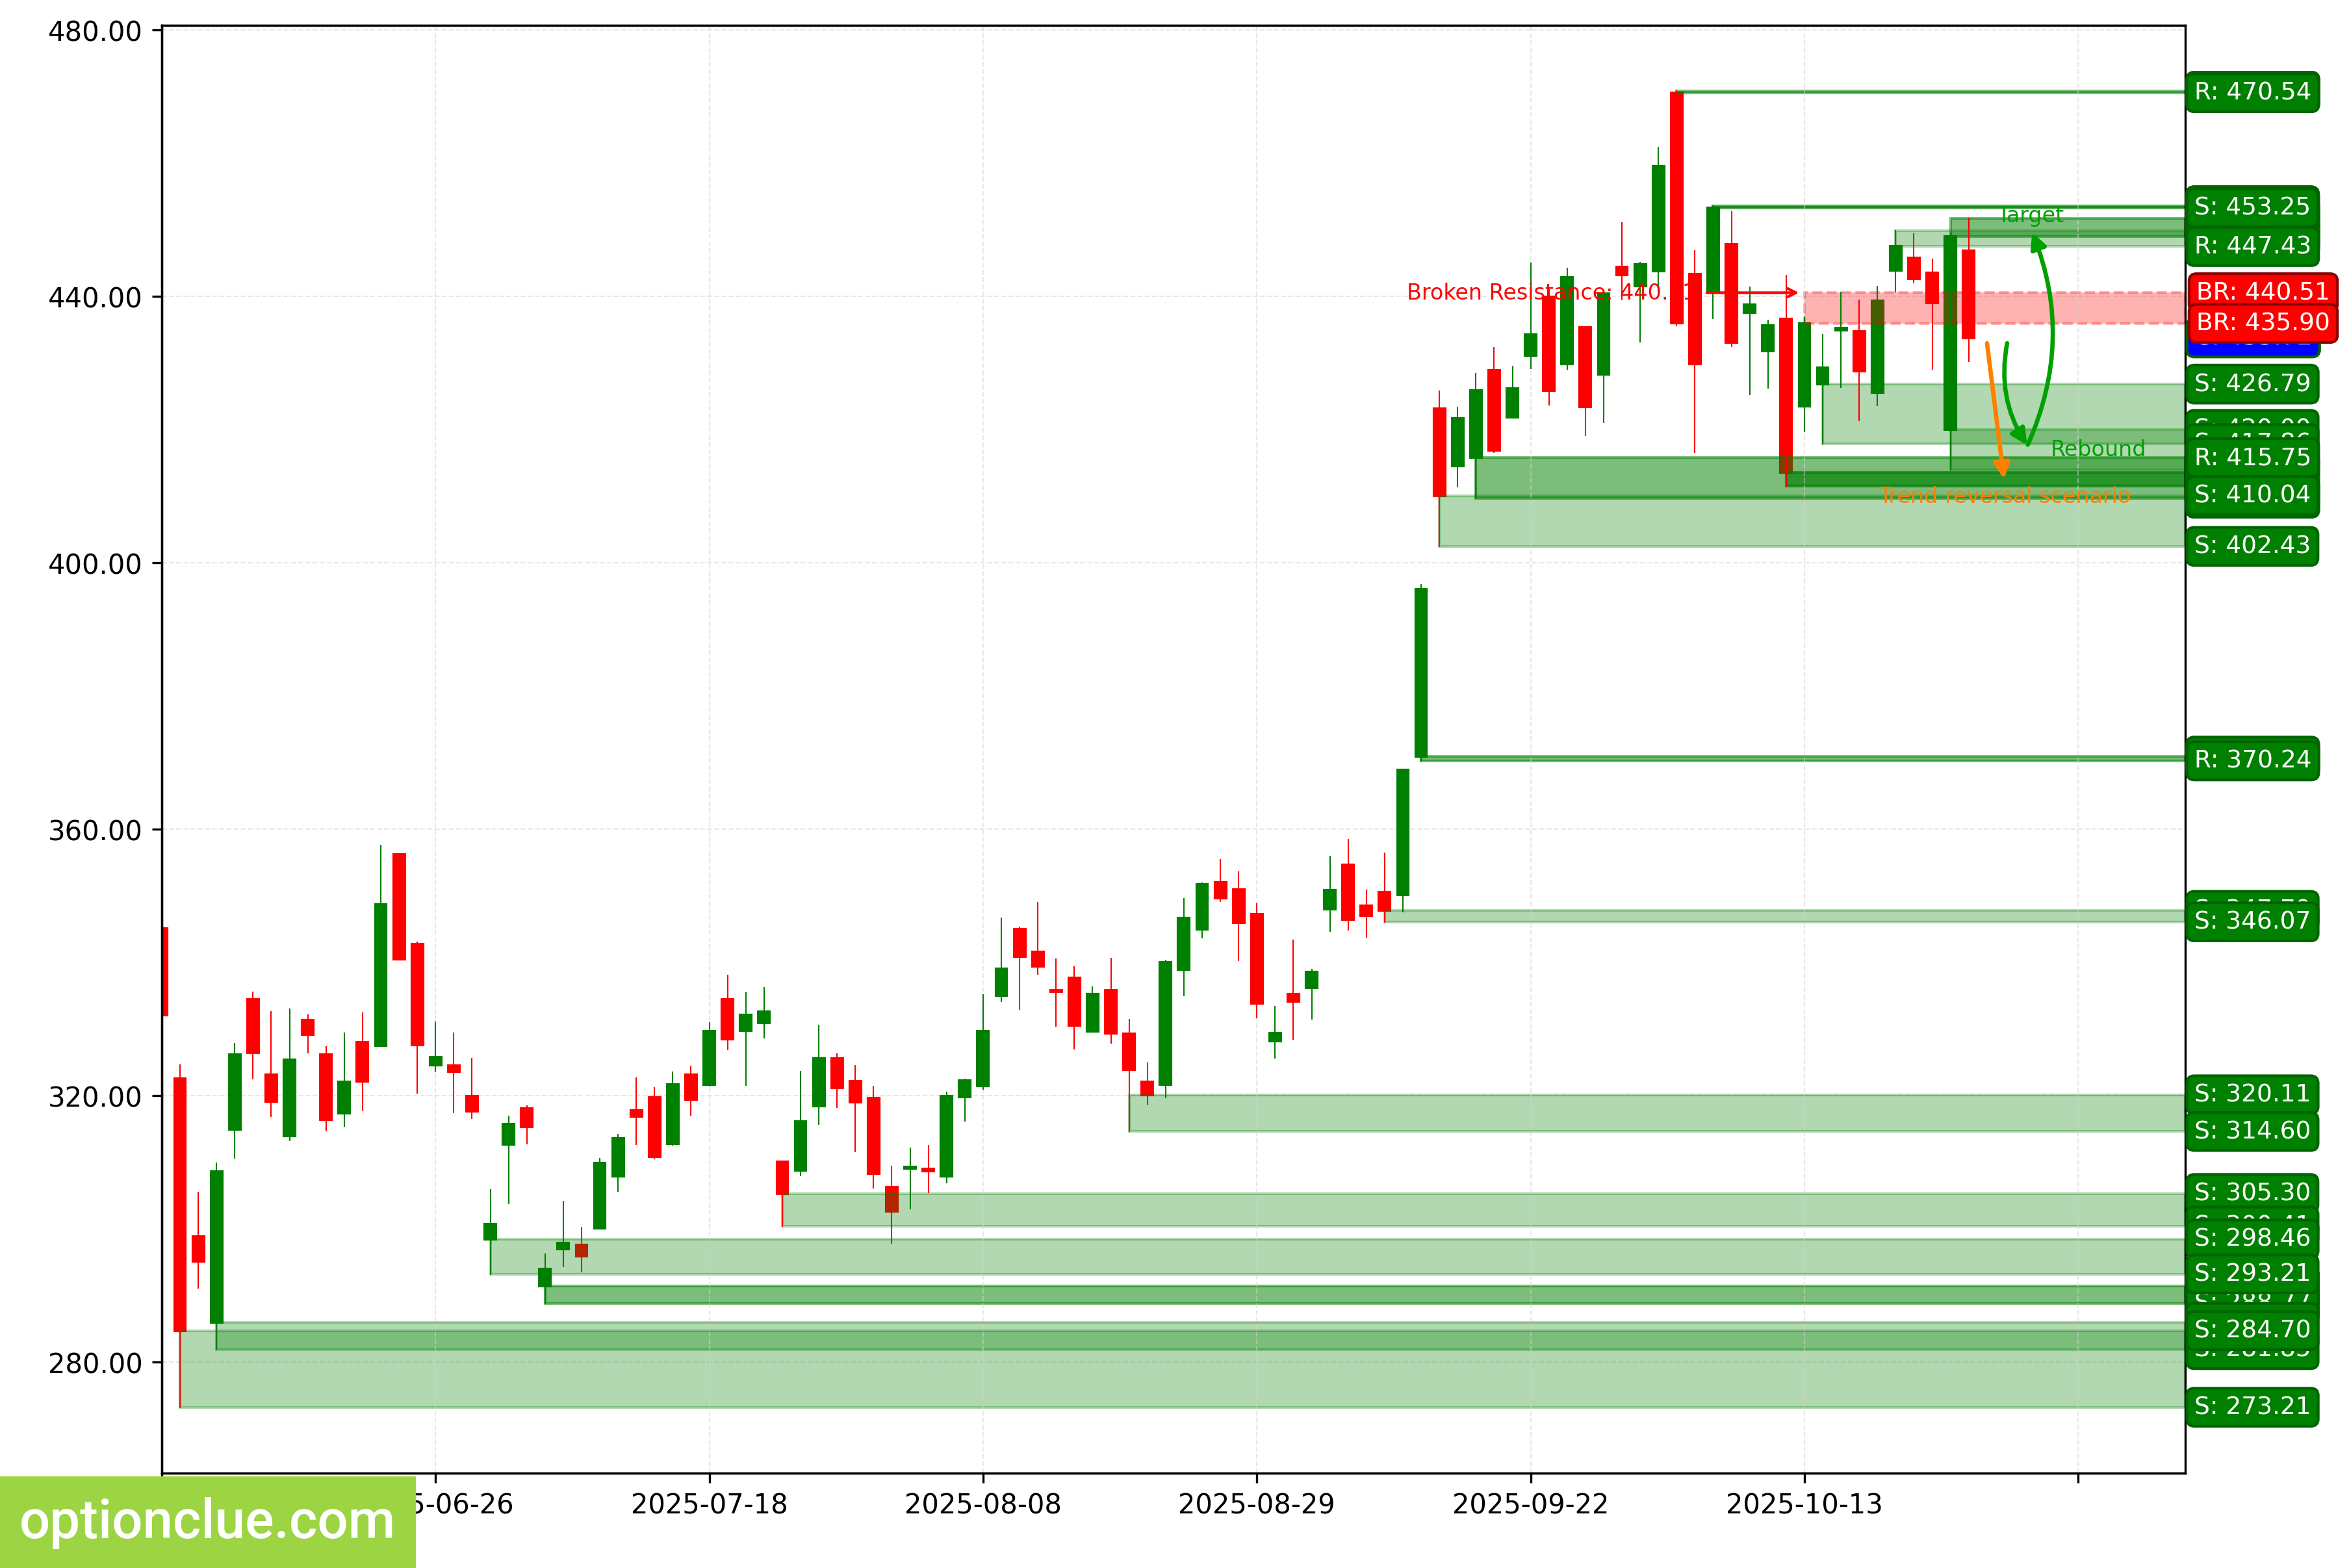
TSLA. Technical analysis. D1.
Summary
In the medium term, EURUSD, GBPUSD, USDJPY, USDCAD, AUDUSD, NZDUSD, TSLA stand out with corrections on the daily timeframe that are close to completion.
The remaining assets may merit attention depending on the depth of the market correction.