
We analyze the market using levels. They provide clear scenarios for entry and exit. Let’s check which zones are relevant now.
Key Topics
- Euro (EURUSD)
- British Pound (GBPUSD)
- Swiss Franc (USDCHF)
- Japanese Yen (USDJPY)
- Canadian Dollar (USDCAD)
- Australian Dollar (AUDUSD)
- New Zealand Dollar (NZDUSD)
- Bitcoin (BTC)
- Ether (ETH)
- Apple Inc (AAPL)
- NVIDIA Corp (NVDA)
- Tesla Inc (TSLA)
- Summary
Euro (EURUSD)
The bearish trend continues; a correction ended 6 candlesticks ago, and an impulse wave is developing. The last broken level is support (1.1577 — 1.1599). The breakout occurred 17 candlesticks ago.
The intermediate target for the downward movement is the support level with boundaries 1.1469 — 1.1485. If the trend successfully develops, a more distant target will be at the support level with boundaries 1.1392 — 1.1422.
Since the impulse movement is already developing, the reward/risk ratio for an entry from current prices may not be optimal. The most favorable entry points were formed earlier on a rebound.
Short positions will remain relevant as long as the market stays below the nearest resistance level with boundaries 1.1630 — 1.1656. If the market successfully establishes itself above this nearest resistance, the trend will reverse to bullish.
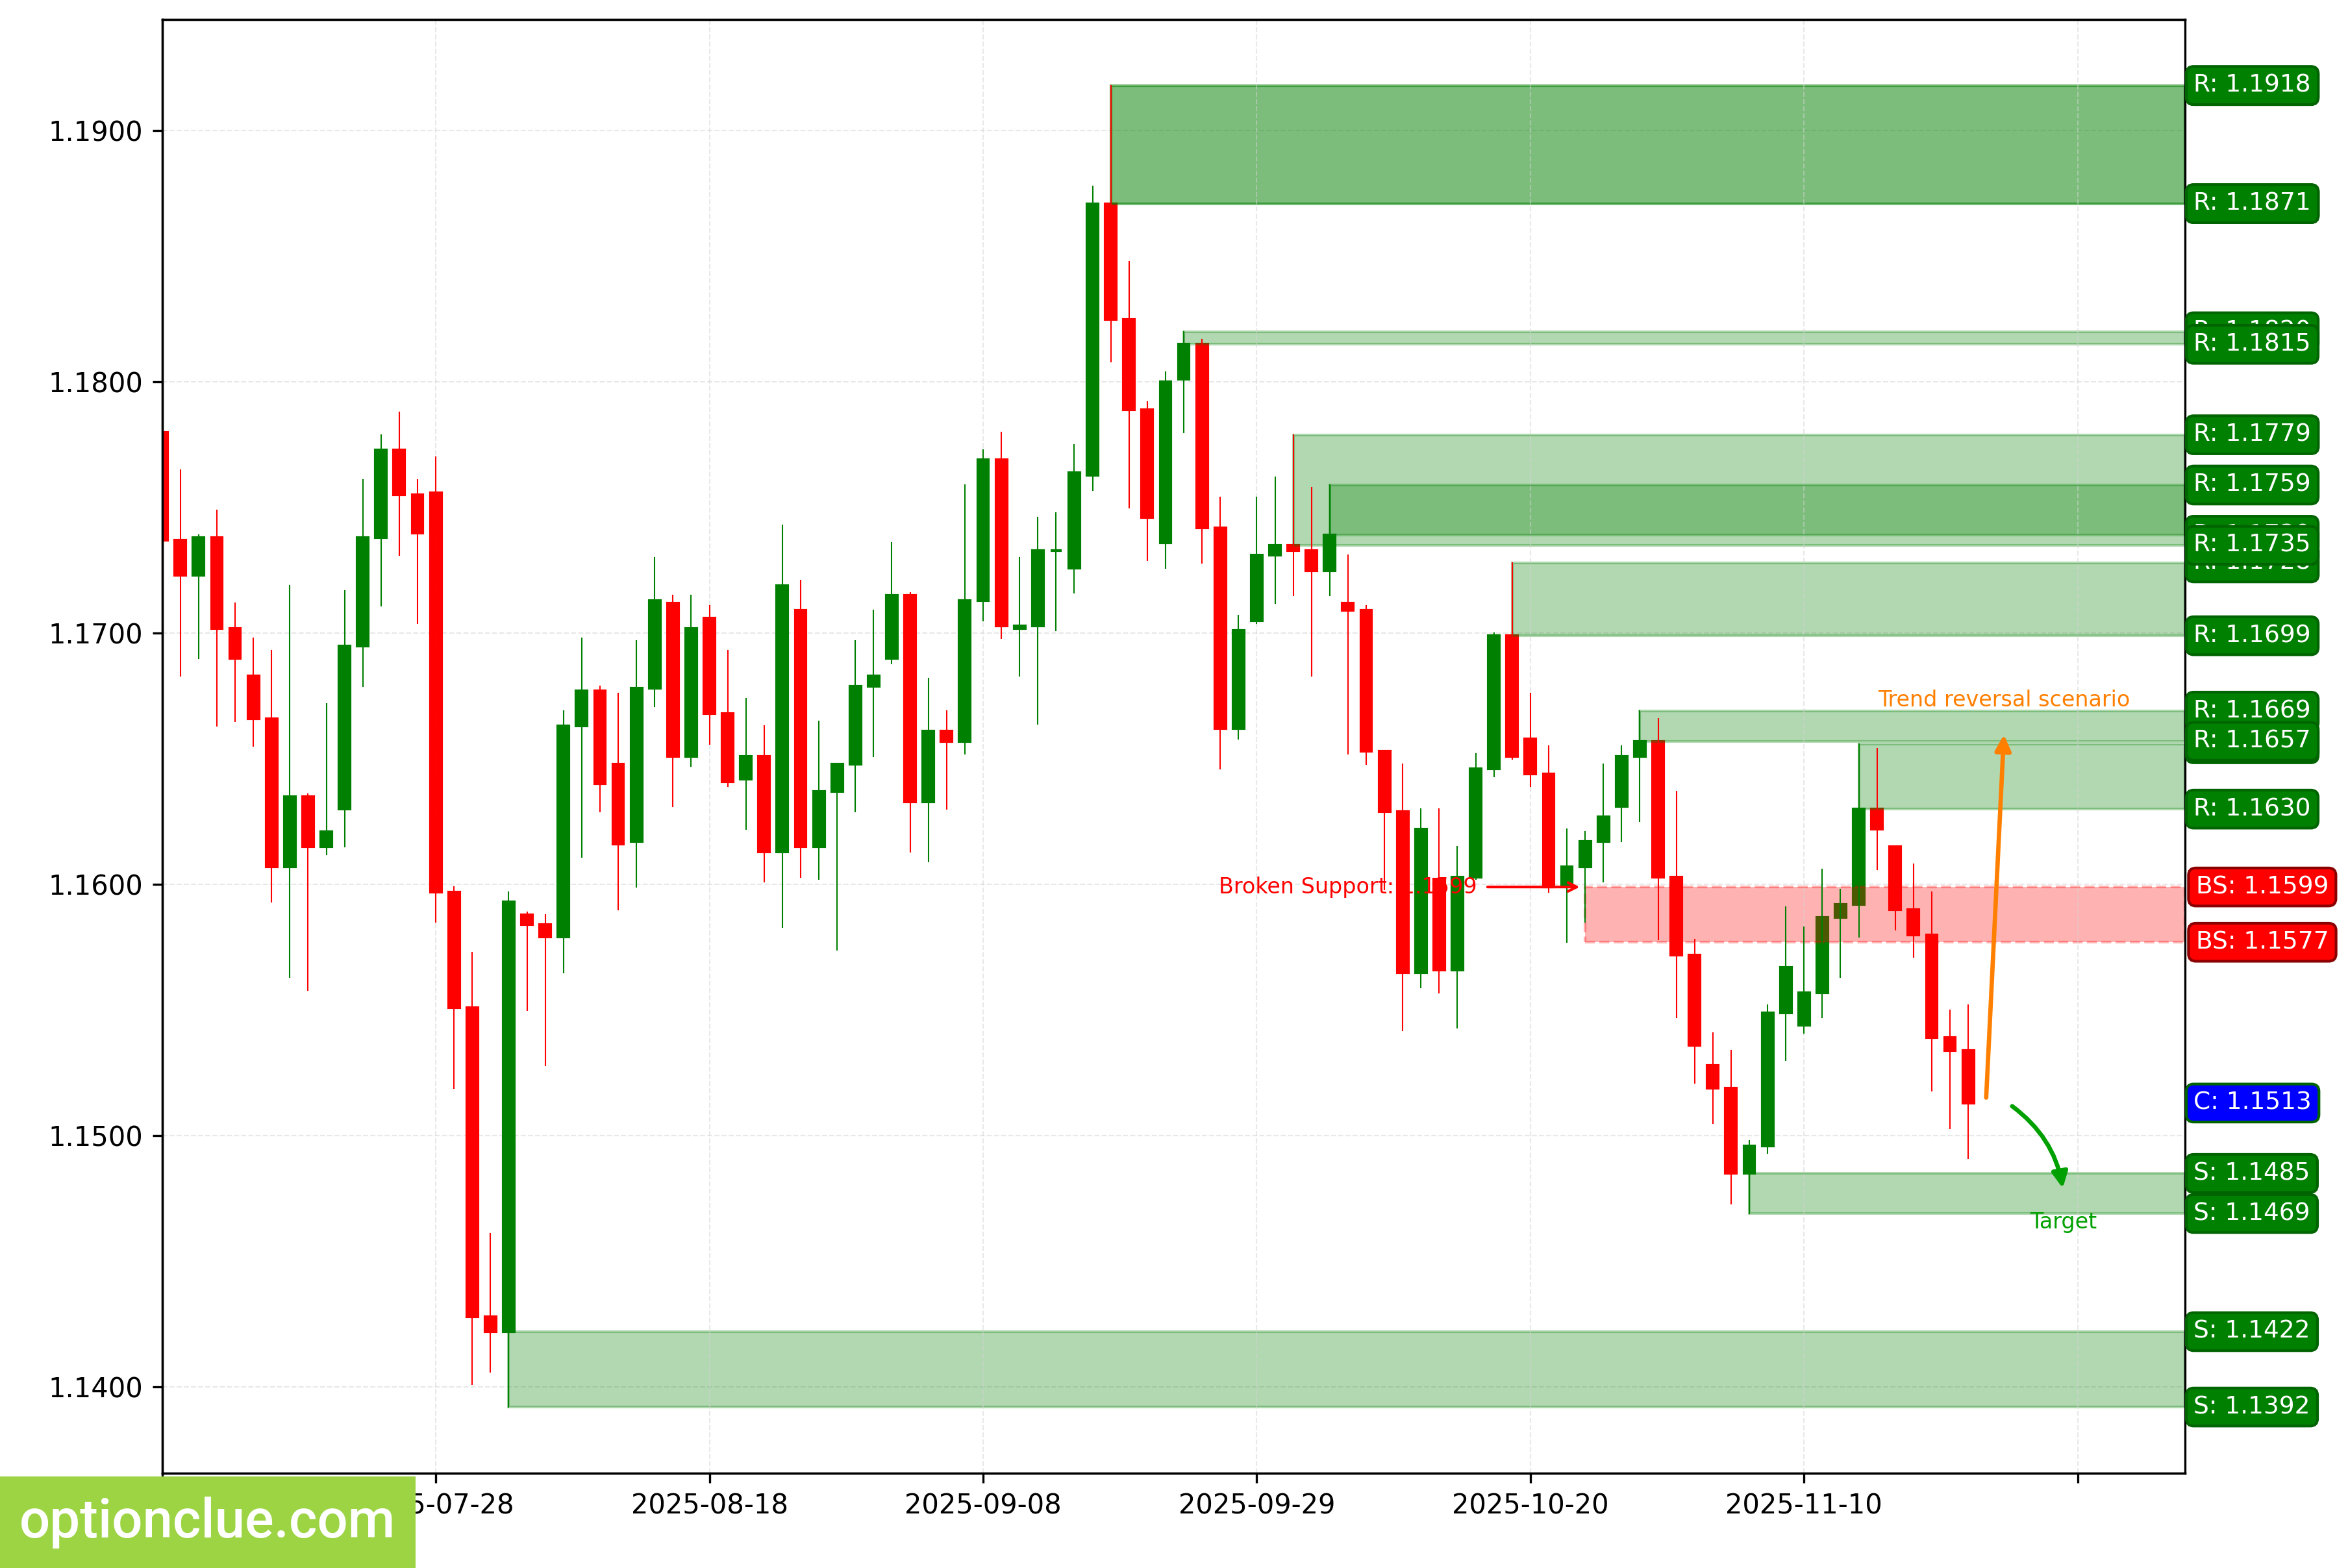
EURUSD. Technical analysis. D1.
British Pound (GBPUSD)
The bearish trend continues. The last broken level is support (1.3085 — 1.3128). The breakout occurred 3 candlesticks ago, and the price has returned to this last broken level. A corrective wave is now developing. A sell entry point on a rebound may form after the current correction completes.
The intermediate target for the downward movement is the support level with boundaries 1.3034 — 1.3055. If the trend successfully develops, a more distant target will be at the support level with boundaries 1.3010 — 1.3021.
If the correction ends near the last broken level (1.3085 — 1.3128), the potential reward/risk ratio to the first target may be small. To improve the ratio, it makes sense to either consider a deeper correction to the resistance level (1.3156 — 1.3193) or more distant targets.
Short positions will remain relevant as long as the market stays below the nearest resistance level with boundaries 1.3156 — 1.3193. If the market successfully establishes itself above this nearest resistance, the trend will reverse to bullish.
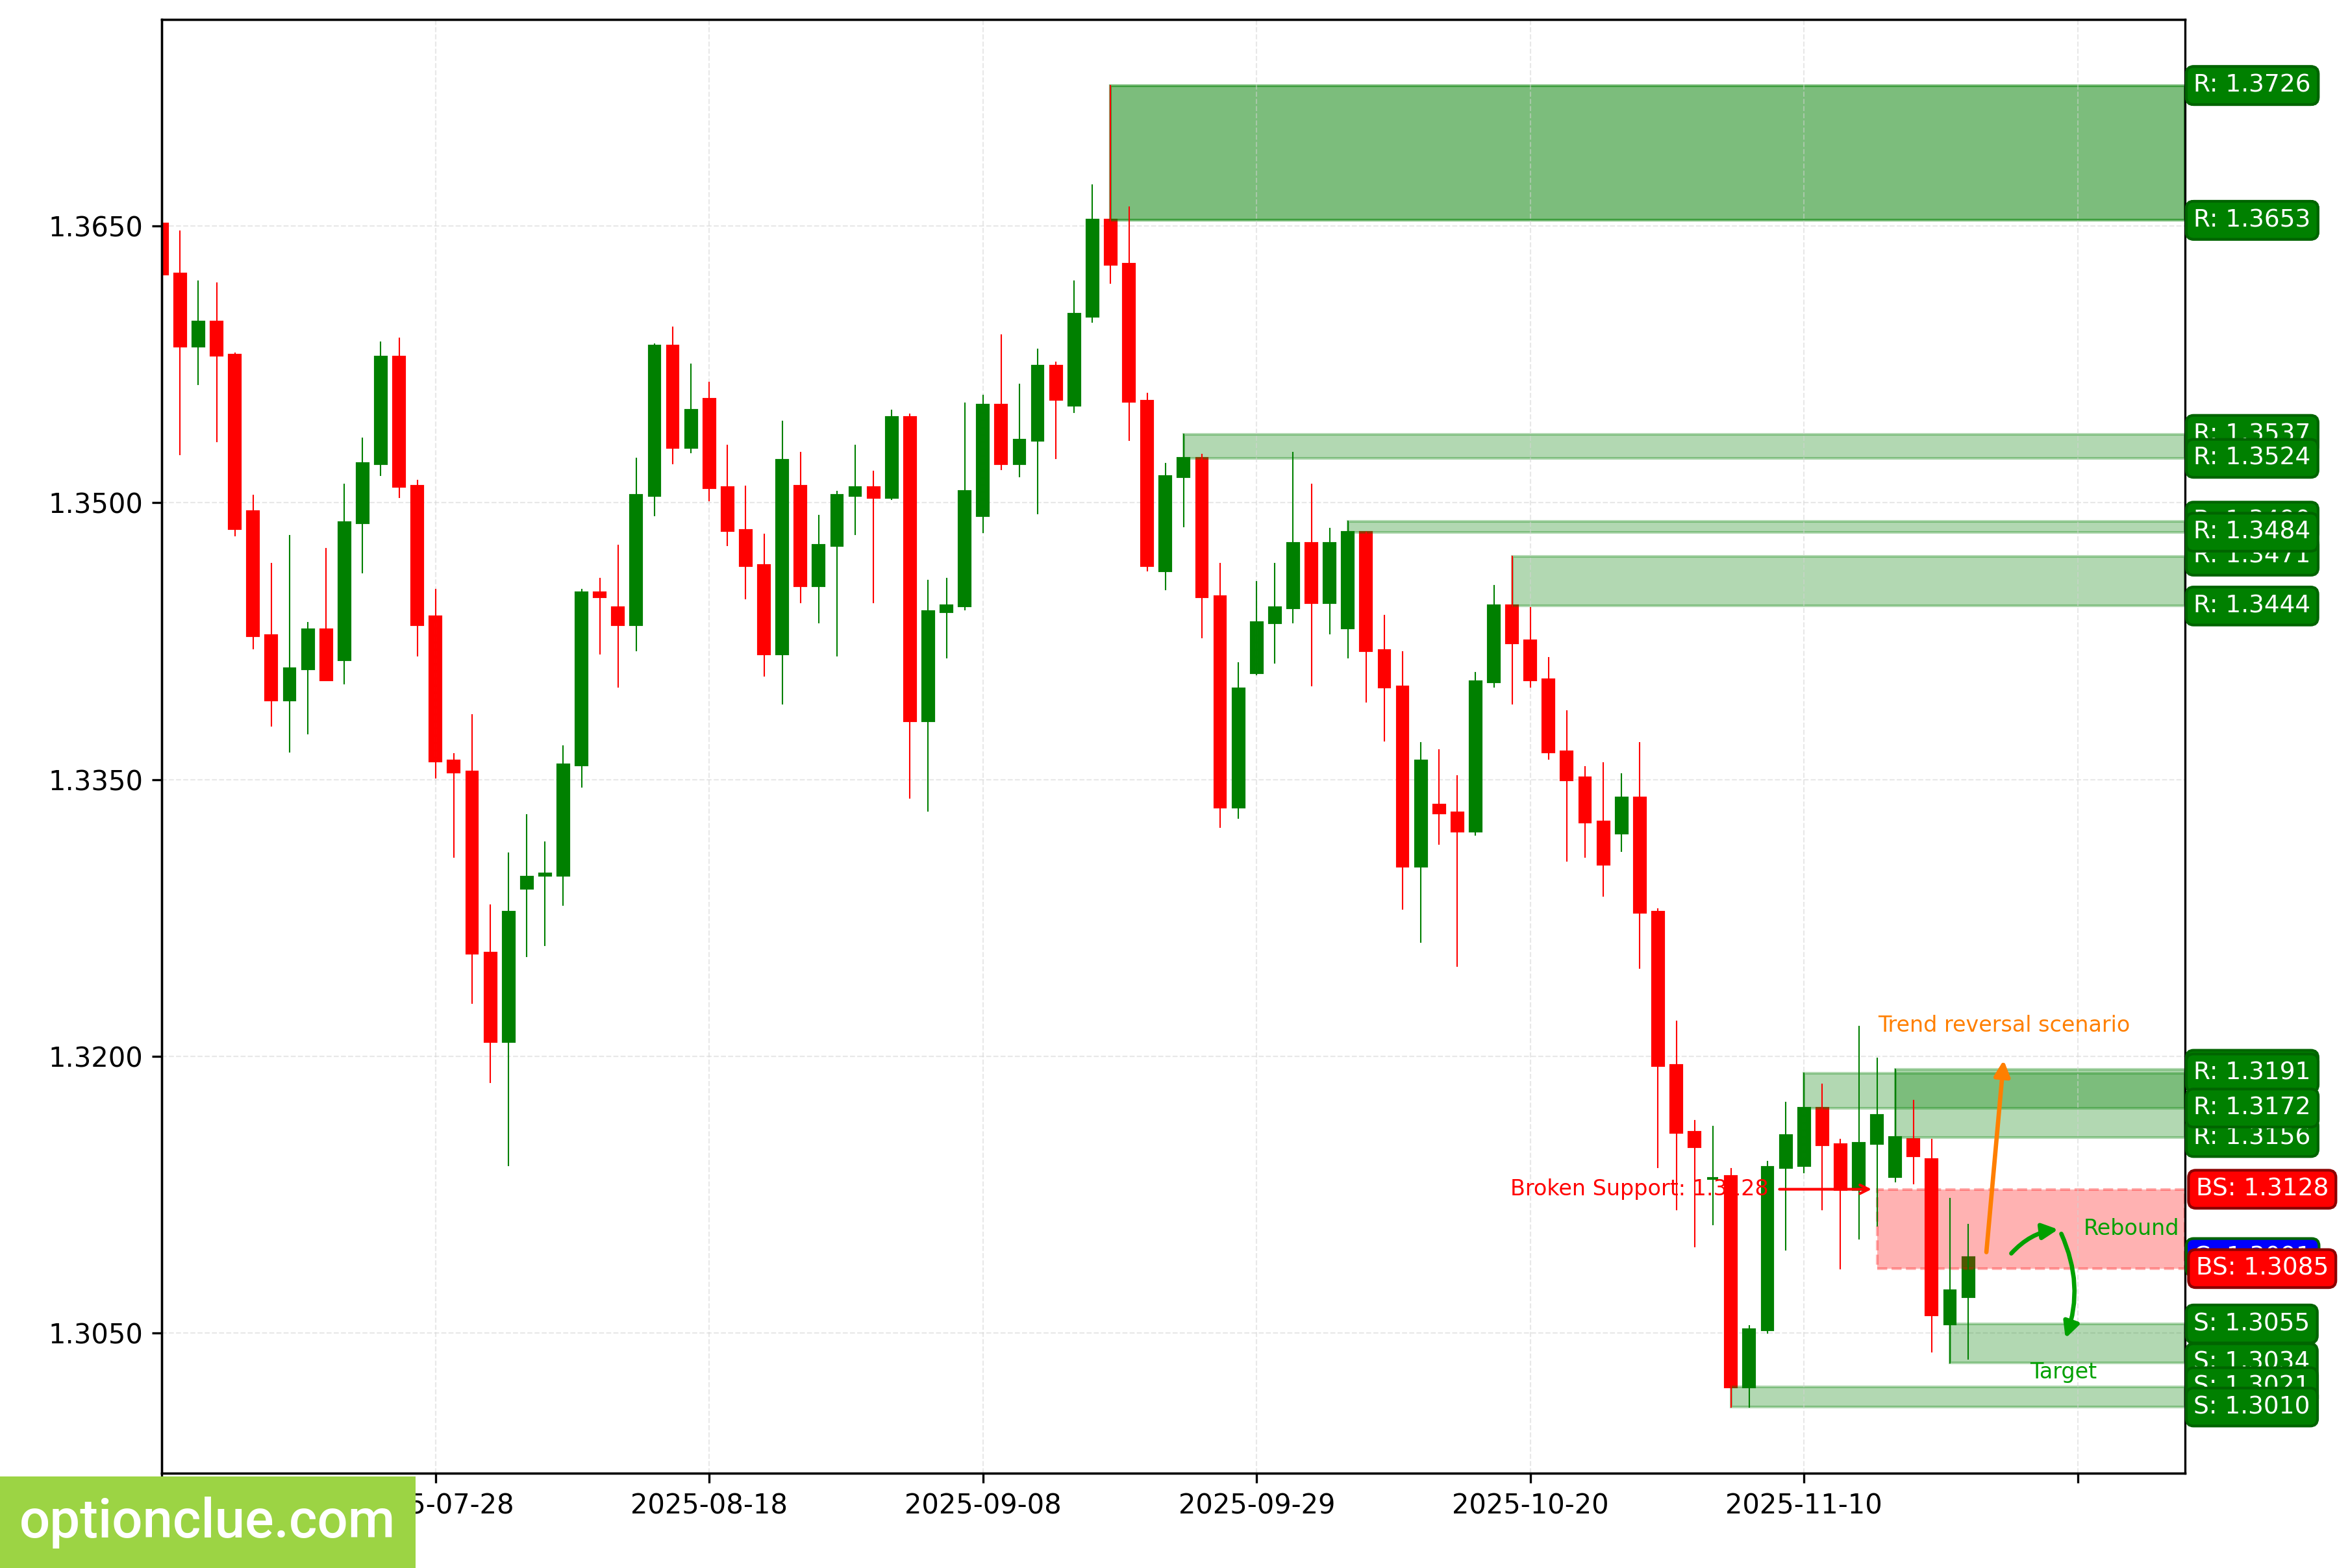
GBPUSD. Technical analysis. D1.
Swiss Franc (USDCHF)
The bullish trend continues; a correction ended 7 candlesticks ago, a buy entry point on a rebound formed, and an impulse wave is now developing. The last broken level is resistance (0.7973 — 0.7973). The breakout occurred 20 candlesticks ago.
The intermediate target for the upward movement is the resistance level with boundaries 0.8105 — 0.8124. If the market successfully establishes itself above this resistance, it will open the way for the price to move towards target #2 — the resistance level with boundaries 0.8126 — 0.8131.
Long positions will remain relevant as long as the market is above the nearest support level with boundaries 0.7876 — 0.7923. If the market successfully establishes itself below the nearest support (0.7876 — 0.7923), the trend will reverse to bearish.

USDCHF. Technical analysis. D1.
Japanese Yen (USDJPY)
The bullish trend continues; a corrective wave is developing. A buy entry point on a rebound may form after the current correction completes. The last broken level is resistance (154.71 — 155.04). The breakout occurred 5 candlesticks ago.
If the upward movement resumes, the first target will be the resistance level with boundaries 158.23 — 158.87.
Potential entry points may appear near the last broken level (154.71 — 155.04), however, the reward/risk ratio to the first target may be low. More favorable entry points may form in the event of a deeper correction to the support level (153.62 — 154.40).
Long positions will remain relevant as long as the market is above the nearest support level with boundaries 153.62 — 154.40. If the market successfully establishes itself below this nearest support, the trend will reverse to bearish.
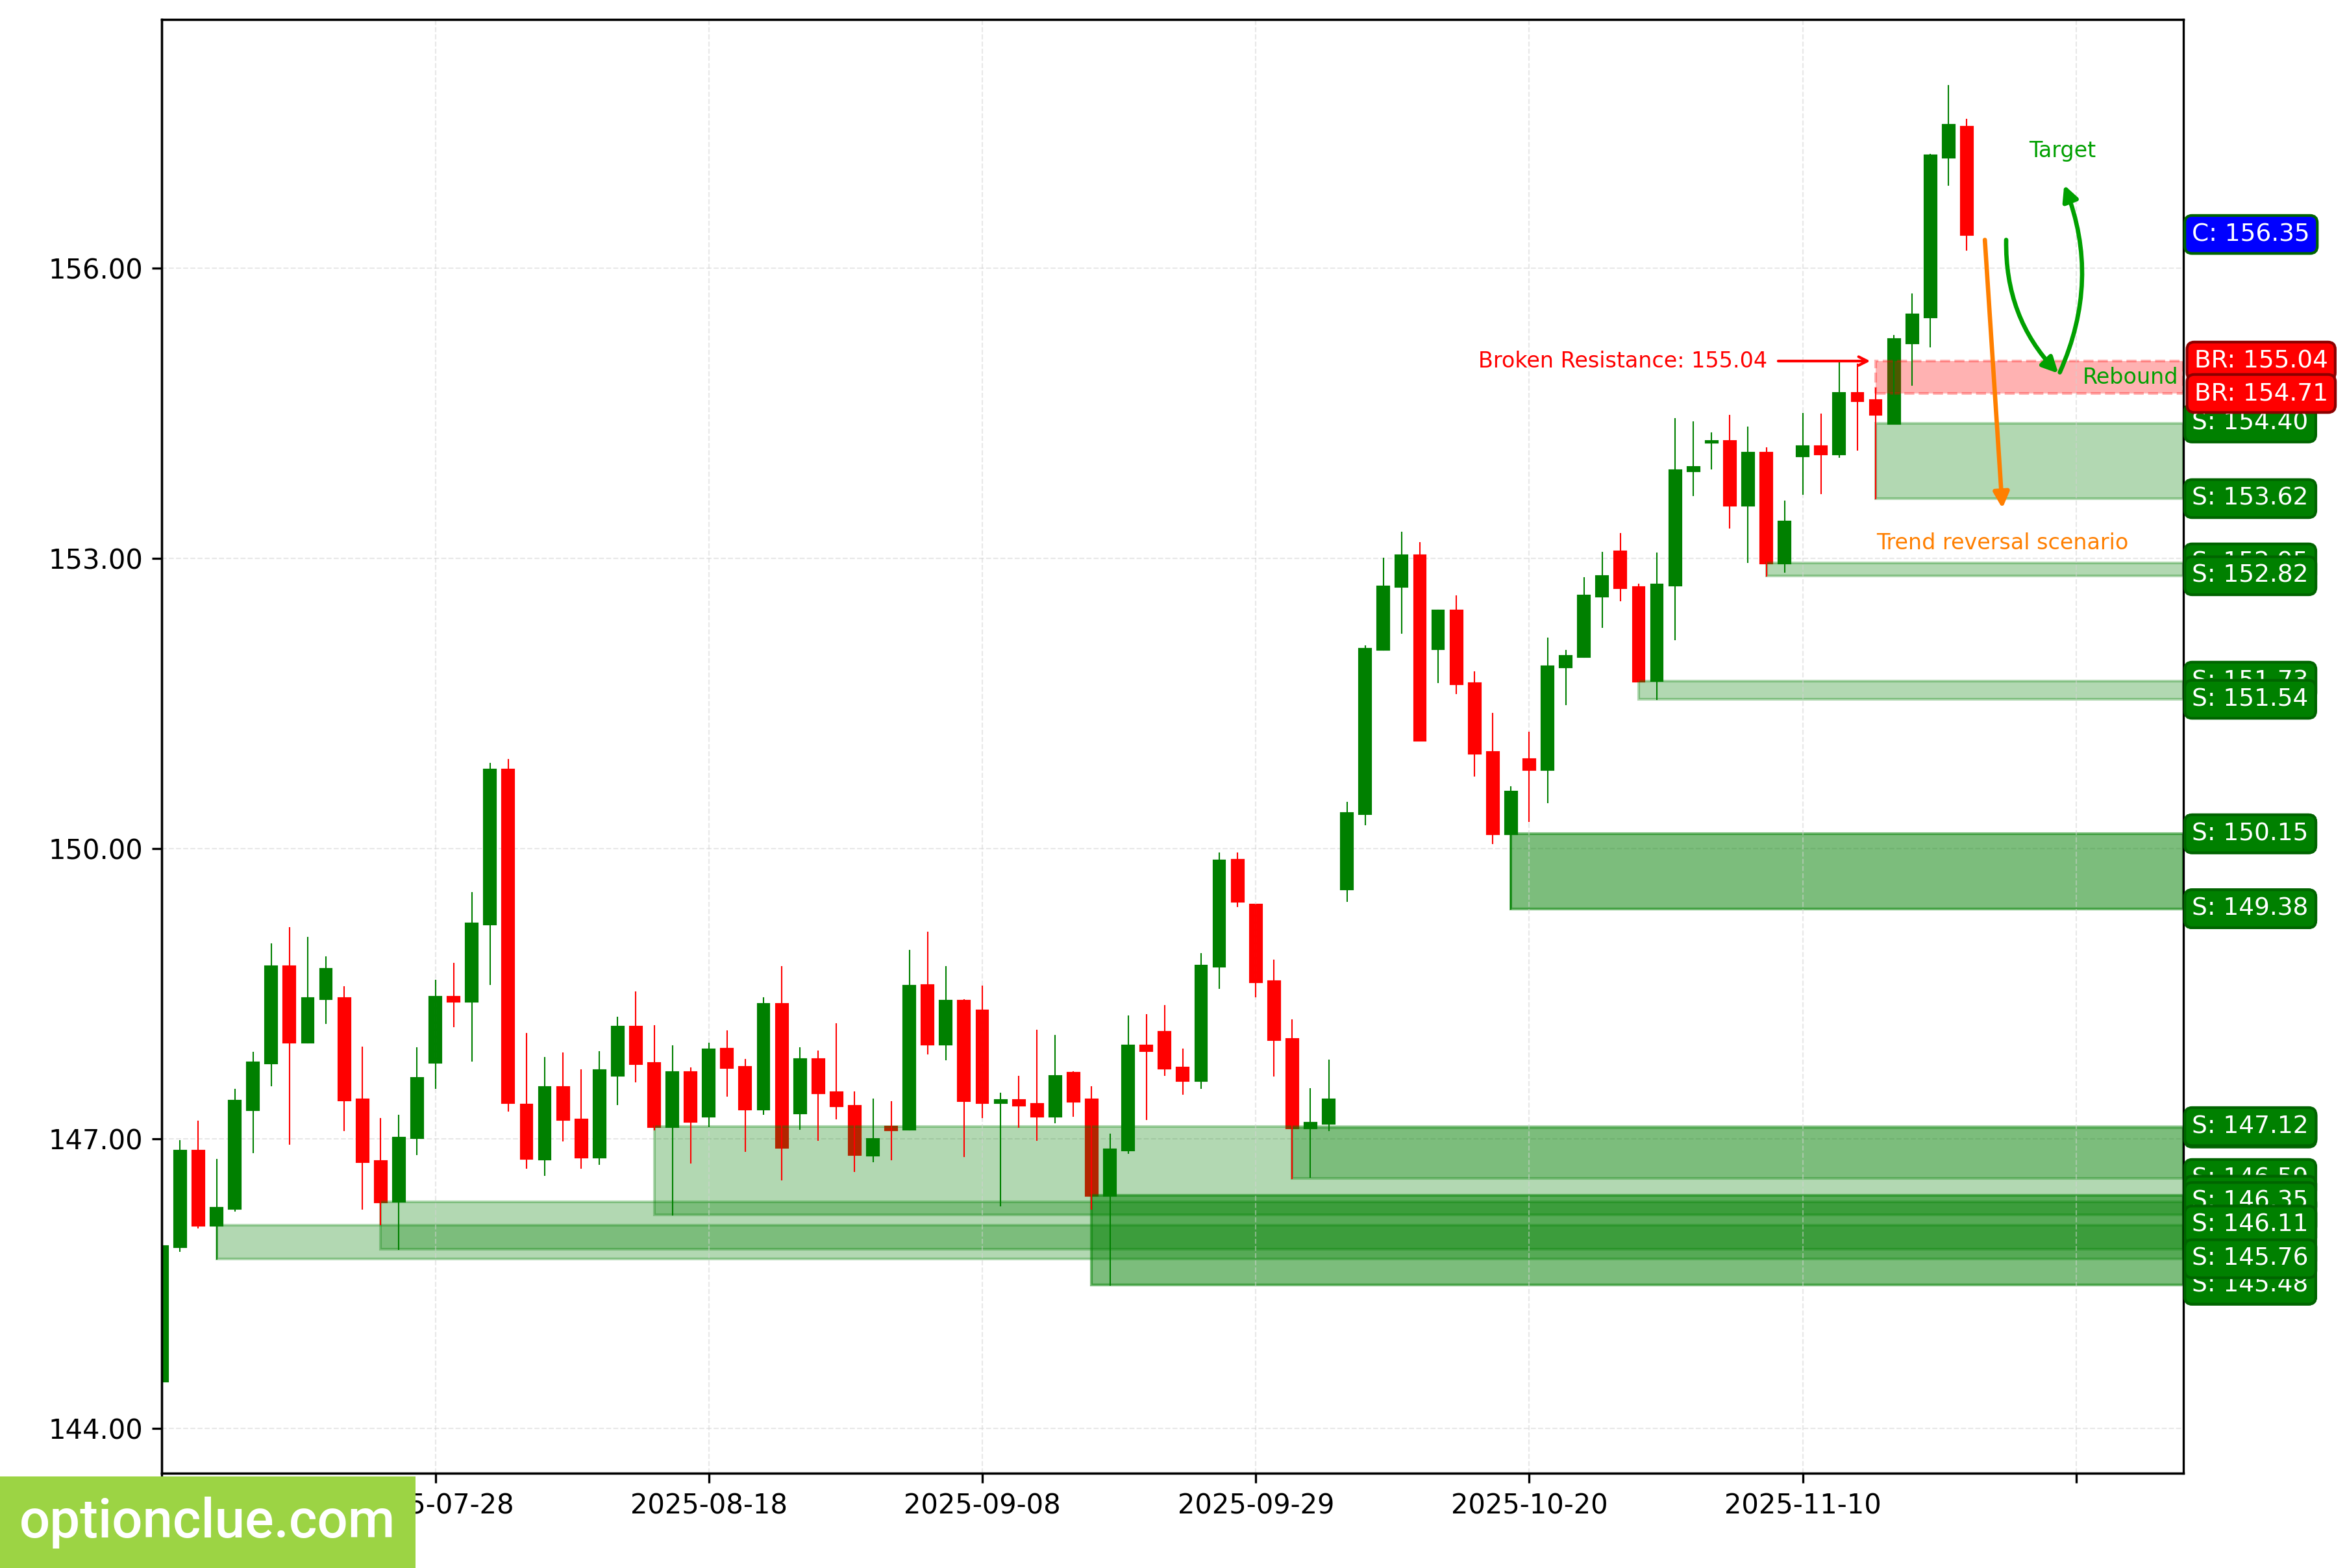
USDJPY. Technical analysis. D1.
Canadian Dollar (USDCAD)
The bullish trend continues; a correction ended 3 candlesticks ago, a buy entry point on a rebound formed, and an impulse wave is now developing. The last broken level is resistance (1.4036 — 1.4045). The breakout occurred 5 candlesticks ago.
The intermediate target for the upward movement is the resistance level with boundaries 1.4388 — 1.4415. If the trend successfully develops, a more distant target will be at the resistance level with boundaries 1.4442 — 1.4451.
Long positions will remain relevant as long as the market is above the nearest support level with boundaries 1.3983 — 1.4002. If the market successfully establishes itself below the nearest support (1.3983 — 1.4002), the trend will reverse to bearish.
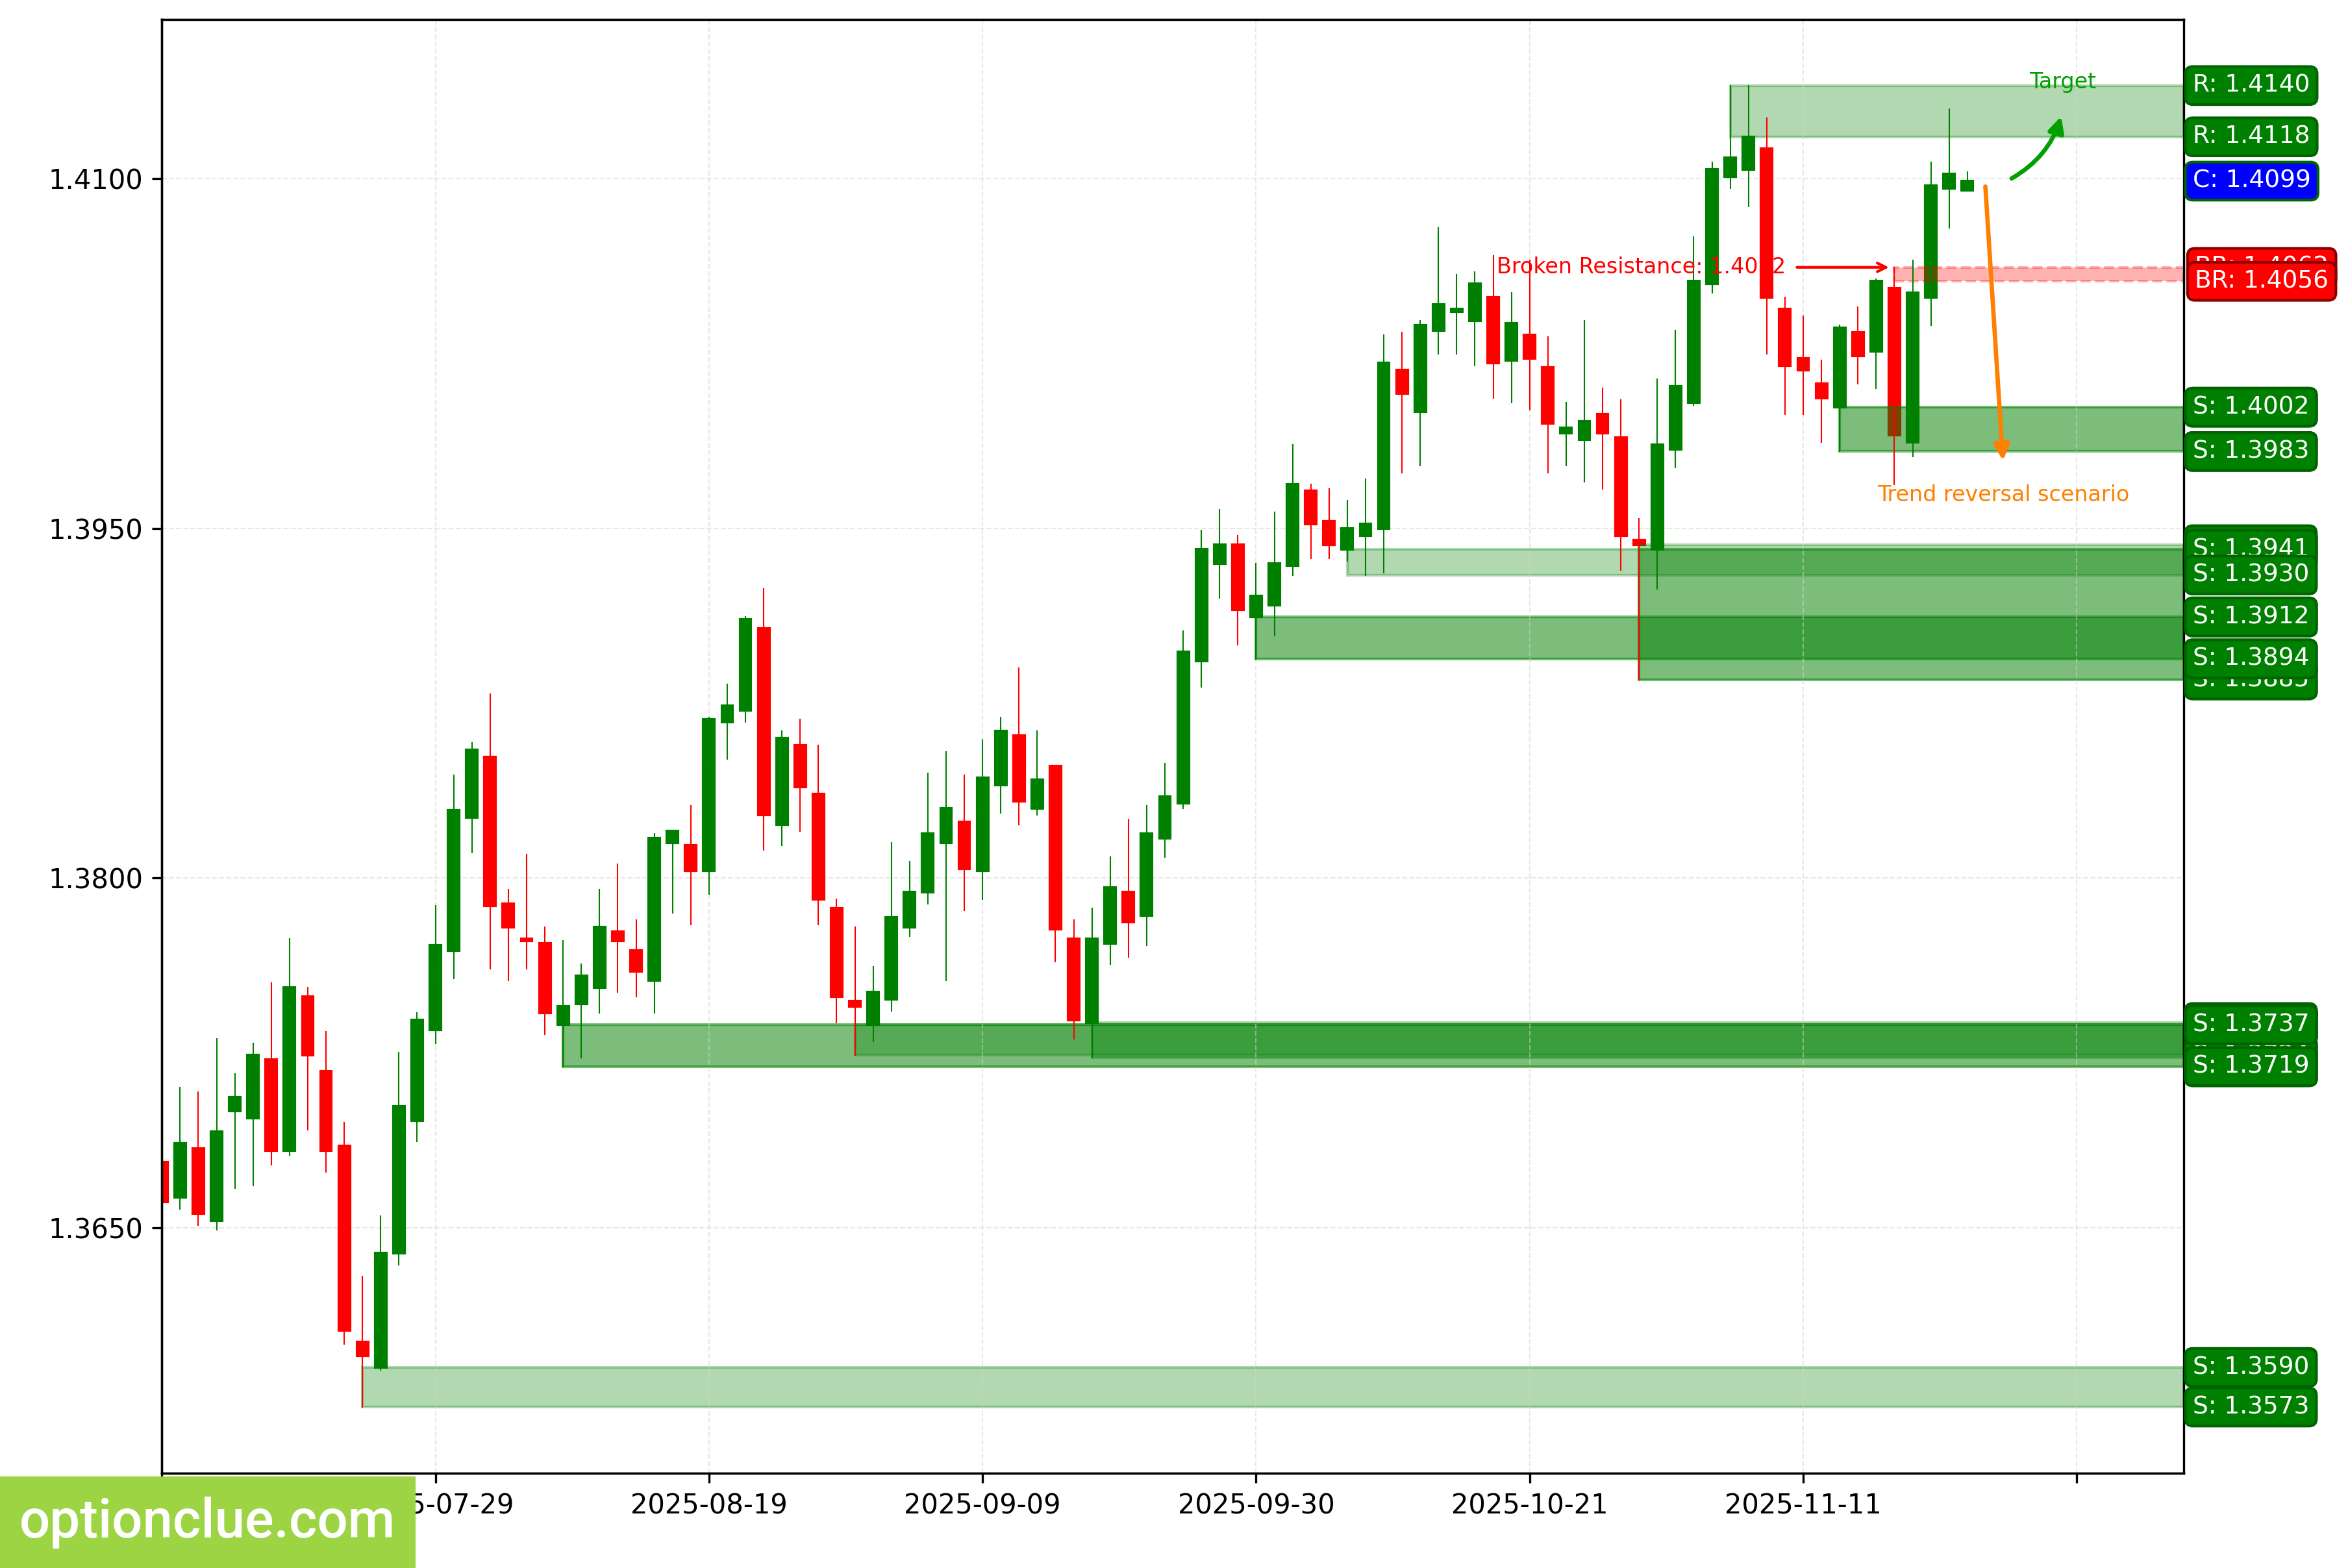
USDCAD. Technical analysis. D1.
Australian Dollar (AUDUSD)
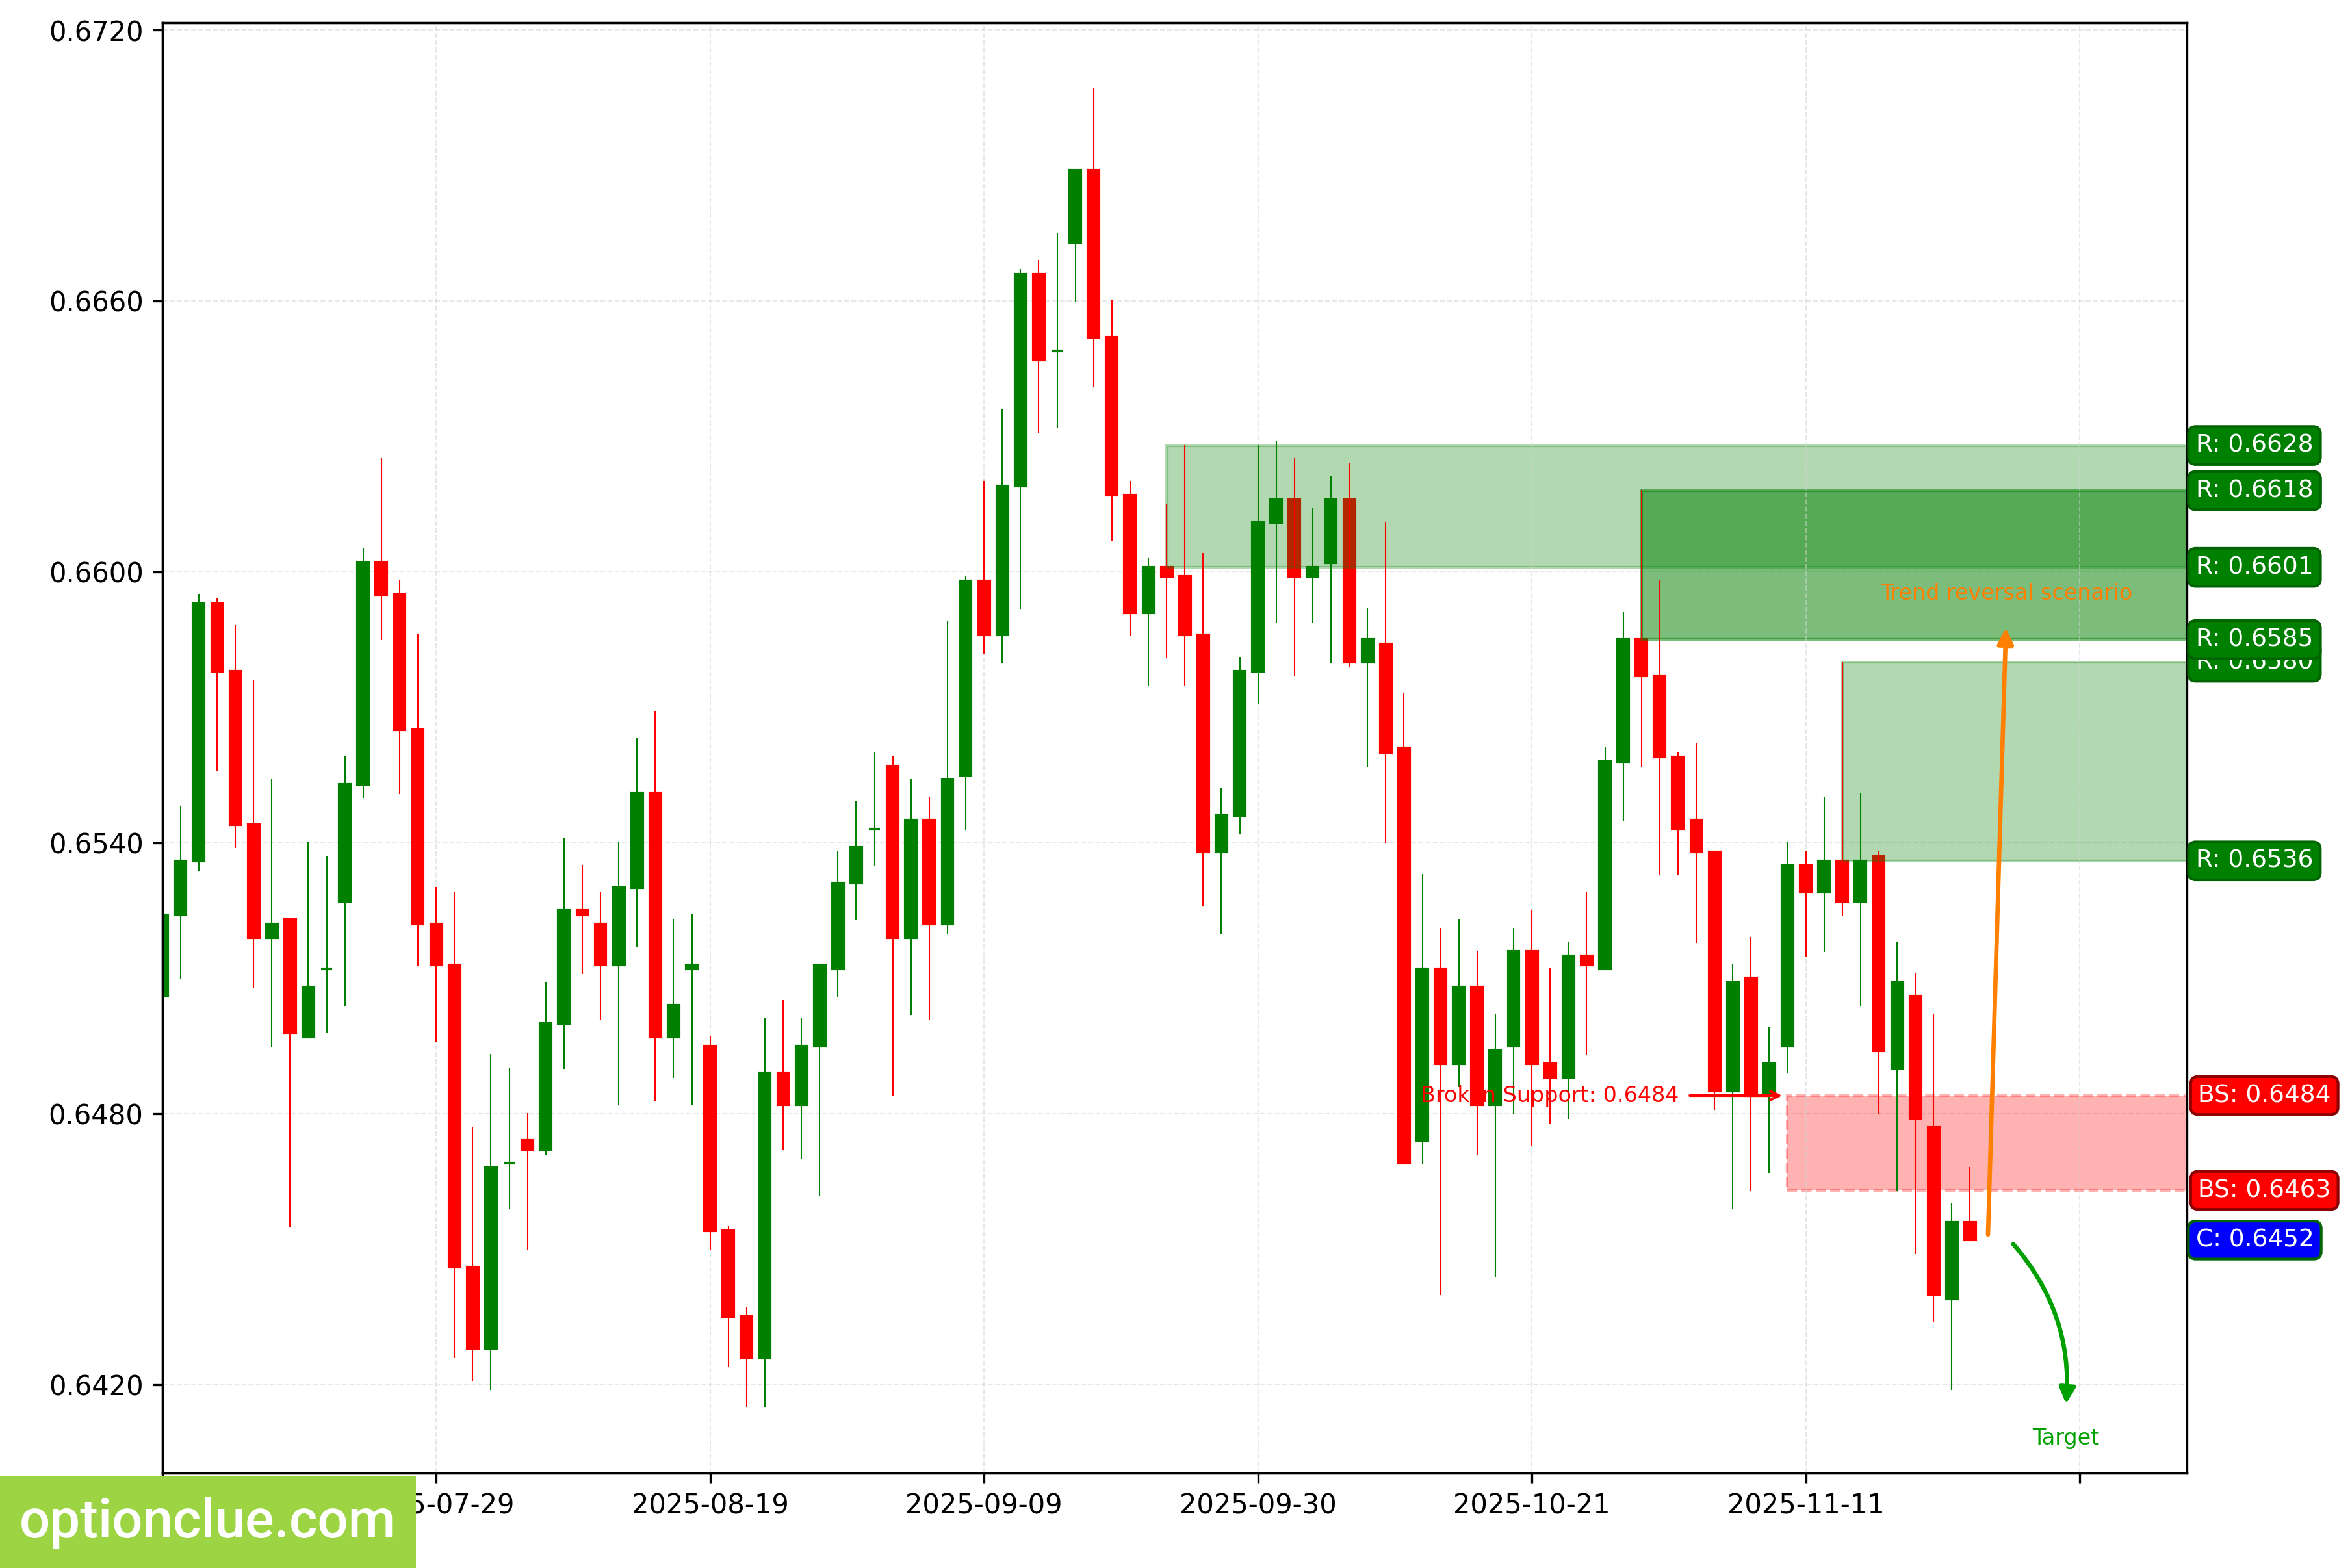
The bearish trend continues; a corrective wave is developing. The last broken level is support (0.6463 — 0.6484). The breakout occurred 2 candlesticks ago. A sell entry point on a rebound may form after the current correction completes.
The intermediate target for the downward movement is the support level with boundaries 0.6415 — 0.6426. If the trend successfully develops, a more distant target will be at the support level with boundaries 0.6392 — 0.6409.
If the correction ends near the last broken level (0.6463 — 0.6484), the potential reward/risk ratio may be small (0.3:1). If a correction occurs to the resistance level (0.6536 — 0.6580), the potential reward/risk ratio could be around 2:1.
Short positions will remain relevant as long as the market stays below the nearest resistance level with boundaries 0.6536 — 0.6580. If the market successfully establishes itself above this nearest resistance, the trend will reverse to bullish.
AUDUSD. Technical analysis. D1.
New Zealand Dollar (NZDUSD)
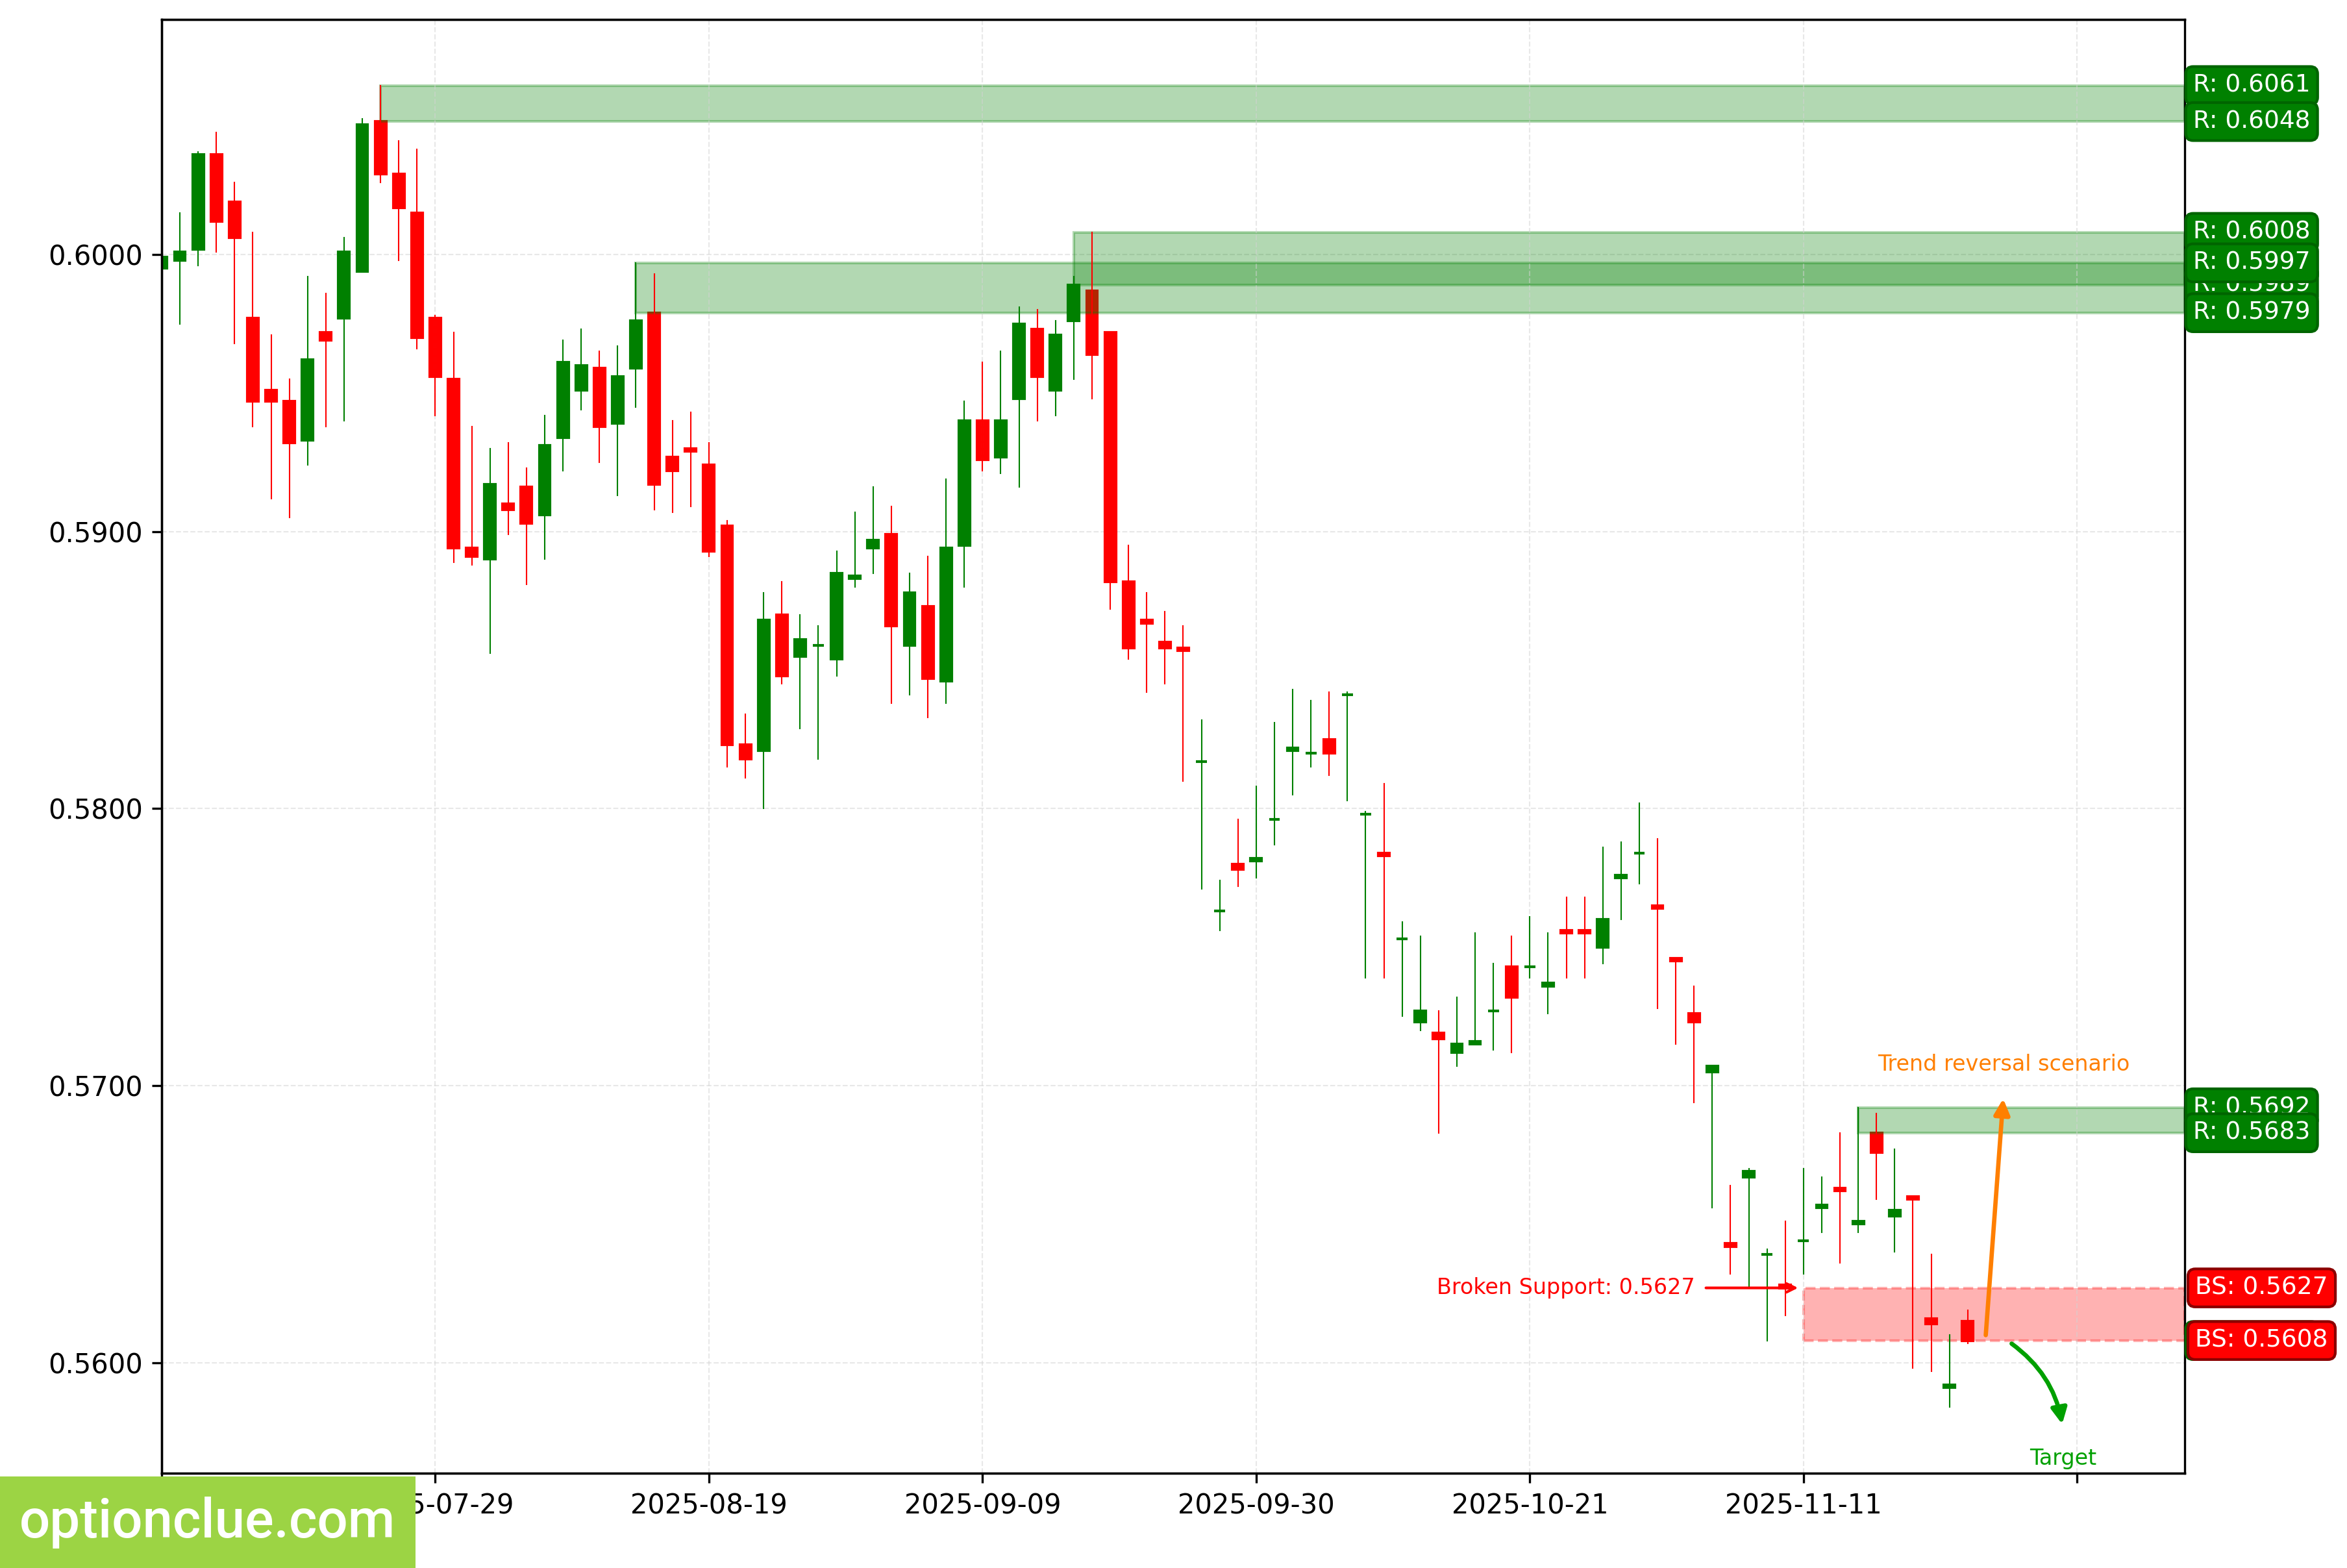
The bearish trend continues; a corrective wave is developing. A sell entry point on a rebound may form after the current correction completes. The last broken level is support (0.5608 — 0.5627). The breakout occurred 2 candlesticks ago, and the price has returned to this last broken level.
The intermediate target for the downward movement is the support level with boundaries 0.5485 — 0.5525.
If the correction ends near the last broken level (0.5608 — 0.5627), the potential reward/risk ratio to the first target could be attractive.
Short positions will remain relevant as long as the market stays below the nearest resistance level with boundaries 0.5660 — 0.5677. If the market successfully establishes itself above this nearest resistance, the trend will reverse to bullish.
NZDUSD. Technical analysis. D1.
Bitcoin (BTC)
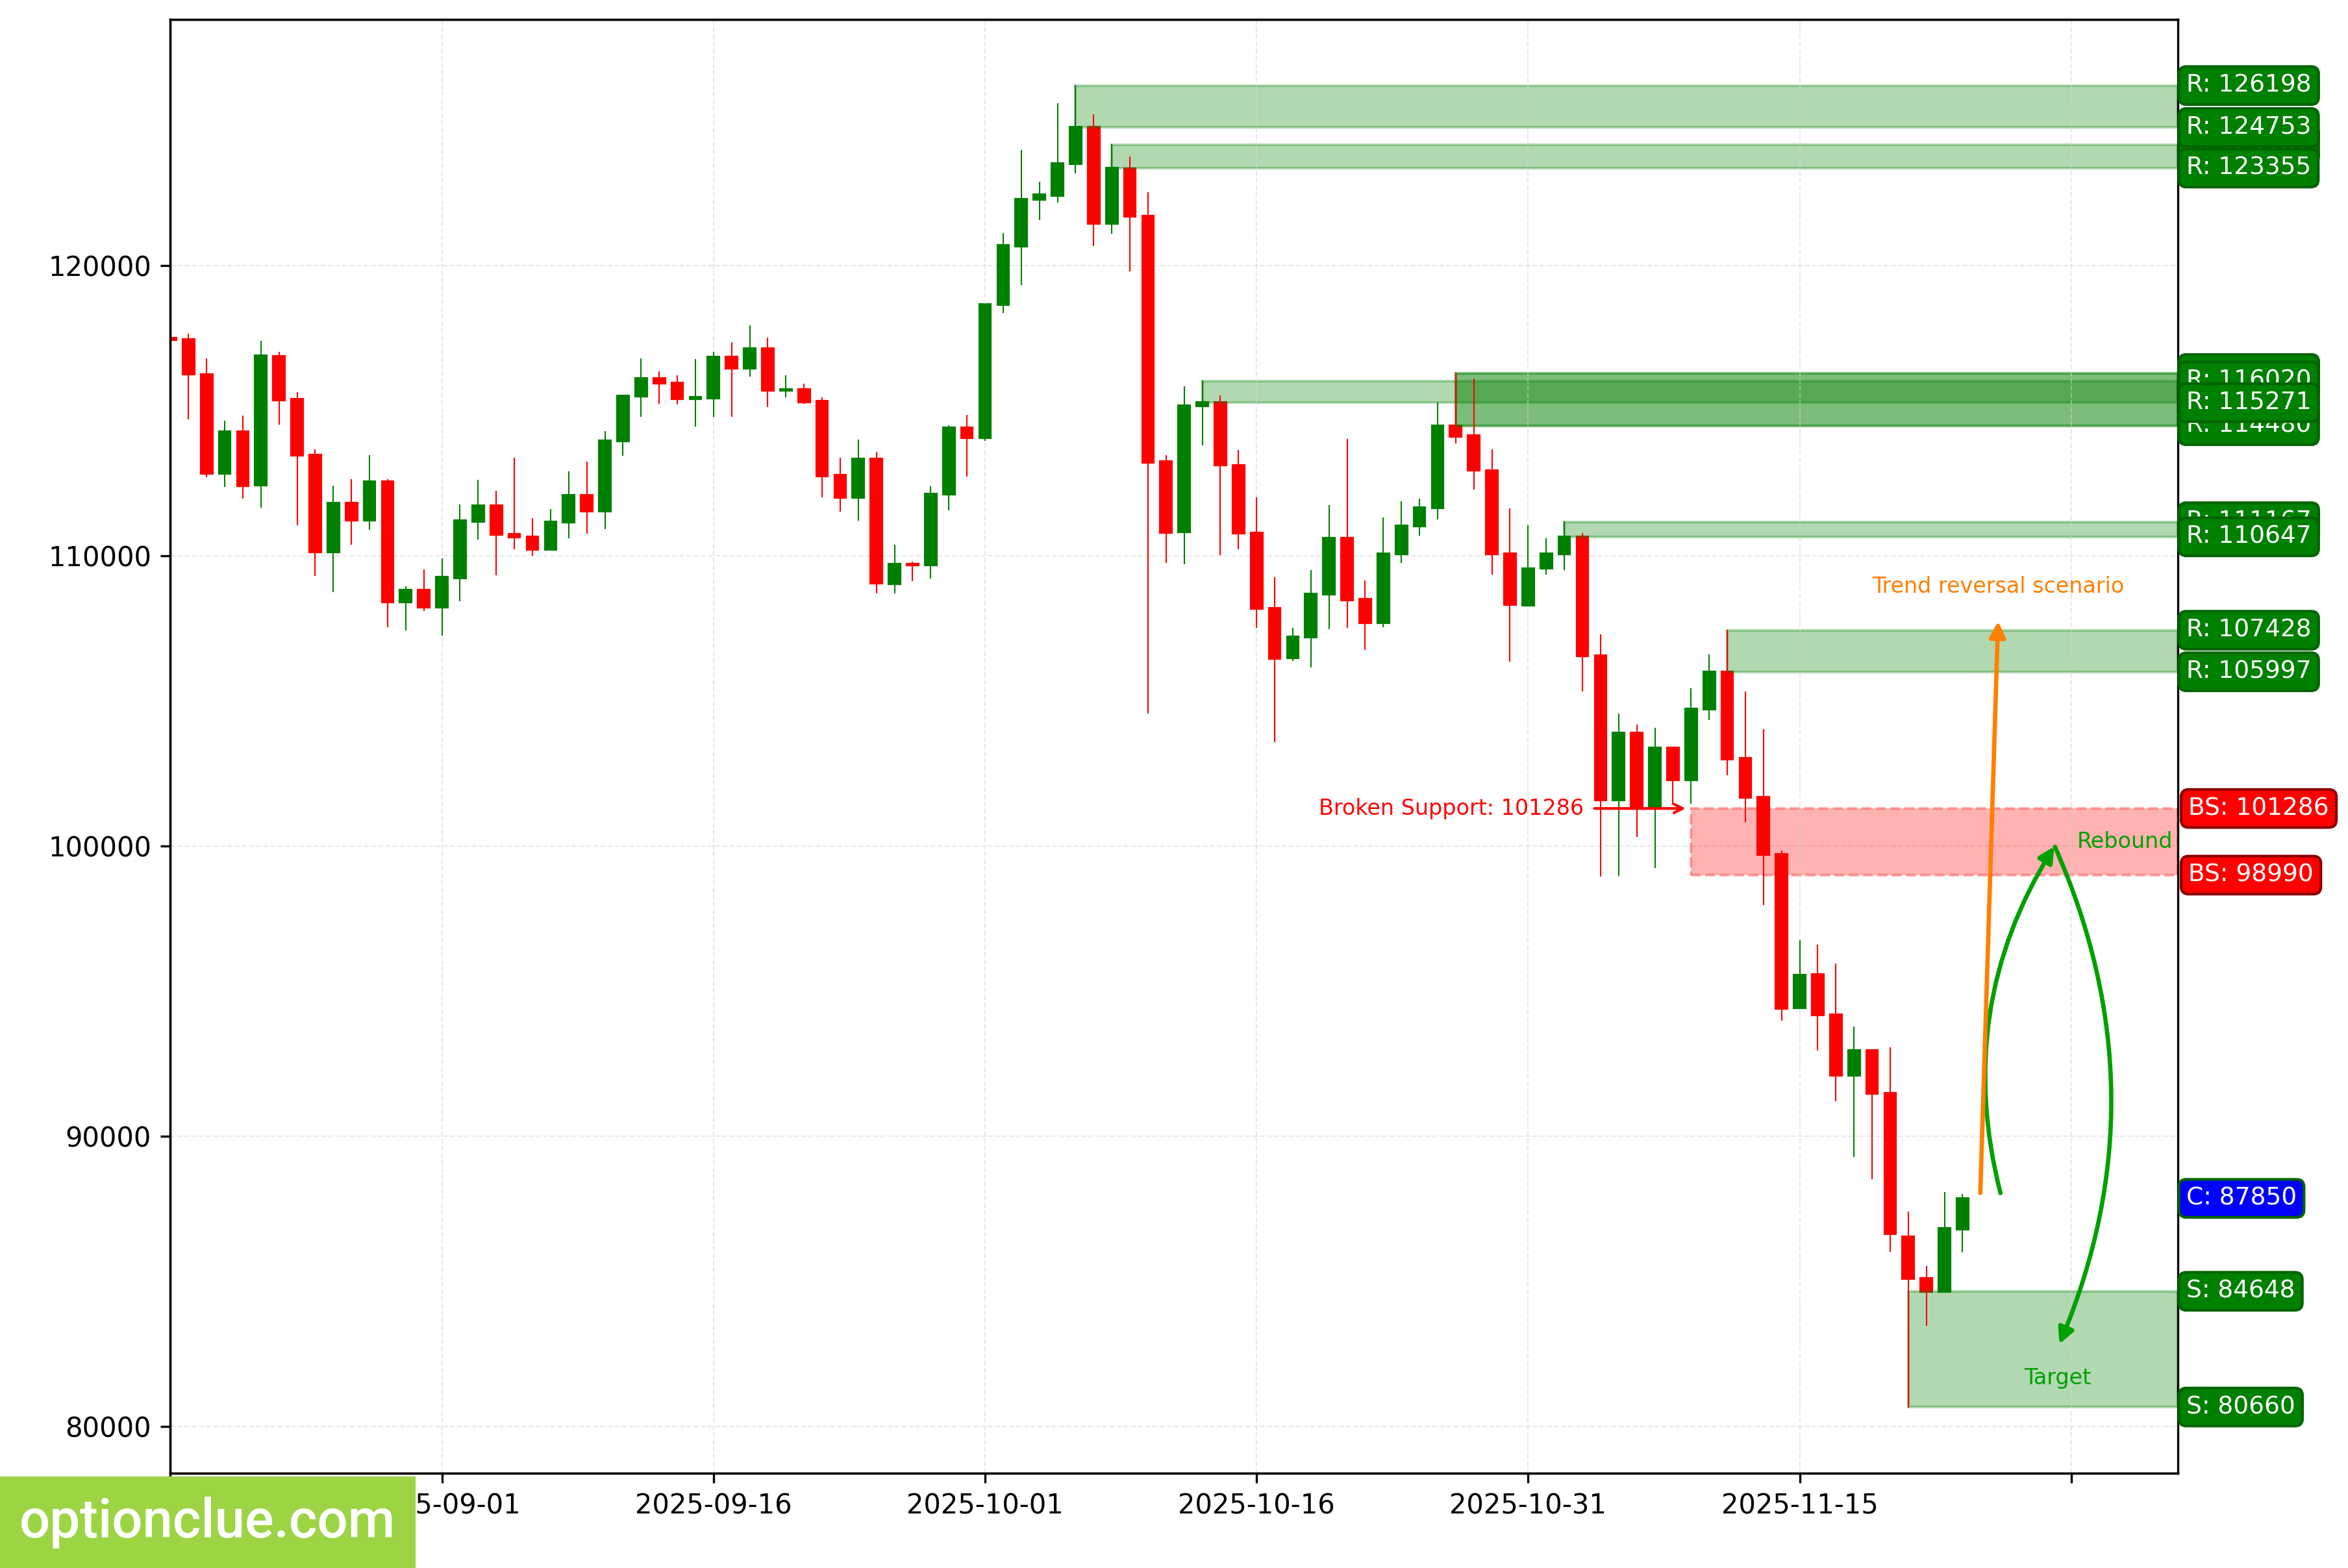
The bearish trend continues; an impulse wave is developing. The last broken level is support (98990 — 101286). New sell entry points on a rebound may appear after a correction forms.
The intermediate target for the downward movement is the support level with boundaries 83101 — 83669. If the trend successfully develops, a more distant target will be at the support level with boundaries 82769 — 83405.
If the correction ends near the resistance level (105997 — 107428), the potential reward/risk ratio could be 4:1.
Short positions will remain relevant as long as the market stays below the nearest resistance level with boundaries 105997 — 107428. If the market successfully establishes itself above this nearest resistance, the trend will reverse to bullish.
BTC. Technical analysis. D1.
Ether (ETH)
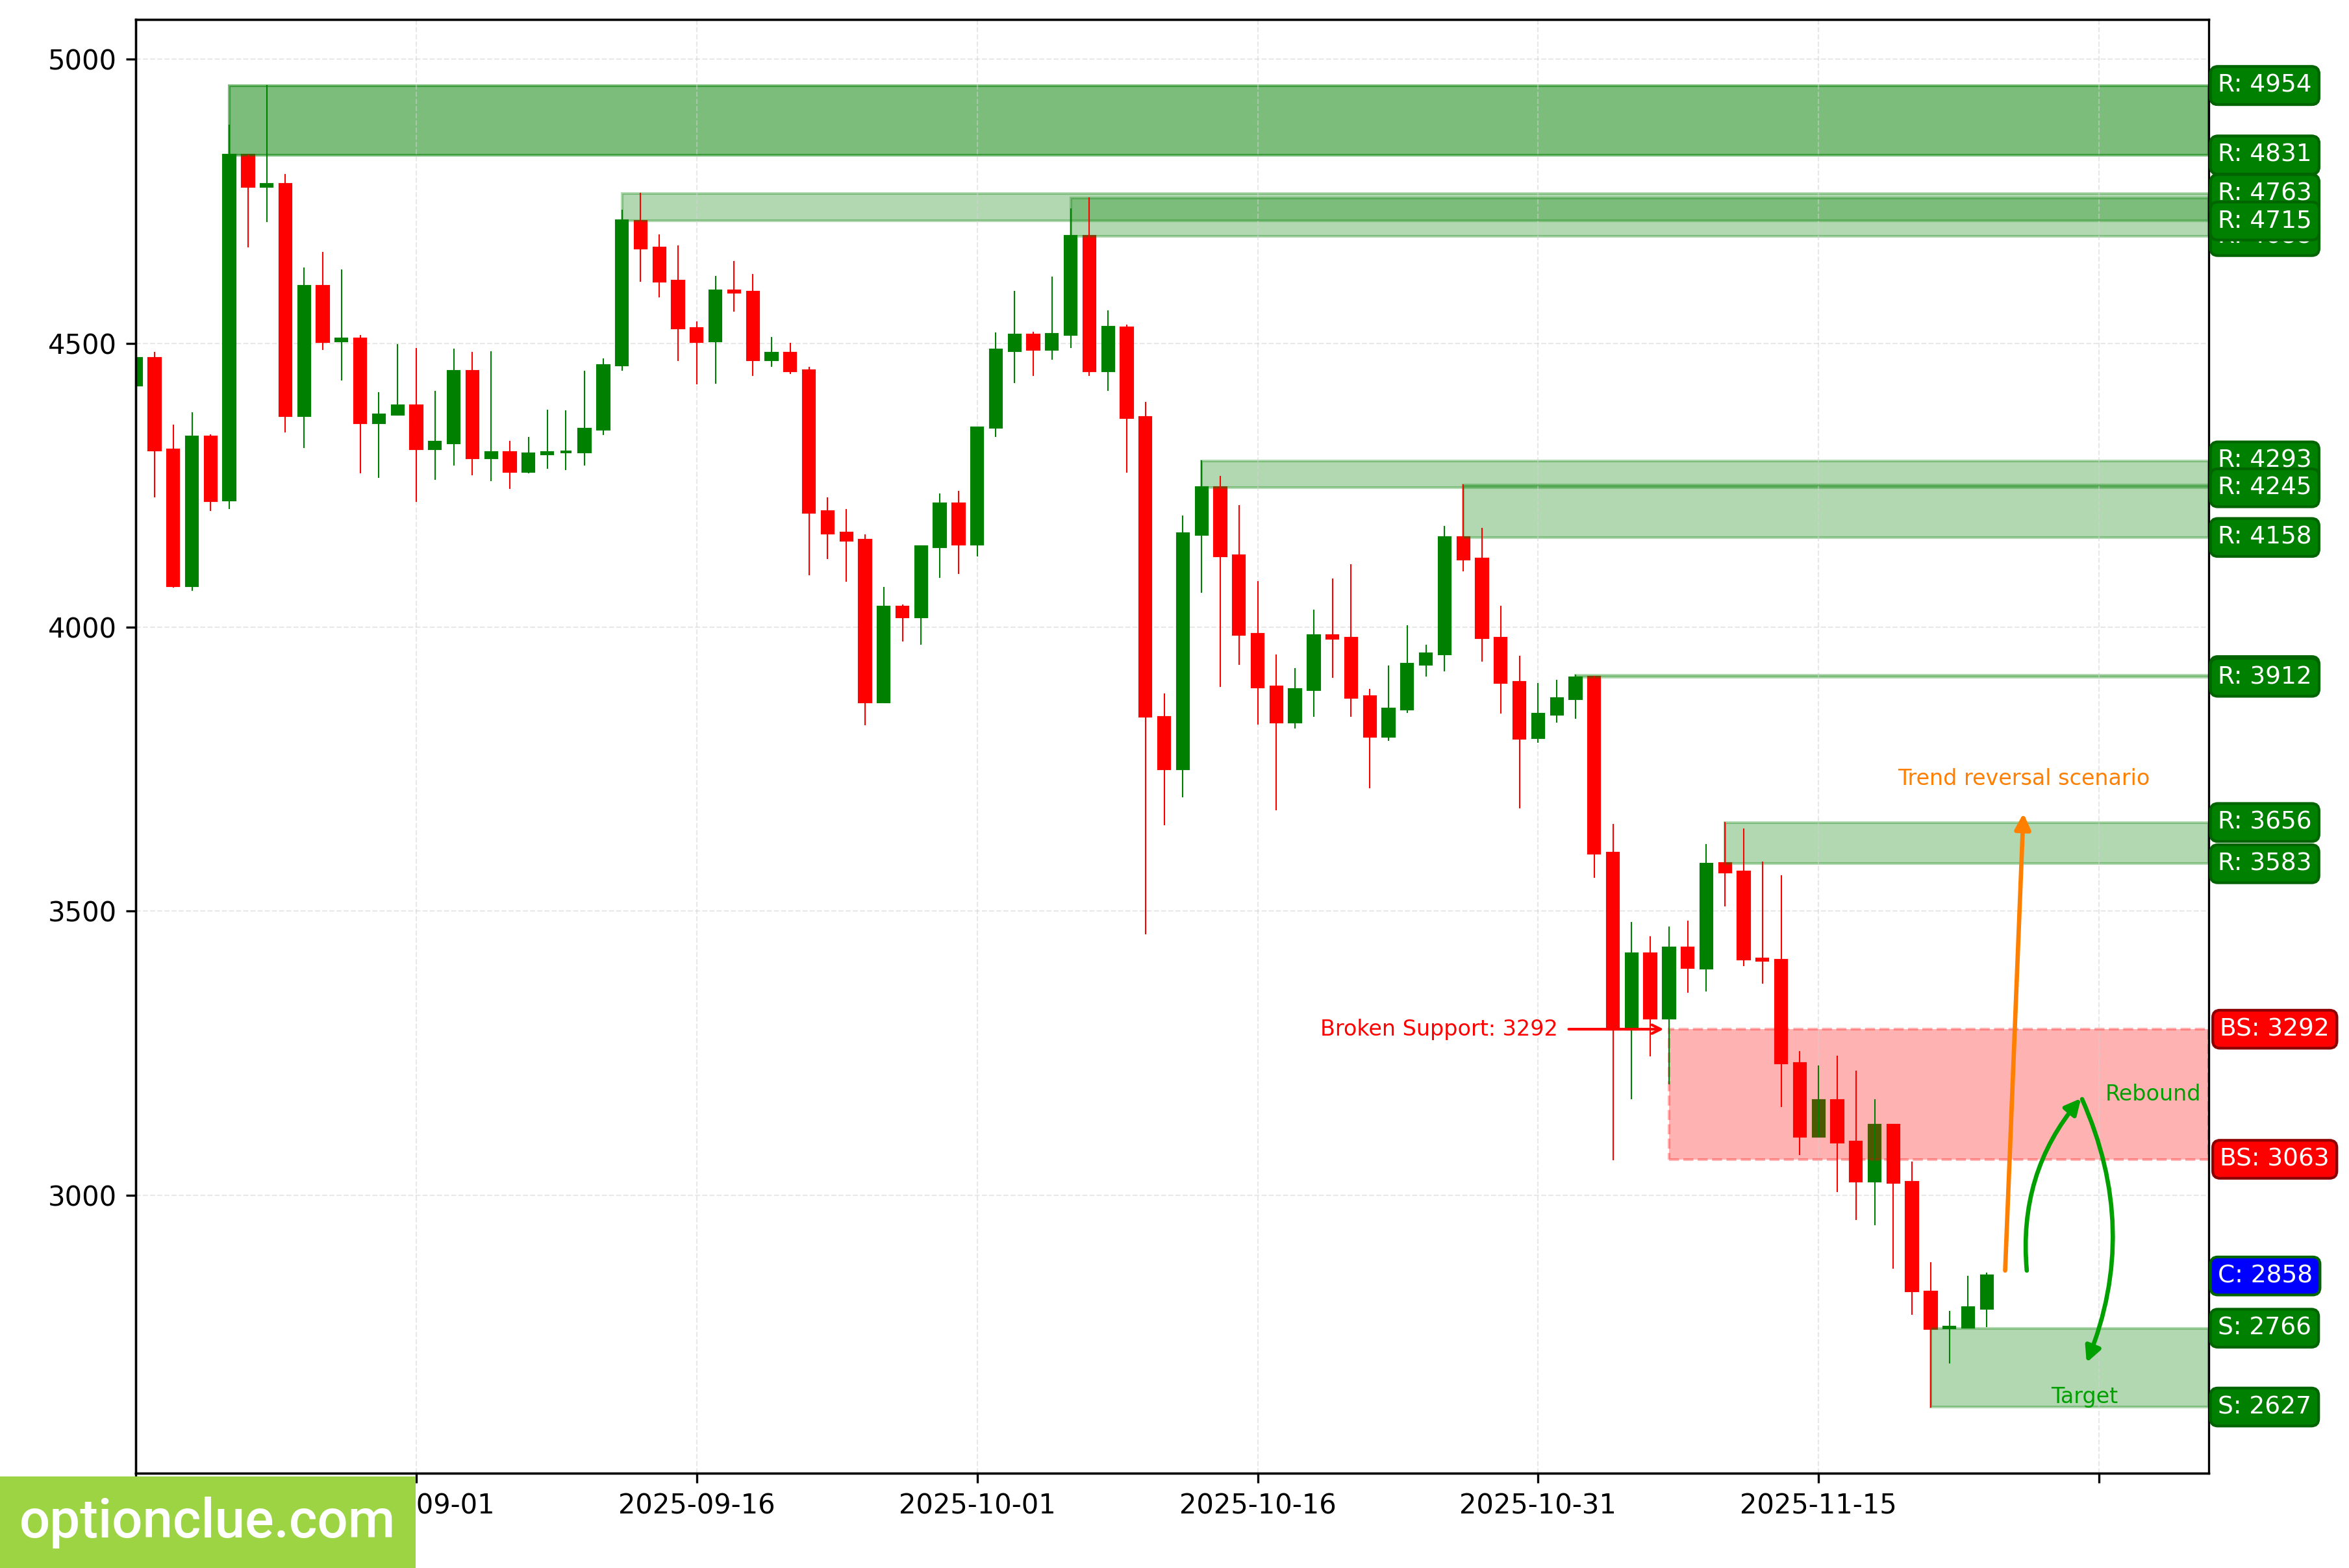
The bearish trend continues; a correction is developing.
The intermediate target for the downward movement is the support level with boundaries 2476 — 2508. If the trend successfully develops, a more distant target will be at the support level with boundaries 2378 — 2406.
The potential reward/risk ratio from current prices, when setting targets and managing risks based on the daily timeframe levels, could be slightly greater than 1:1. With a more distant target, it’s around 2:1.
Short positions will remain relevant as long as the market stays below the nearest resistance level with boundaries 3583 — 3656. If the market successfully establishes itself above this nearest resistance, the trend will reverse to bullish.
ETH. Technical analysis. D1.
Apple Inc (AAPL)
The trend has changed to bearish; the support level (266.77 — 268.47) was broken 2 candlesticks ago. A corrective wave is currently developing. A sell entry point on a rebound may form after the current correction completes.
The intermediate target for the downward movement is the support level with boundaries 265.32 — 265.53. If the trend successfully develops, a more distant target will be at the support level with boundaries 258.01 — 259.58.
Sell entry points may appear after the correction is complete. In the case of a deeper correction to the resistance level (275.25 — 276.70), the potential reward/risk ratio could improve.
Short positions will remain relevant as long as the market stays below the nearest resistance level with boundaries 275.25 — 276.70. If the market successfully establishes itself above this nearest resistance, the trend will reverse to bullish.
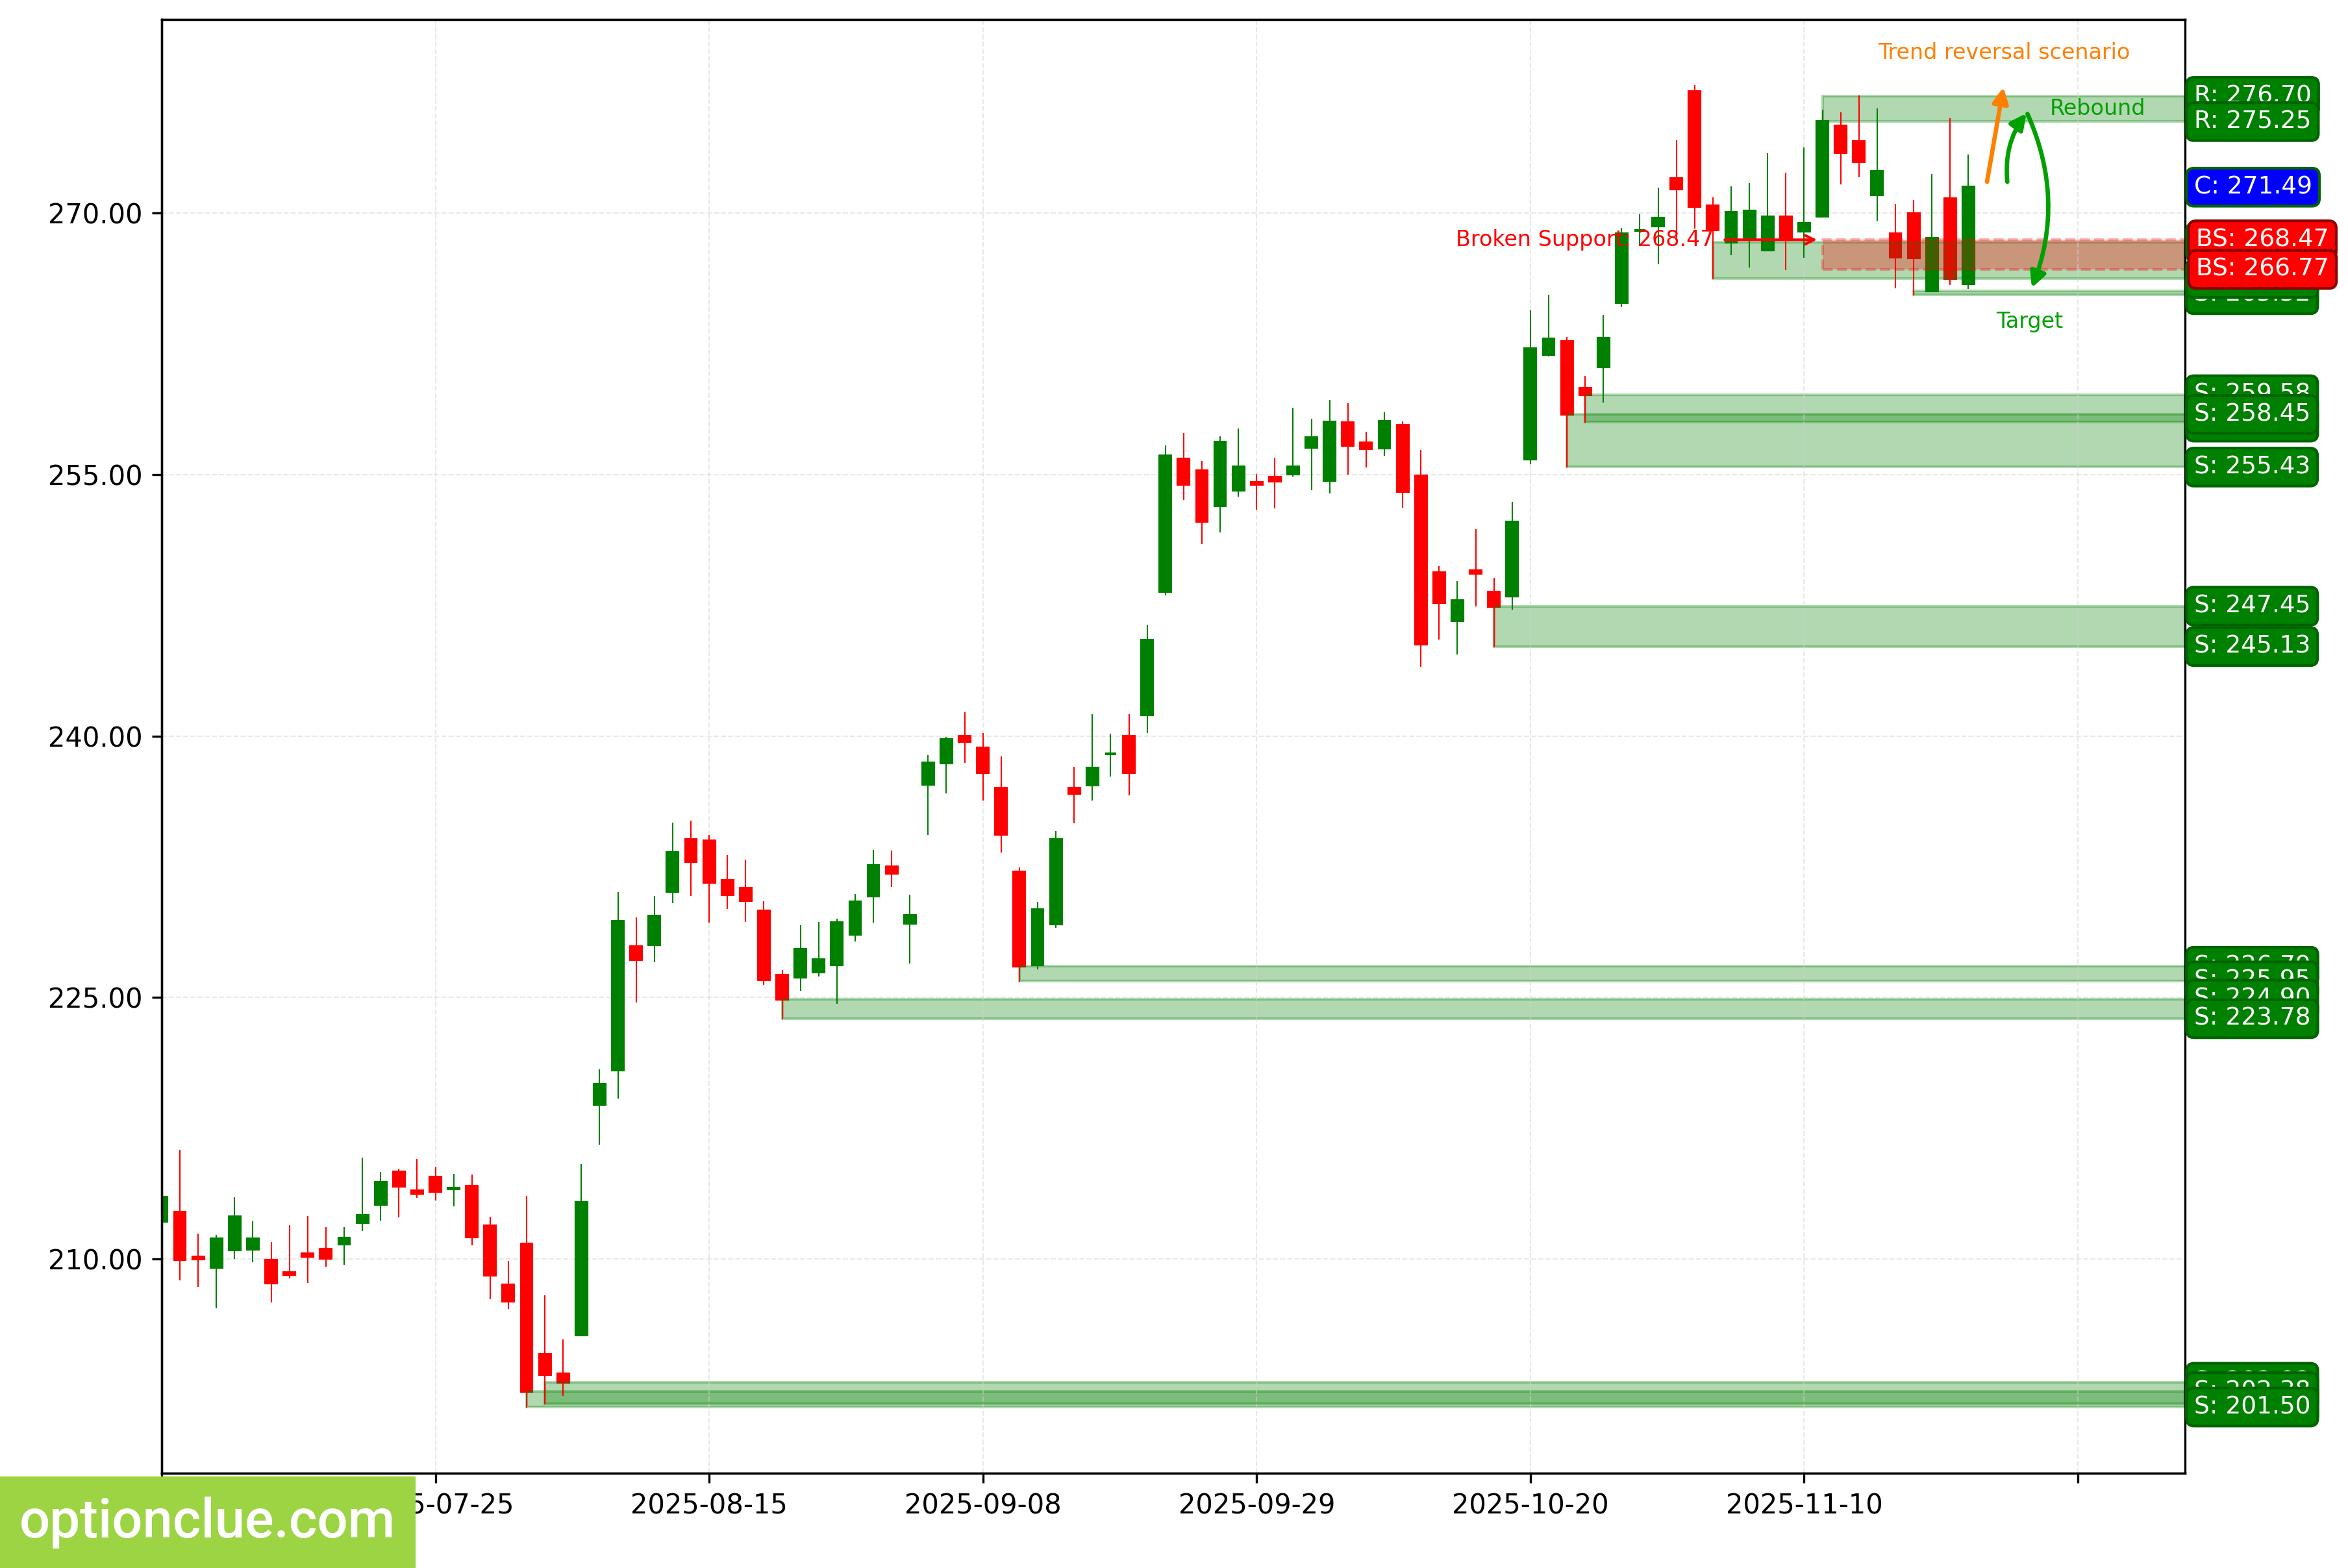
AAPL. Technical analysis. D1.
NVIDIA Corp (NVDA)
The trend changed to bearish when the support level (179.65 — 181.36) was broken on the last closed candlestick. An impulse wave is developing. A sell entry point on a rebound may appear after a correction forms.
The intermediate target for the downward movement is the support level with boundaries 173.13 — 174.48. If the trend successfully develops, a more distant target will be at the support level with boundaries 168.41 — 170.29.
If the correction ends near the last broken level (179.65 — 181.36), the potential reward/risk ratio may be small (0.2:1). If a correction occurs to the resistance level (199.05 — 199.94), the potential reward/risk ratio could be approximately 2:1.
Short positions will remain relevant as long as the market stays below the nearest resistance level with boundaries 199.05 — 199.94. If the market successfully establishes itself above this nearest resistance, the trend will reverse to bullish.
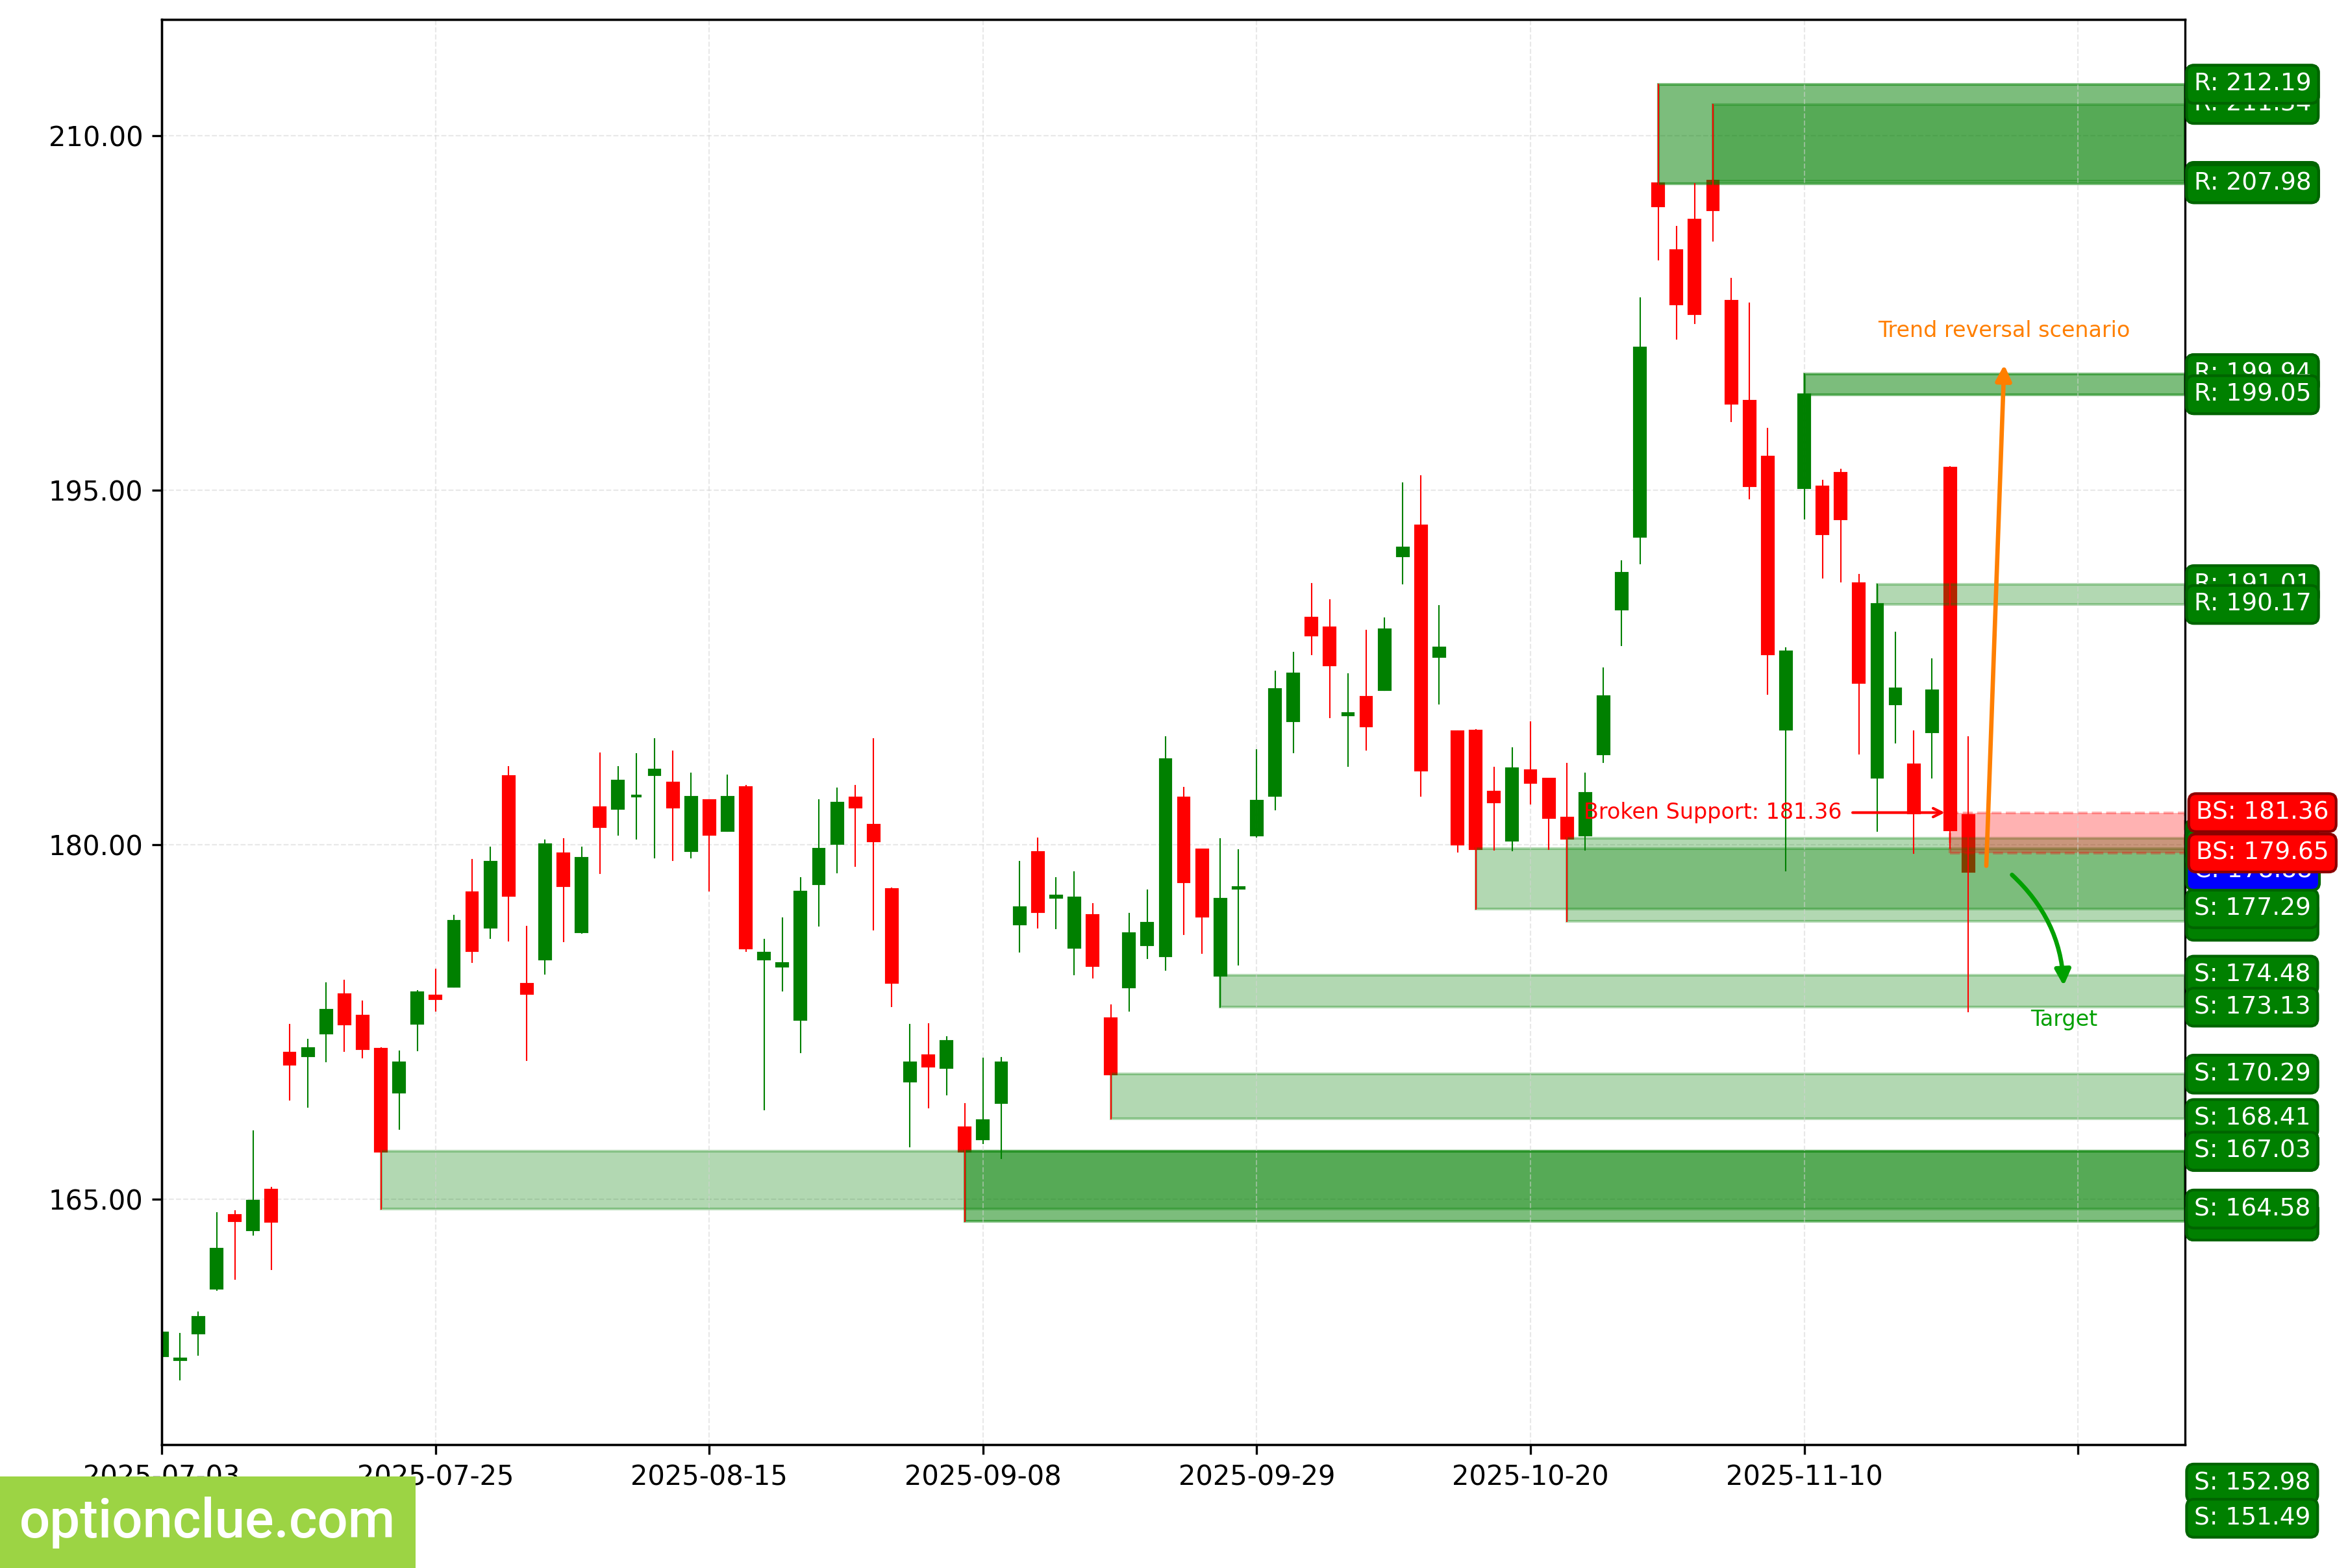
NVDA. Technical analysis. D1.
Tesla Inc (TSLA)
The bearish trend continues; an impulse wave is developing. The last broken level is support (439.61 — 440.10). New sell entry points on a rebound may appear after a correction forms.
The intermediate target for the downward movement is the support level with boundaries 382.78 — 386.30. If the trend successfully develops, a more distant target will be at the support level with boundaries 370.24 — 370.94.
The potential reward/risk ratio from current prices may not be the most favorable, as the impulse movement is already developing. More attractive entry points may appear after a correction forms.
Short positions will remain relevant as long as the market stays below the nearest resistance level with boundaries 408.92 — 423.96. If the market successfully establishes itself above this nearest resistance, the trend will reverse to bullish.
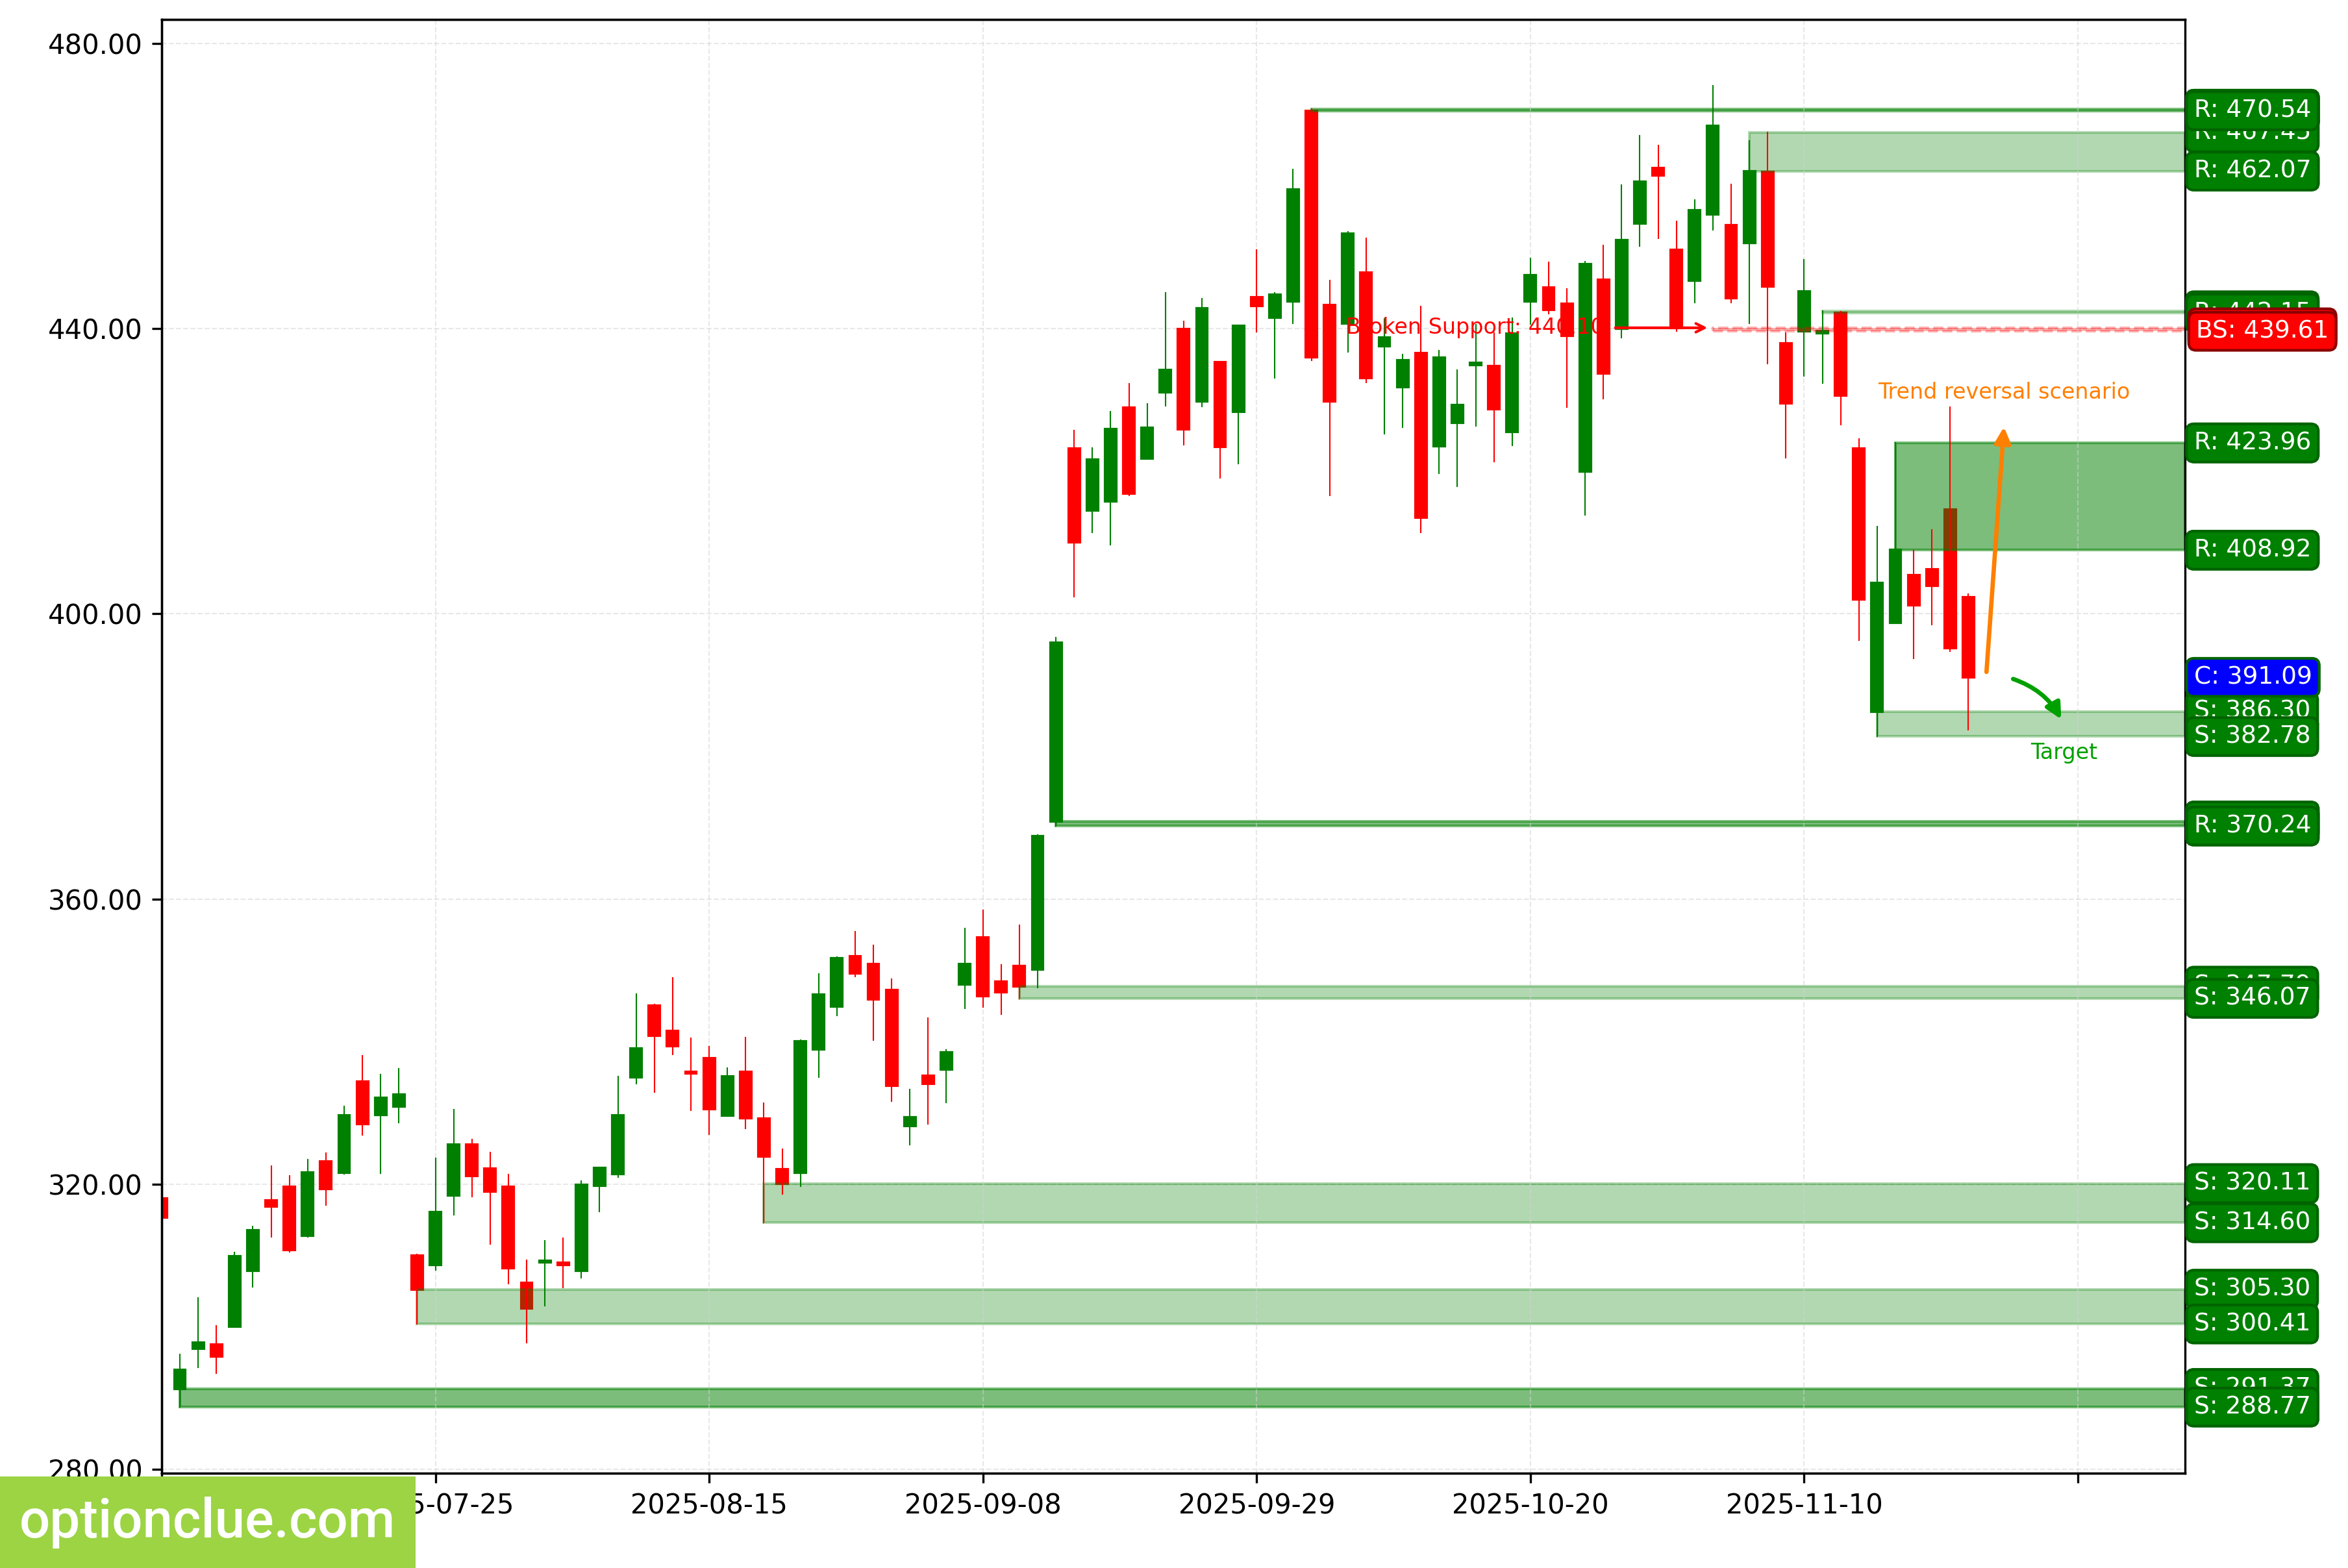
TSLA. Technical analysis. D1.
Summary
In the medium term, GBPUSD, USDJPY, USDCAD, AUDUSD stand out with corrections nearing completion on the daily timeframe.
The other assets may be worthy of attention, depending on the depth of the market correction.