
Considering the most important levels for key financial instruments and probable scenarios of developments.
Key Topics
- Euro (EURUSD)
- British Pound (GBPUSD)
- Swiss Franc (USDCHF)
- Japanese Yen (USDJPY)
- Canadian Dollar (USDCAD)
- Australian Dollar (AUDUSD)
- Bitcoin (BTC)
- Ether (ETH)
- Apple Inc (AAPL)
- NVIDIA Corp (NVDA)
- Tesla Inc (TSLA)
- Summary
Euro (EURUSD)
The trend has changed to bullish, when the resistance level (1.1539 — 1.1555) was broken. The breakout occurred on the last closed candlestick, an impulse wave is developing.
Intermediate target for the upside move is the resistance level with boundaries 1.1611 — 1.1667. In case of successful trend development, a further target will be at the resistance level with boundaries 1.1895 — 1.1929.
If the new correction completes around the support level (1.1385 — 1.1457), the potential profit/risk ratio may be around 1.3:1. When using a further target — around 3:1. If the next correction completes around the last broken level (1.1539 — 1.1555), the potential profit/risk ratio may be small (around 0.2:1). When selecting a further target — around 1.3:1.
Long positions will remain relevant as long as the market is above the nearest support level with boundaries 1.1385 — 1.1457. If the market successfully settles below this support, the trend will change to the opposite (bearish).
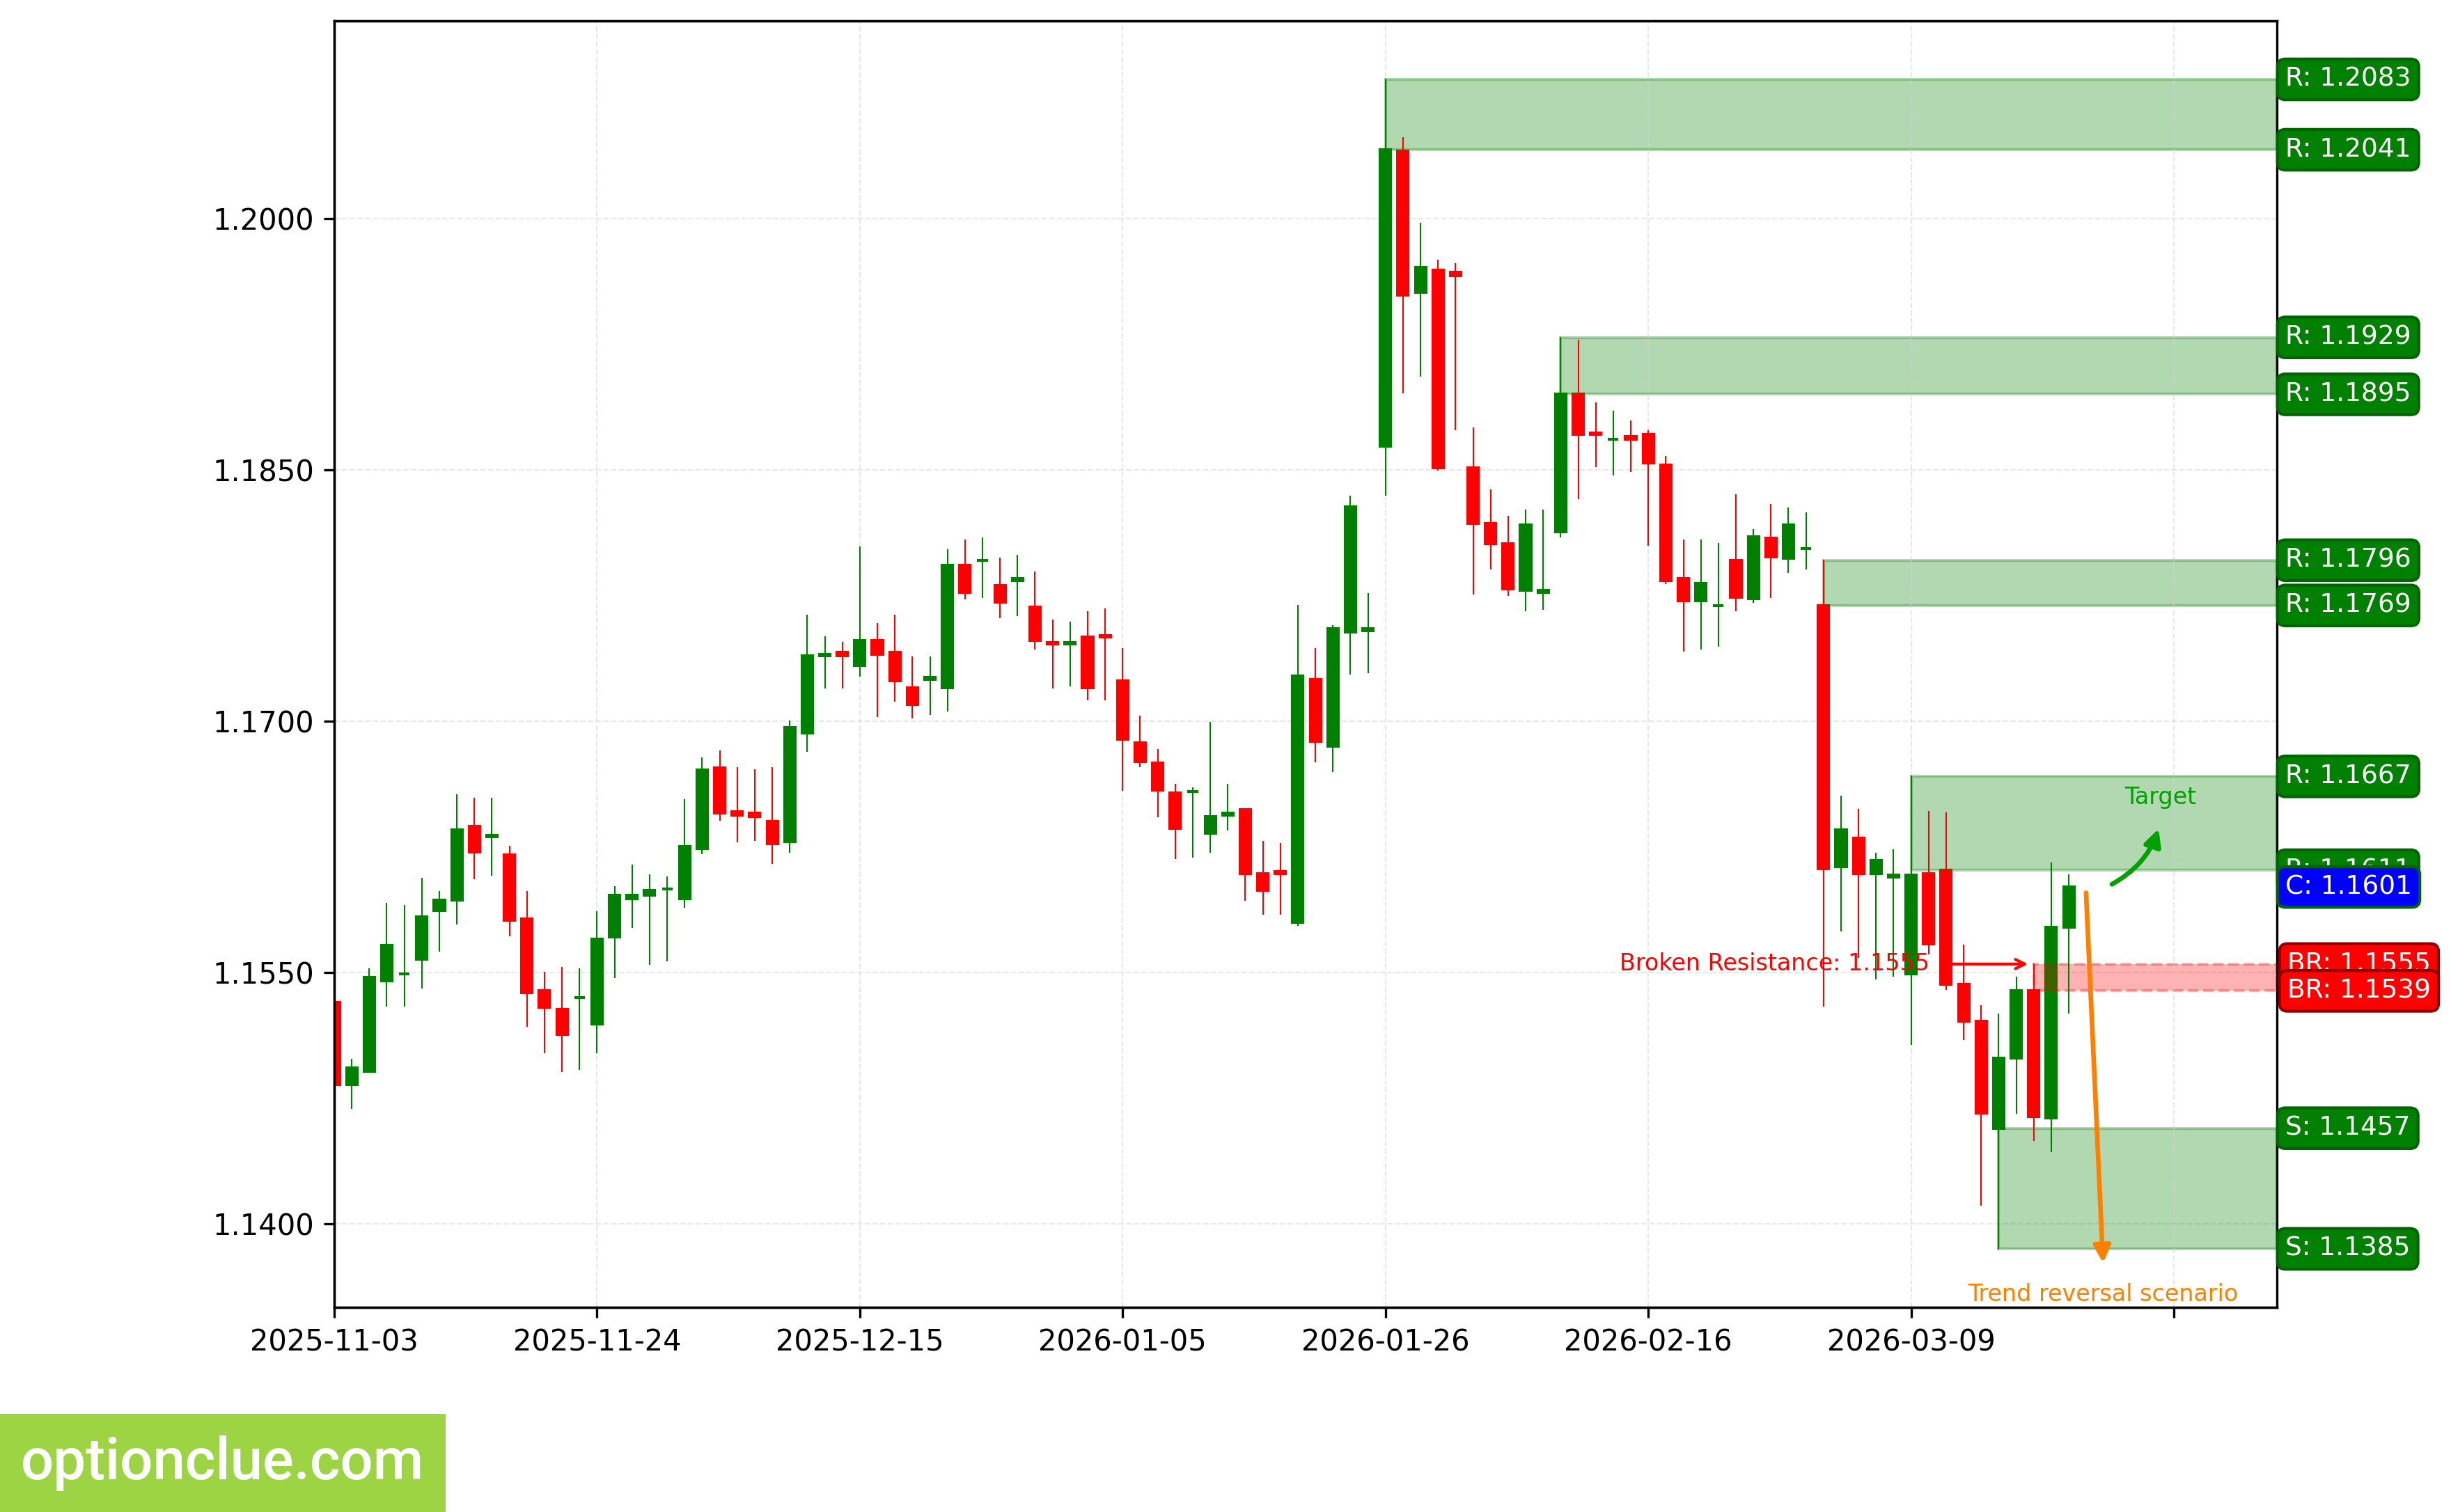
EURUSD. Technical analysis. D1.
British Pound (GBPUSD)
The bearish trend continues, a corrective wave is developing. The last broken level is support (1.3253 — 1.3352). The breakout occurred 6 candlesticks ago, and the price has returned to this last broken level.
Intermediate target for the downside move is the support level with boundaries 1.3191 — 1.3218. In case of successful trend development, a further target will be at the support level with boundaries 1.3010 — 1.3021.
If the new correction completes around the resistance level (1.3424 — 1.3483), the potential profit/risk ratio may be around 1.4:1. When using a further target — around 2.6:1.
Short positions will remain relevant as long as the market remains below the nearest resistance level with boundaries 1.3424 — 1.3483. If the market successfully settles above this nearest resistance, the trend will change to the opposite (bullish).
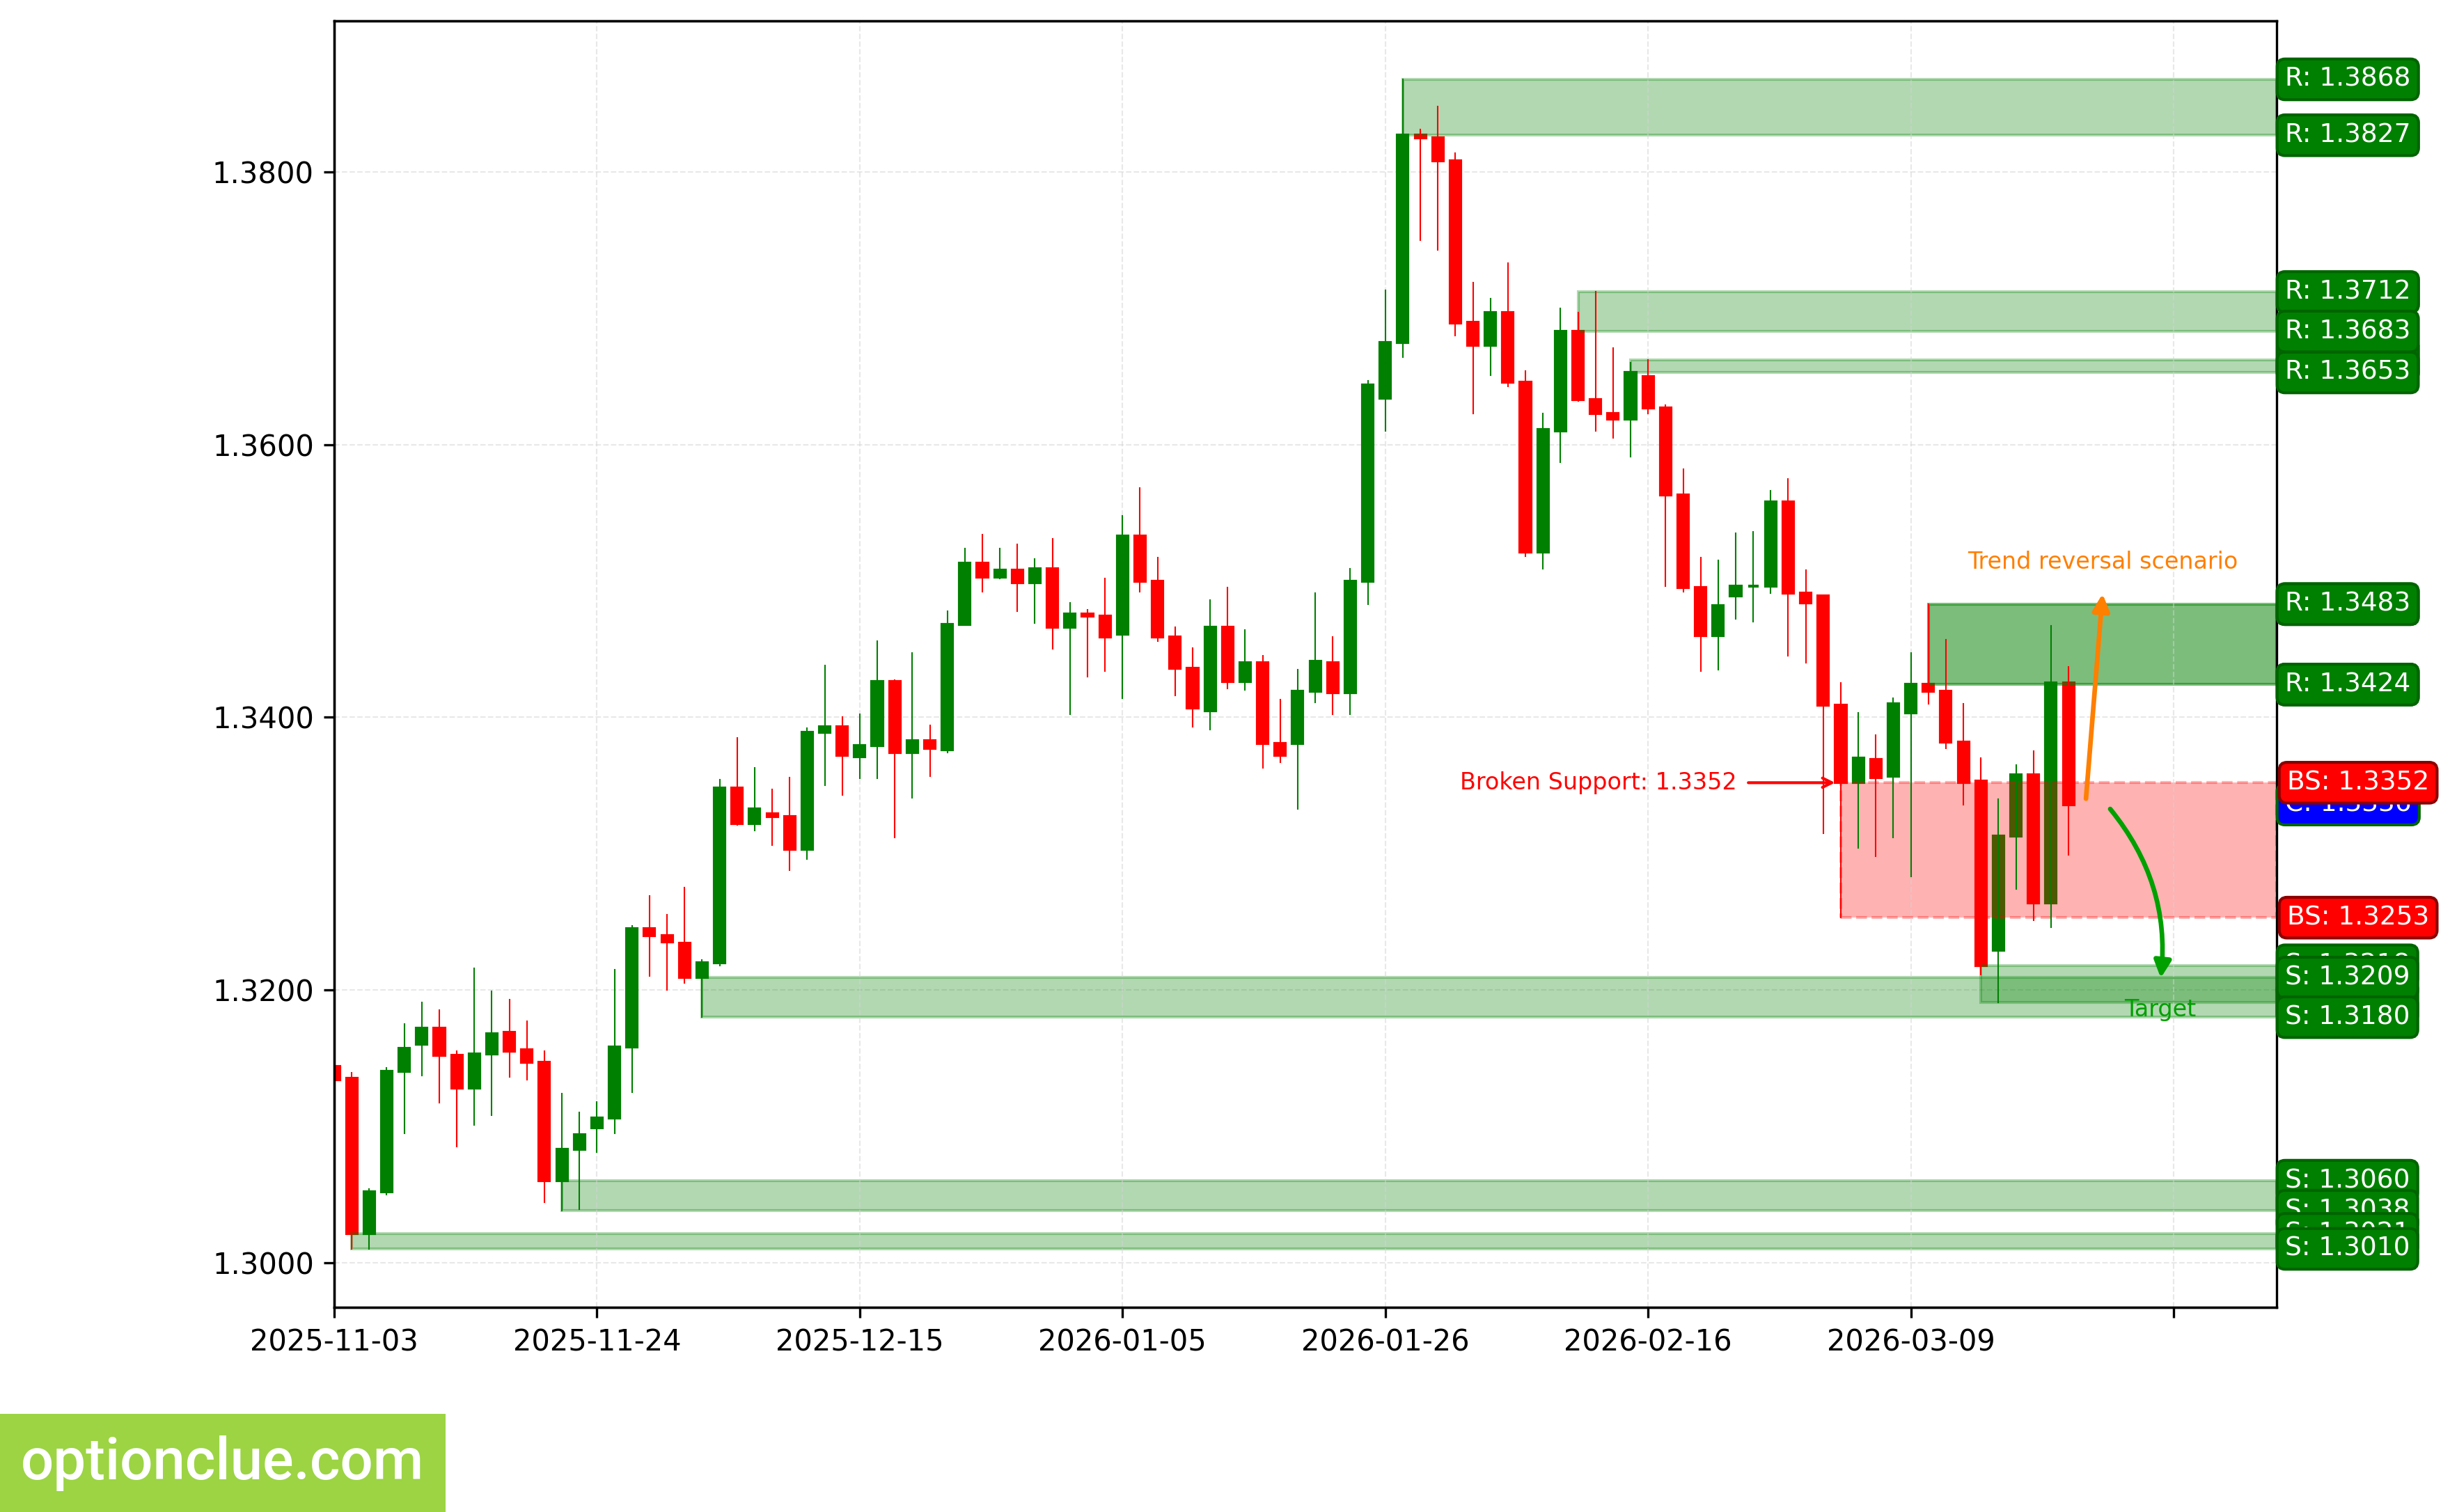
GBPUSD. Technical analysis. D1.
Swiss Franc (USDCHF)
The bullish trend continues, a corrective wave is developing. An entry point for buying on rebound may form after the current correction completes. The last broken level is resistance (0.7914 — 0.7922). The breakout occurred 3 candlesticks ago.
Intermediate target for the upside move is the resistance level with boundaries 0.7933 — 0.7957. In case of successful trend development, a further target will be at the resistance level with boundaries 0.8068 — 0.8085.
The potential profit/risk ratio from current prices when setting targets and fixing risks based on daily timeframe levels may be small (approximately 0.5:1). When using a further target — approximately 1.7:1. If the correction completes around the support level (0.7842 — 0.7848), the potential profit/risk ratio may be around 1.1:1. When selecting a further target — around 2.9:1.
Long positions will remain relevant as long as the market is above the nearest support level with boundaries 0.7842 — 0.7848. If the market successfully settles below this support, the trend will change to the opposite (bearish).
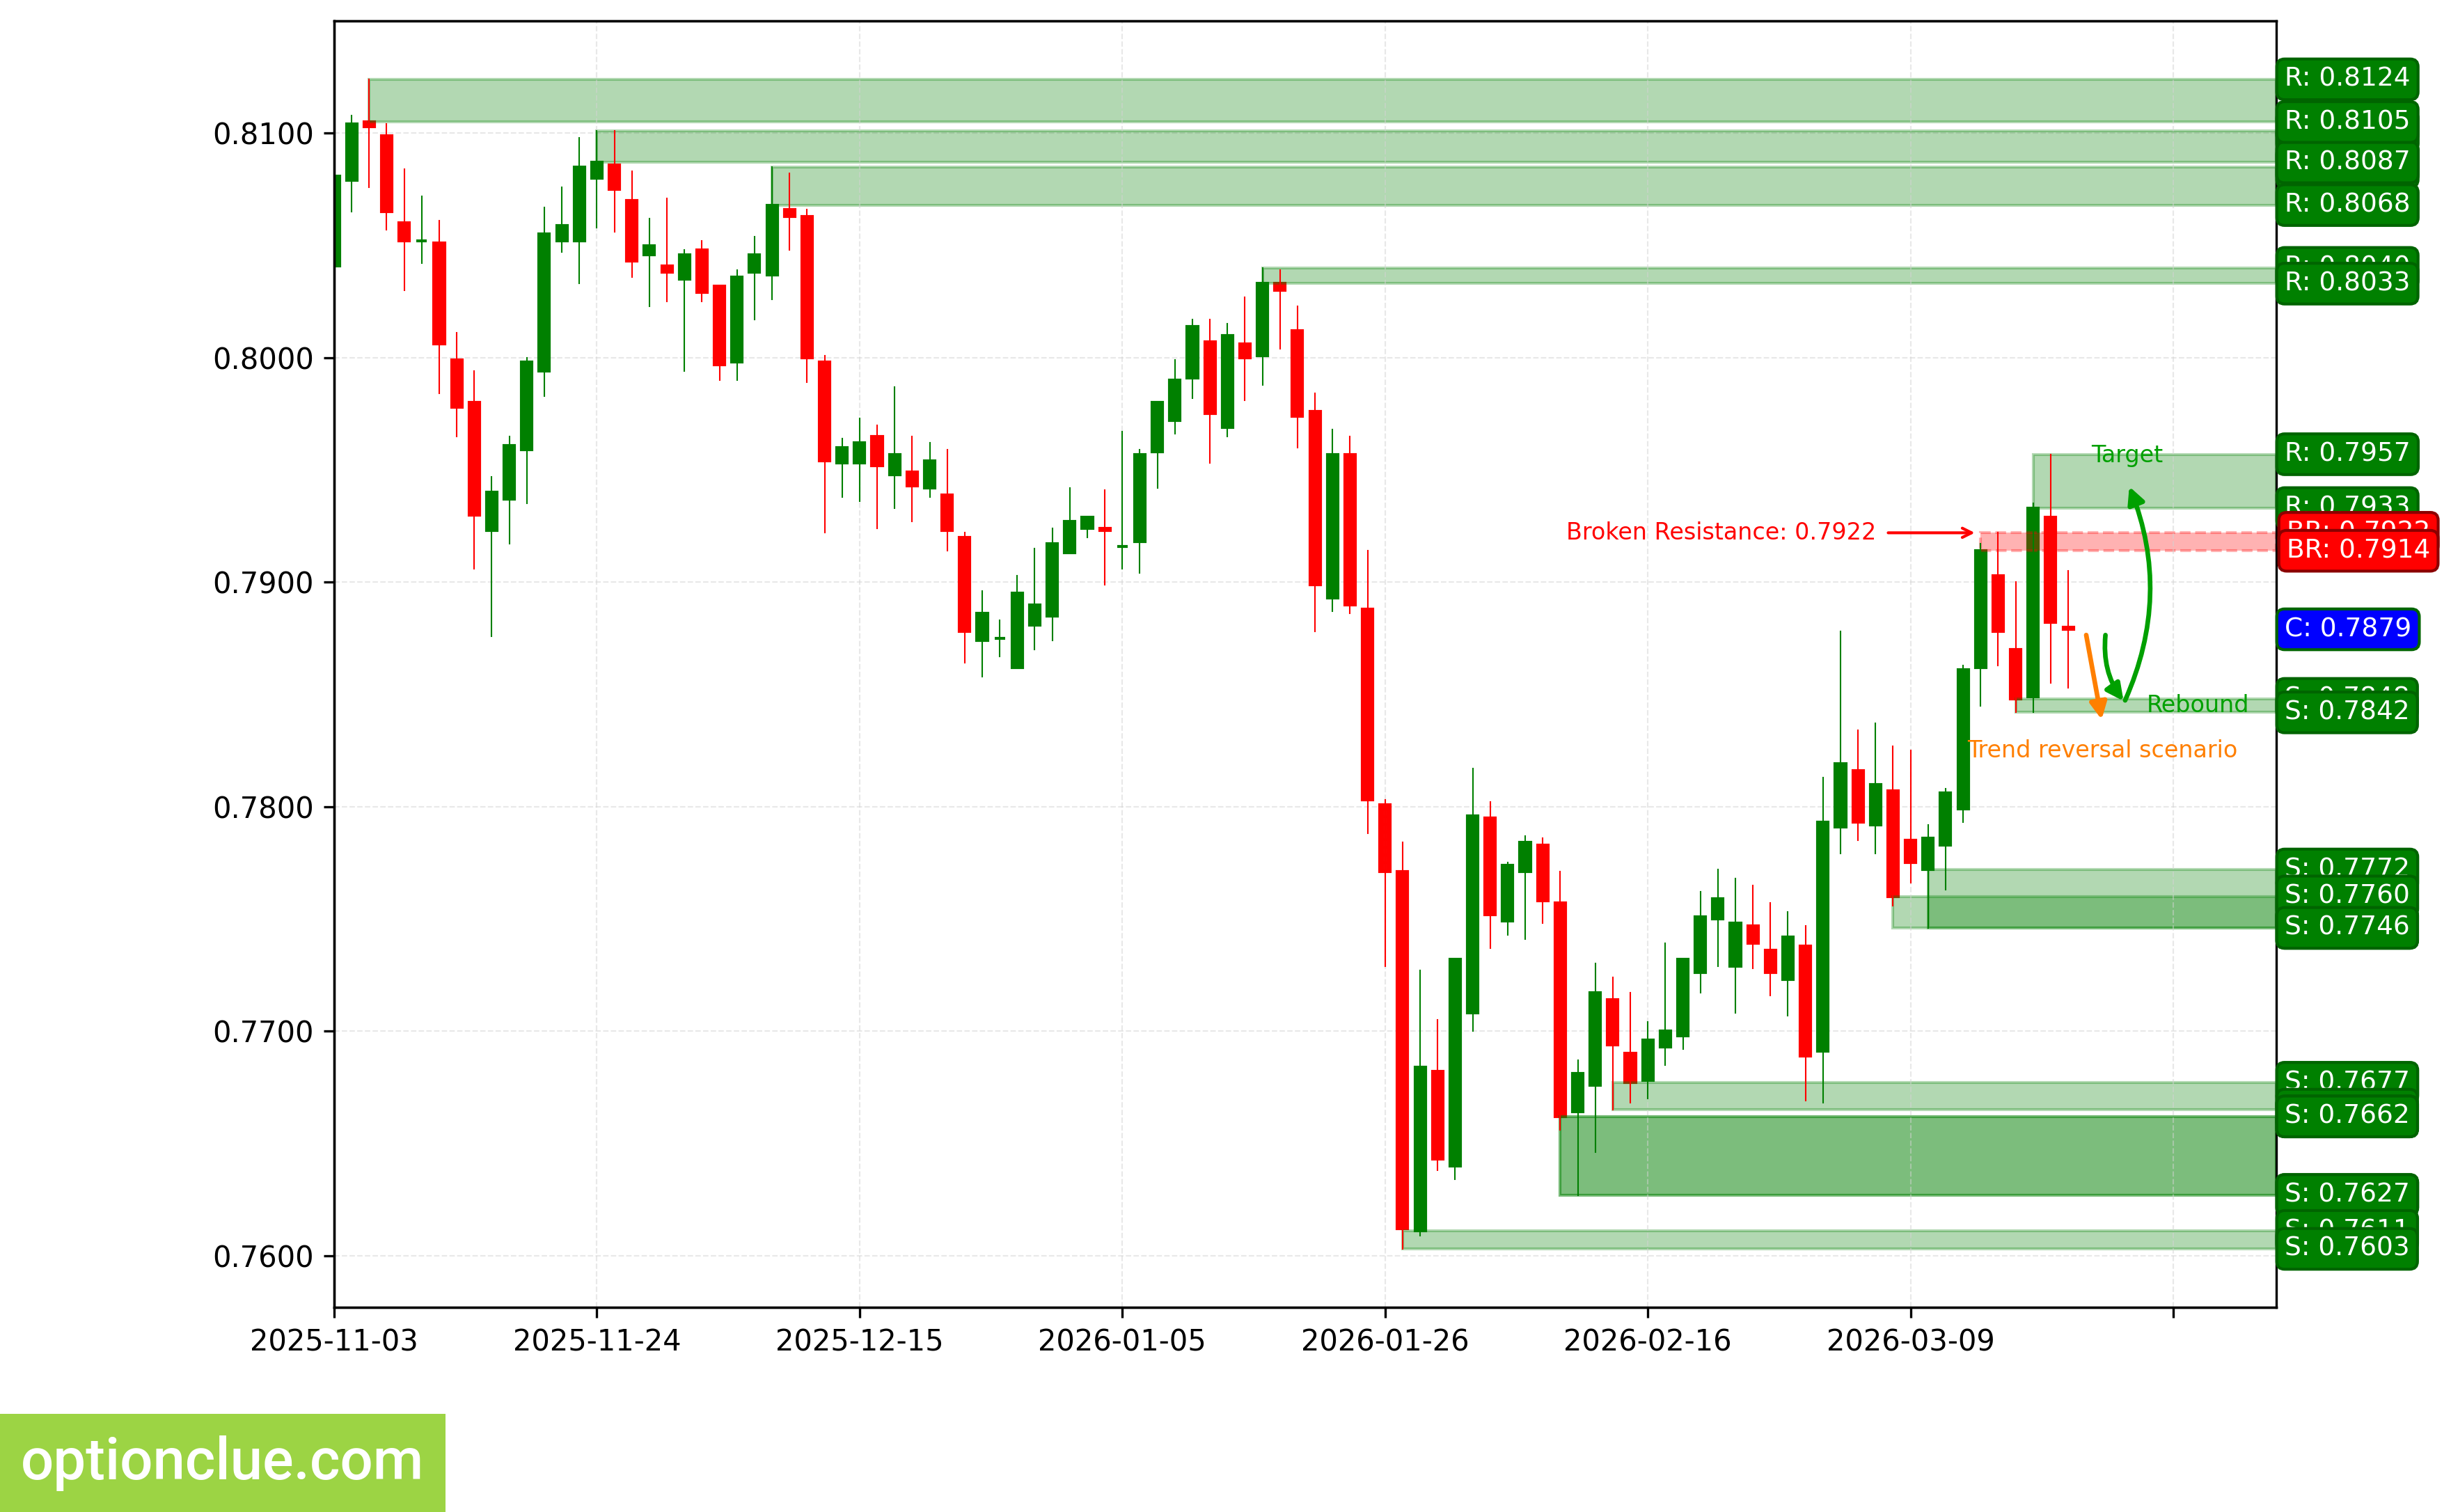
USDCHF. Technical analysis. D1.
Japanese Yen (USDJPY)
The bullish trend continues, 12 candlesticks ago the correction completed and an entry point for buying on rebound formed, an impulse wave is developing. The last broken level is resistance (156.19 — 156.82). The breakout occurred 15 candlesticks ago.
Intermediate target for the upside move is the resistance level with boundaries 159.74 — 159.89.
The potential profit/risk ratio from current prices when setting targets and fixing risks based on daily timeframe levels may be small (approximately 0.2:1).
Long positions will remain relevant as long as the market remains above the nearest support level with boundaries 156.47 — 156.98. If the market successfully settles below this support, the trend will change to the opposite (bearish).
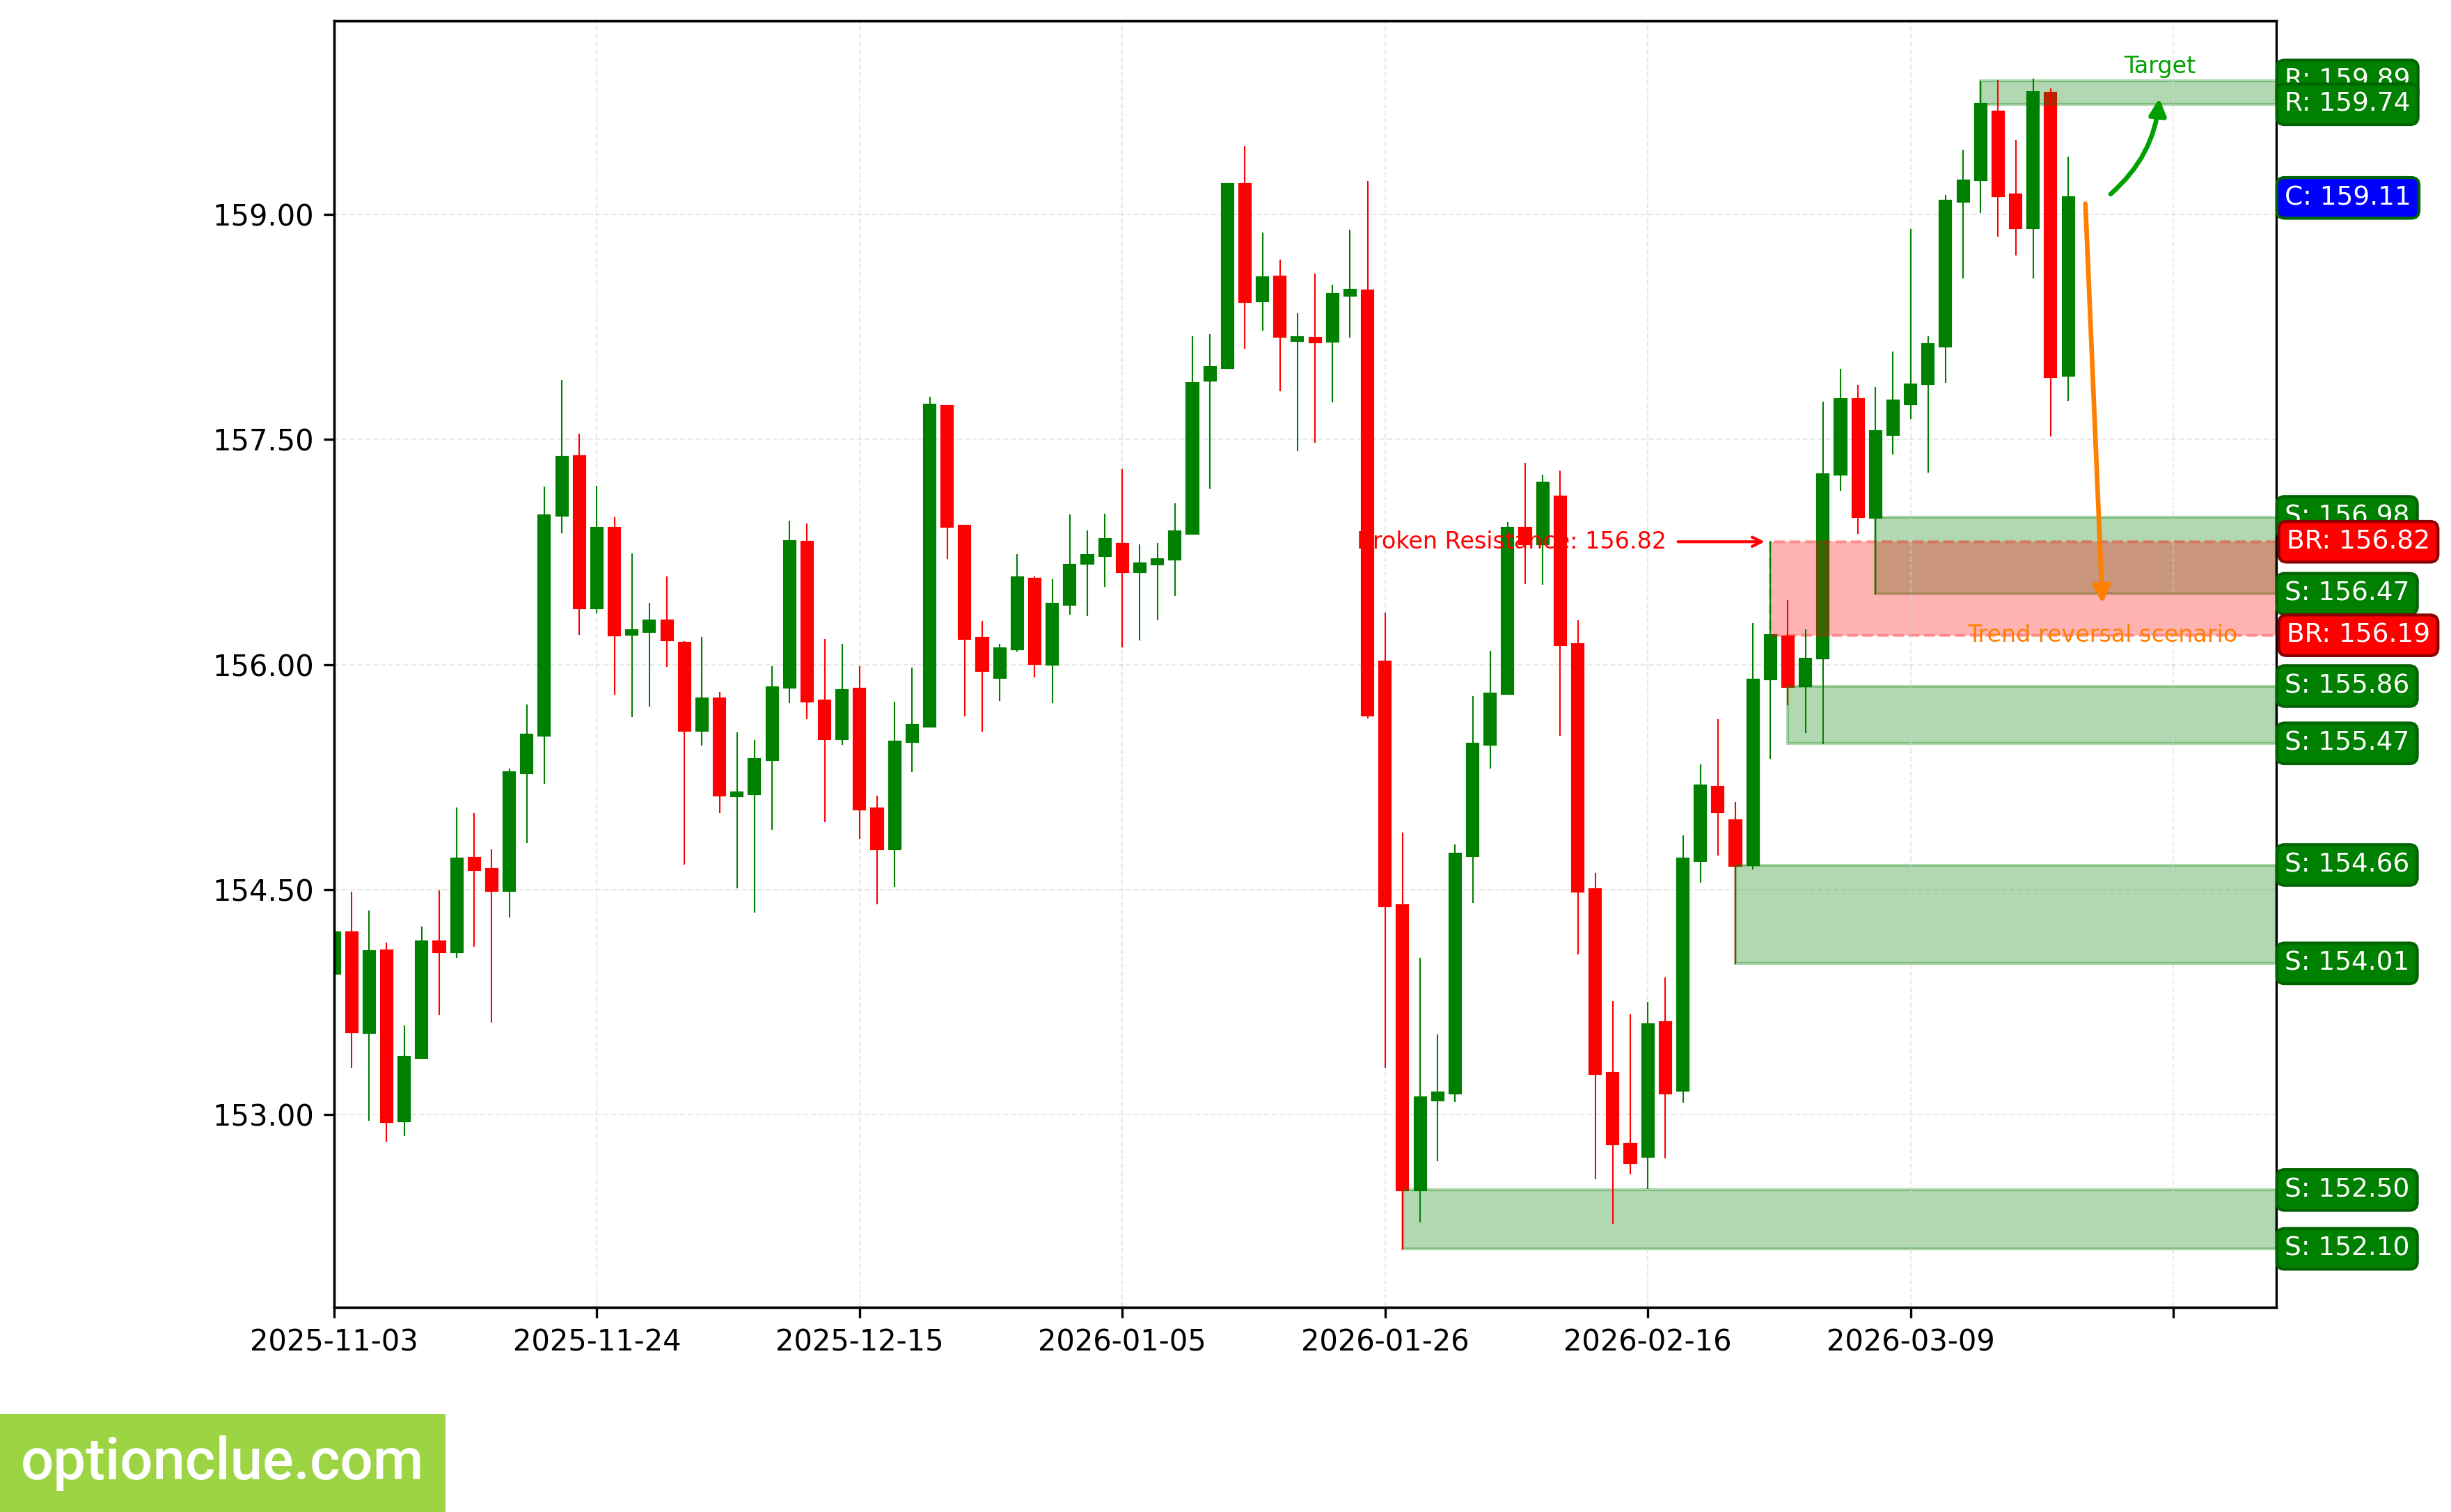
USDJPY. Technical analysis. D1.
Canadian Dollar (USDCAD)
The trend has changed to bullish 3 candlesticks ago, when the resistance level (1.3712 — 1.3724) was broken, and the price has returned to this last broken level. A corrective wave is developing. An entry point for buying may form after the current correction completes.
Intermediate target for the upside move is the resistance level with boundaries 1.3916 — 1.3928. In case of successful trend development, a further target will be at the resistance level with boundaries 1.4108 — 1.4124.
The potential profit/risk ratio from current prices when setting targets and fixing risks based on daily timeframe levels may be approximately 1.2:1. When using a further target — approximately 2.4:1. If the correction completes around the support level (1.3650 — 1.3685), the potential profit/risk ratio may be around 2.3:1. When selecting a further target — around 4.1:1.
Long positions will remain relevant as long as the market is above the nearest support level with boundaries 1.3650 — 1.3685. If the market successfully settles below this support, the trend will change to the opposite (bearish).
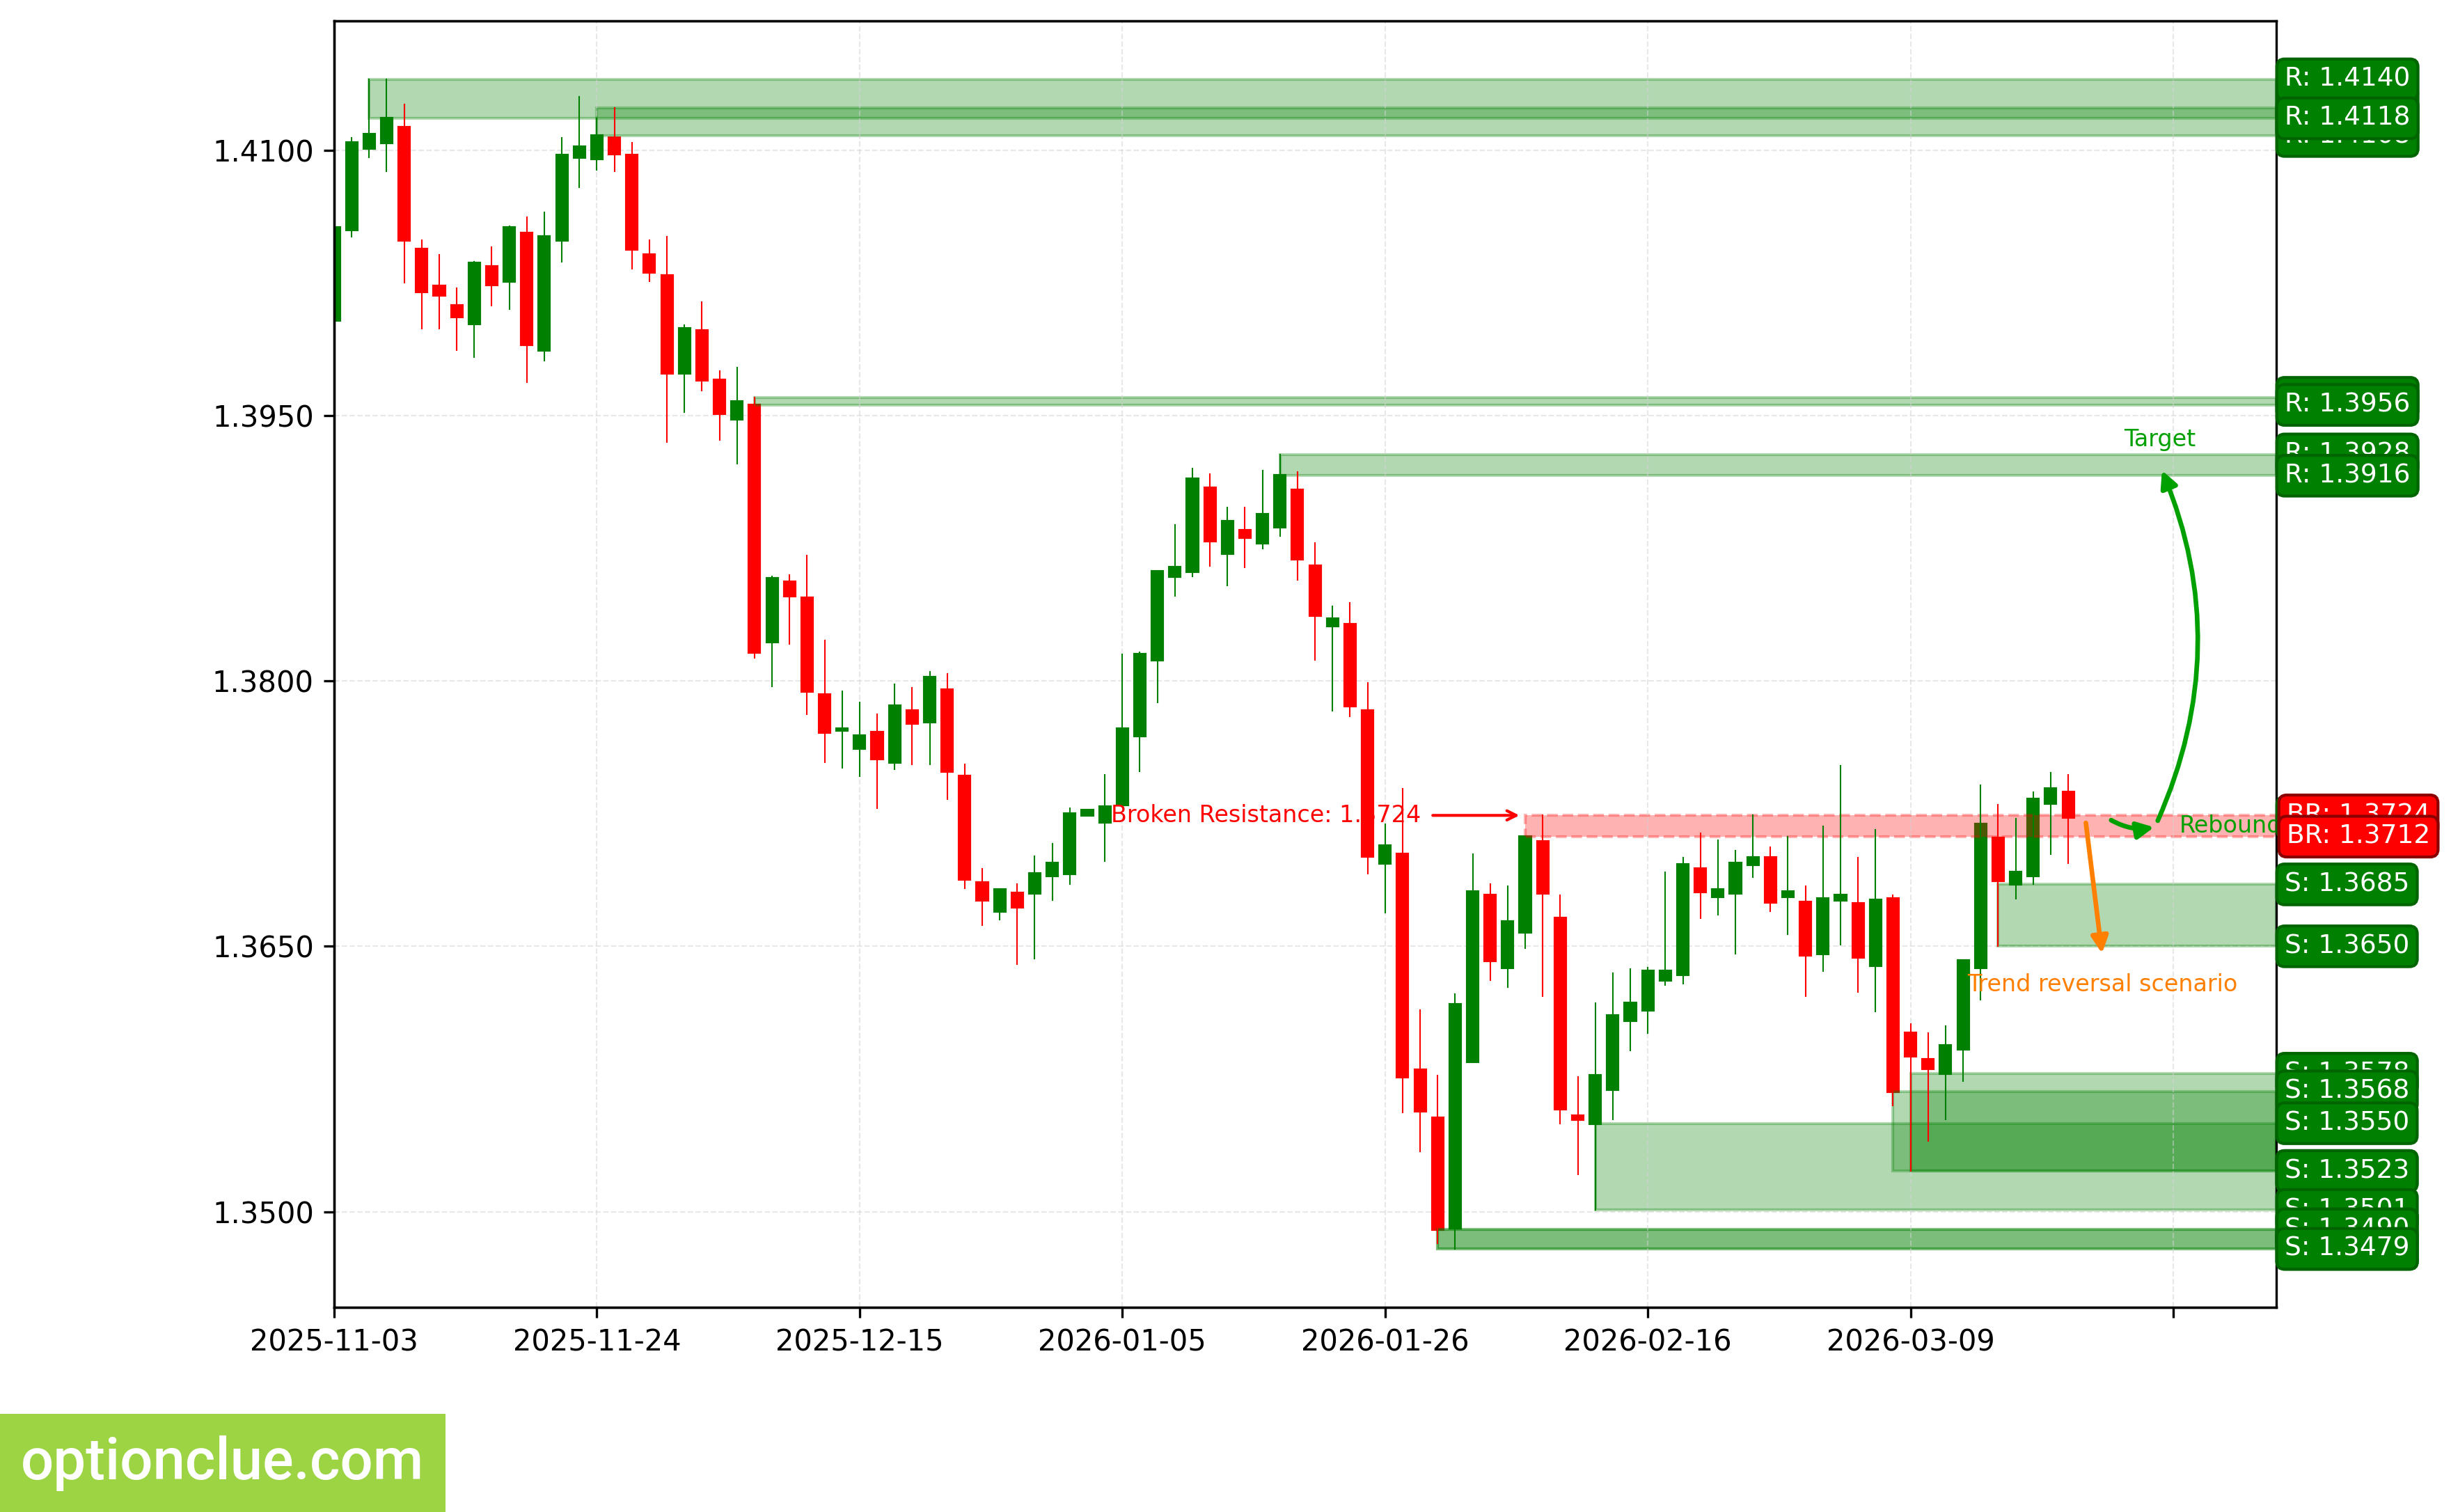
USDCAD. Technical analysis. D1.
Australian Dollar (AUDUSD)
The bullish trend continues, a corrective wave is developing. An entry point for buying on rebound may form after the current correction completes. The last broken level is resistance (0.7124 — 0.7138). The breakout occurred 8 candlesticks ago.
Intermediate target for the upside move is the resistance level with boundaries 0.7105 — 0.7123.
If the correction completes around the support level (0.6977 — 0.6981), the potential profit/risk ratio may be around 1.1:1.
Long positions will remain relevant as long as the market is above the nearest support level with boundaries 0.6977 — 0.6981. If the market successfully settles below this support, the trend will change to the opposite (bearish).
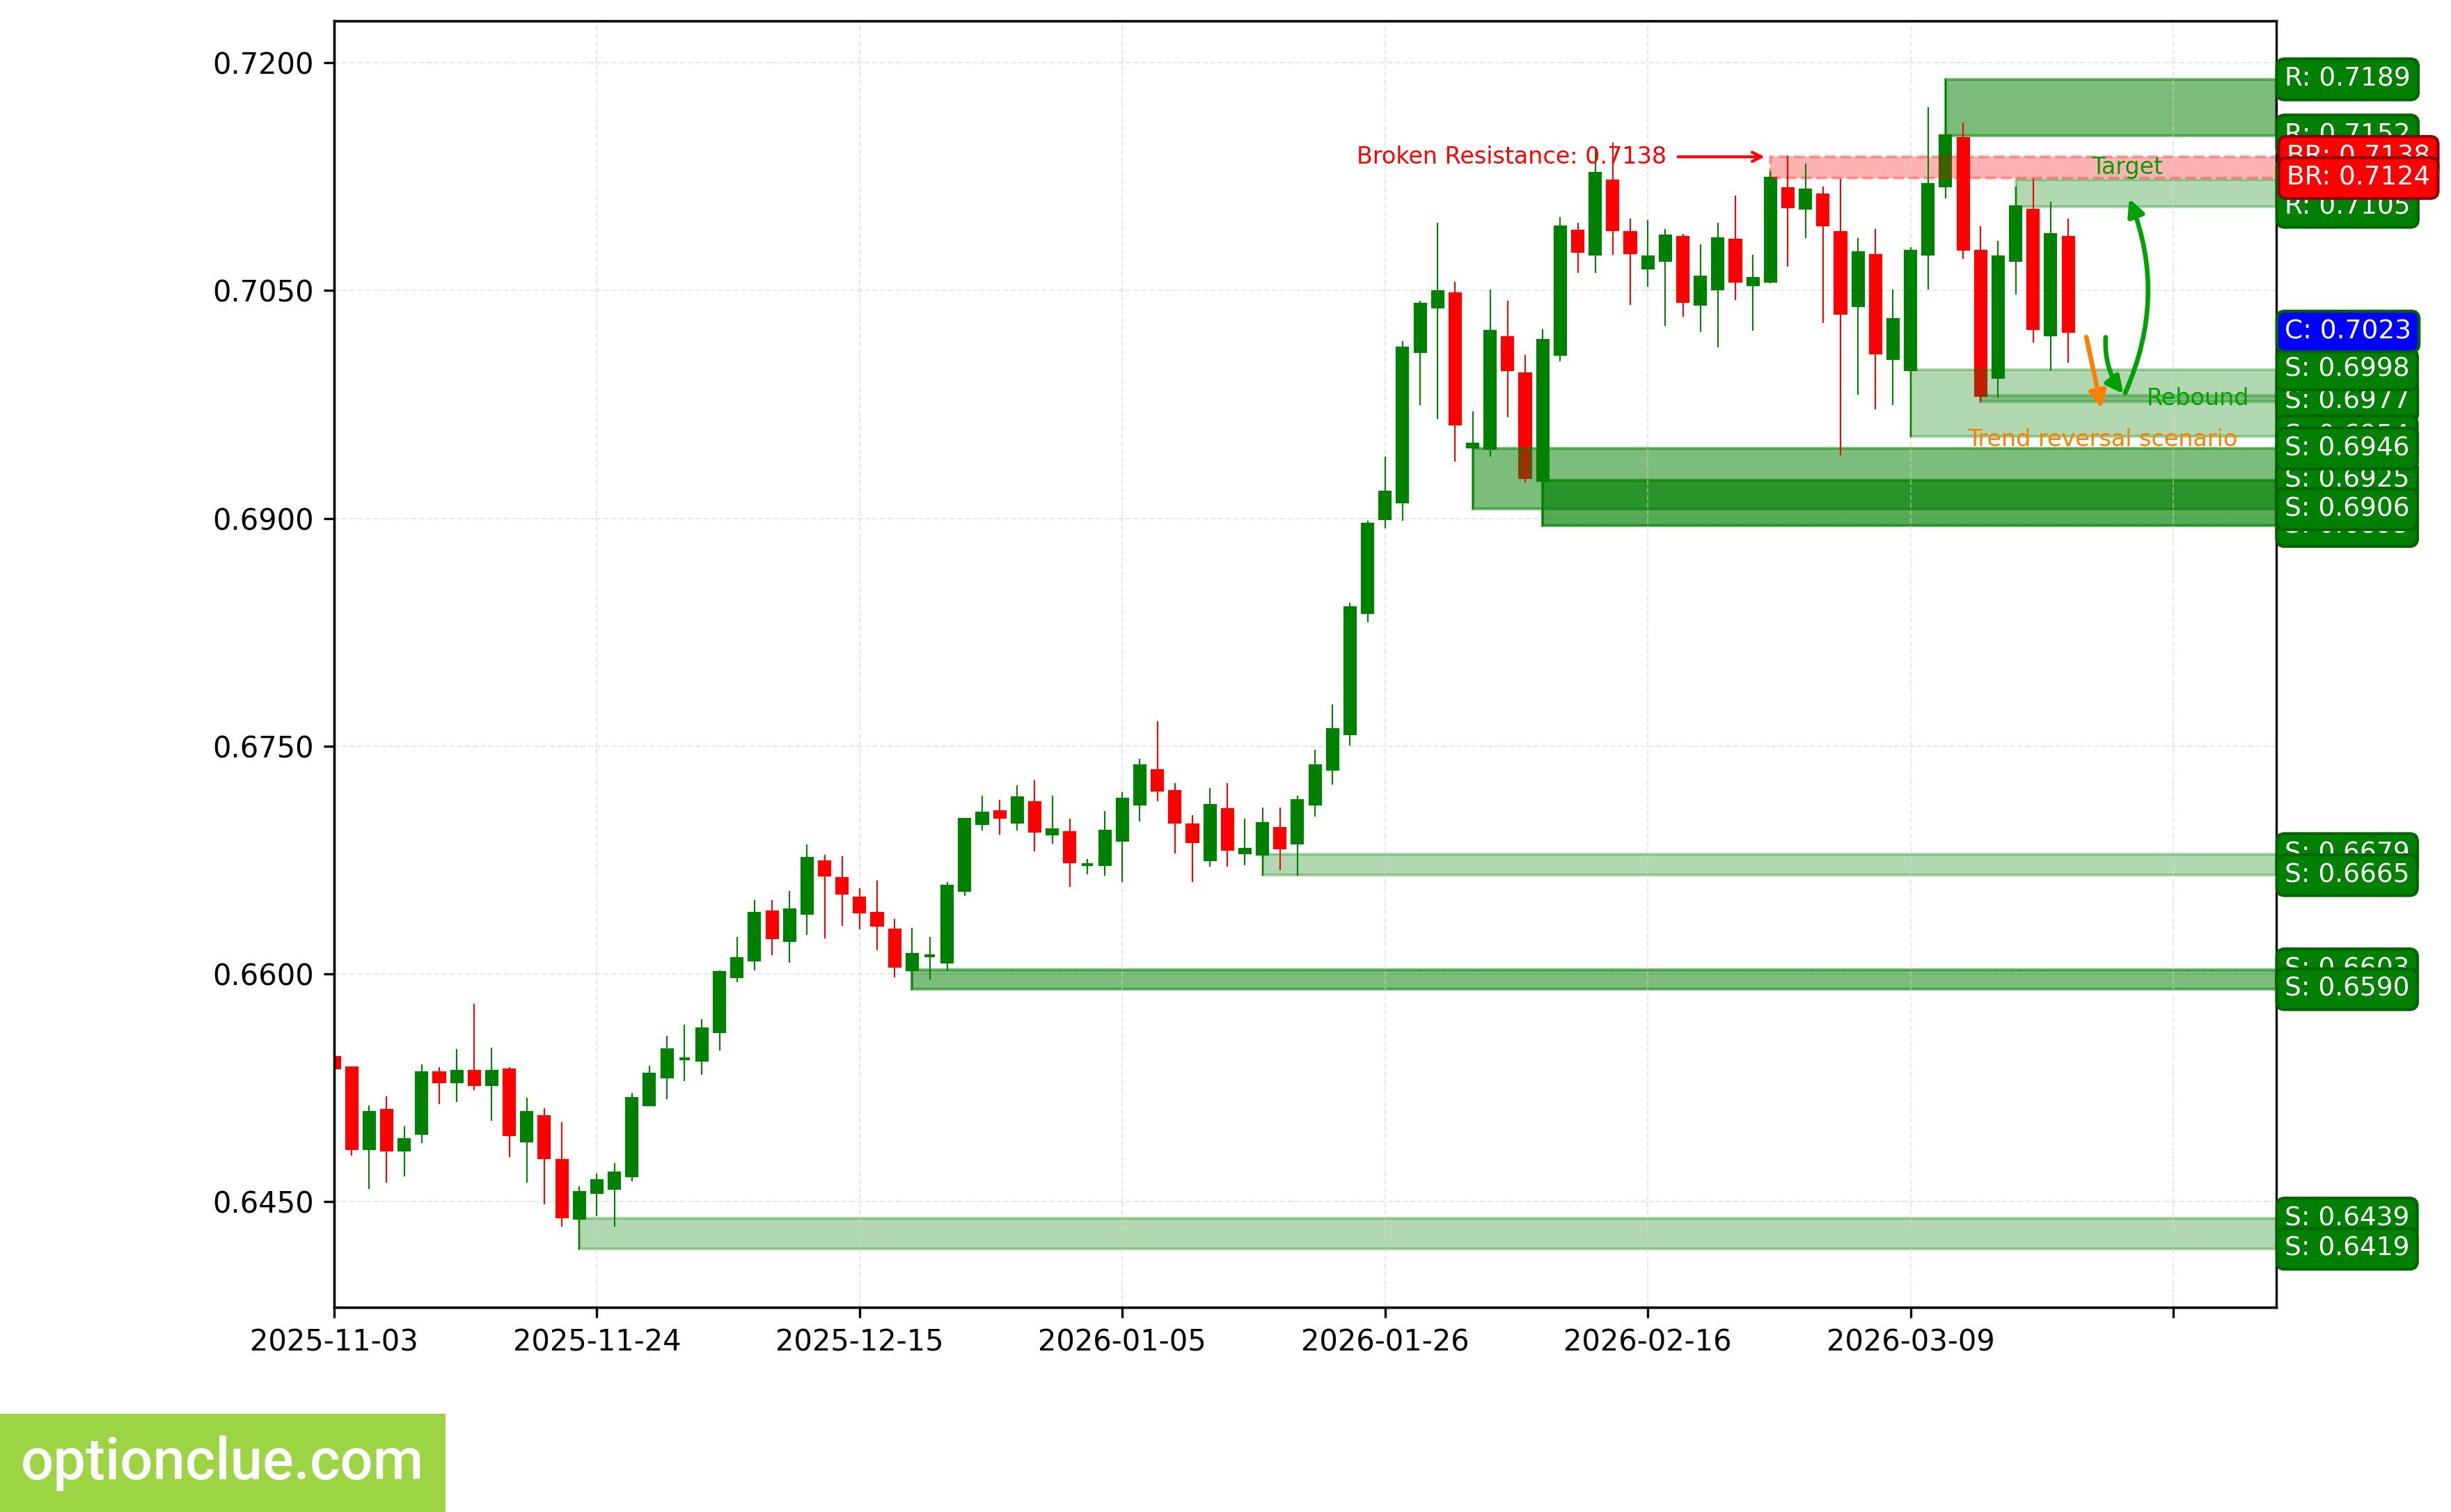
AUDUSD. Technical analysis. D1.
Bitcoin (BTC)
The bullish trend continues, the corrective wave is likely completing. The last broken level is resistance (72713 — 74052). The breakout occurred 5 candlesticks ago.
Intermediate target for the upside move is the resistance level with boundaries 74861 — 75988. In case of successful trend development, a further target will be at the resistance level with boundaries 89185 — 90439.
If the correction completes around the support level (65639 — 65970), the potential profit/risk ratio may be approximately 3:1. When using a further target — around 8:1.
Long positions will remain relevant as long as the market is above the nearest support level with boundaries 65639 — 65970. If the market successfully settles below this support, the trend will change to the opposite (bearish).
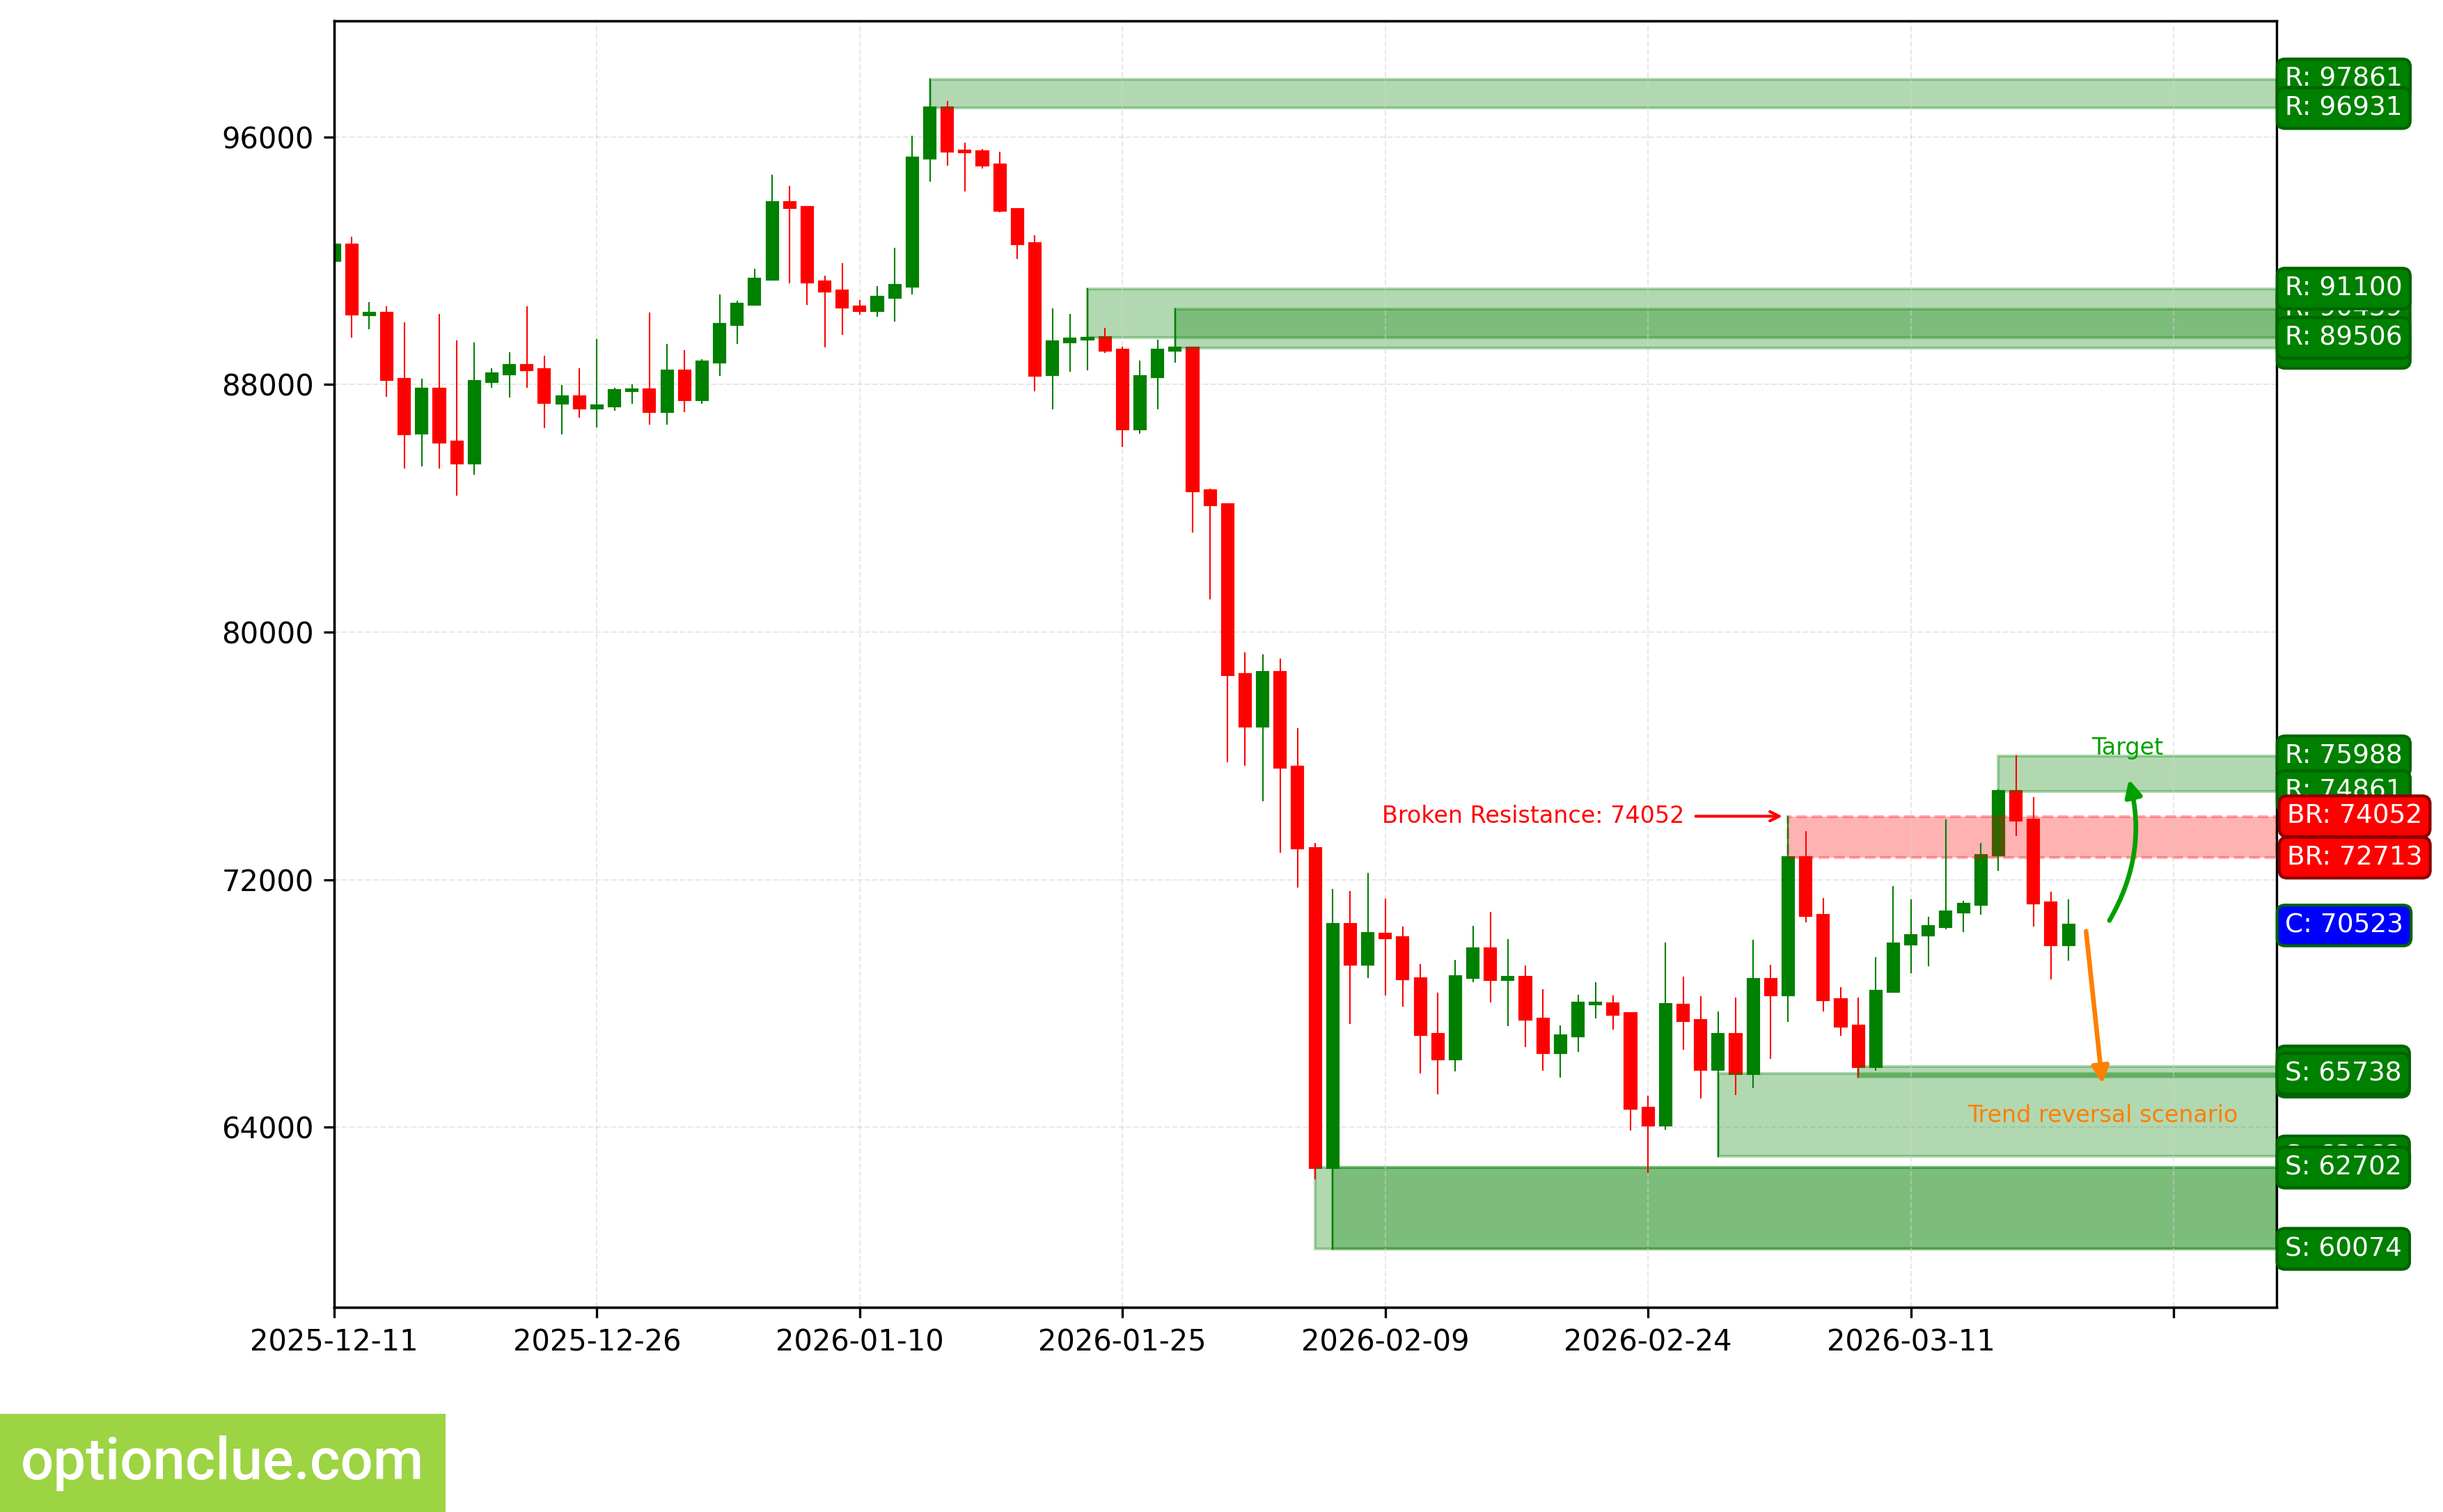
BTC. Technical analysis. D1.
Ether (ETH)
The bullish trend continues, the corrective wave is likely completing. The last broken level is resistance (2127 — 2199). The breakout occurred 5 candlesticks ago, and the price has returned to this last broken level.
Intermediate target for the upside move is the resistance level with boundaries 2351 — 2384. In case of successful trend development, a further target will be at the resistance level with boundaries 3022 — 3041.
If the correction completes around the support level (1915 — 1937), the potential profit/risk ratio may be around 3.6:1. When using a further target — around 9:1.
Long positions will remain relevant as long as the market is above the nearest support level with boundaries 1915 — 1937. If the market successfully settles below this nearest support, the trend will change to the opposite (bearish).
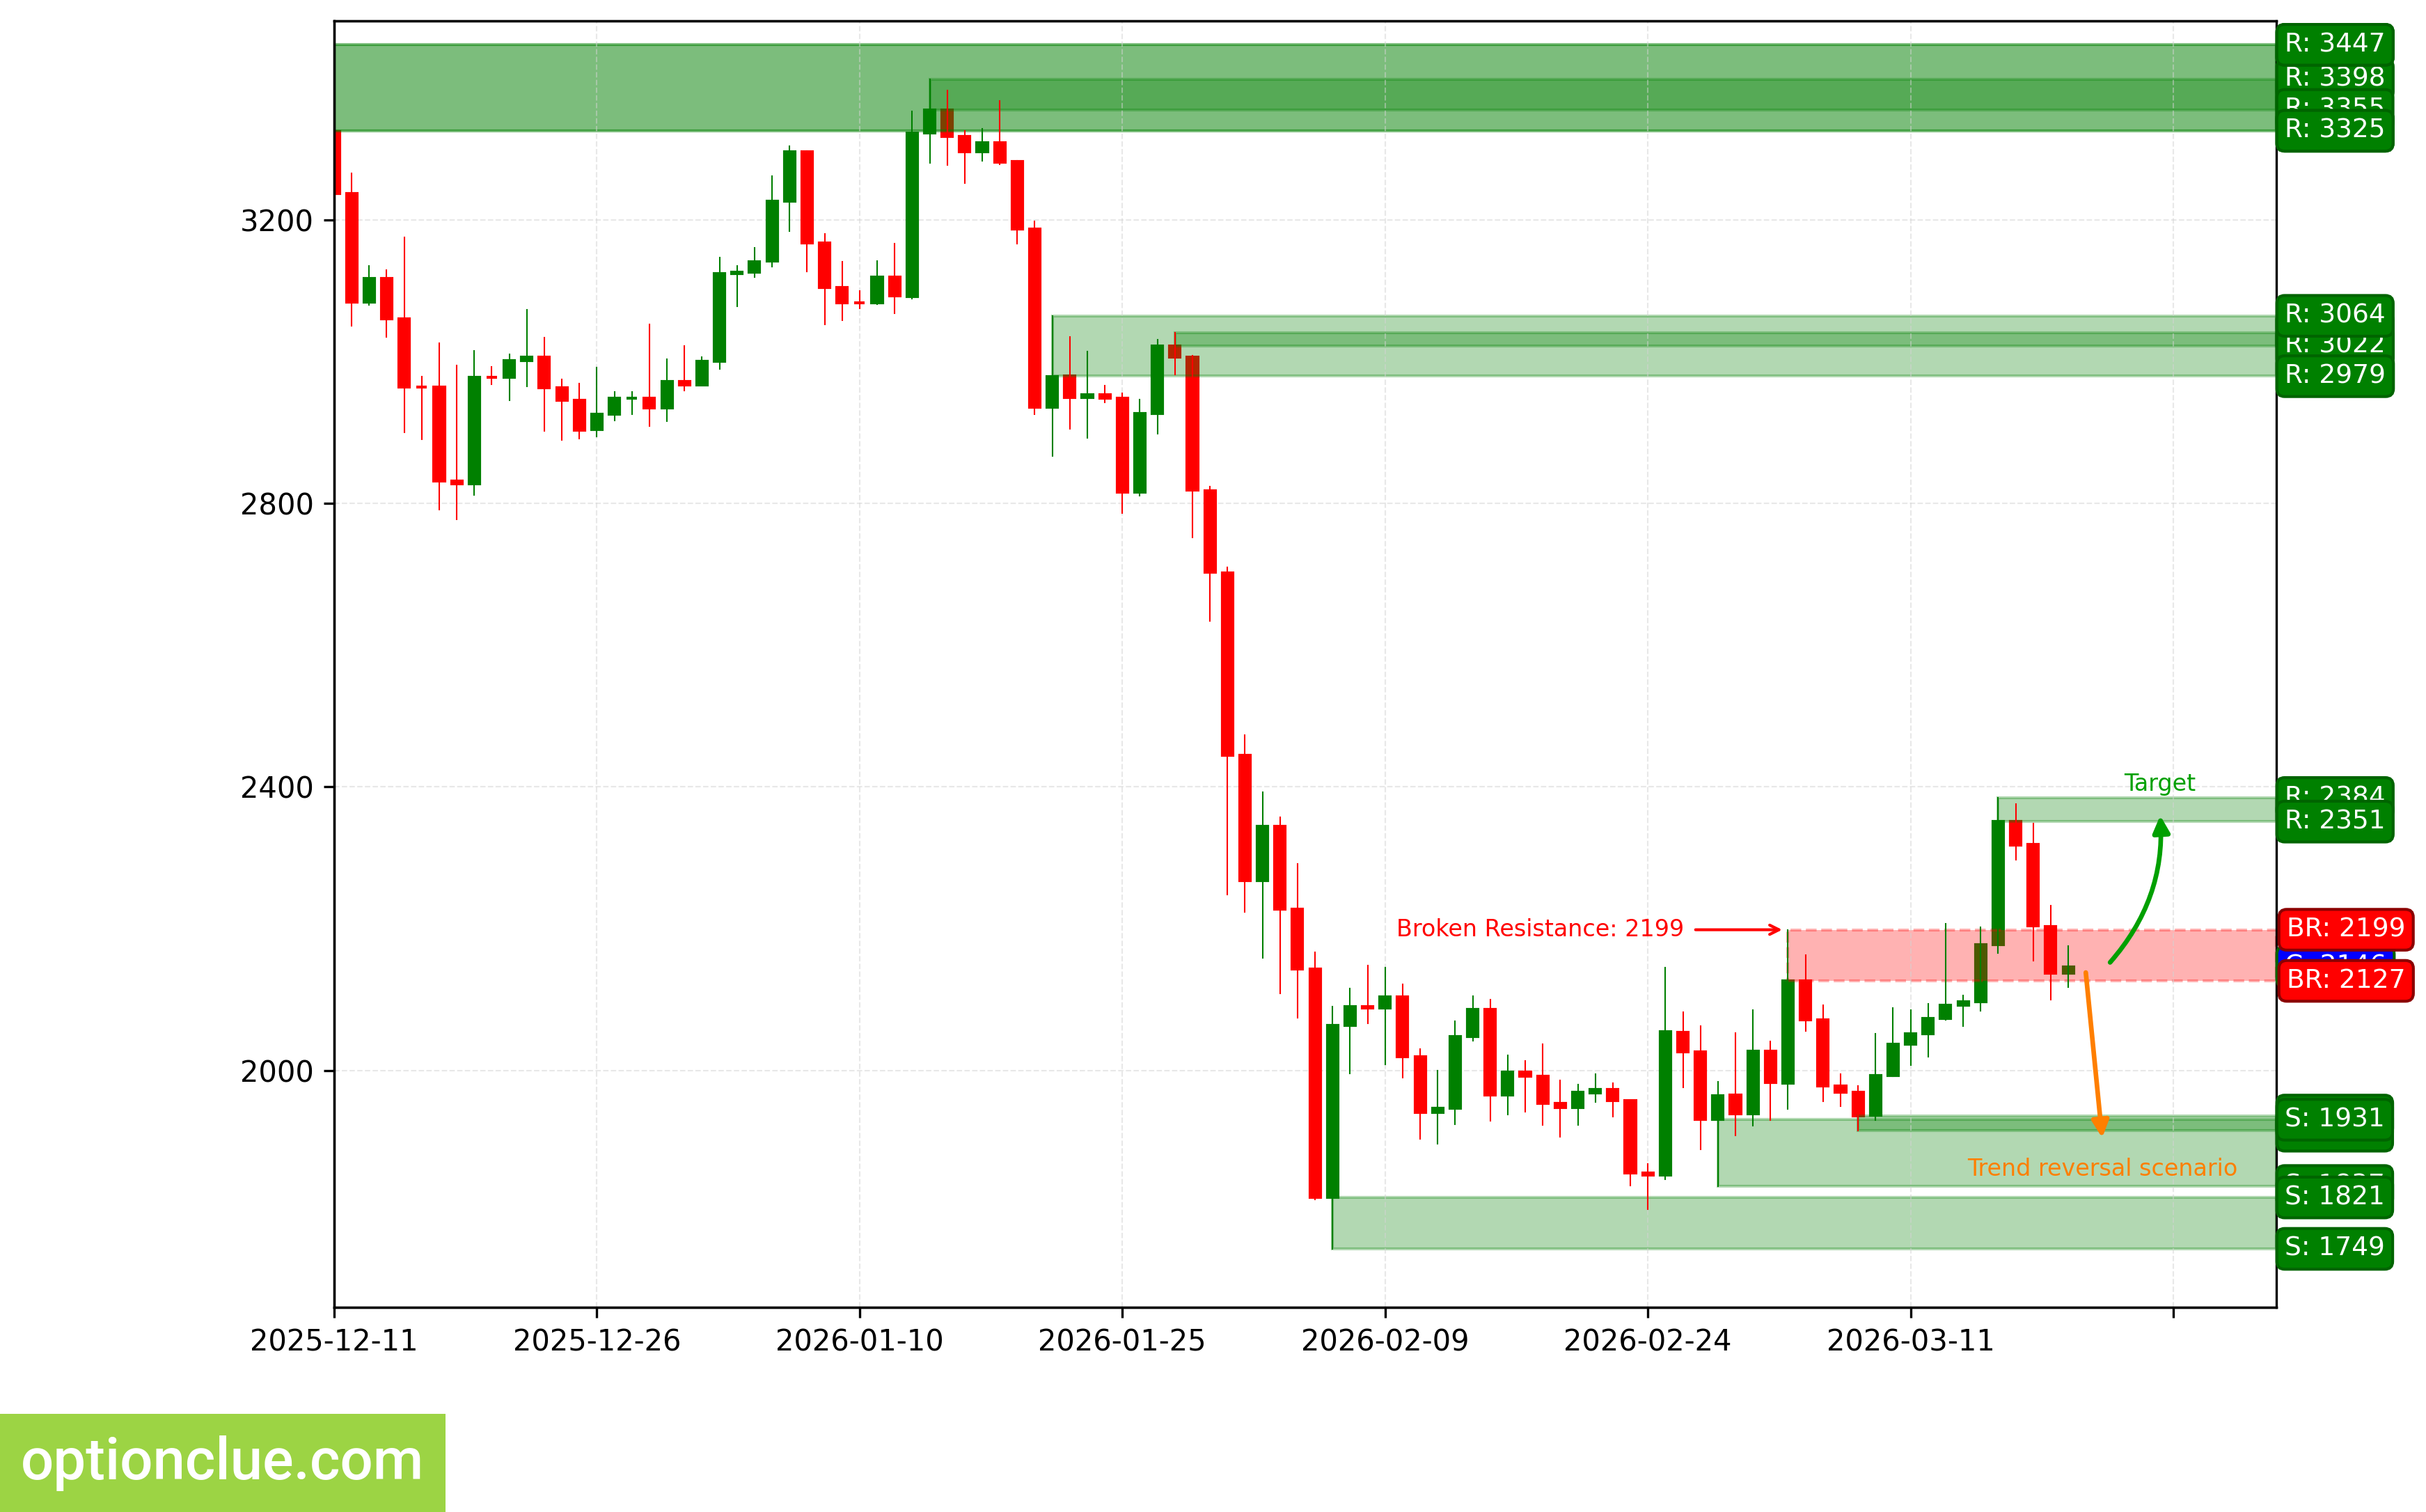
ETH. Technical analysis. D1.
Apple Inc (AAPL)
The bearish trend continues, a corrective wave is developing. An entry point for selling on rebound may form after the current correction completes. The last broken level is support (249.52 — 250.12). The breakout occurred 2 candlesticks ago.
Intermediate target for the downside move is the support level with boundaries 244.68 — 247.32. In case of successful trend development, a further target will be at the support level with boundaries 225.95 — 226.79.
The potential profit/risk ratio from current prices when setting targets and fixing risks based on daily timeframe levels may be small (around 0.1:1). When using a further target — approximately 1.7:1. If the new correction completes around the resistance level (254.23 — 255.13), the potential profit/risk ratio may be approximately 1.3:1. When selecting a further target — around 5:1. If the correction completes around the last broken level (249.52 — 250.12), the potential profit/risk ratio may be small (around 0.2:1). For a further target — approximately 2:1.
Short positions will remain relevant as long as the market remains below the nearest resistance level with boundaries 254.23 — 255.13. If the market successfully settles above this nearest resistance, the trend will change to the opposite (bullish).
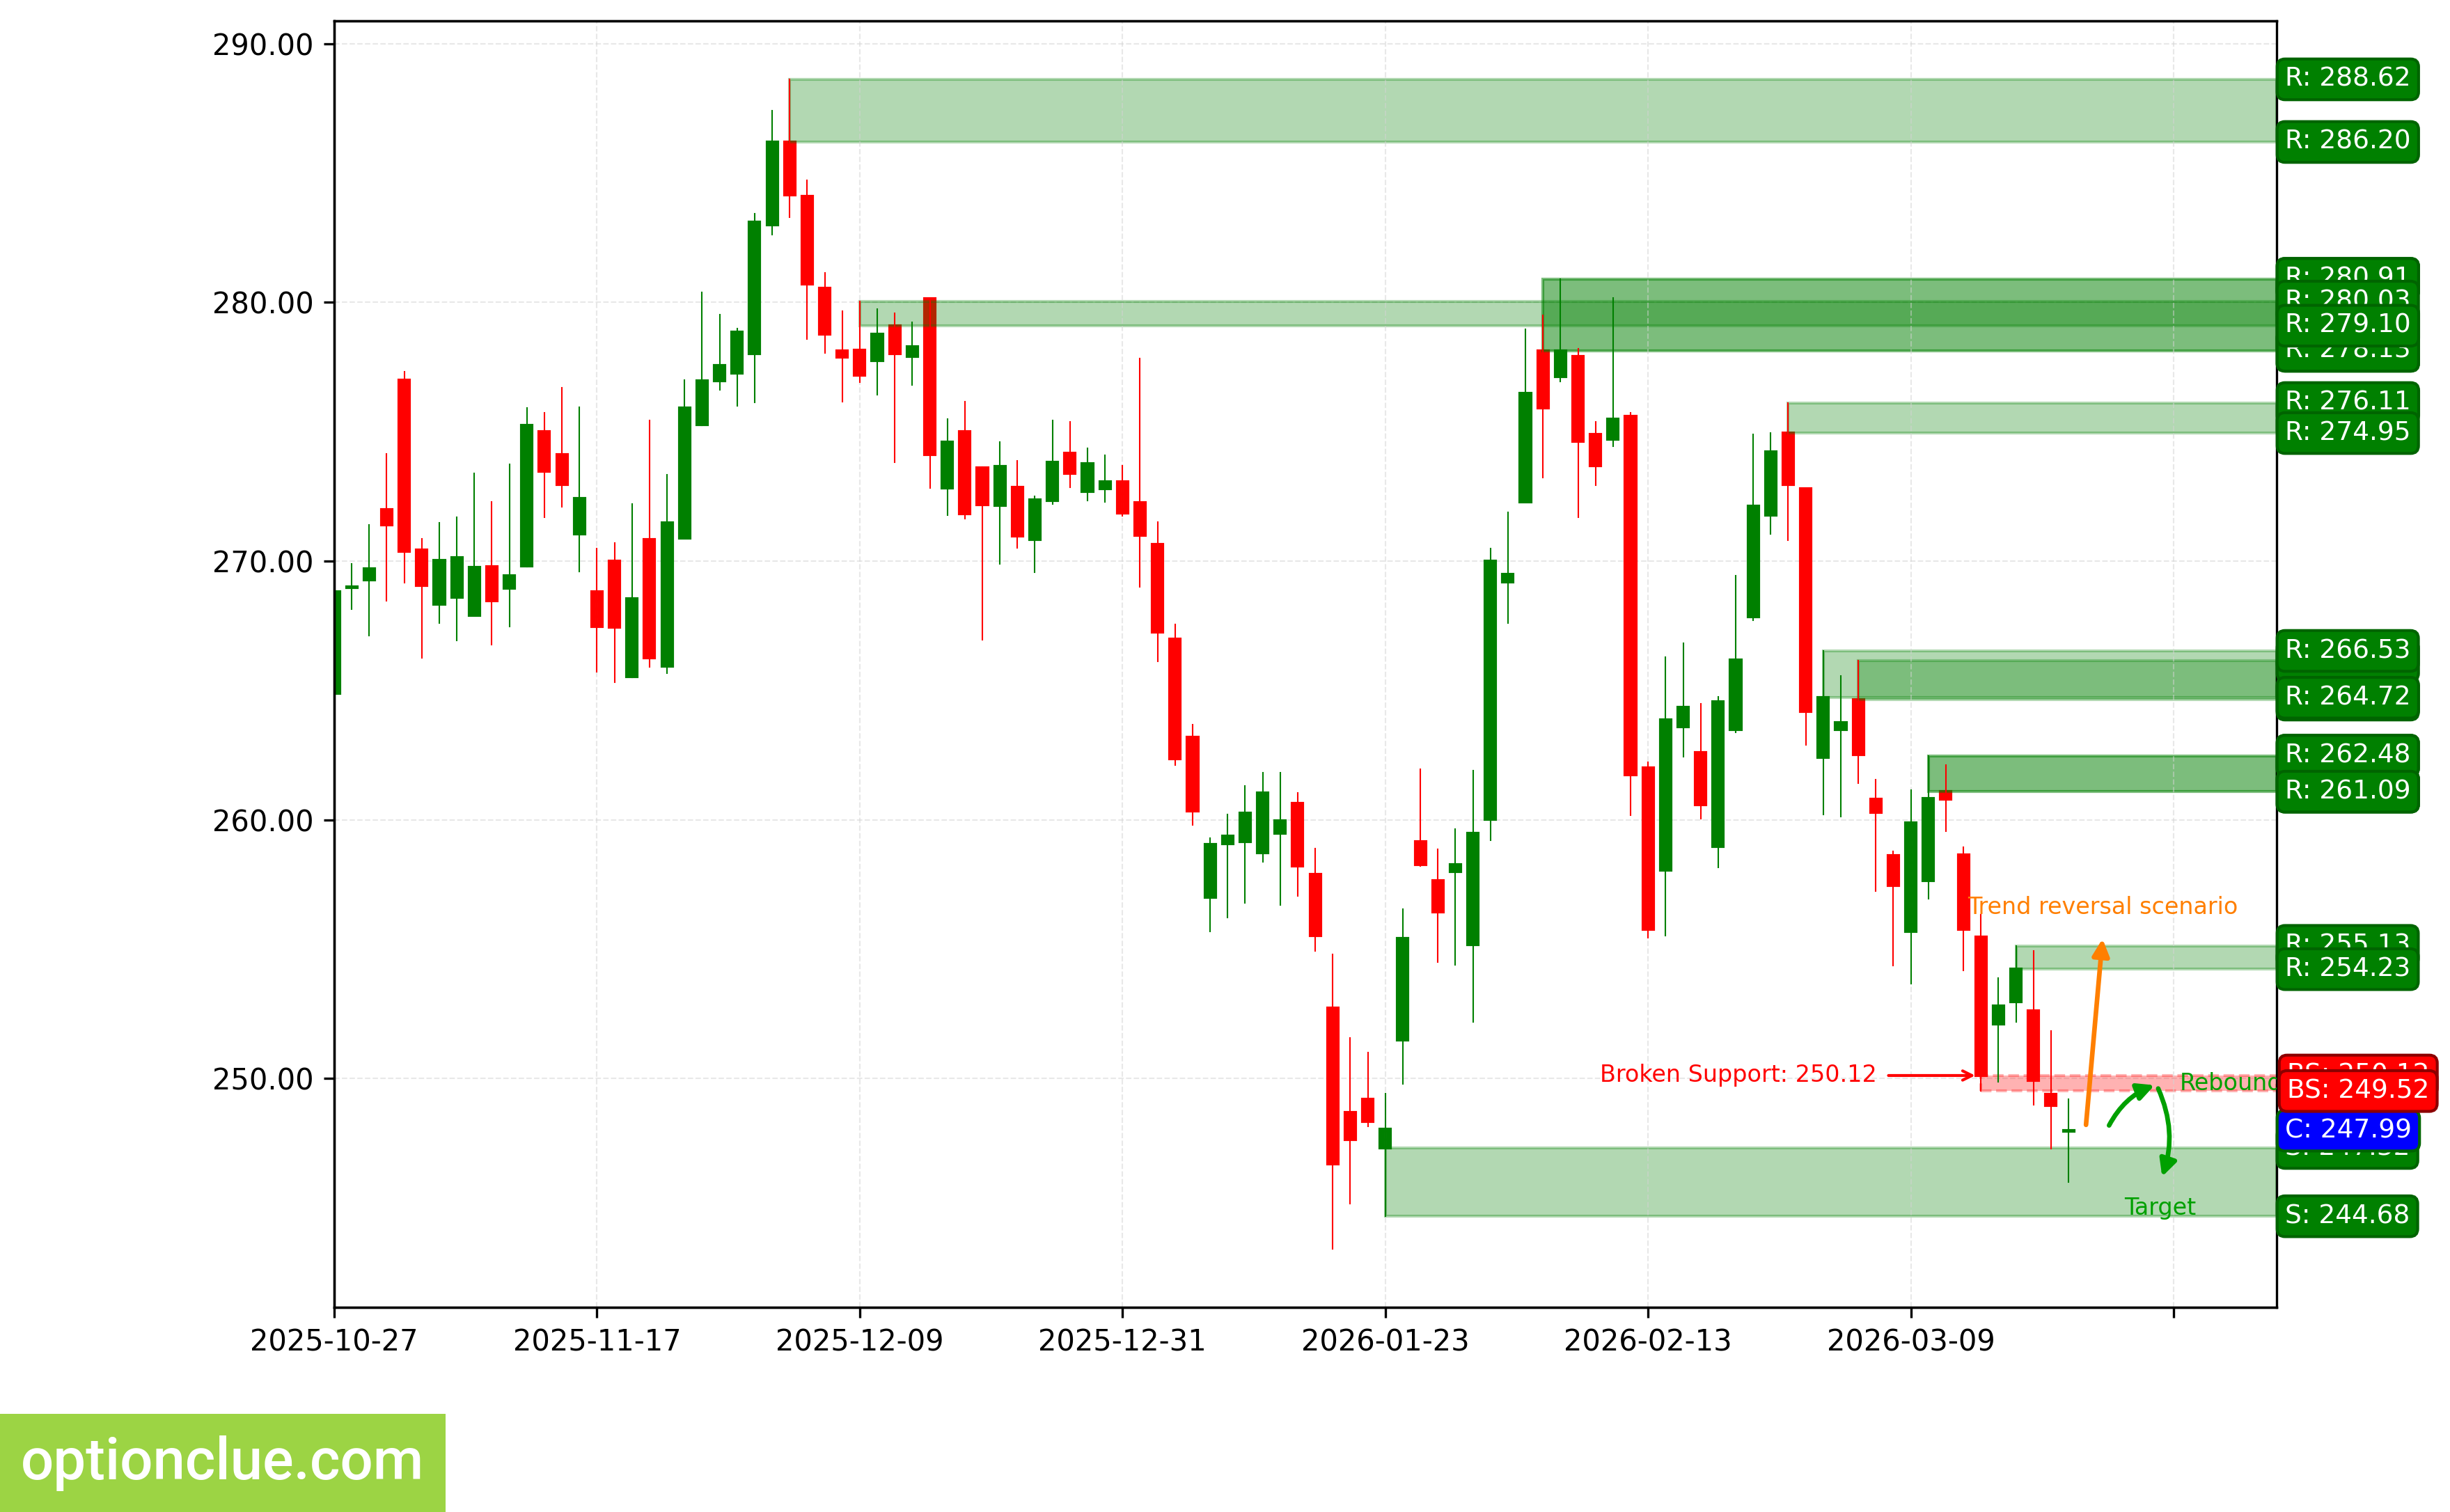
AAPL. Technical analysis. D1.
NVIDIA Corp (NVDA)
The trend has changed to bearish, when the support level (174.64 — 175.01) was broken. The breakout occurred on the last closed candlestick, an impulse wave is developing. An entry point for selling on rebound may appear after a correction forms.
Intermediate target for the downside move is the support level with boundaries 171.03 — 171.88. In case of successful trend development, a further target will be at the support level with boundaries 168.41 — 170.29.
If the new correction completes around the resistance level (186.03 — 188.88), the potential profit/risk ratio may be approximately 2:1. When using a further target — around 2.5:1. If the correction completes around the last broken level (174.64 — 175.01), the potential profit/risk ratio may be small (approximately 0.2:1). When selecting a further target — also small (approximately 0.2:1).
Short positions will remain relevant as long as the market remains below the nearest resistance level with boundaries 186.03 — 188.88. If the market successfully settles above this nearest resistance, the trend will change to the opposite (bullish).
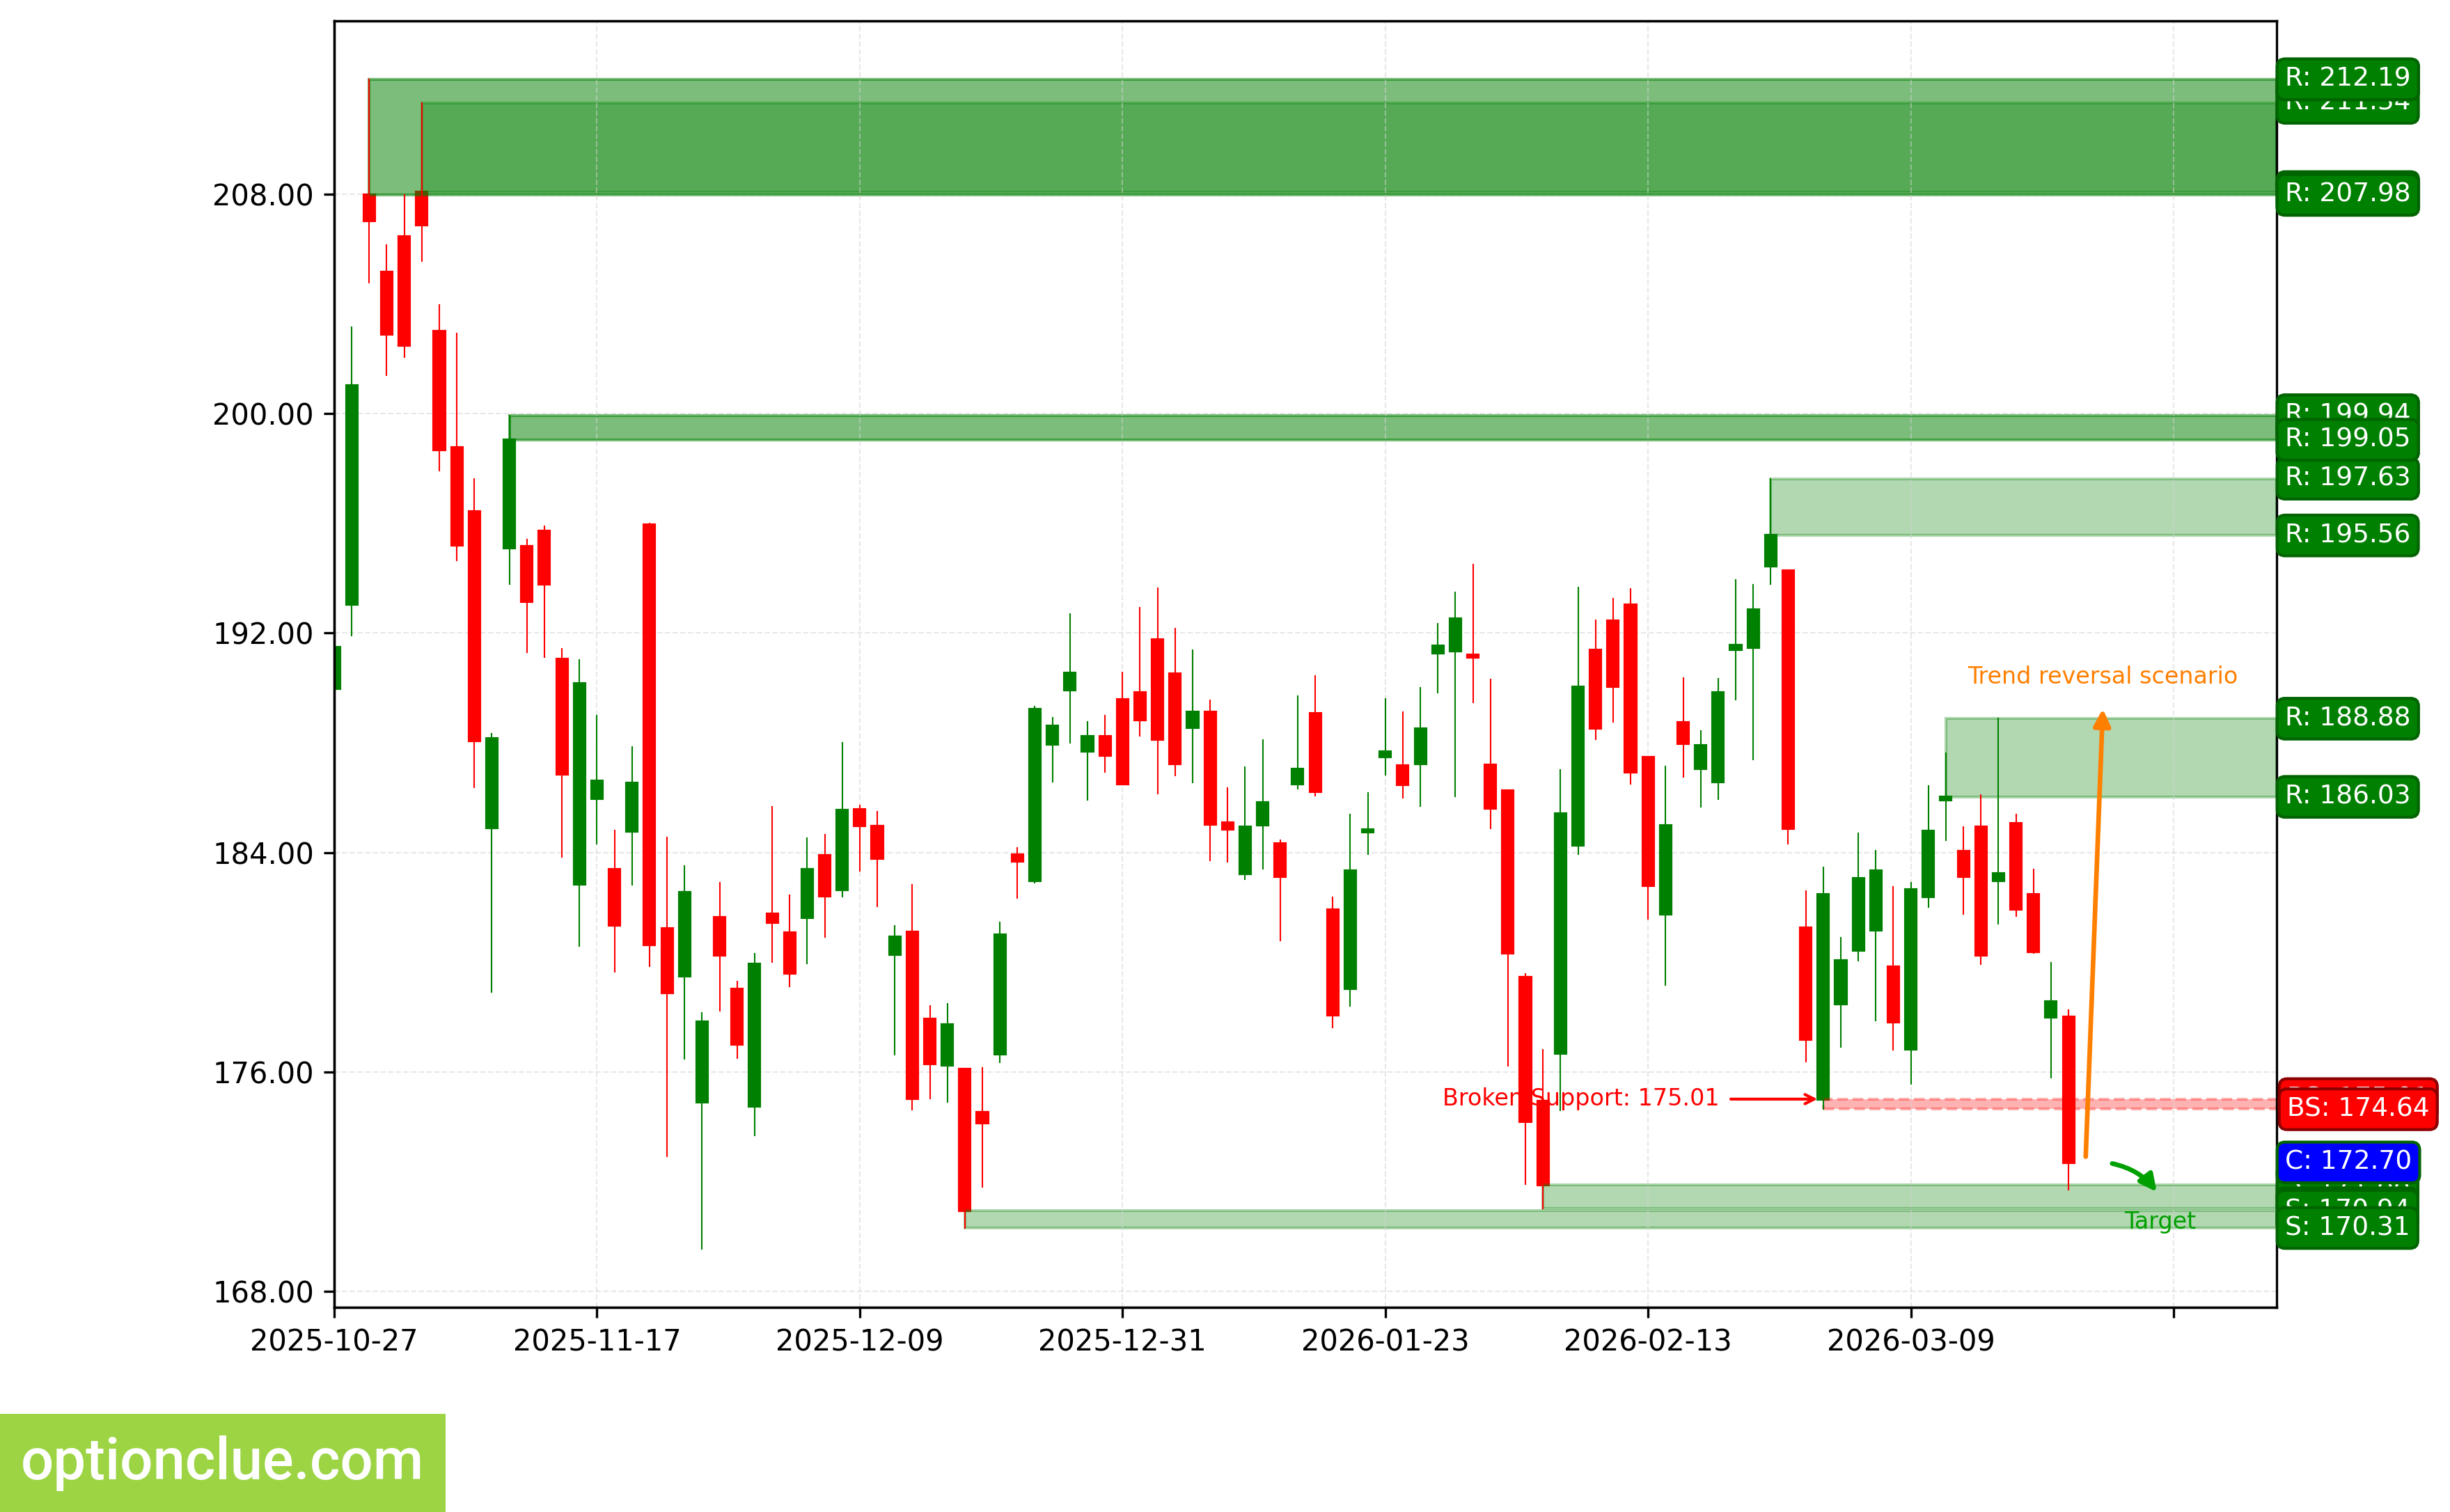
NVDA. Technical analysis. D1.
Tesla Inc (TSLA)
The bearish trend continues, an impulse wave is developing. The last broken level is support (389.95 — 391.20). The breakout occurred 2 candlesticks ago.
Intermediate target for the downside move is the support level with boundaries 346.07 — 347.79. In case of successful trend development, a further target will be at the support level with boundaries 314.60 — 320.11.
If the new correction completes around the resistance level (407.82 — 416.38), the potential profit/risk ratio may be approximately 3.6:1. When using a further target — around 5.2:1. If the next correction completes around the last broken level (389.95 — 391.20), the potential profit/risk ratio may be around 1.1:1. When selecting a further target — approximately 1.8:1.
Short positions will remain relevant as long as the market remains below the nearest resistance level with boundaries 407.82 — 416.38. If the market successfully settles above this nearest resistance, the trend will change to the opposite (bullish).
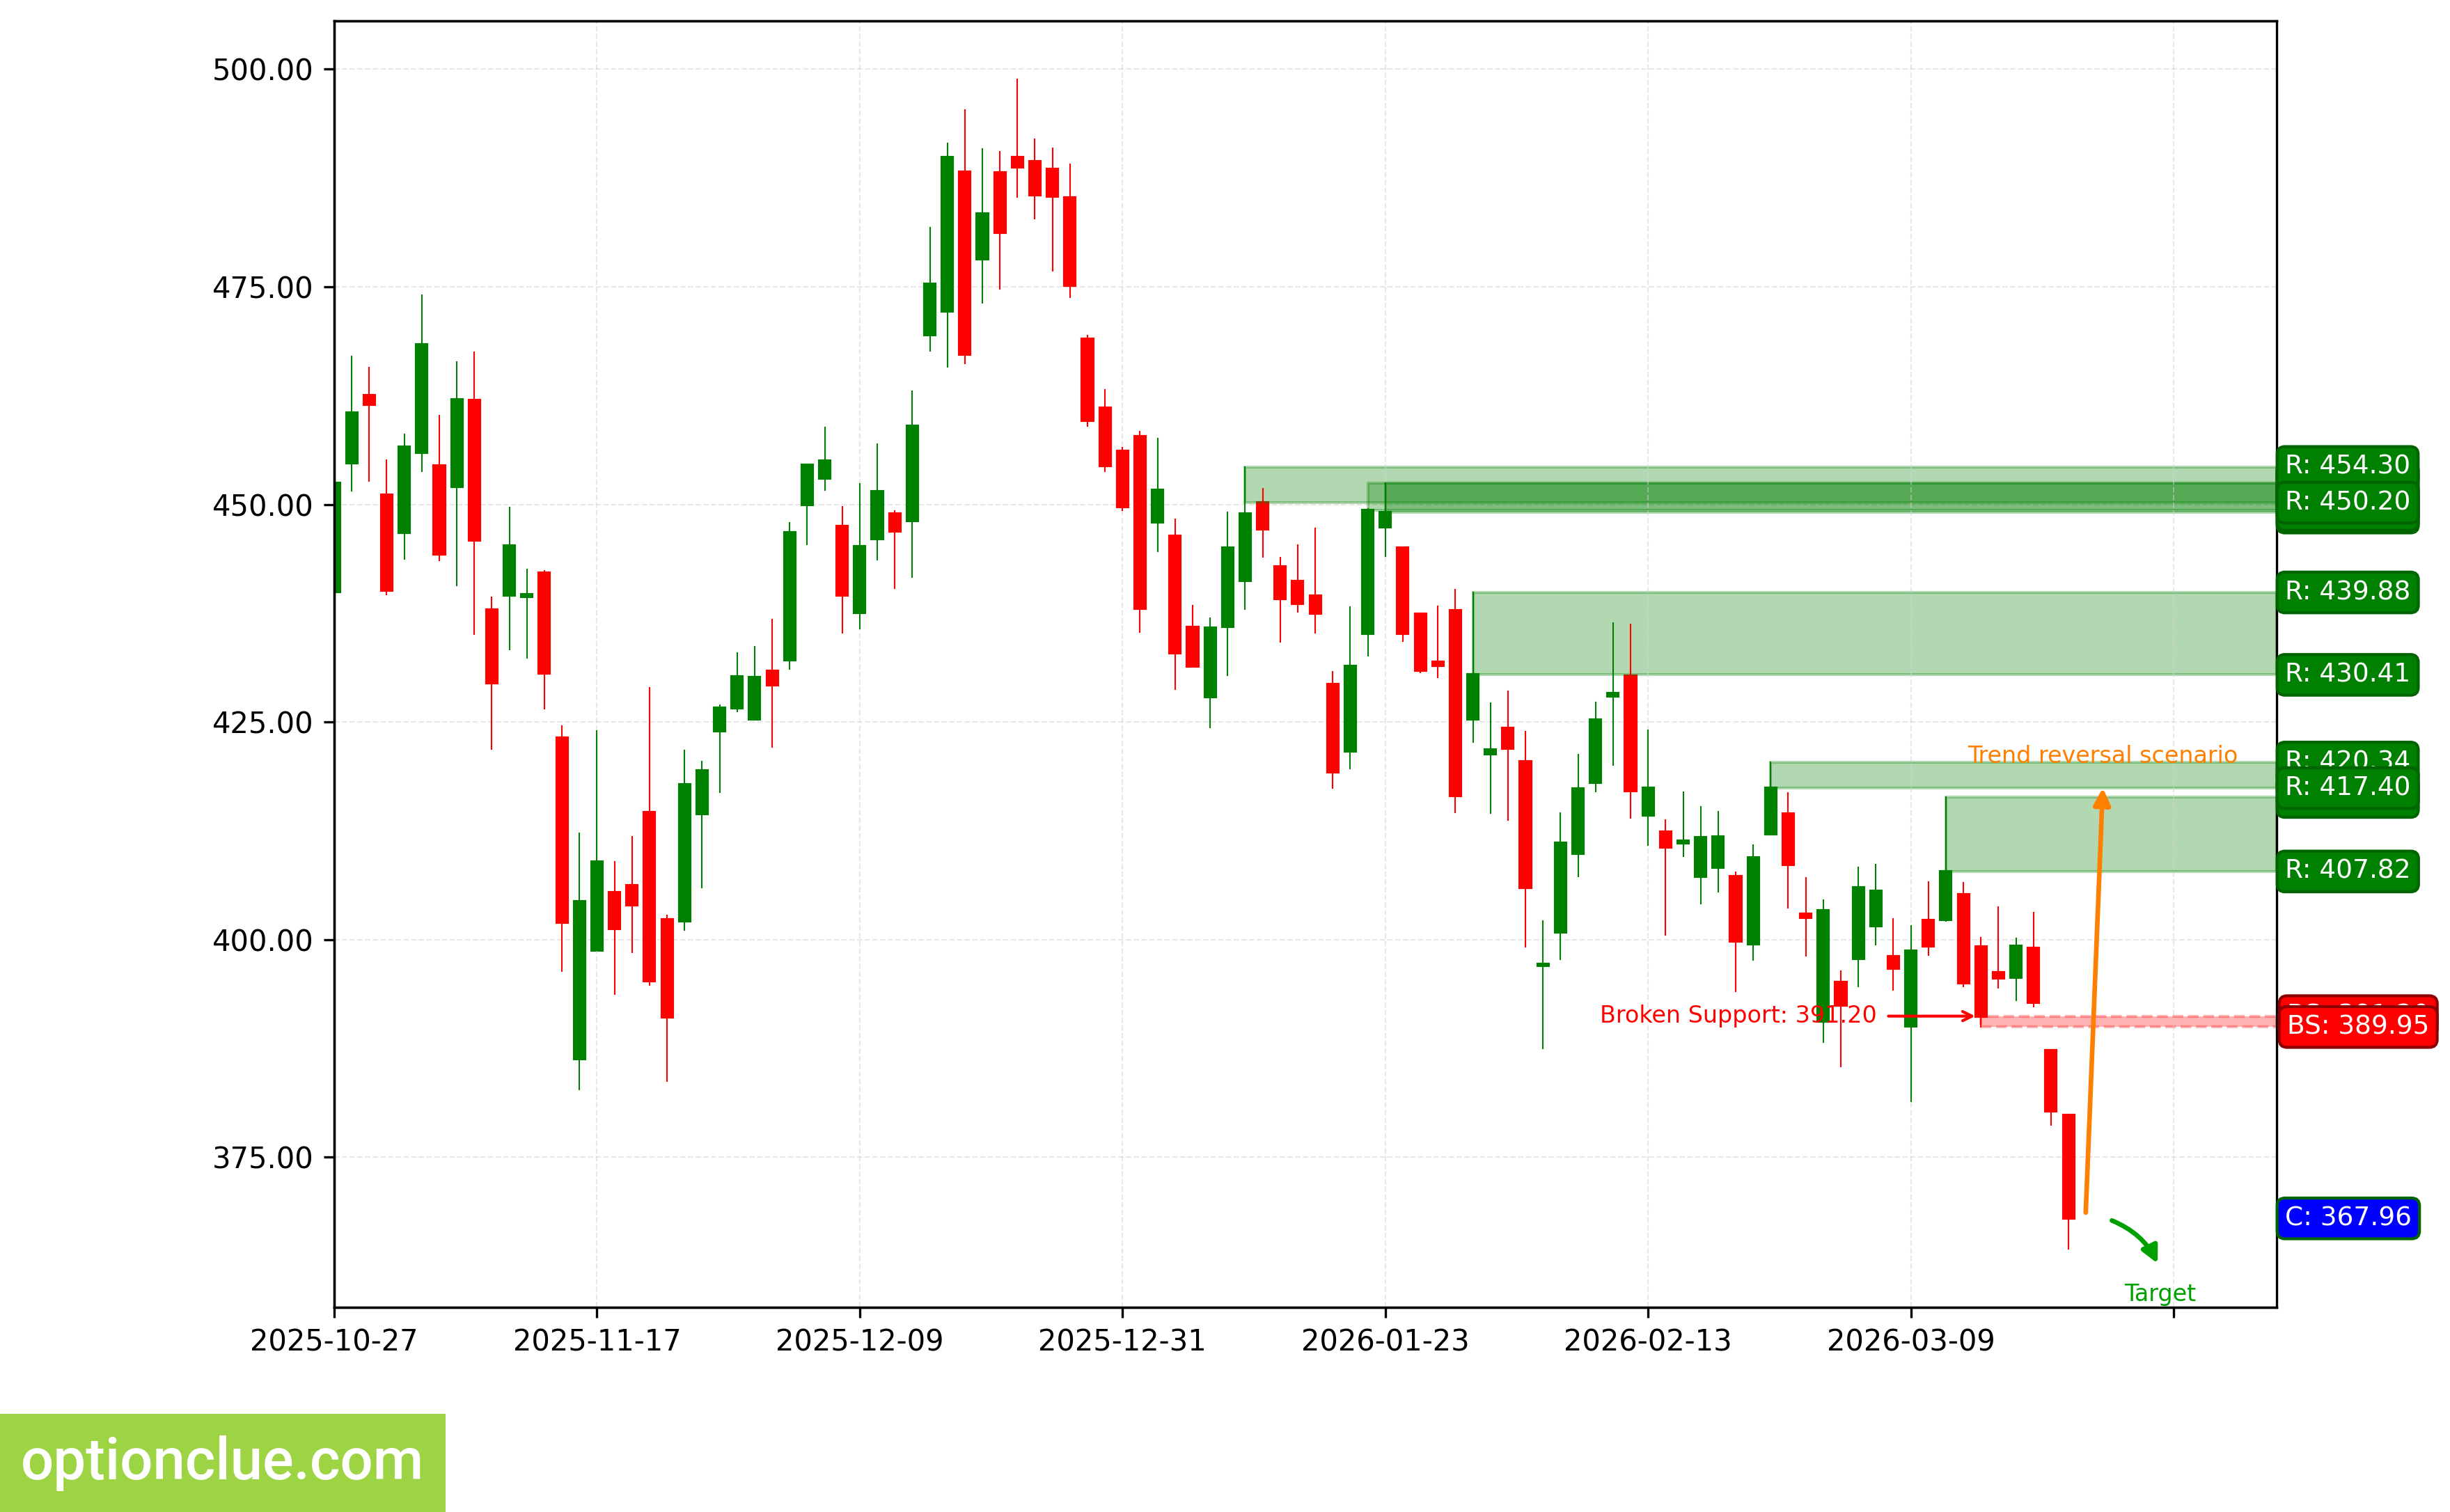
TSLA. Technical analysis. D1.
Summary
From the perspective of medium-term trading, financial instruments with a correction close to completion on Daily and/or potentially the most promising profit-to-risk ratios include: BTC, ETH, USDJPY, USDCHF, GBPUSD. In the near future, they may be worth attention depending on the depth of the market correction: AAPL, USDCAD.
The remaining financial instruments on the trading list may also be of interest, but on these markets, rebound signals on Daily are likely to appear no earlier than in a week.