
Analyzing the current market situation using technical analysis. Focusing on key horizontal support and resistance levels.
Key Topics
- Euro (EURUSD)
- British Pound (GBPUSD)
- Swiss Franc (USDCHF)
- Japanese Yen (USDJPY)
- Canadian Dollar (USDCAD)
- Australian Dollar (AUDUSD)
- New Zealand Dollar (NZDUSD)
- Bitcoin (BTC)
- Ether (ETH)
- Apple Inc (AAPL)
- NVIDIA Corp (NVDA)
- Tesla Inc (TSLA)
- Summary
Euro (EURUSD)
The trend is bullish, and a corrective wave is developing. A resistance level was broken 4 days ago, and the price has returned to this last broken level. A long entry point on a rebound will appear after the correction on the daily timeframe is complete.
The first target for the upward move is the resistance level with boundaries at 1.1866 —
1.1918.
Long positions will remain relevant as long as the market stays above the nearest support level
with boundaries at 1.1606 — 1.1638. If the correction ends around the current prices, the potential profit/risk ratio will be around 1.
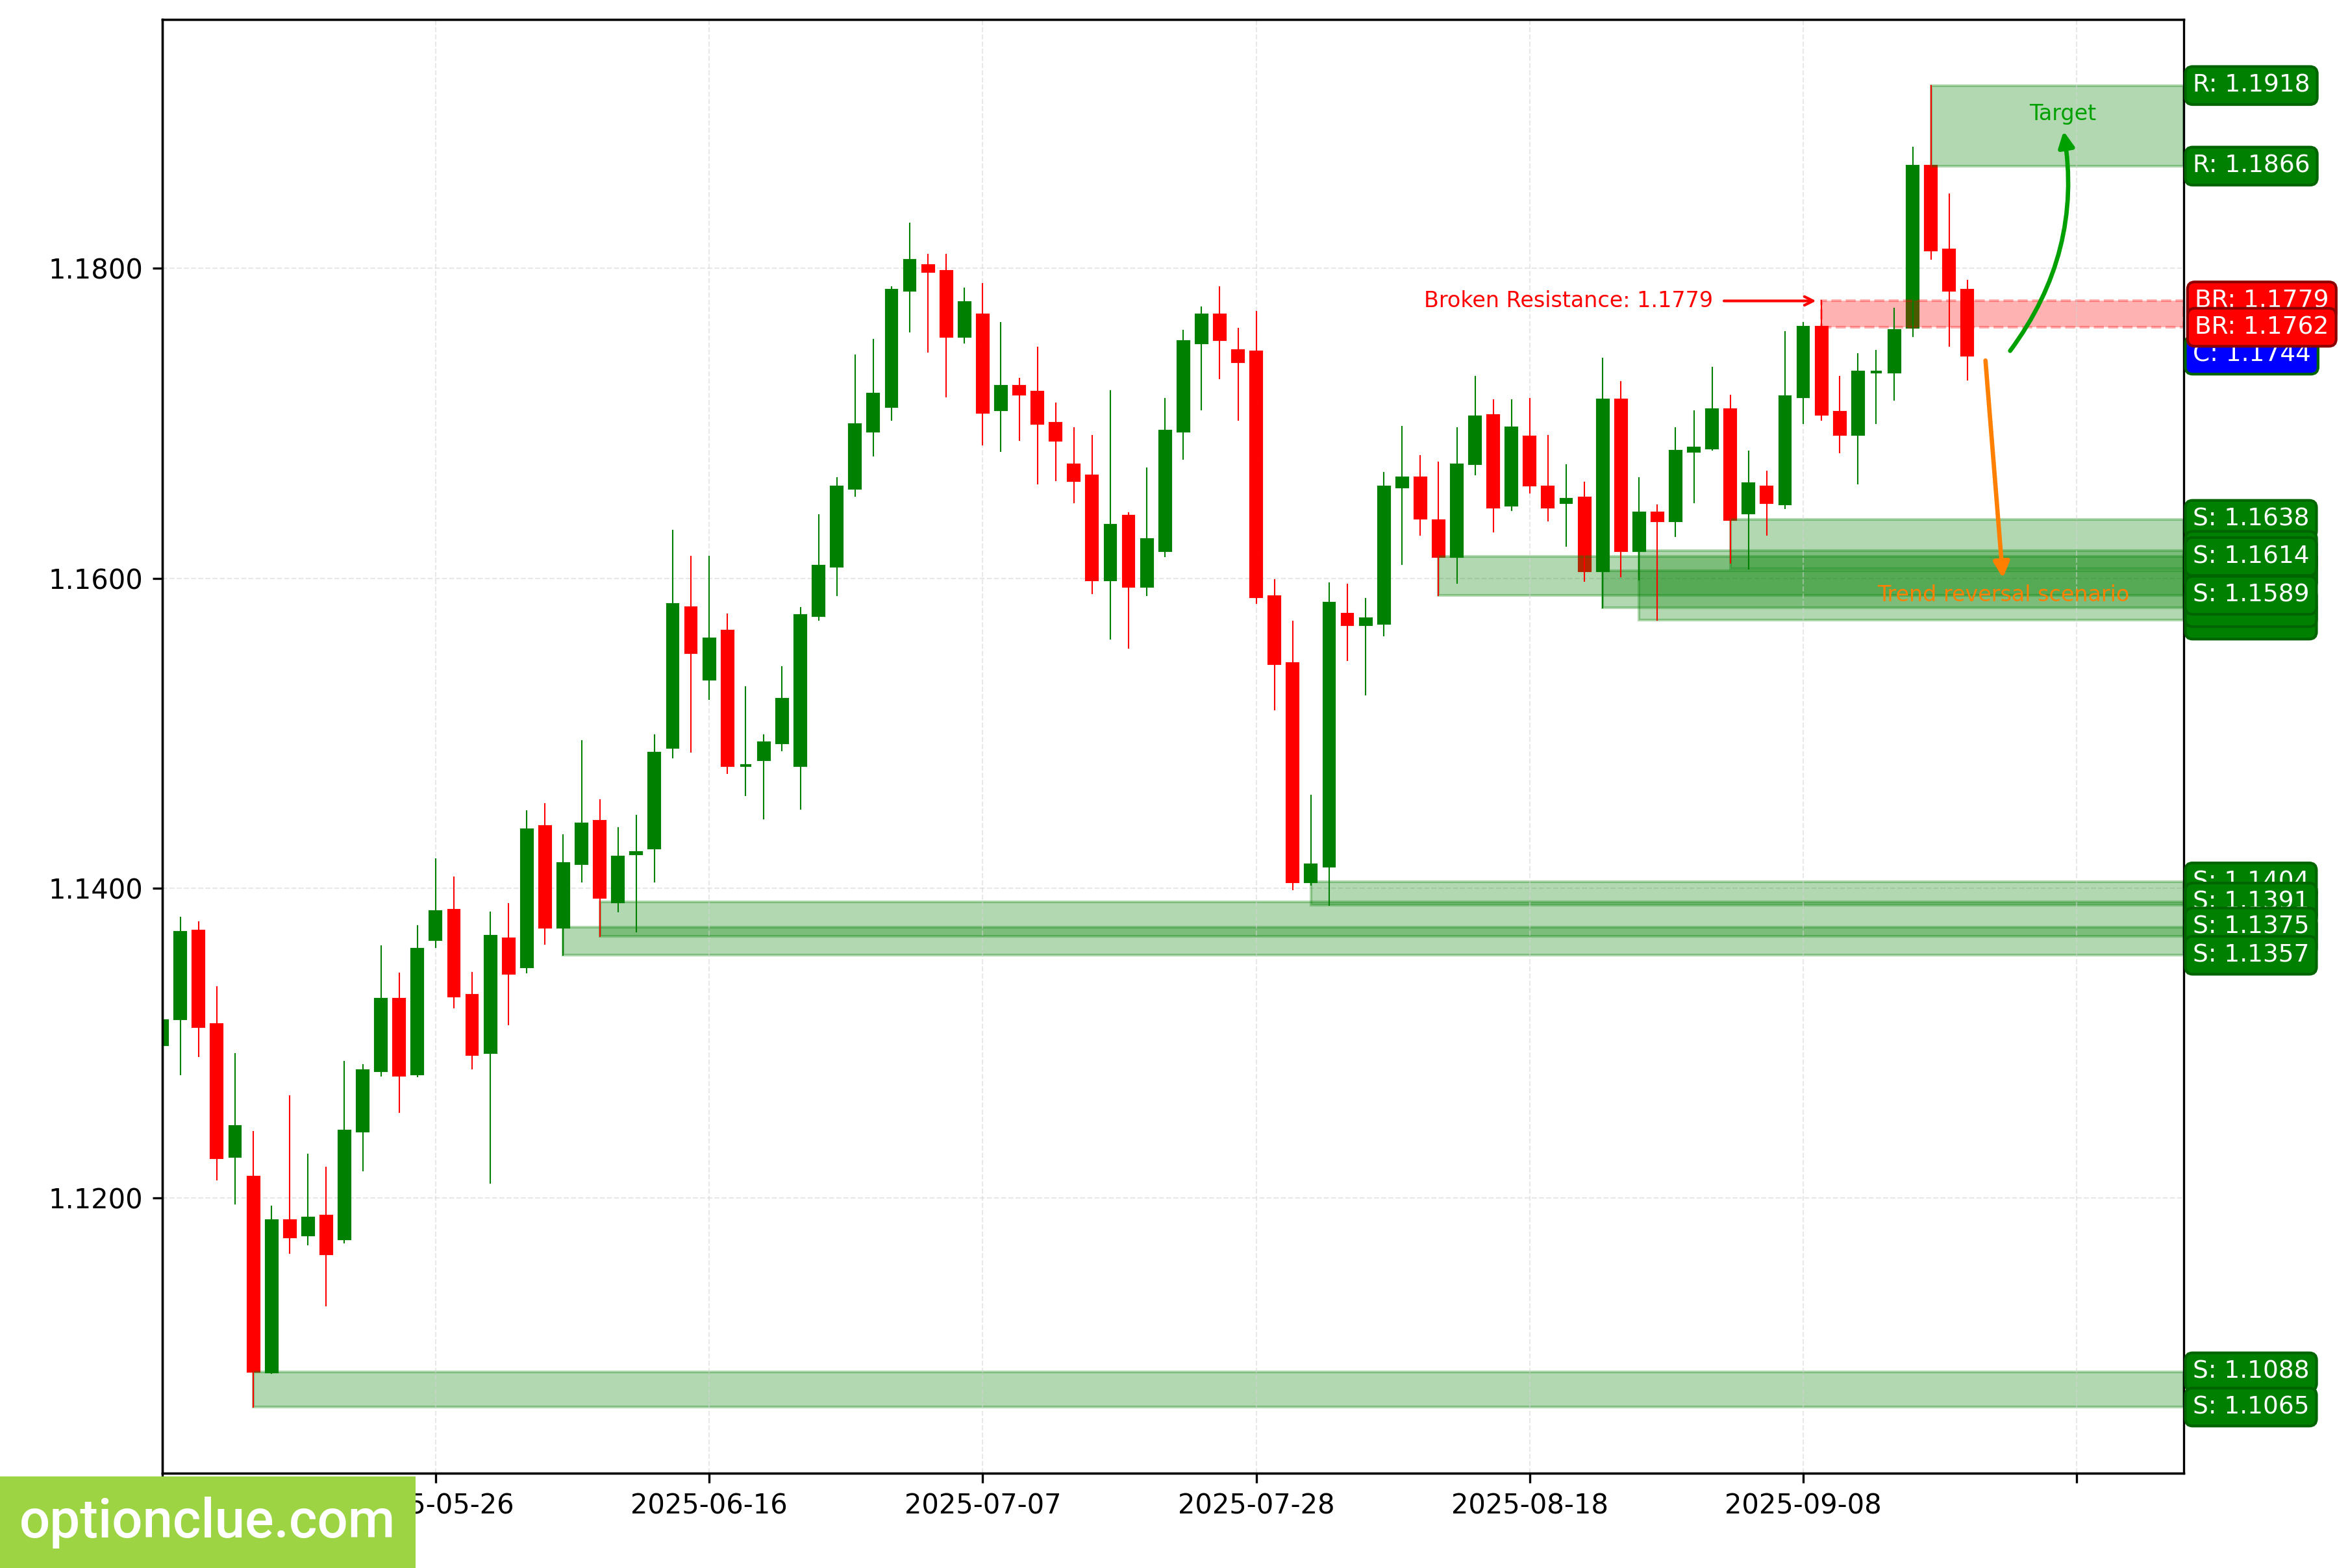
EURUSD. Technical analysis. D1.
British Pound (GBPUSD)
The trend has changed to bearish, and an impulse wave is developing.
The last broken level was support (1.3491 — 1.3524). The breakout occurred 1 day ago, and the correction has not yet begun.
A short entry point on a rebound will appear after a correction forms. The intermediate target for the downward move is the support level with boundaries at 1.3330 — 1.3387.
If the market successfully holds below this support, it will open the way for the price to move to target #2 — the support level with boundaries at 1.3138 — 1.3205. Short positions will remain relevant as long as the market stays below the nearest resistance level with boundaries at 1.3647 — 1.3726.
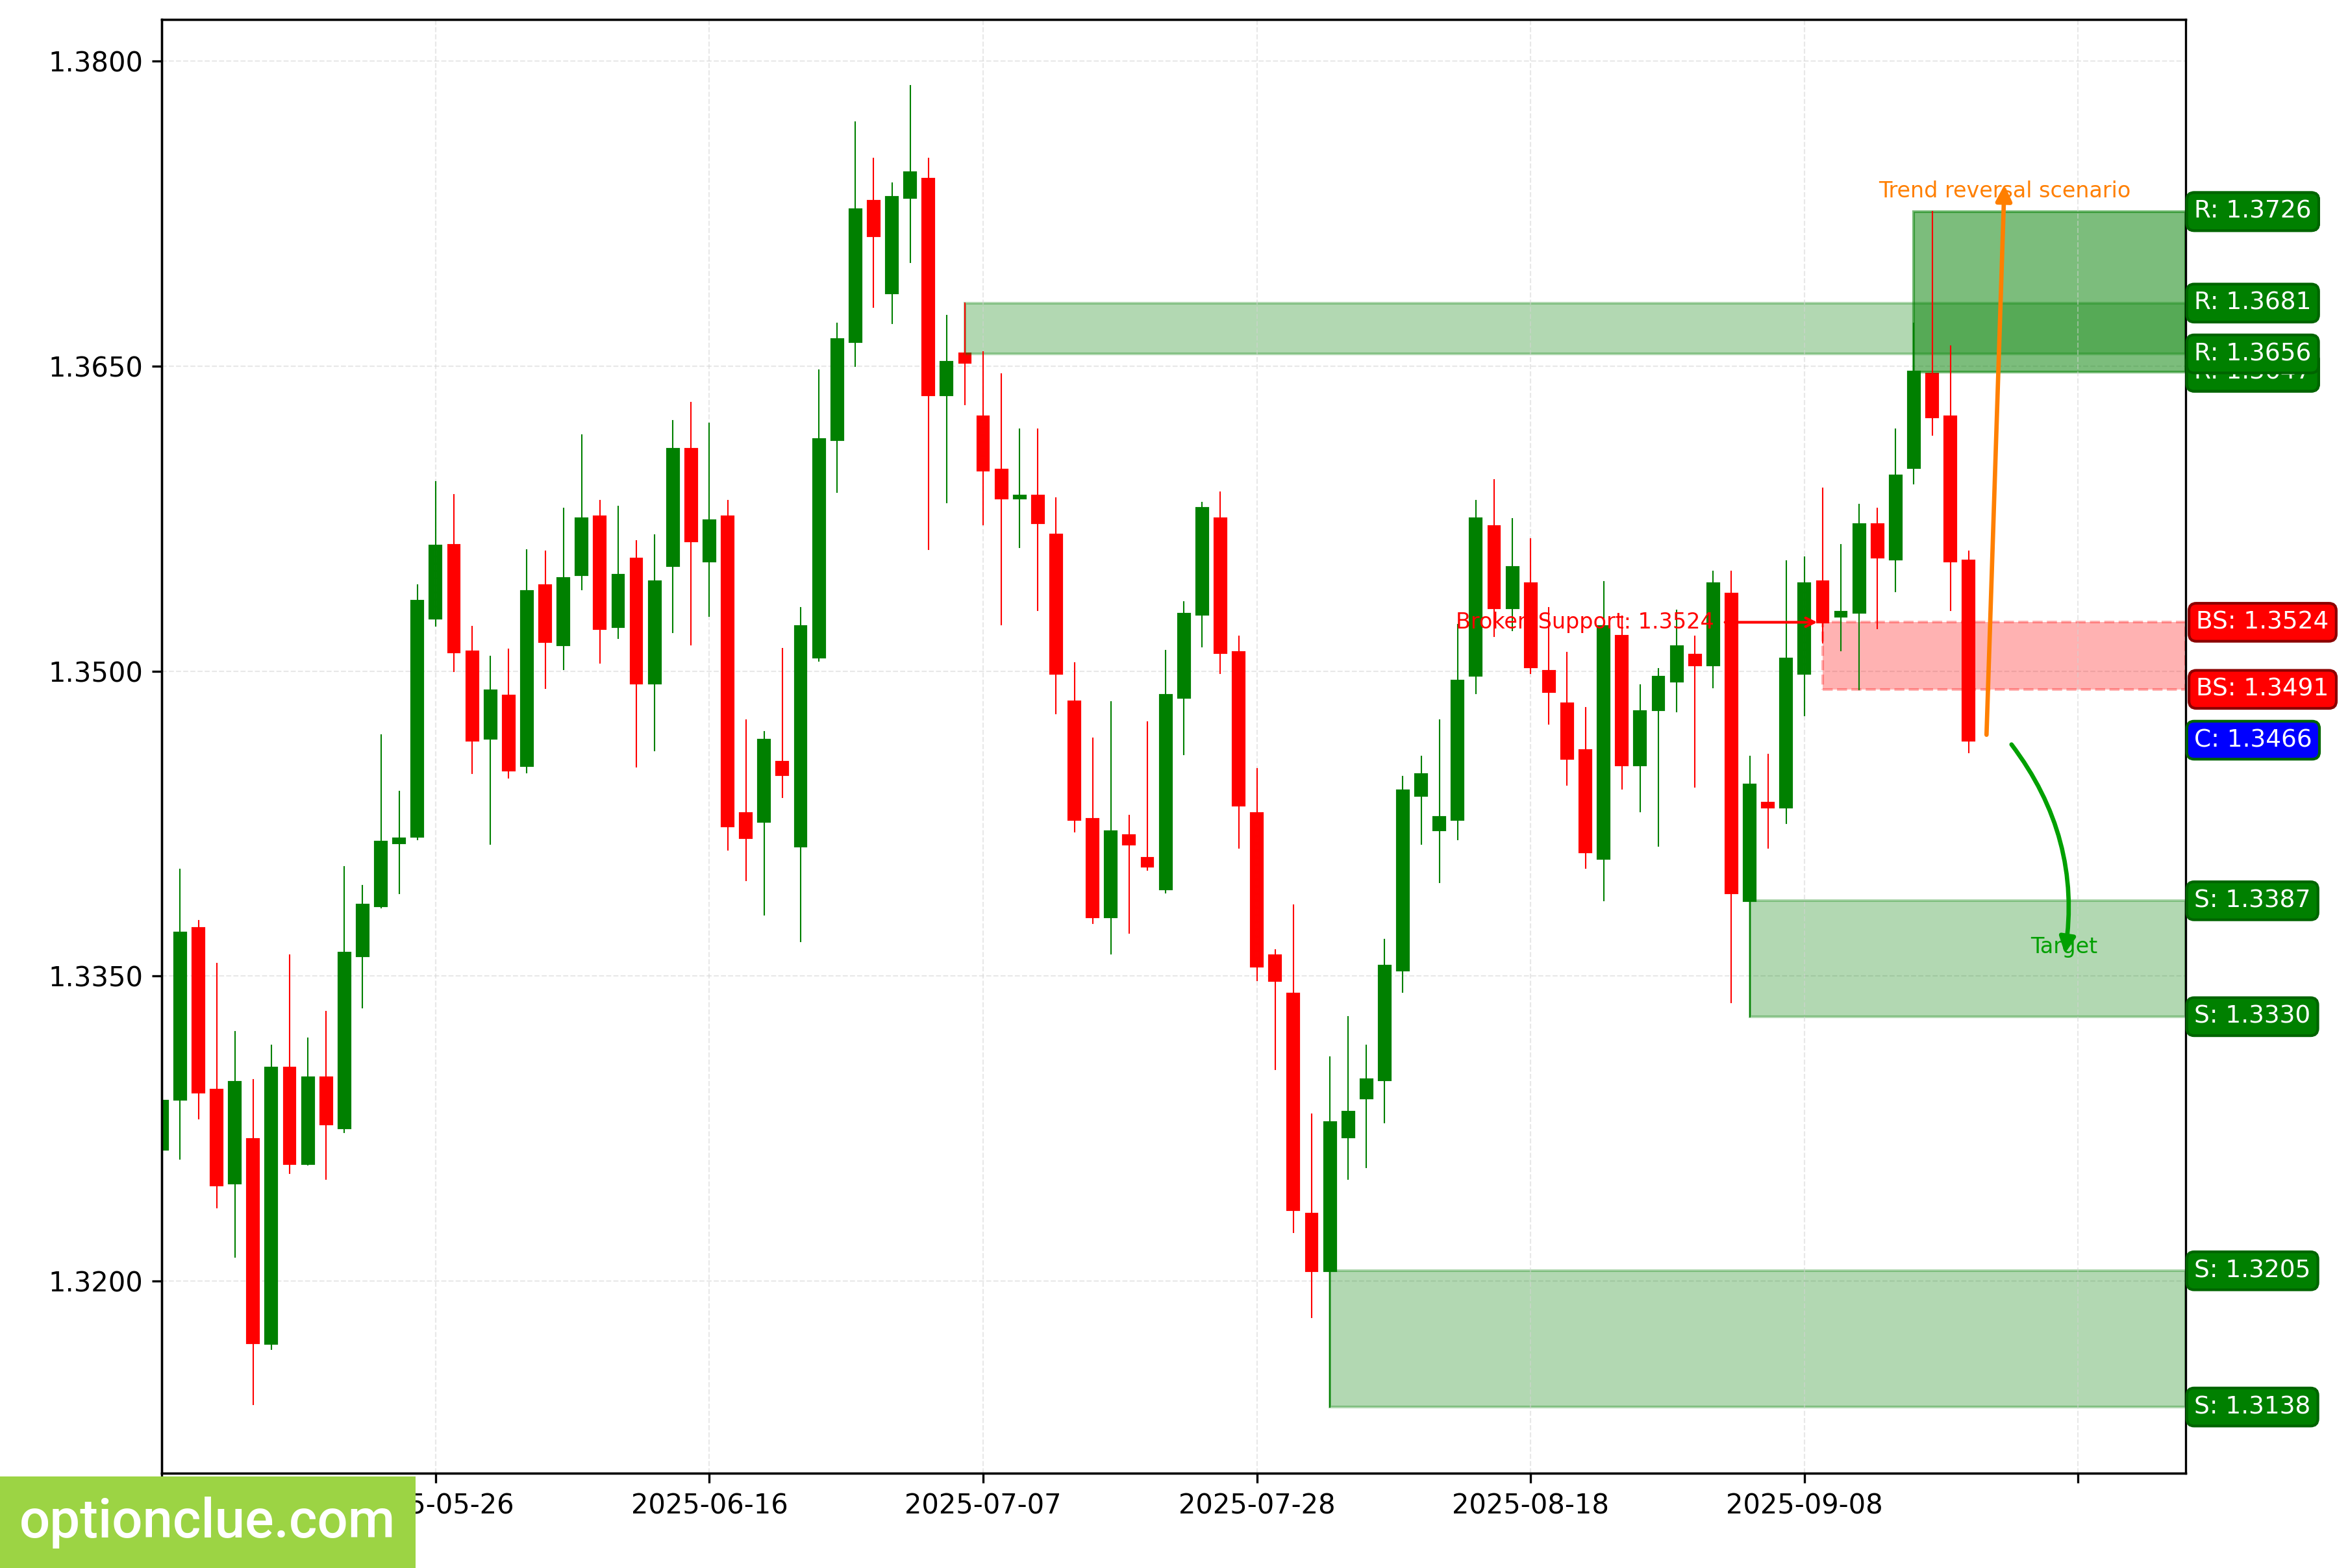
GBPUSD. Technical analysis. D1.
Swiss Franc (USDCHF)
The bearish trend continues, and another correction is forming on the daily timeframe.
A short entry point on a rebound will appear after its completion. The last broken level was support (0.7912 — 0.7929).
The breakout occurred 4 days ago. The first target will be the support level with boundaries at 0.7827 — 0.7855.
Short positions will remain relevant as long as the price stays below the nearest resistance level with boundaries at 0.8053 — 0.8072.
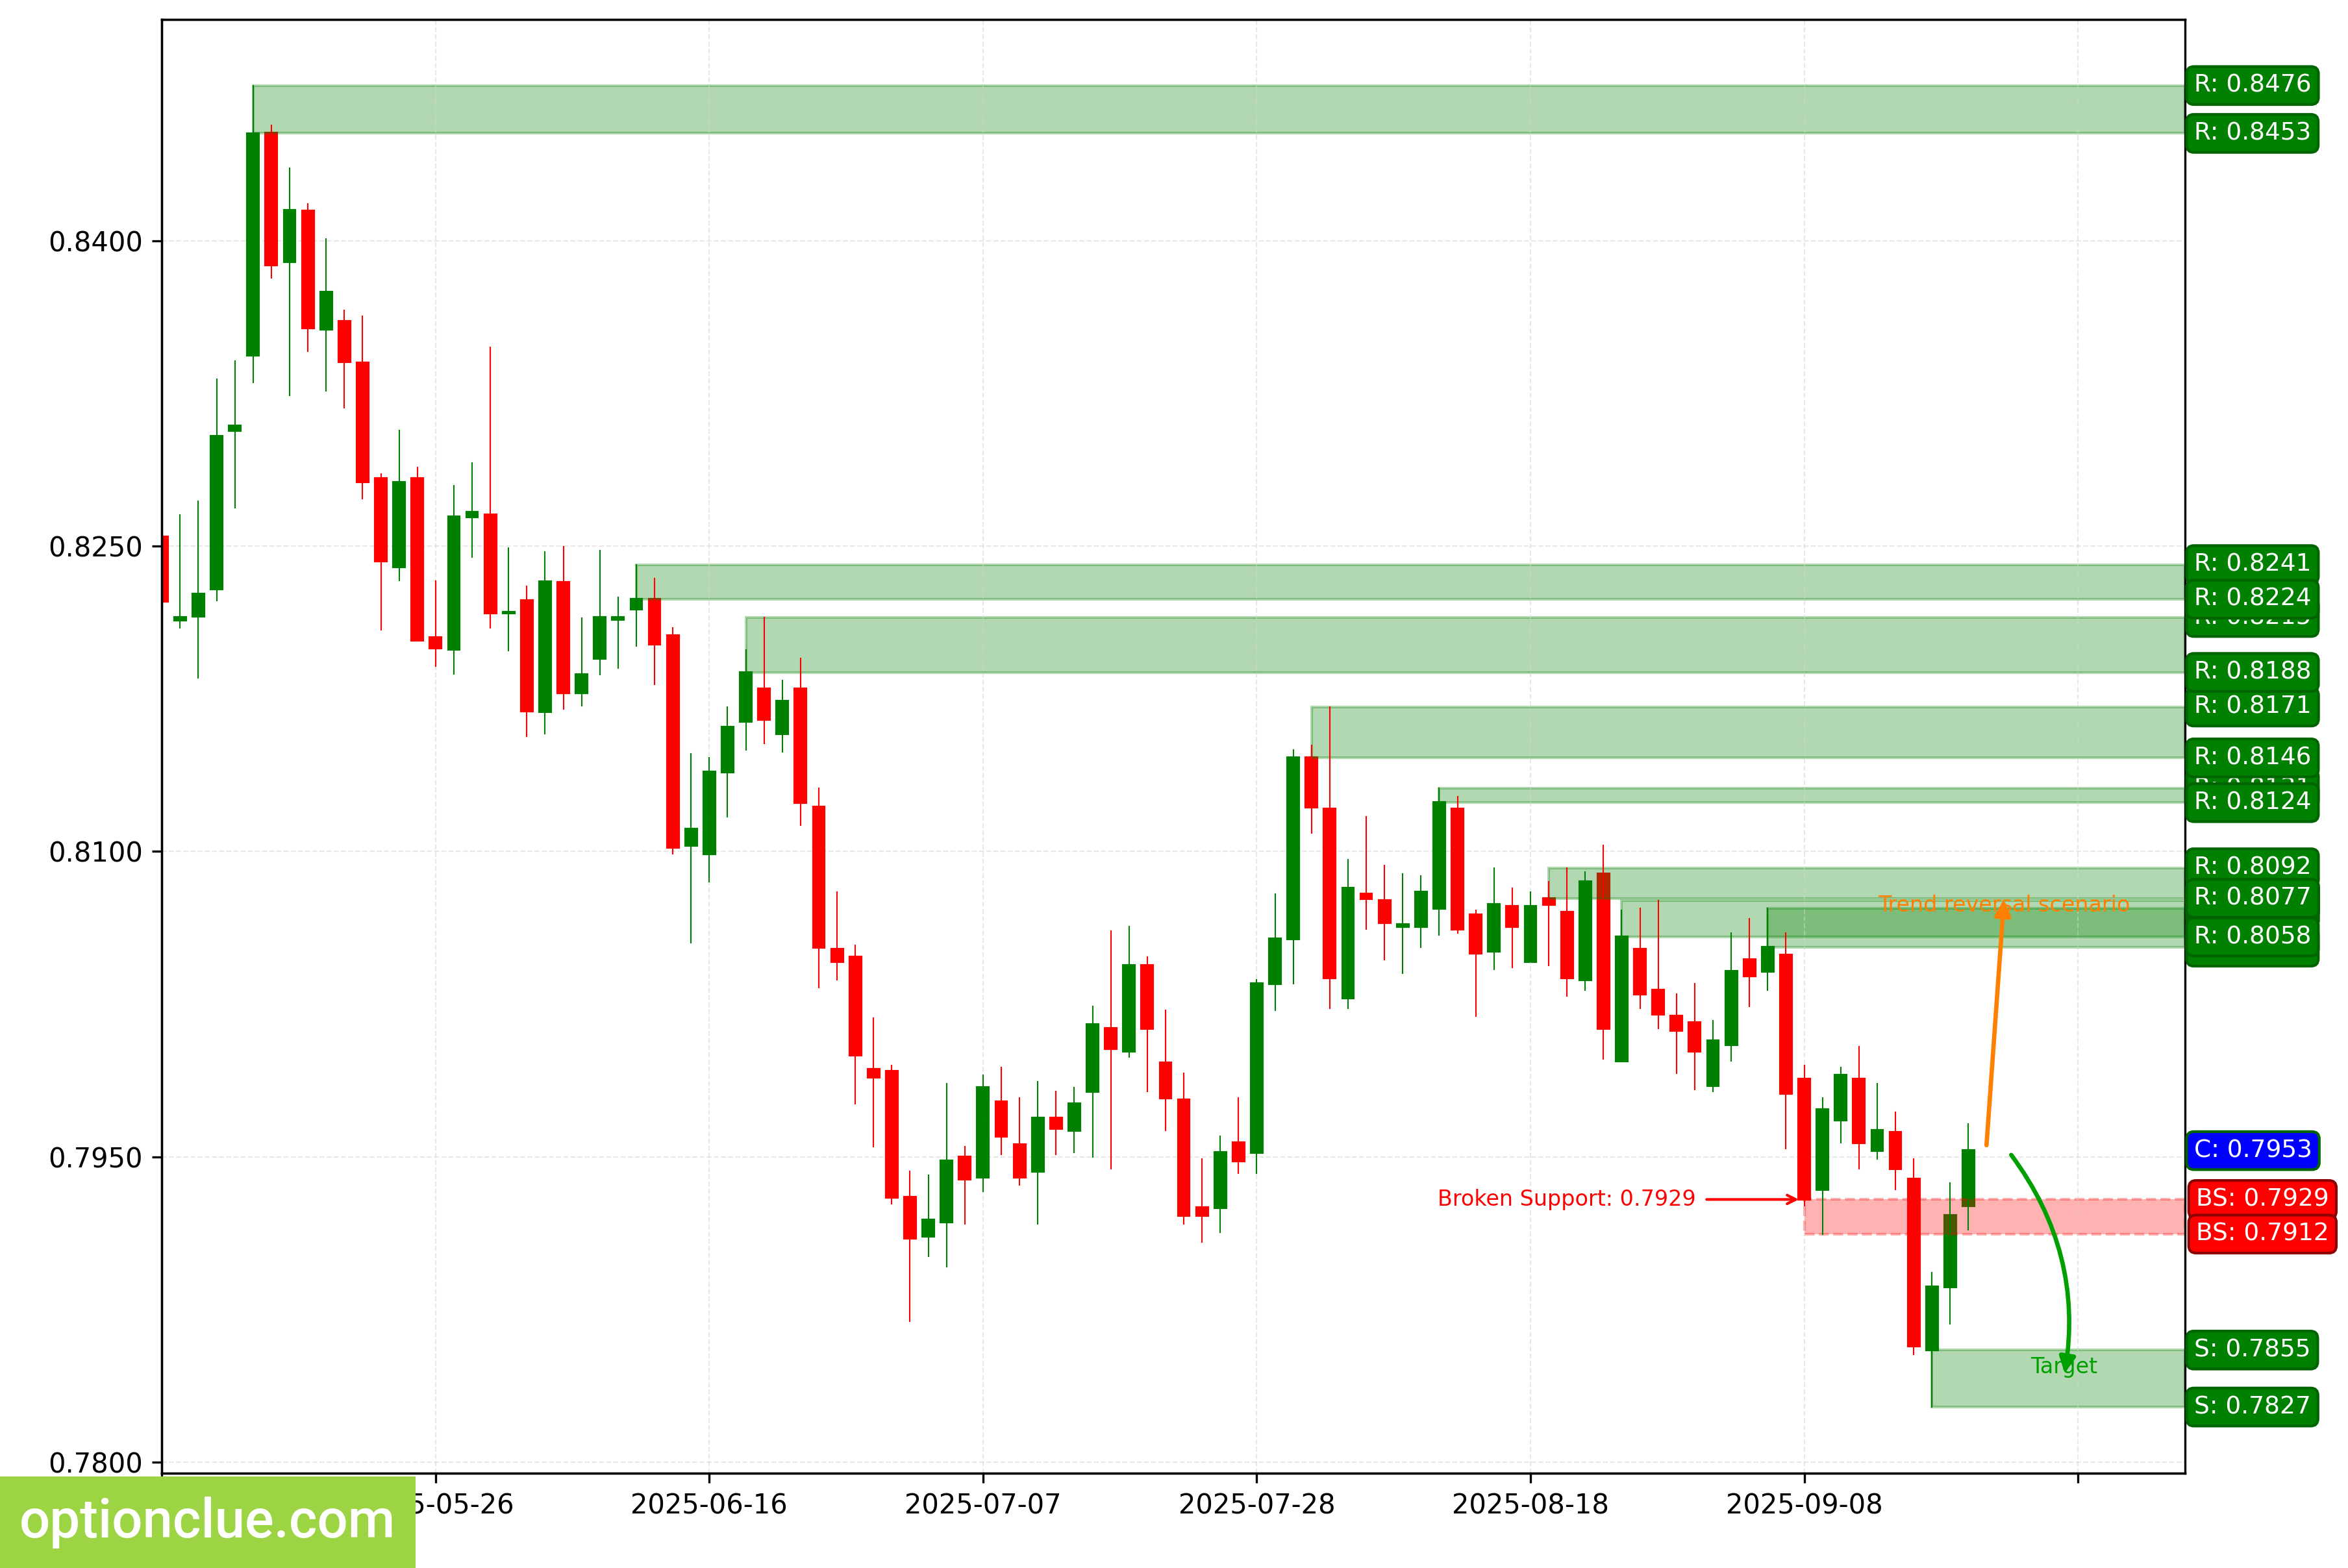
USDCHF. Technical analysis. D1.
Japanese Yen (USDJPY)
The trend has changed to bearish; the last broken level was support (146.64 — 146.92). The breakout occurred 4 days ago.
On Friday, the correction completed, and a rebound signal formed. The intermediate target for the downward move is the support level with boundaries at 145.47 — 146.48.
Short positions will remain relevant as long as the market stays below the resistance level with boundaries at 147.72 — 148.07. If the market closes firmly above it, the trend will change to bullish.
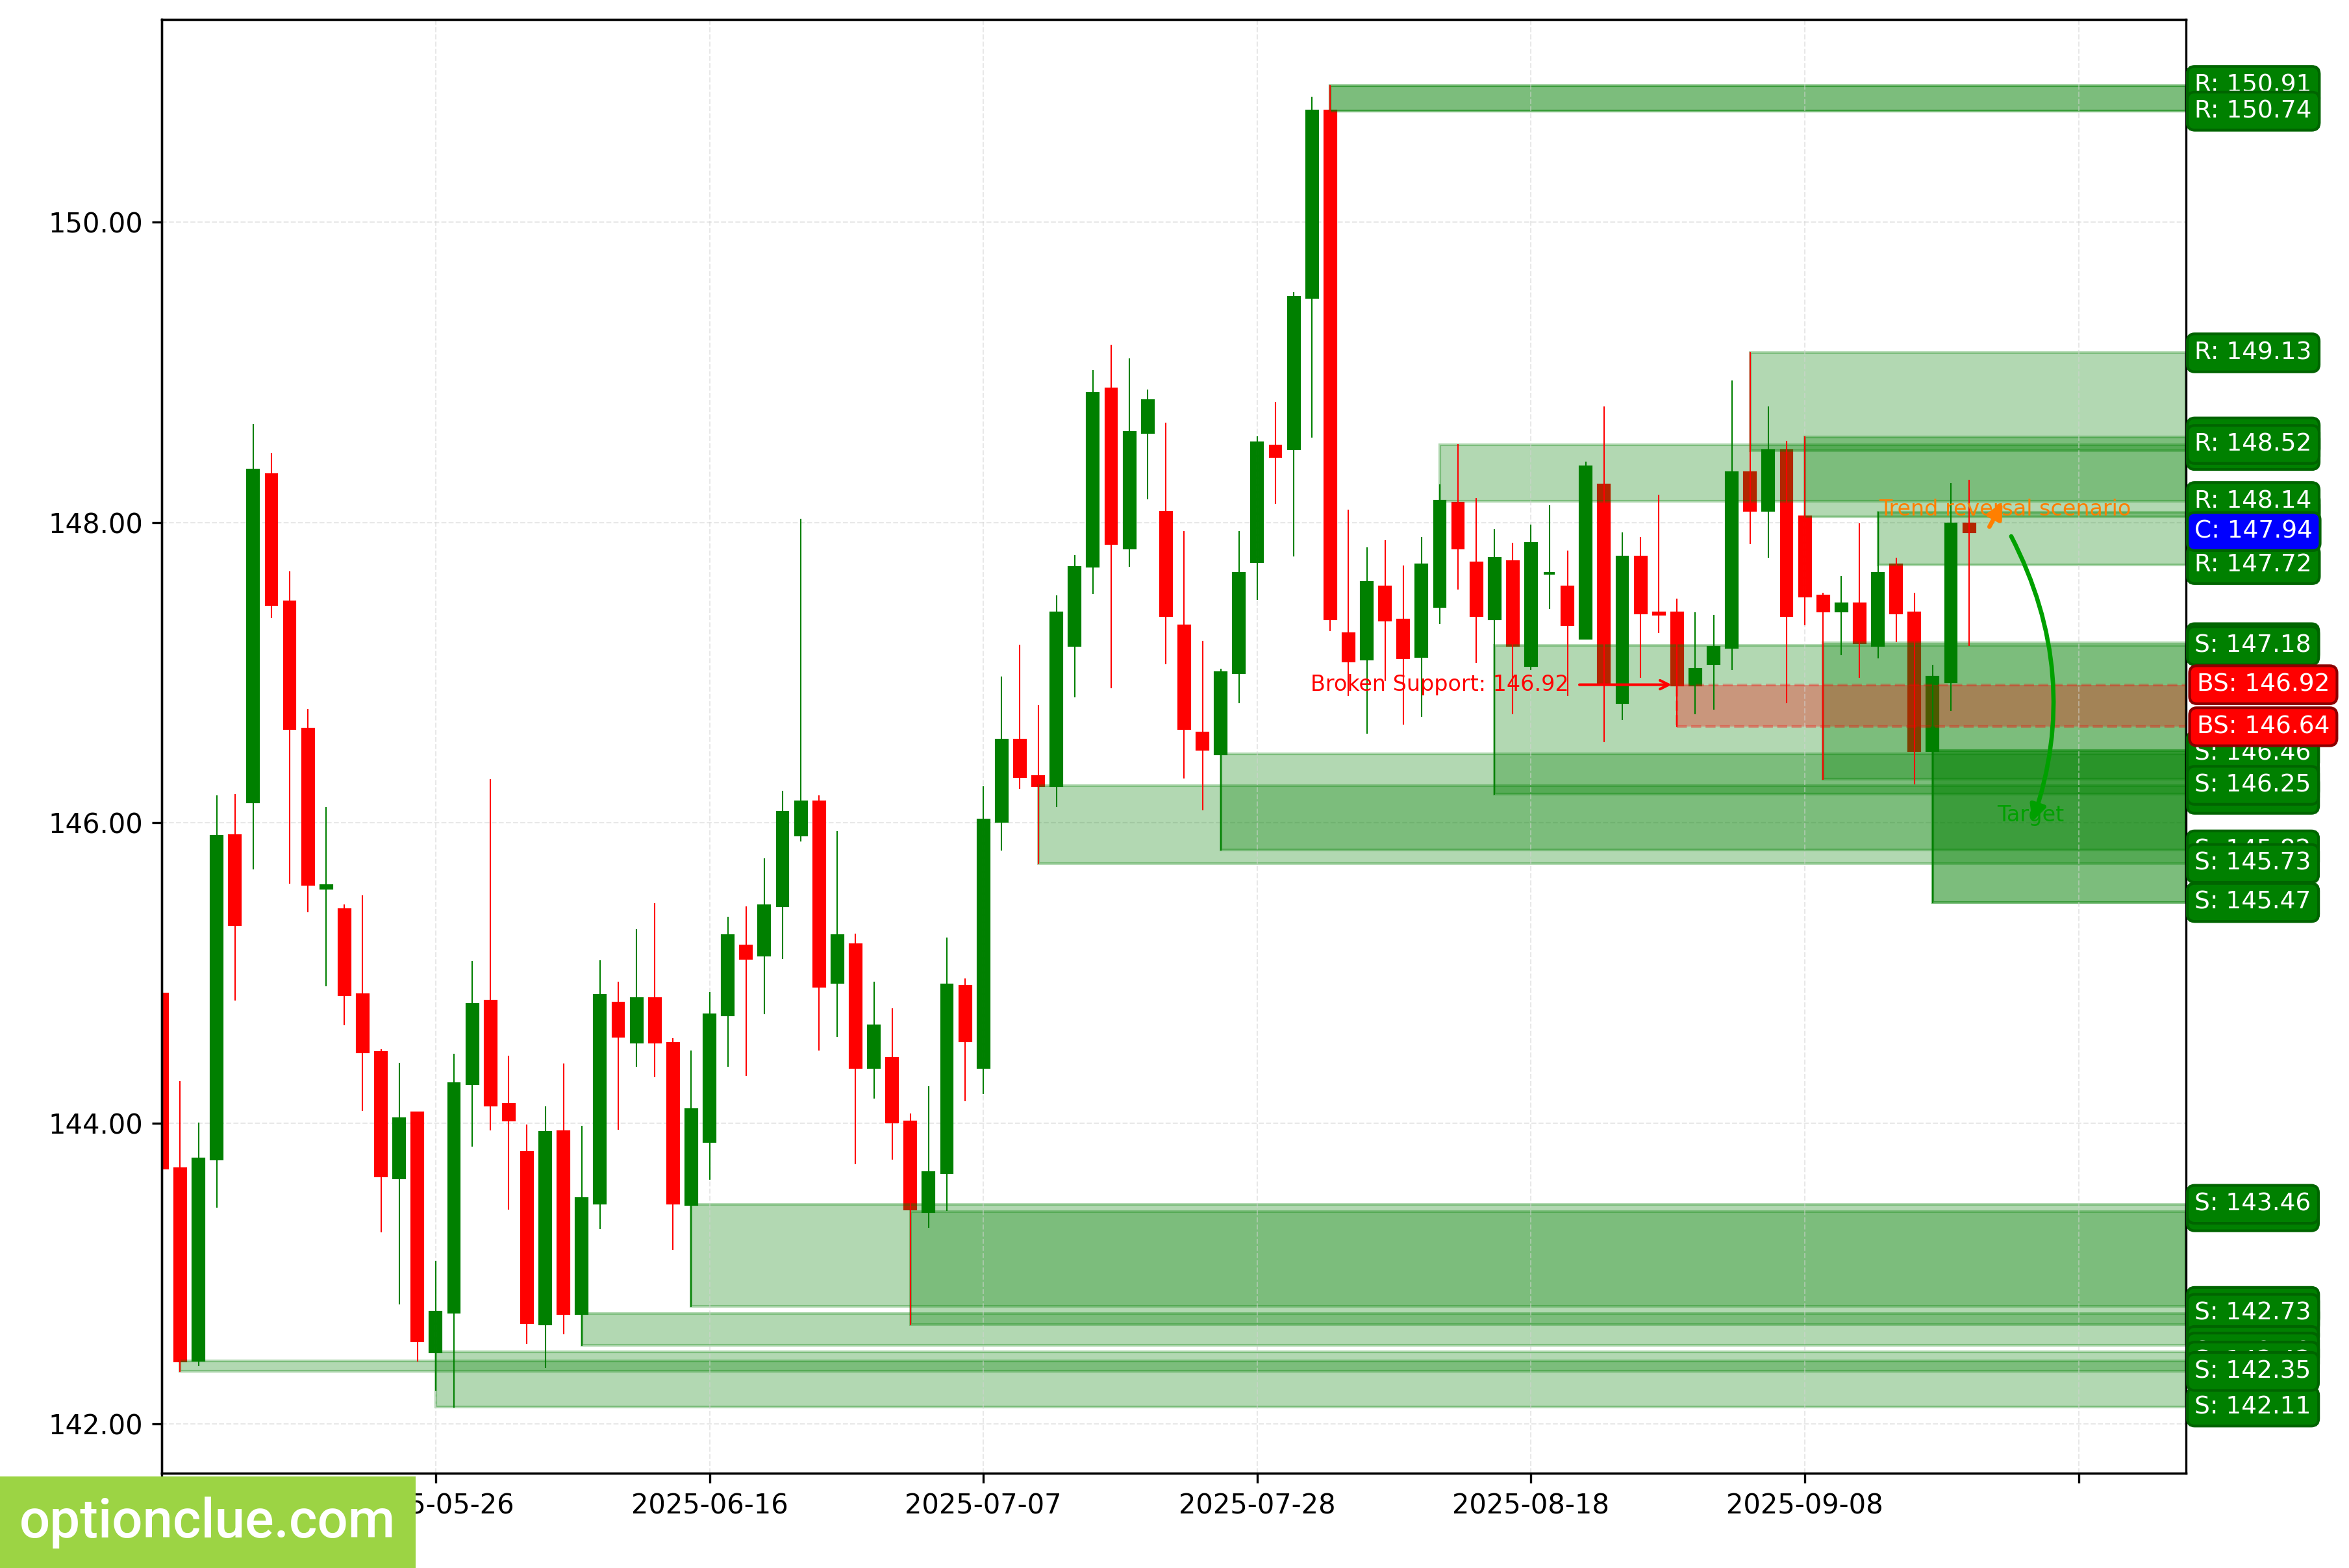
USDJPY. Technical analysis. D1.
Canadian Dollar (USDCAD)
A triangle is forming on the daily timeframe. Trading inside such a formation on the Daily chart is risky. The situation will become clearer after a breakout of the nearest support or resistance.
The intermediate target for the current downward move is the support level with boundaries at 1.3723 — 1.3738. If the market successfully holds below this support, it will open the way for the price to move to target #2 — the support level with boundaries at 1.3724 — 1.3737.
Short positions will remain relevant as long as the market stays below the resistance level with boundaries at 1.3859 — 1.3868.
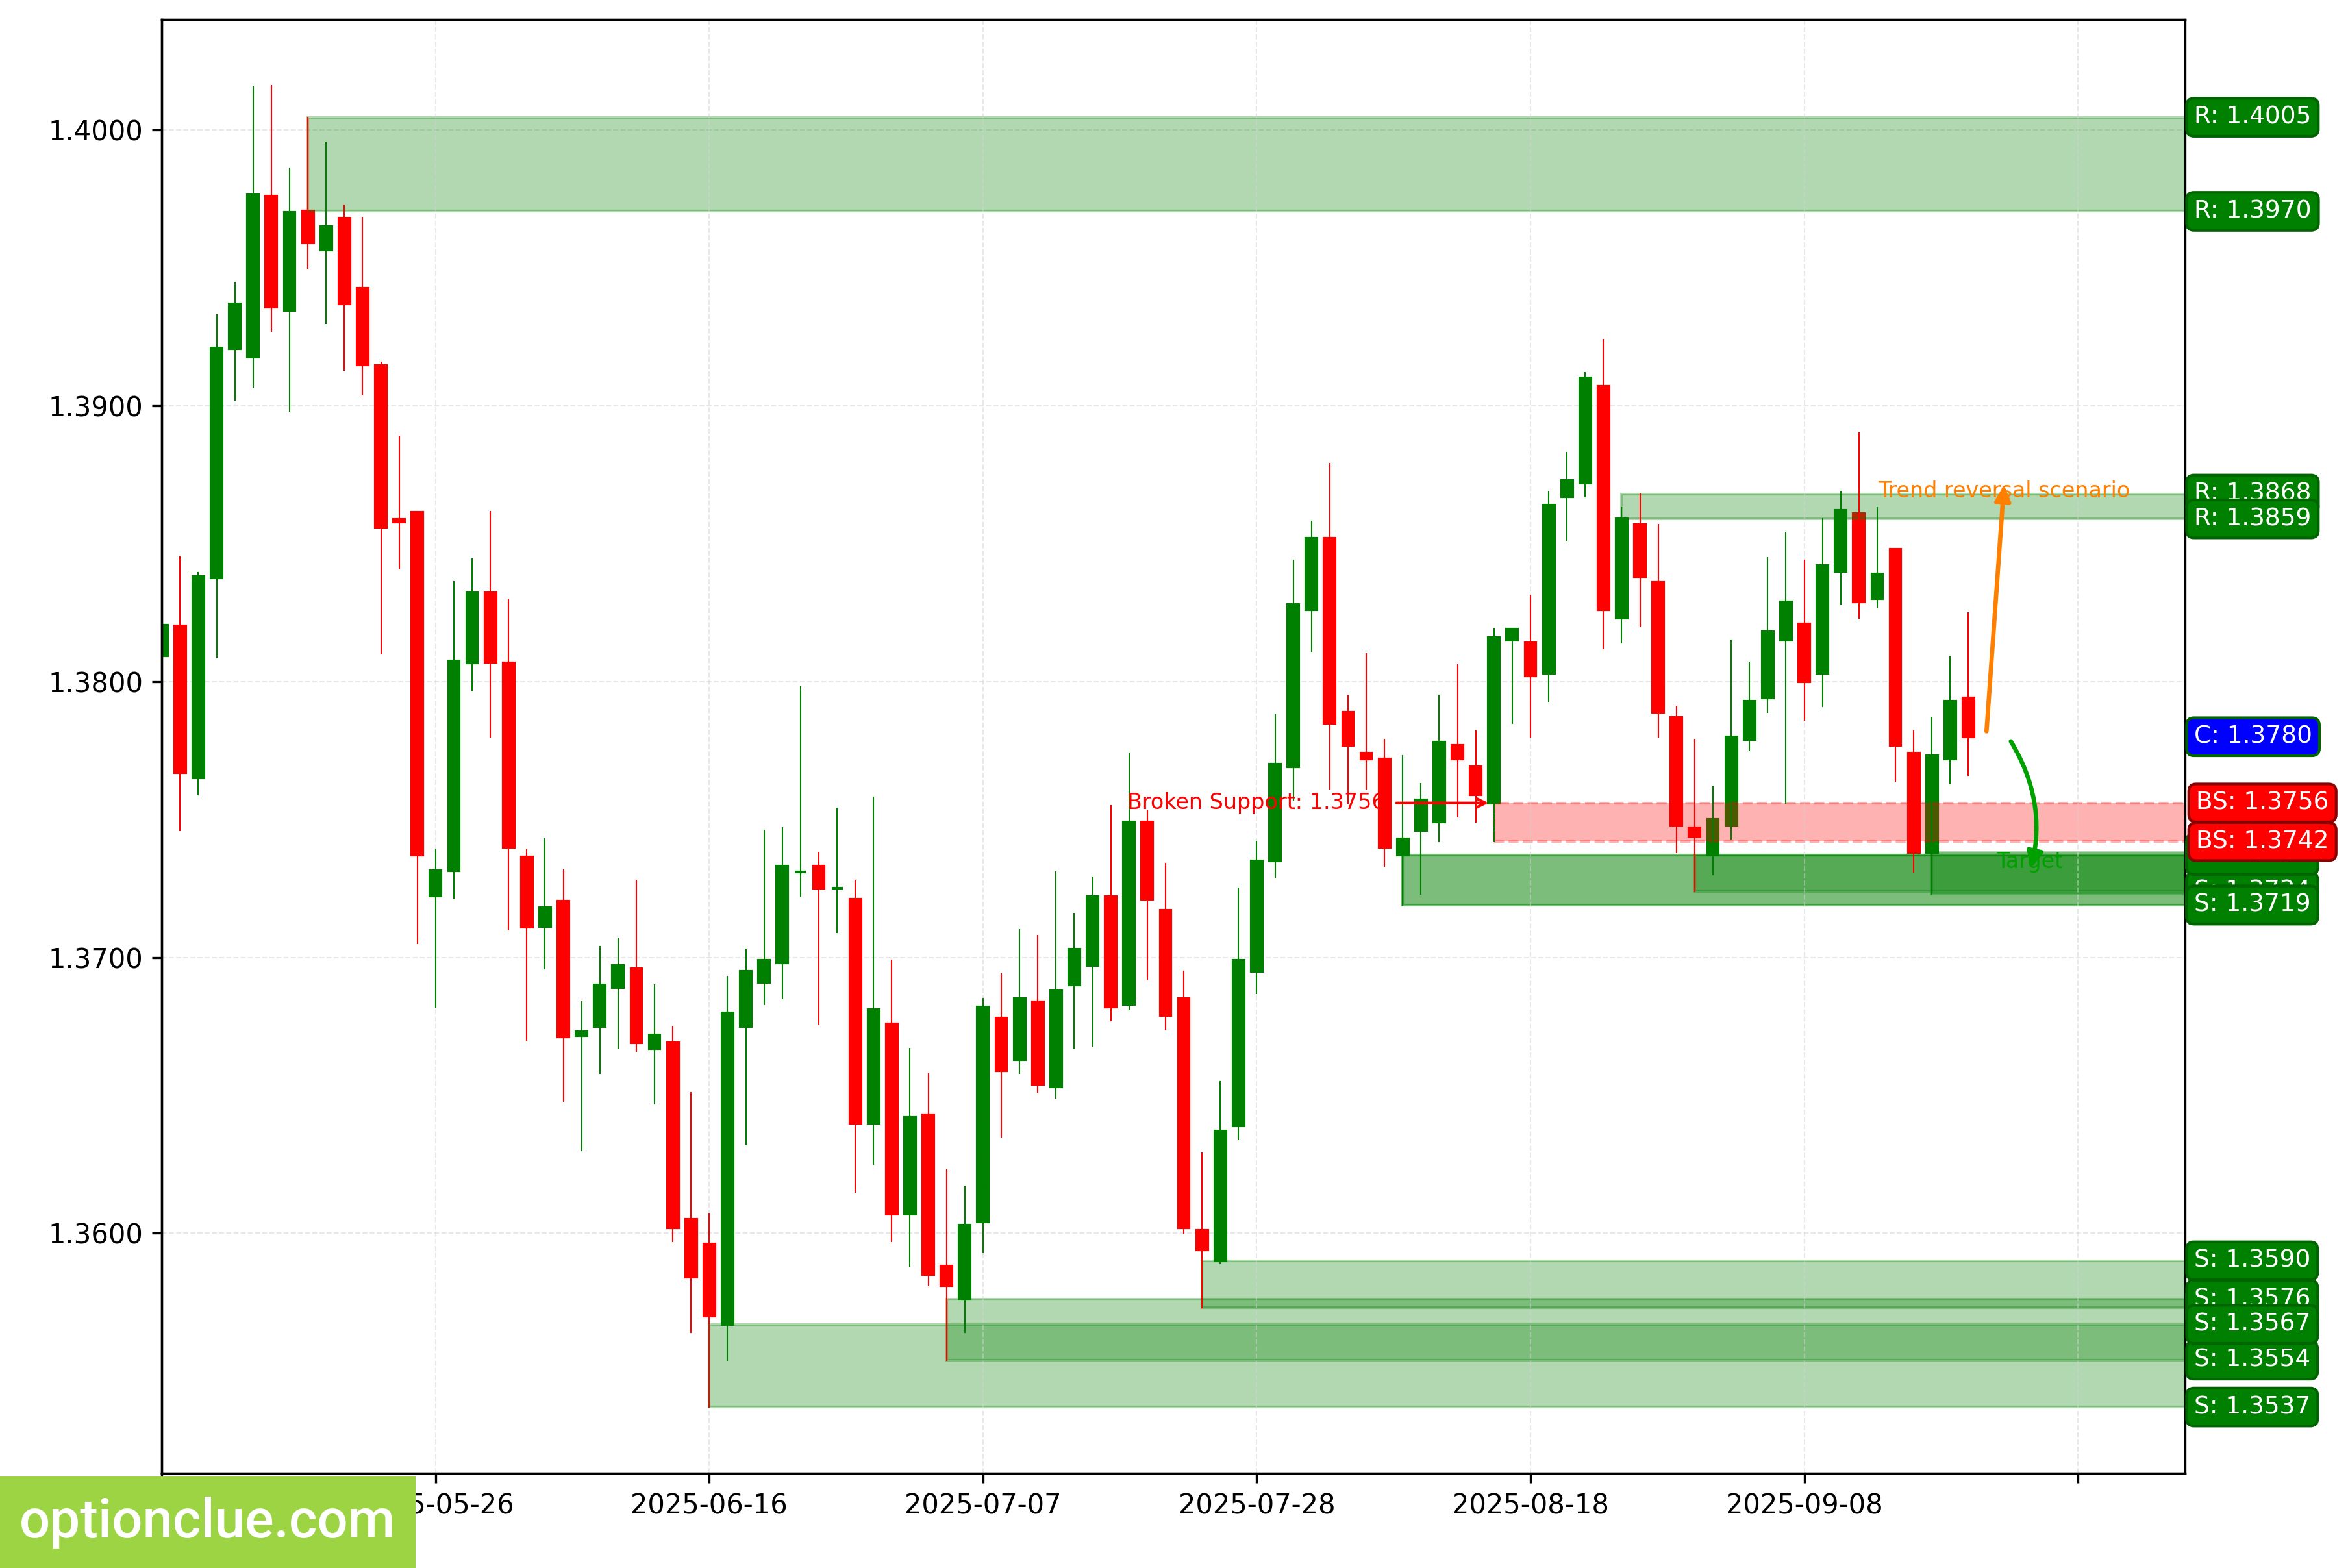
USDCAD. Technical analysis. D1.
Australian Dollar (AUDUSD)
The trend remains bullish, and a correction is developing. A long entry point on a rebound will appear after its completion.
The intermediate target for the upward move is the resistance level with boundaries at 0.6684 — 0.6706. If the market successfully holds above this resistance, it will open the way for the price to move to target #2 — the resistance level with boundaries at 0.6750 — 0.6759.
Long positions will remain relevant as long as the market stays above the nearest daily timeframe support level with boundaries at 0.6481 — 0.6515.
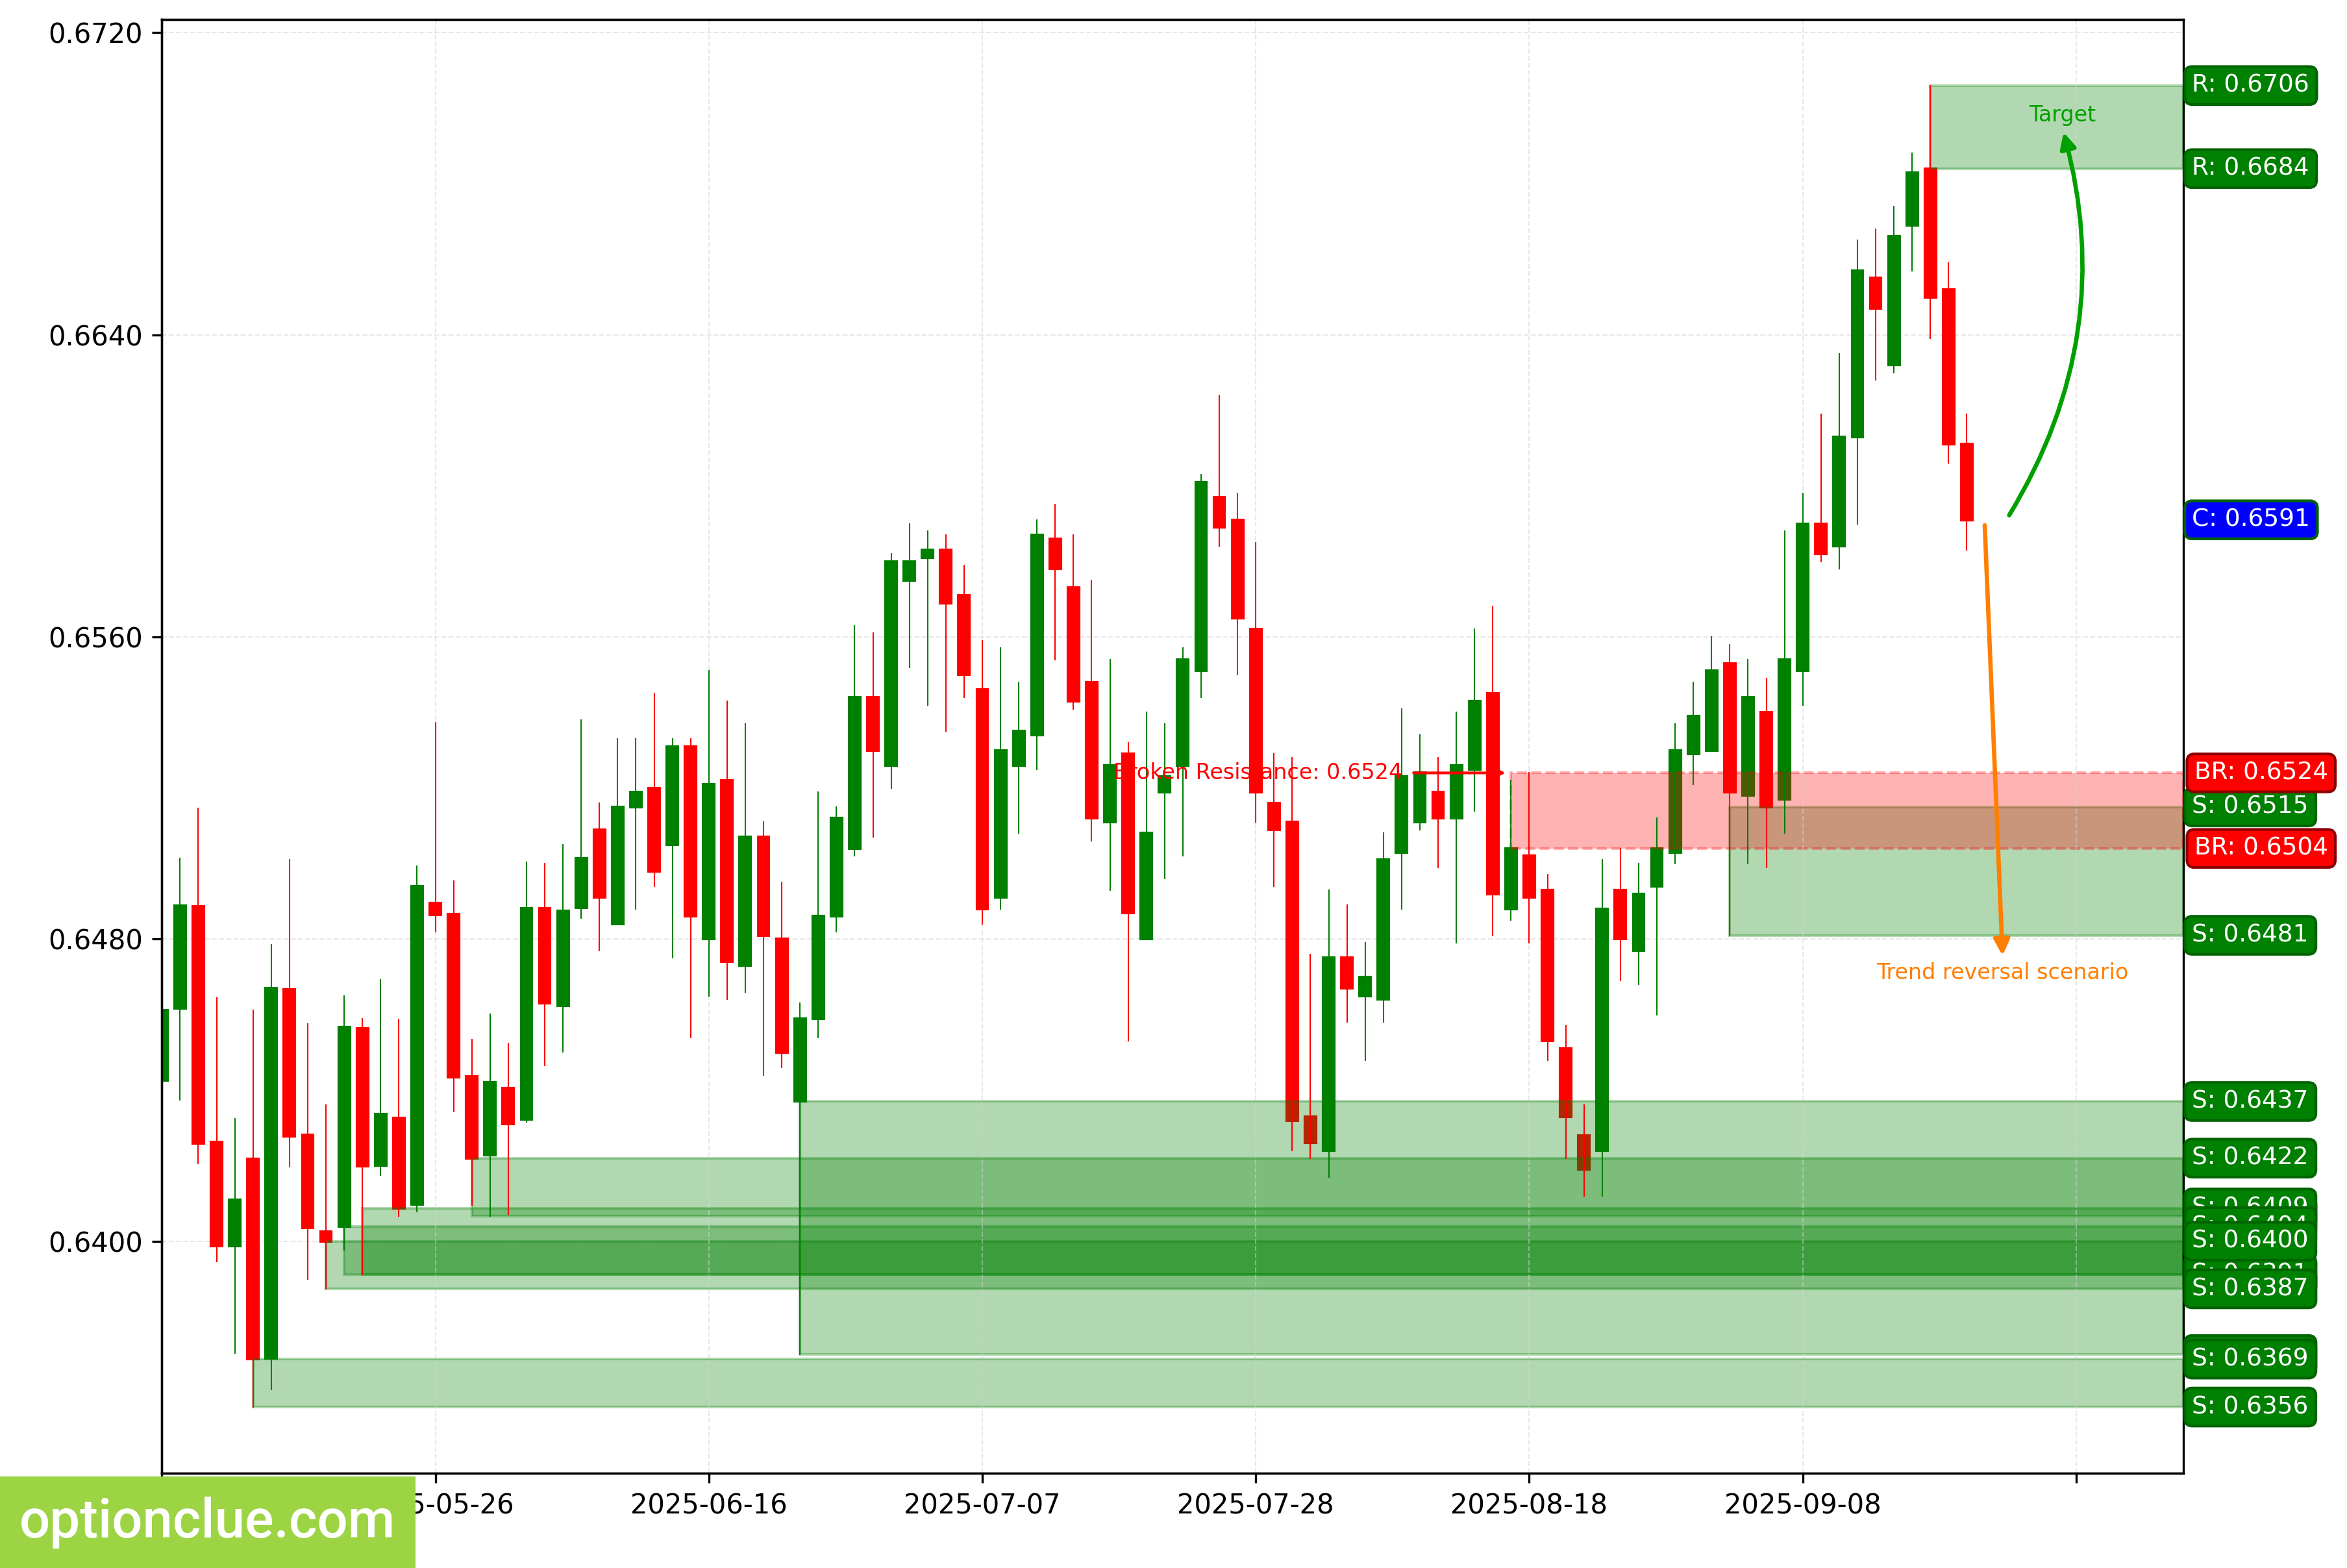
AUDUSD. Technical analysis. D1.
New Zealand Dollar (NZDUSD)
The market remains in a bullish trend, and a correction is developing. A long entry point on a rebound will appear after its completion.
The intermediate target for the upward move is the resistance level with boundaries at 0.5987 — 0.6007. If the market successfully
holds above this resistance, it will open the way for the price to move to target #2 — the resistance level with boundaries at 0.5976 — 0.5995.
Long positions will remain relevant as long as the market stays above the support level 0.5831 — 0.5845.
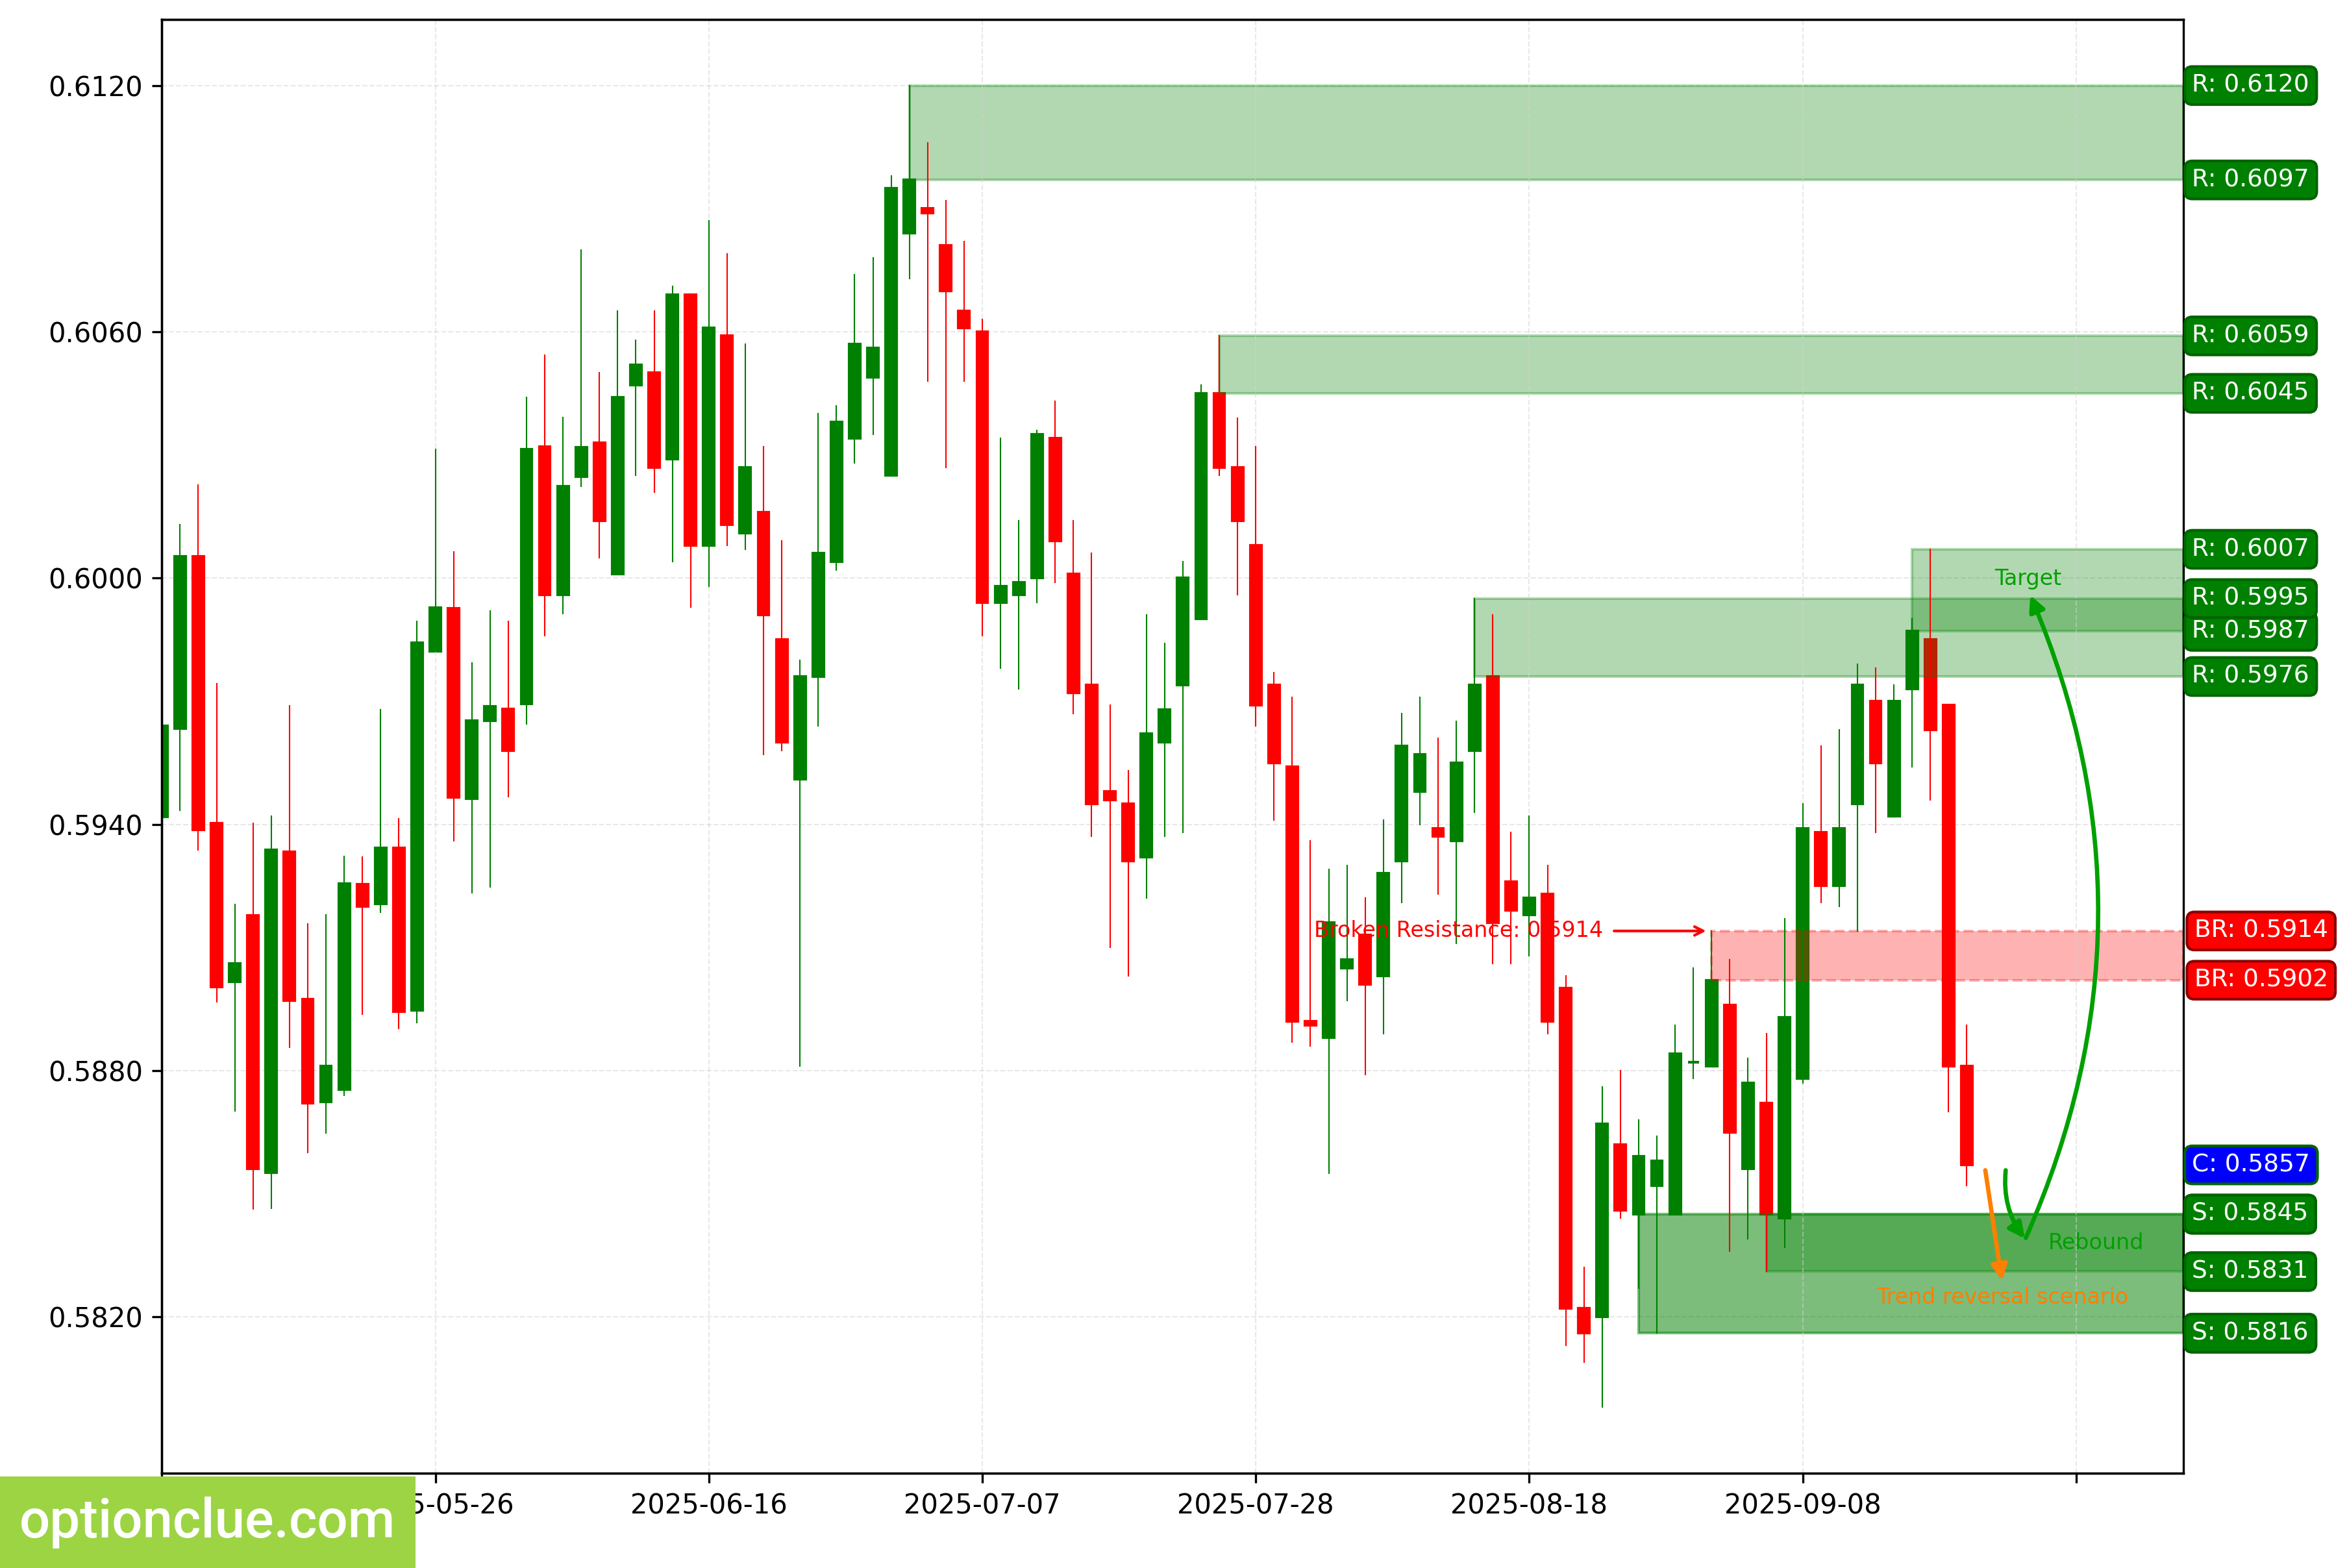
NZDUSD. Technical analysis. D1.
Bitcoin (BTC)
The market on the daily timeframe remains in a bullish trend, and a corrective wave is developing. A long entry point on a rebound will appear after the correction is complete.
If the upward move resumes, the first target will be the resistance level with boundaries at 117118 — 117998. If the trend develops successfully, a further target will be at the resistance level with boundaries at 117417 — 118642.
Buy signals will remain relevant as long as the market stays above the nearest support level with boundaries at 114396 — 115314.
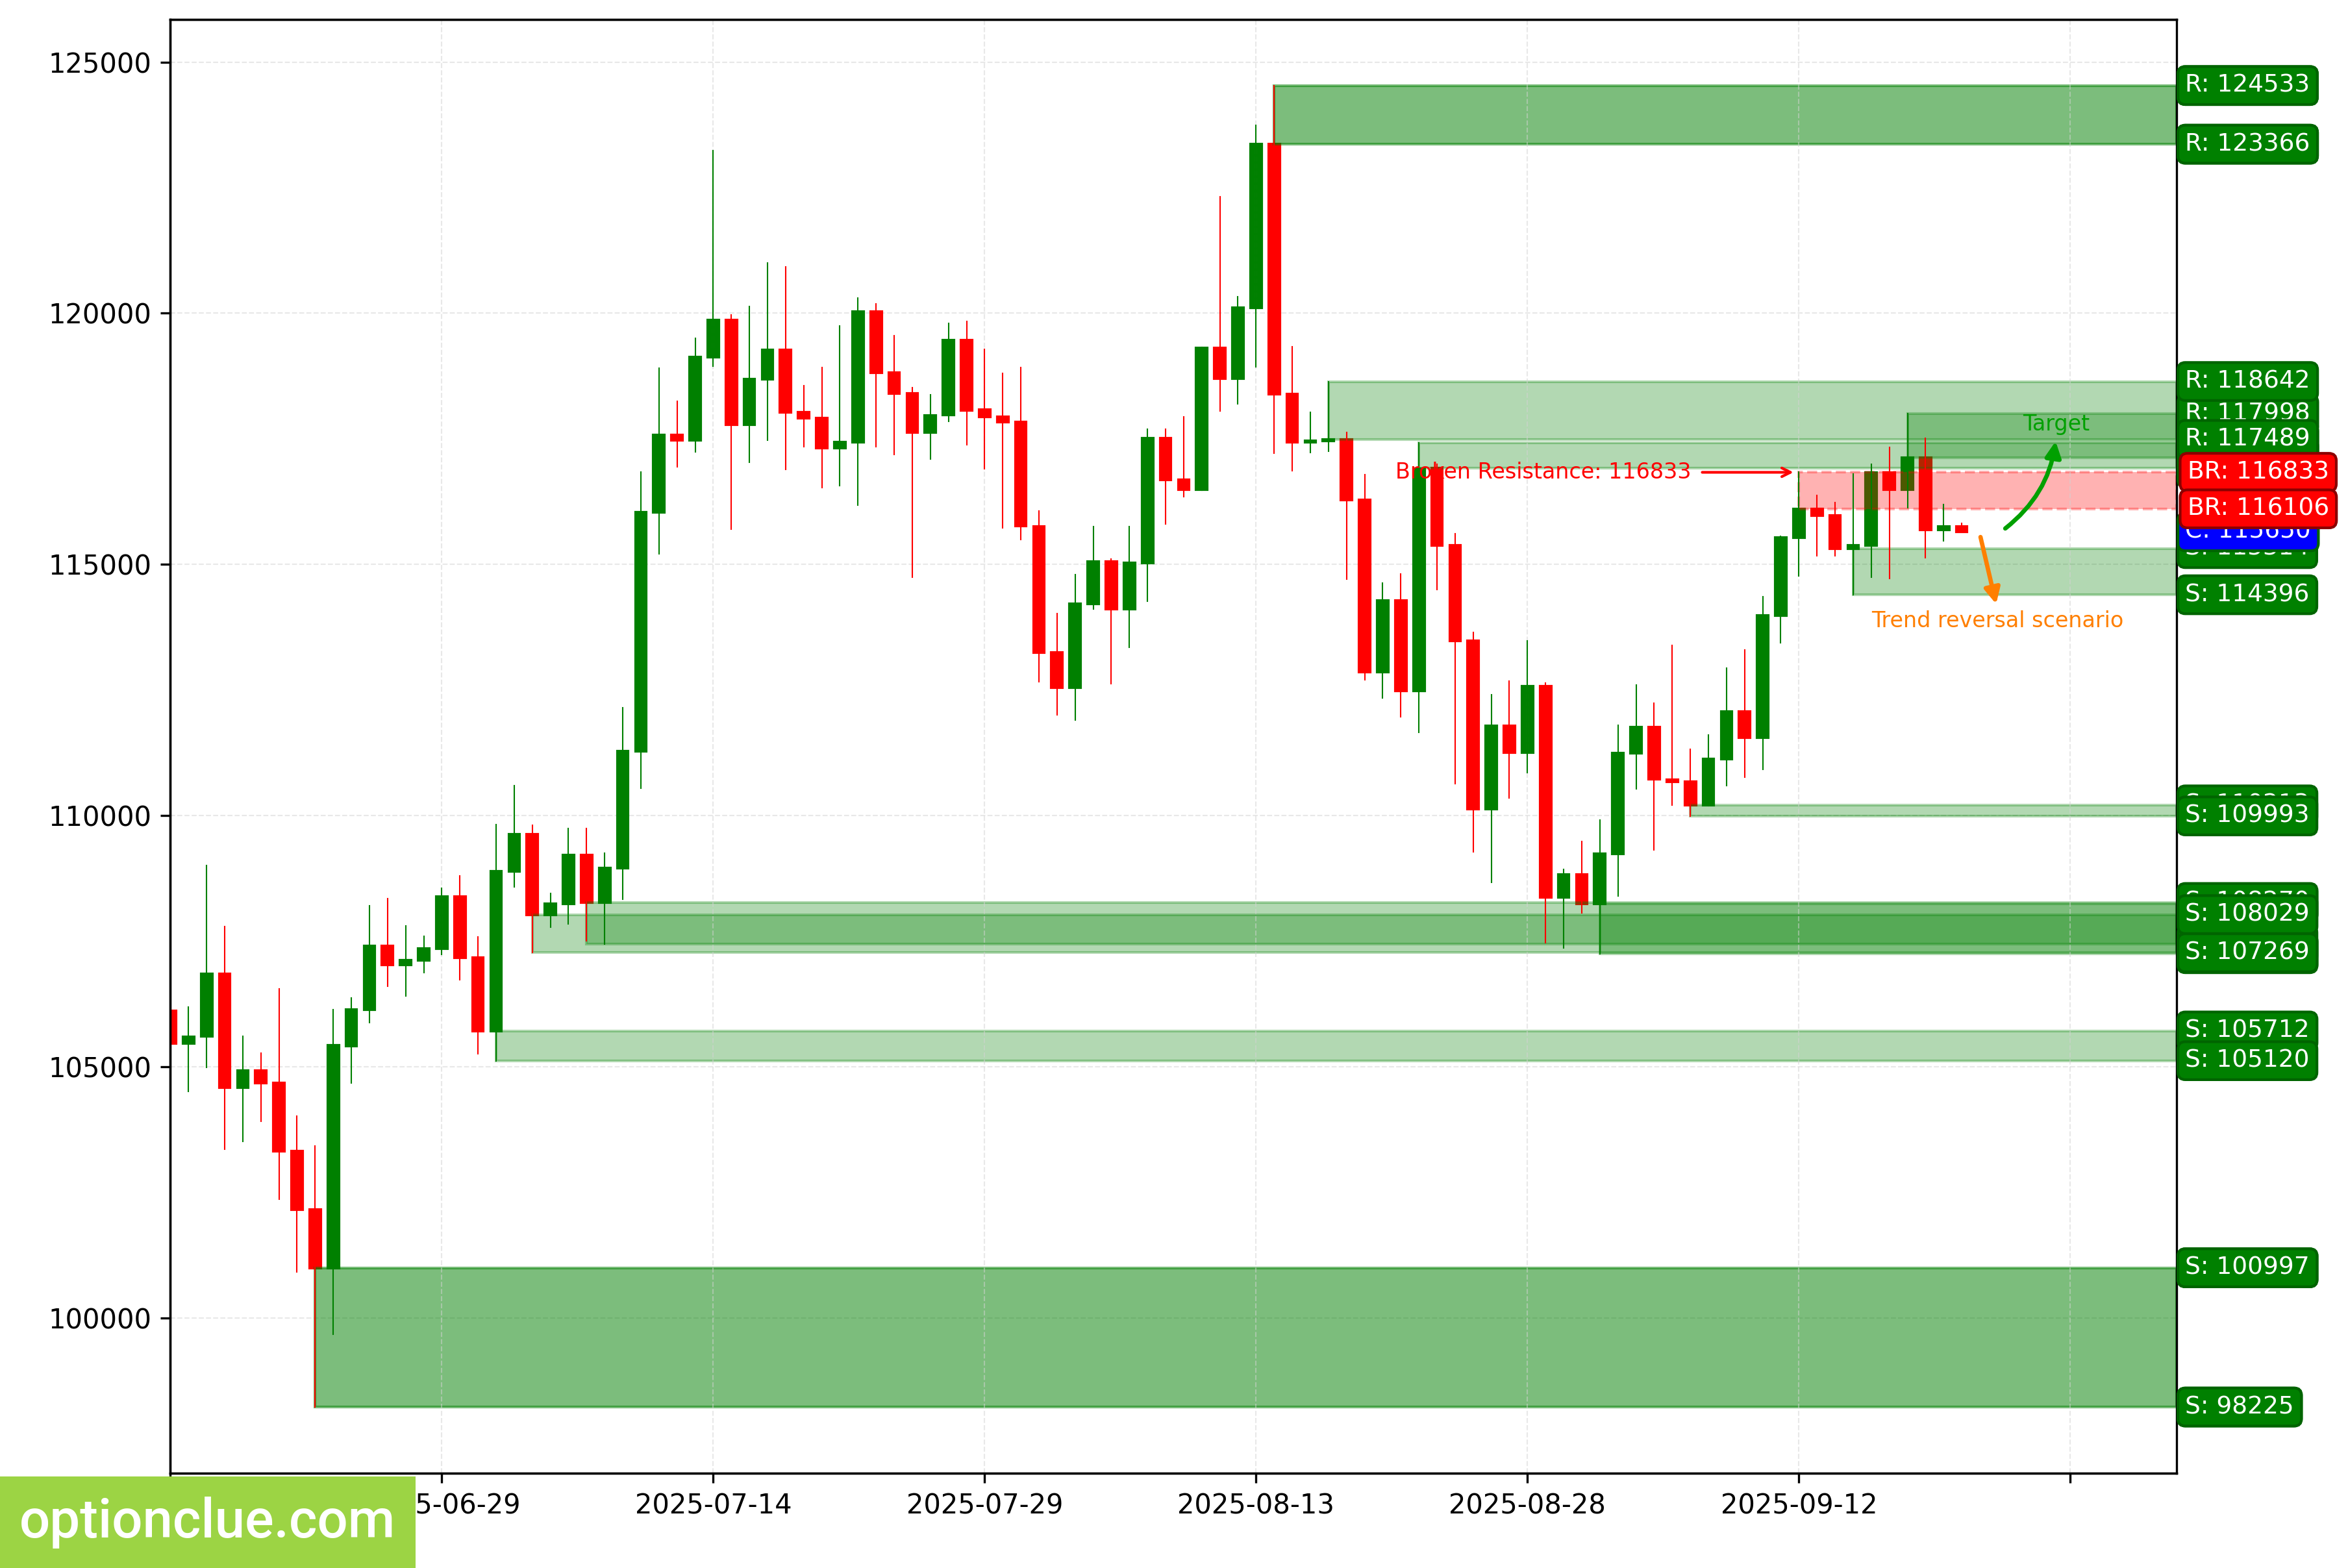
BTC. Technical analysis. D1.
Ether (ETH)
A triangle is forming on the daily timeframe. Trading inside such a formation on the Daily chart is risky.
The situation will become clearer after a breakout of the nearest support or resistance. The intermediate target for the upward move is the resistance level with boundaries at 4592 — 4647.
If the market successfully holds above this resistance, it will open the way for the price to move to target #2 — the resistance
level with boundaries at 4715 — 4769. Long positions will remain relevant as long as the market stays above the nearest daily timeframe support level with boundaries at 4237 — 4274.
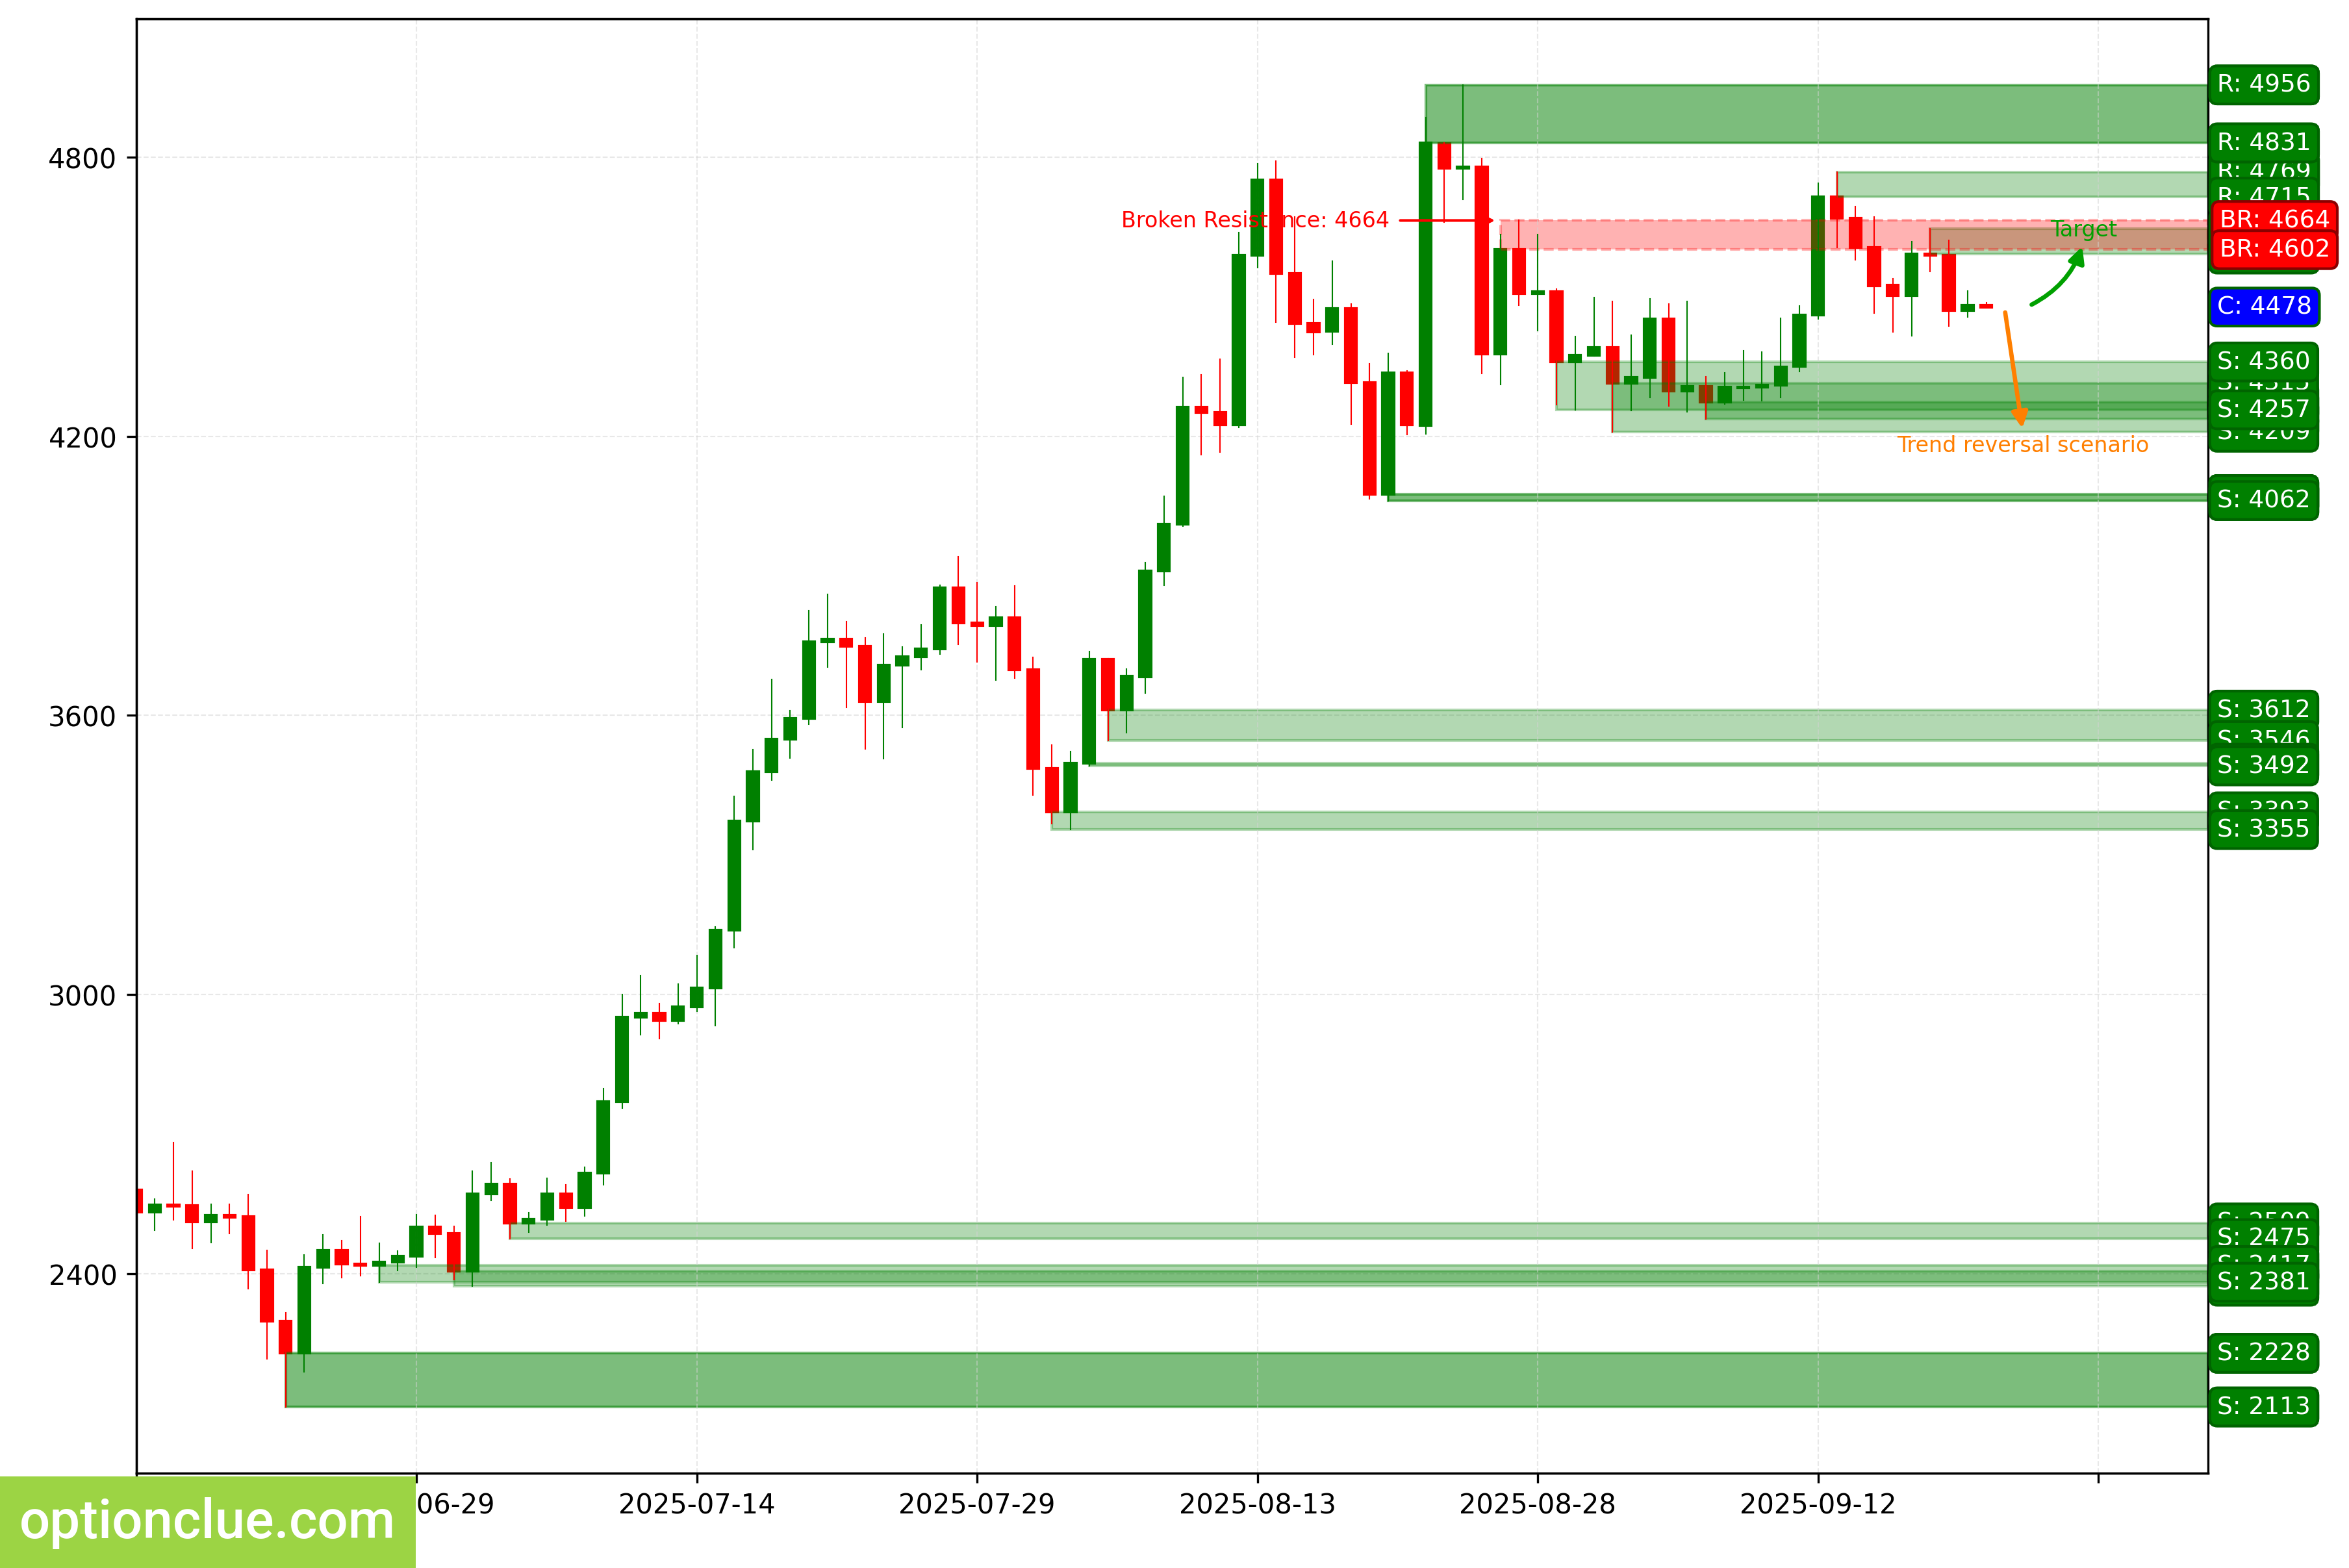
ETH. Technical analysis. D1.
Apple Inc (AAPL)
The market remains in a bullish trend, and another impulse wave is developing.
A long entry point on a rebound will appear after a correction forms on the daily timeframe. If the upward move resumes, the first target will be the resistance level with boundaries at 248.00 — 250.00.
If the trend develops successfully, a further target will be at the resistance level with boundaries at 259.02 — 260.10. Buy signals will remain relevant as long as the market stays above the nearest daily timeframe support level with boundaries at 225.95 — 226.79.
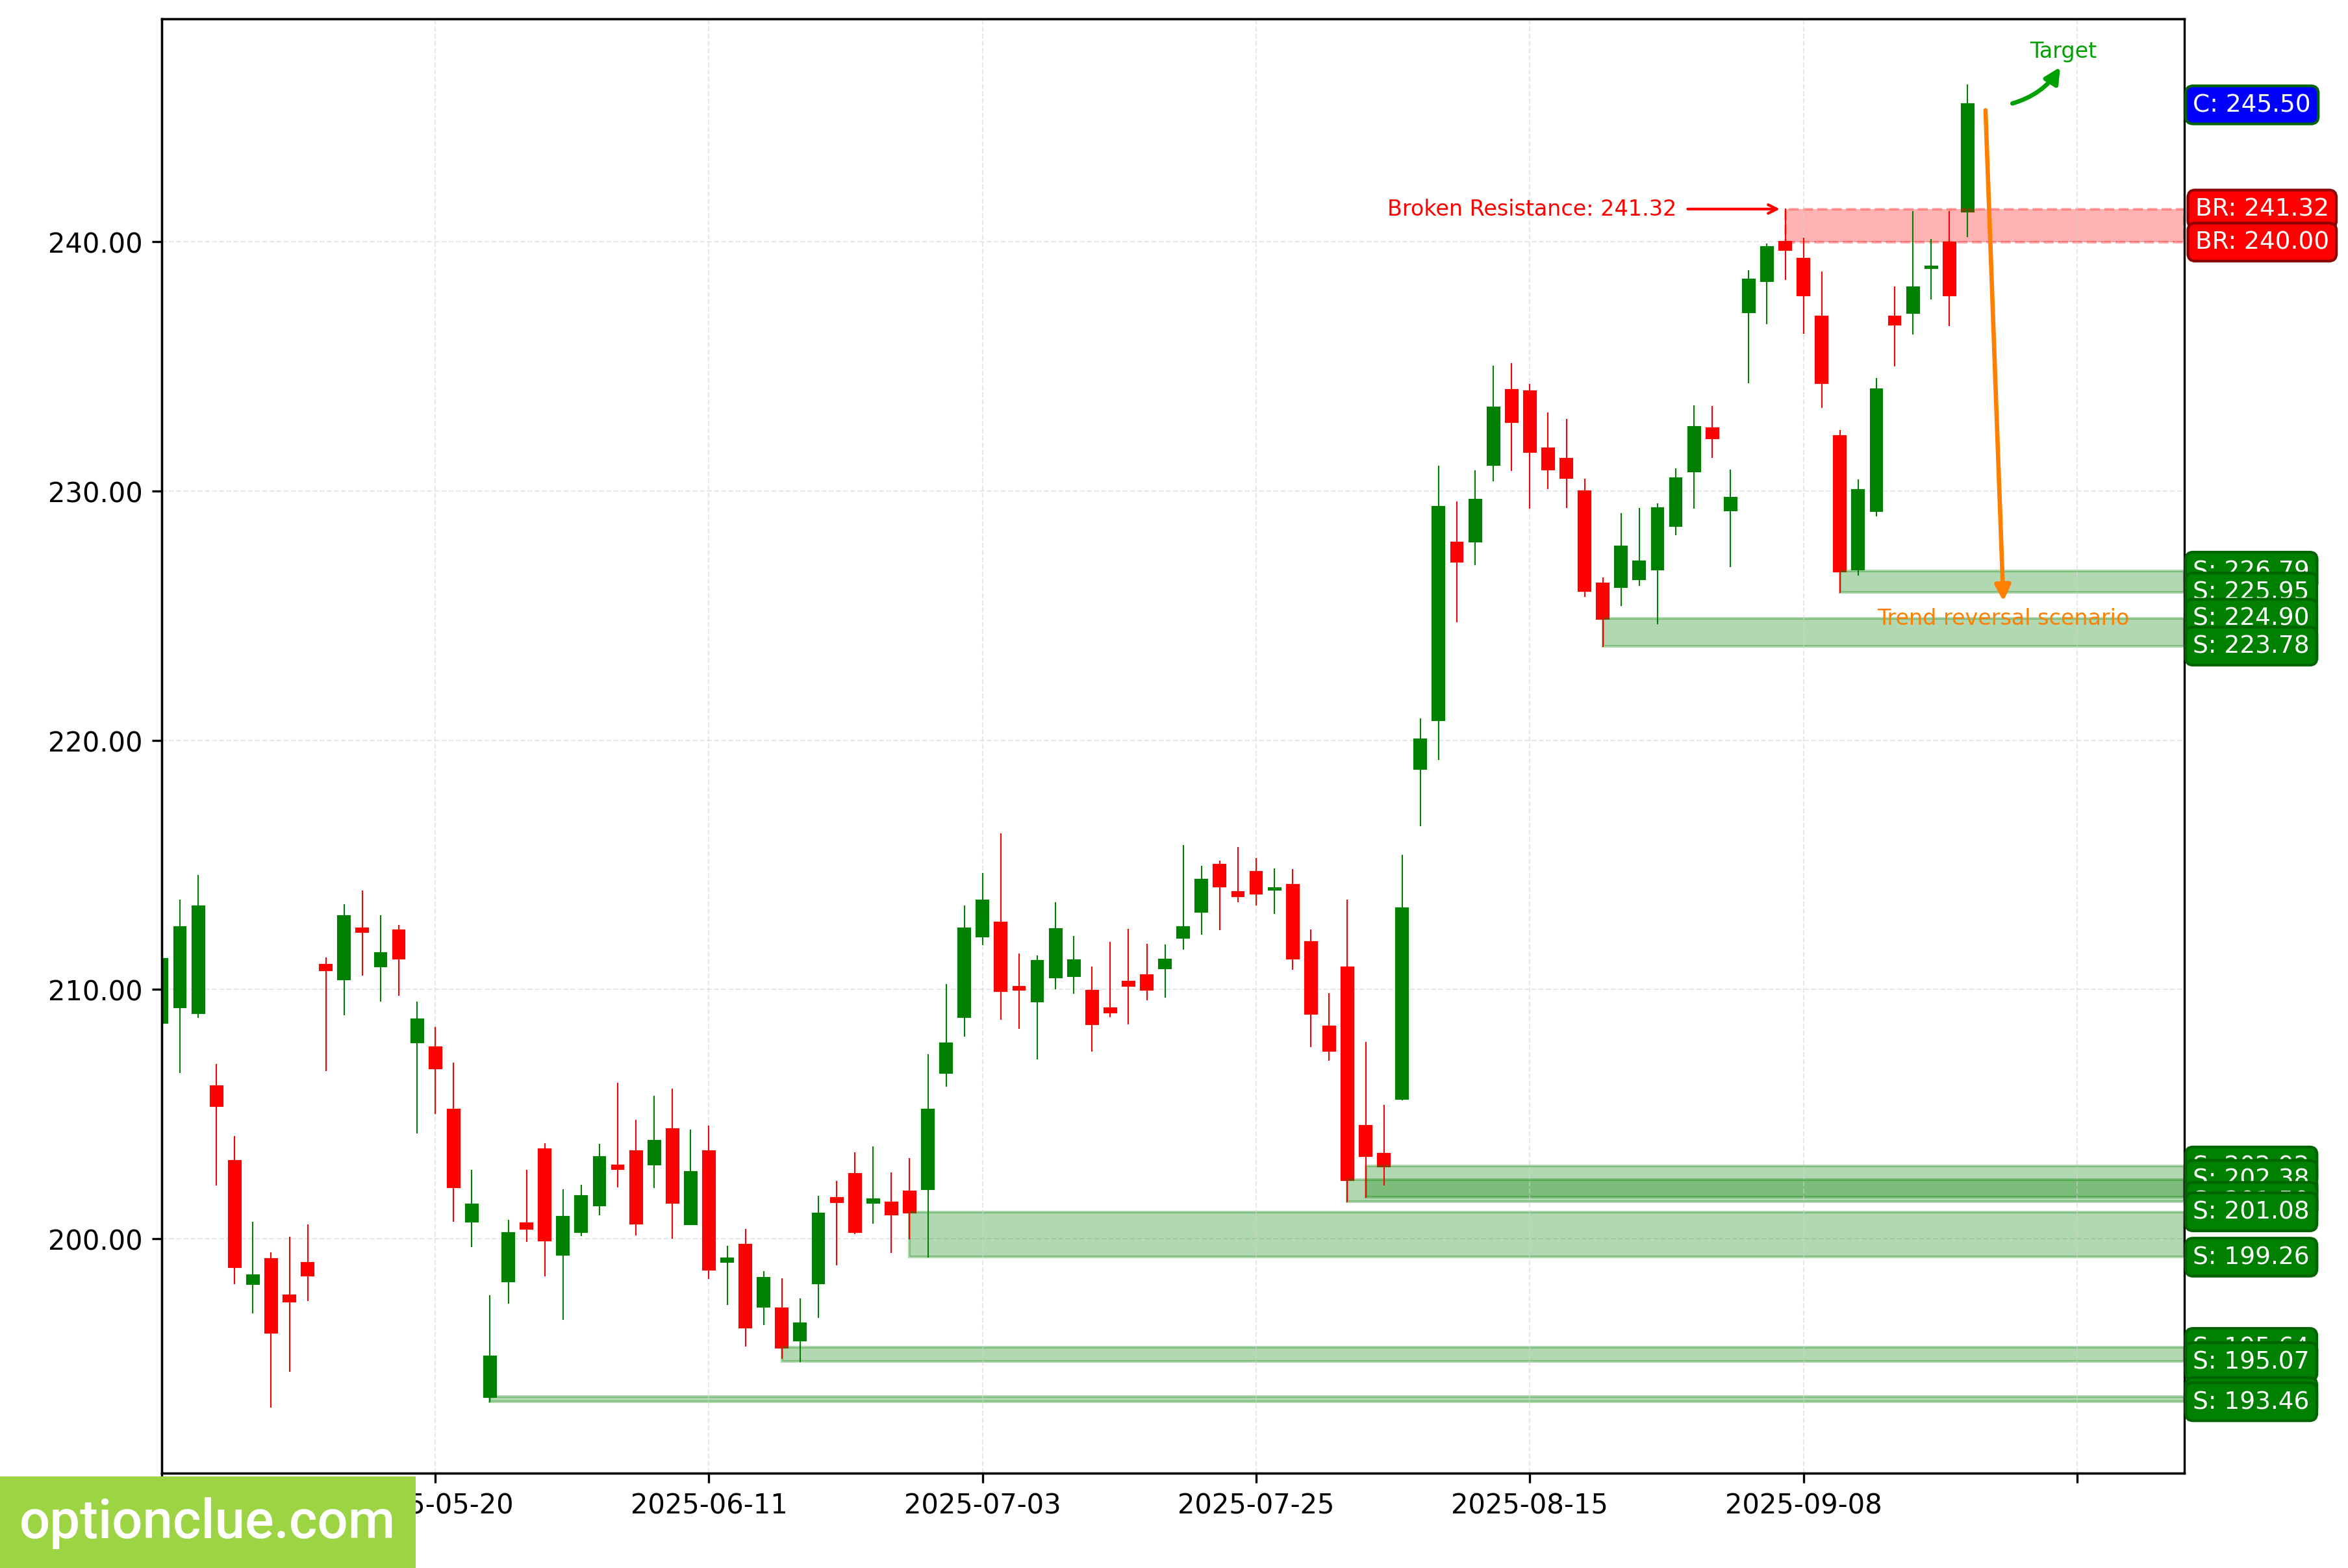
AAPL. Technical analysis. D1.
NVIDIA Corp (NVDA)
The market on the daily timeframe remains in a bearish trend, and a corrective wave is developing.
A short entry point on a rebound will appear after the correction on the daily timeframe is complete. If the downward move resumes, the first target will be the support level with boundaries at 168.41 — 170.29.
If the trend develops successfully, a further target will be at the support level with boundaries at 164.07 — 167.02. If the correction ends around the current prices, the potential profit/risk ratio could be around 3-4.
Short positions will remain relevant as long as the market stays below the nearest resistance level with boundaries at 177.75 — 178.85.
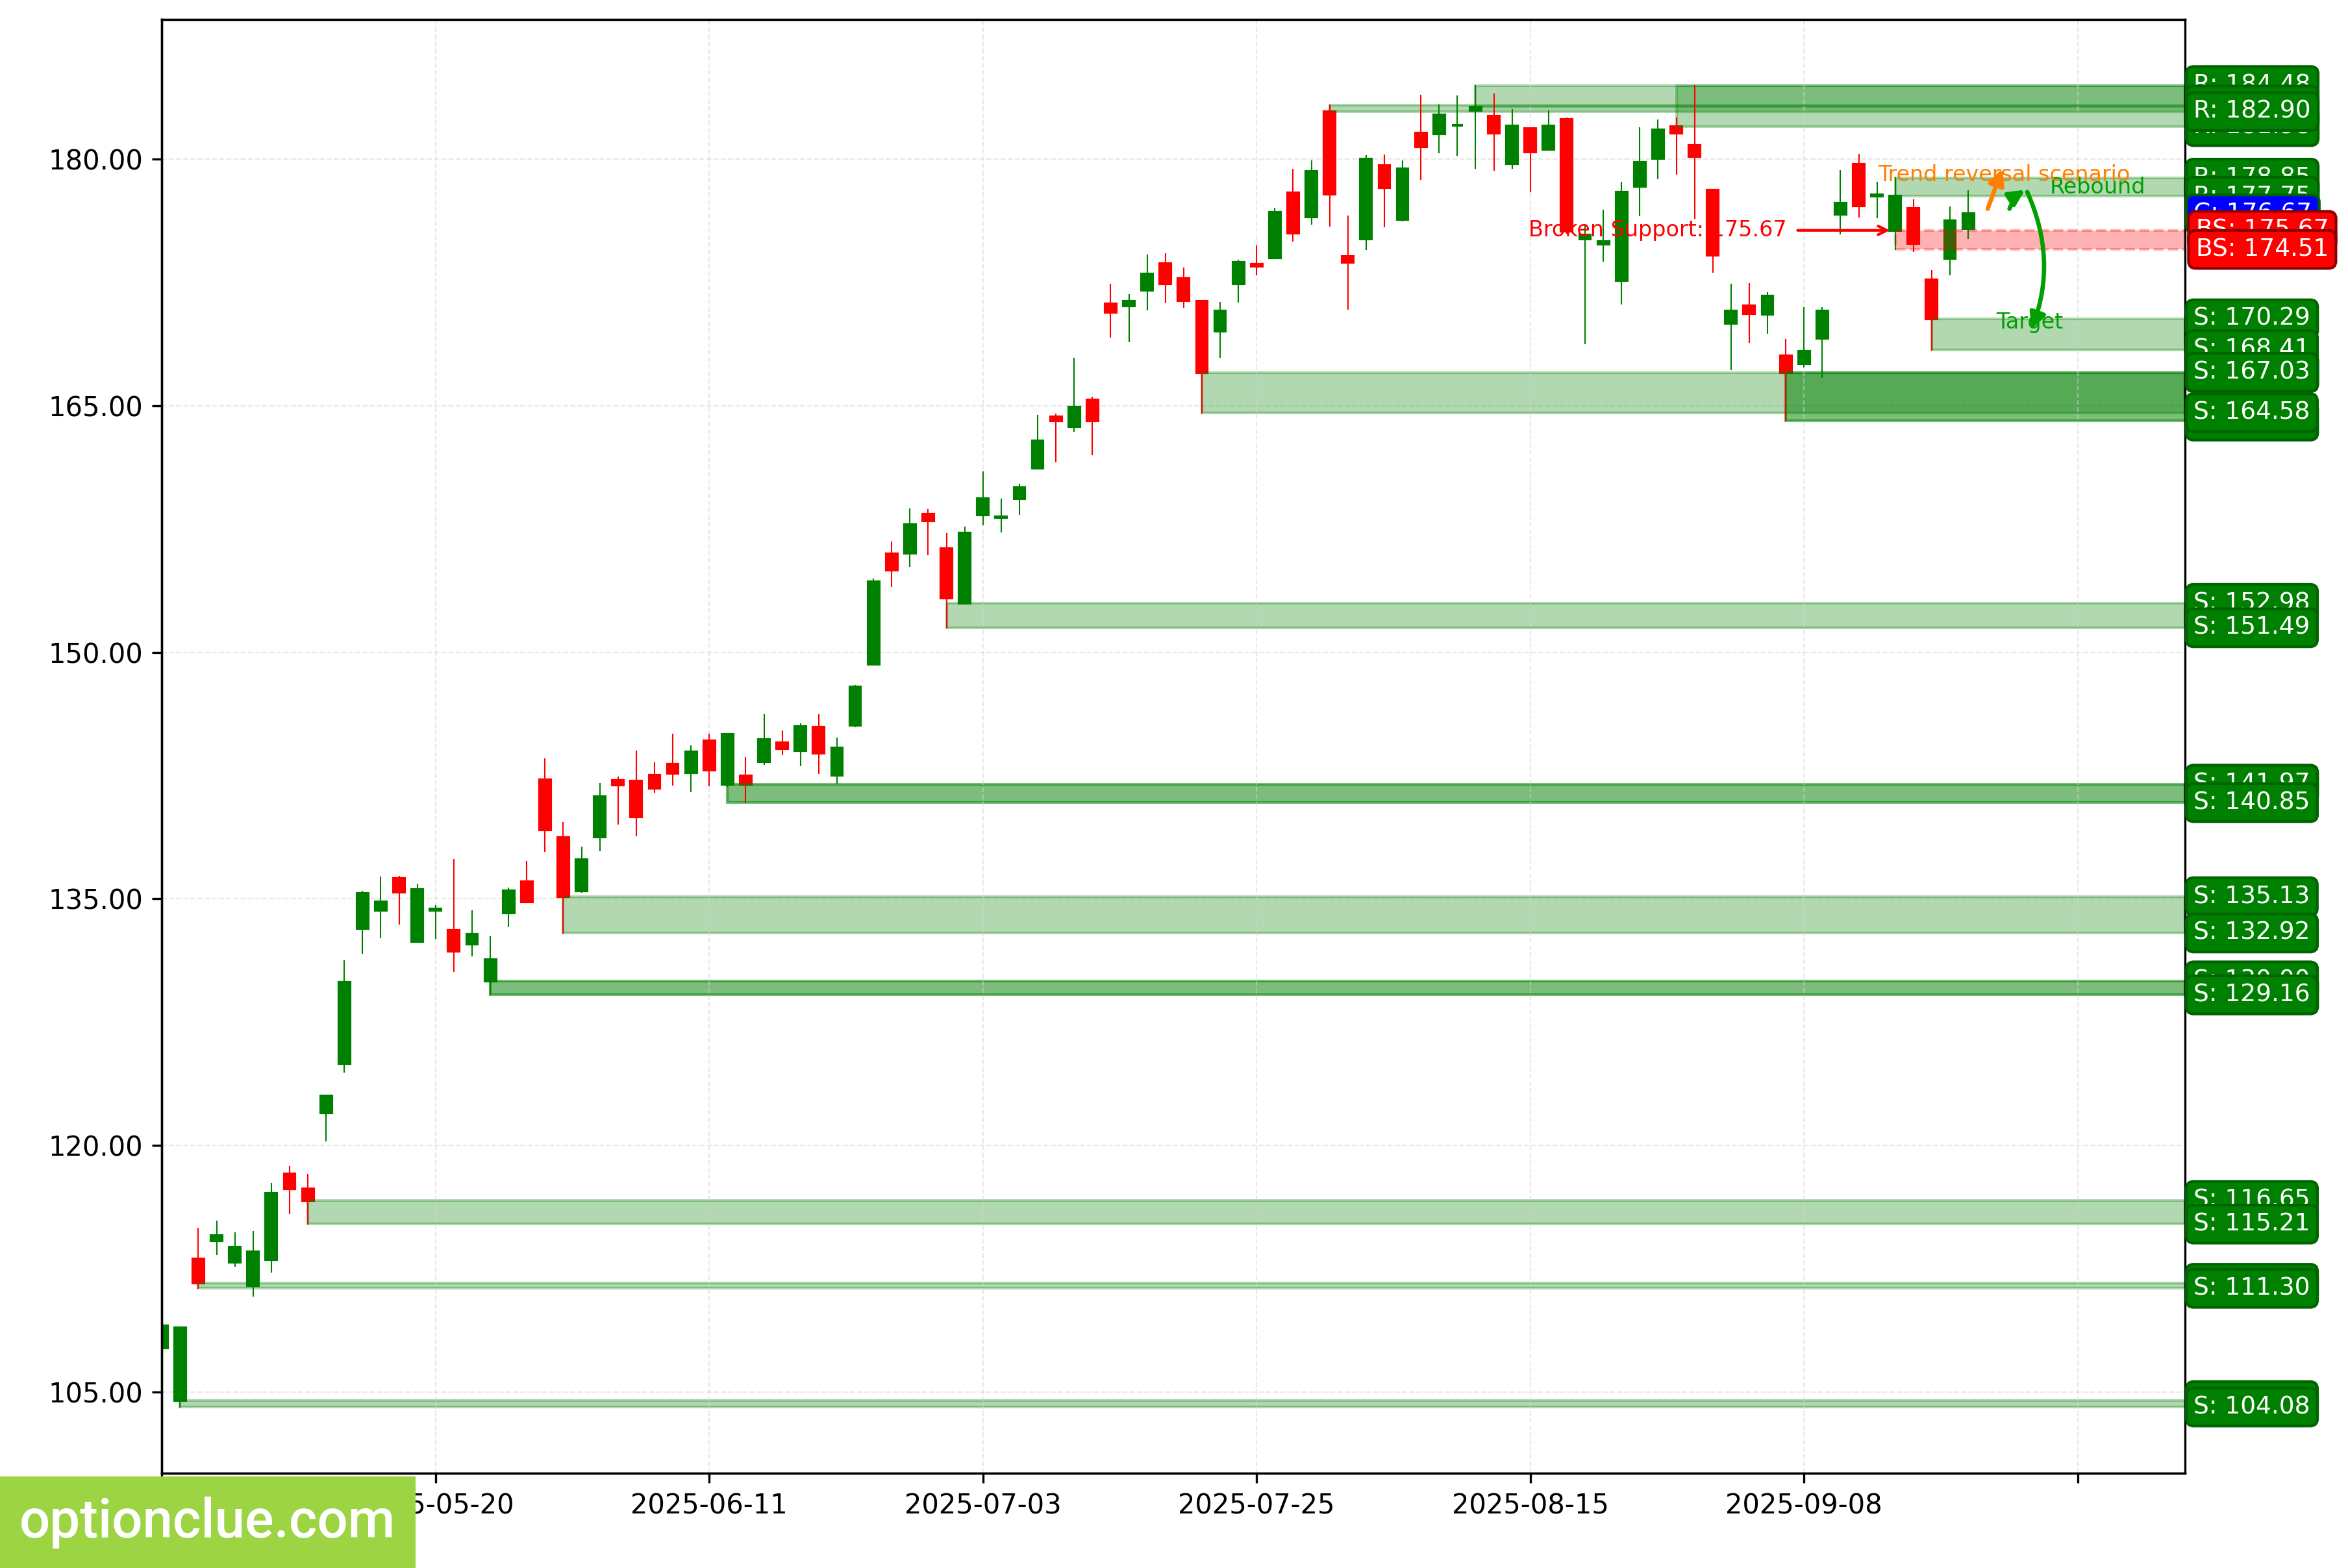
NVDA. Technical analysis. D1.
Tesla Inc (TSLA)
The trend is bullish, and another impulse wave is developing. The price is consolidating after a sharp rise.
A long entry point on a rebound will appear after a full-fledged correction forms. If the trend develops successfully, the target will be at the resistance level with boundaries at 465.16 — 465.33.
Buy signals will remain relevant as long as the market stays above the nearest daily timeframe support level with boundaries at 346.07 — 347.79.
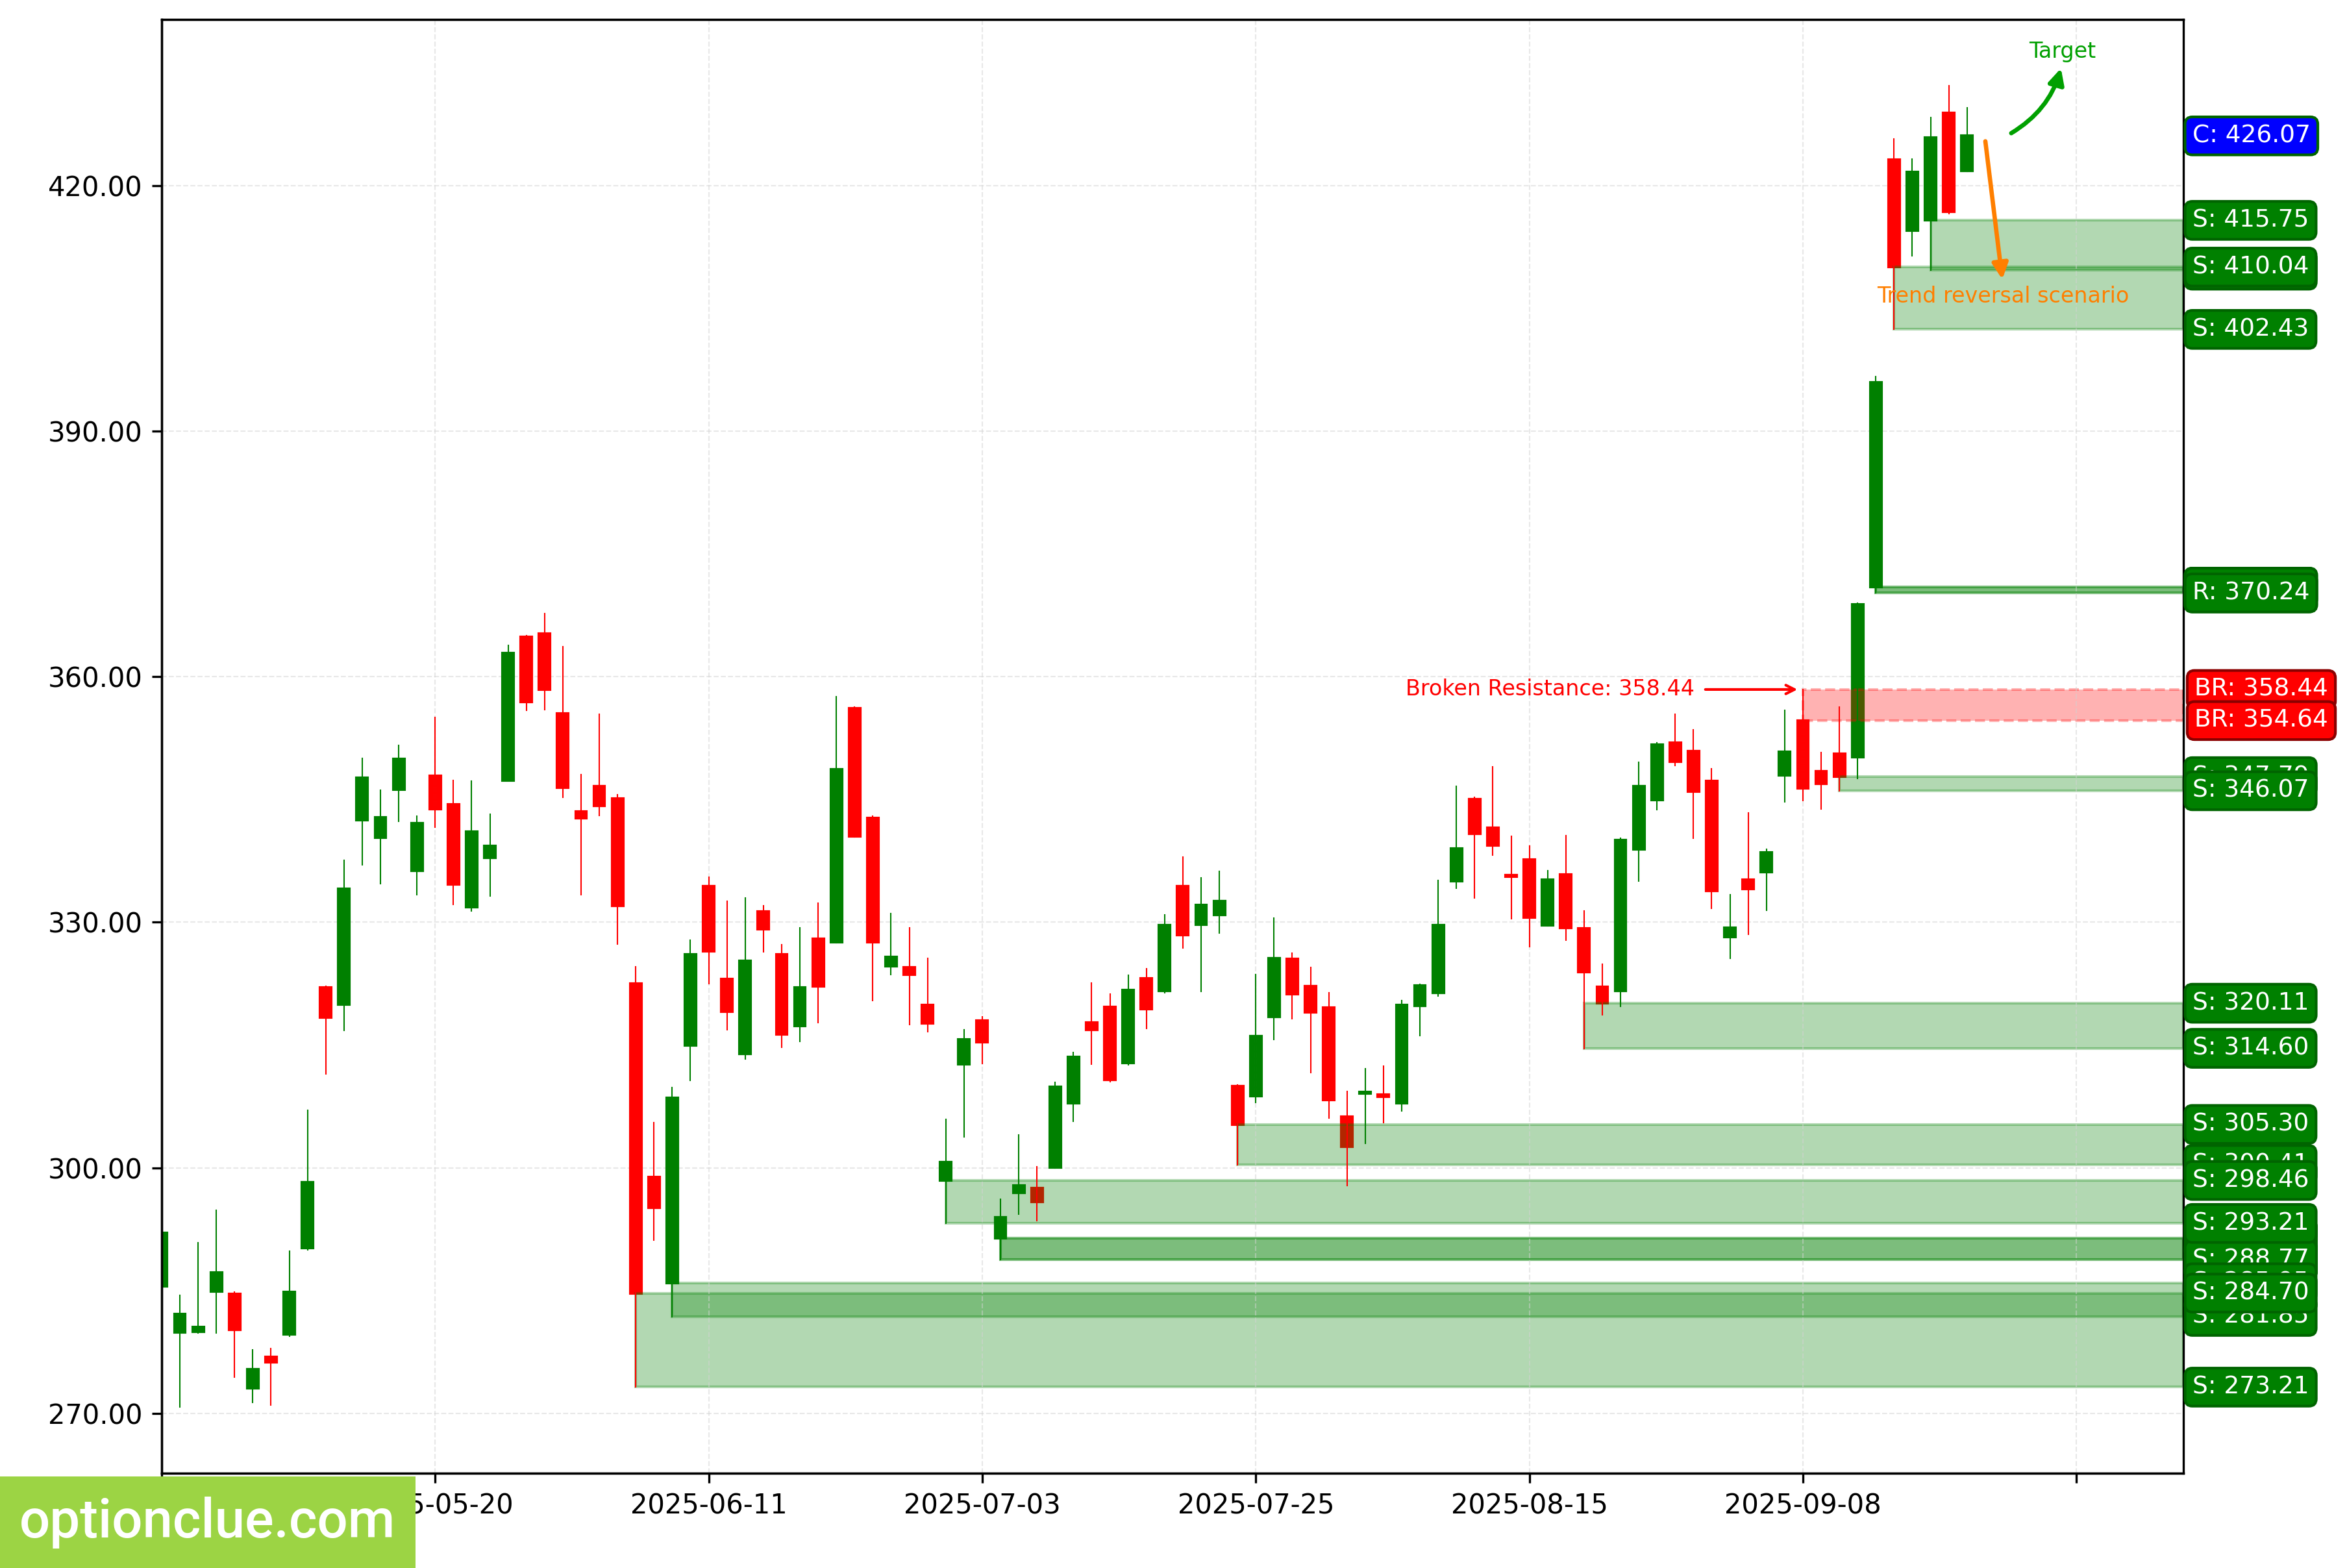
TSLA. Technical analysis. D1.
Summary
In the medium term, EURUSD, USDCHF, USDJPY, AUDUSD, NZDUSD, and NVDA stand out with corrections on the daily timeframe that are nearing completion. The other assets may be worth watching, depending on the depth of the market correction.