
We are reviewing the most important levels for key financial instruments and the likely scenarios for how events may develop.
Key Topics
- Euro (EURUSD)
- British Pound (GBPUSD)
- Swiss Franc (USDCHF)
- Japanese Yen (USDJPY)
- Canadian Dollar (USDCAD)
- Australian Dollar (AUDUSD)
- Bitcoin (BTC)
- Ether (ETH)
- Apple Inc (AAPL)
- NVIDIA Corp (NVDA)
- Tesla Inc (TSLA)
- Summary
Euro (EURUSD)
The bearish trend continues, and an impulse wave is developing. The last broken level is support (1.1499 — 1.1518). The breakout occurred 2 candlesticks ago. A short entry point on a rebound may form after a correction develops.
If the downward move resumes, the first target will be the support level with boundaries at 1.1443 — 1.1456. If the trend develops successfully, the farther target will be at the support level with boundaries at 1.1313 — 1.1348.
The potential reward-to-risk ratio from current prices, when setting targets and defining risk by daily timeframe levels, may be less than 0.1:1. When using the farther target, it may also be small (around 0.5:1). If the new correction ends near the resistance level (1.1609 — 1.1622), the potential reward-to-risk ratio may be above 1:1. For the farther target, it may be around 3:1. If the next correction ends near the last broken level (1.1499 — 1.1518), the potential reward-to-risk ratio may be small (around 0.3:1). If choosing the farther target, it may also be small (around 0.8:1).
Short positions will remain relevant as long as the market remains below the nearest resistance level with boundaries at 1.1609 — 1.1622. If the market successfully holds above this nearest resistance, the trend will reverse to the opposite direction (bullish).
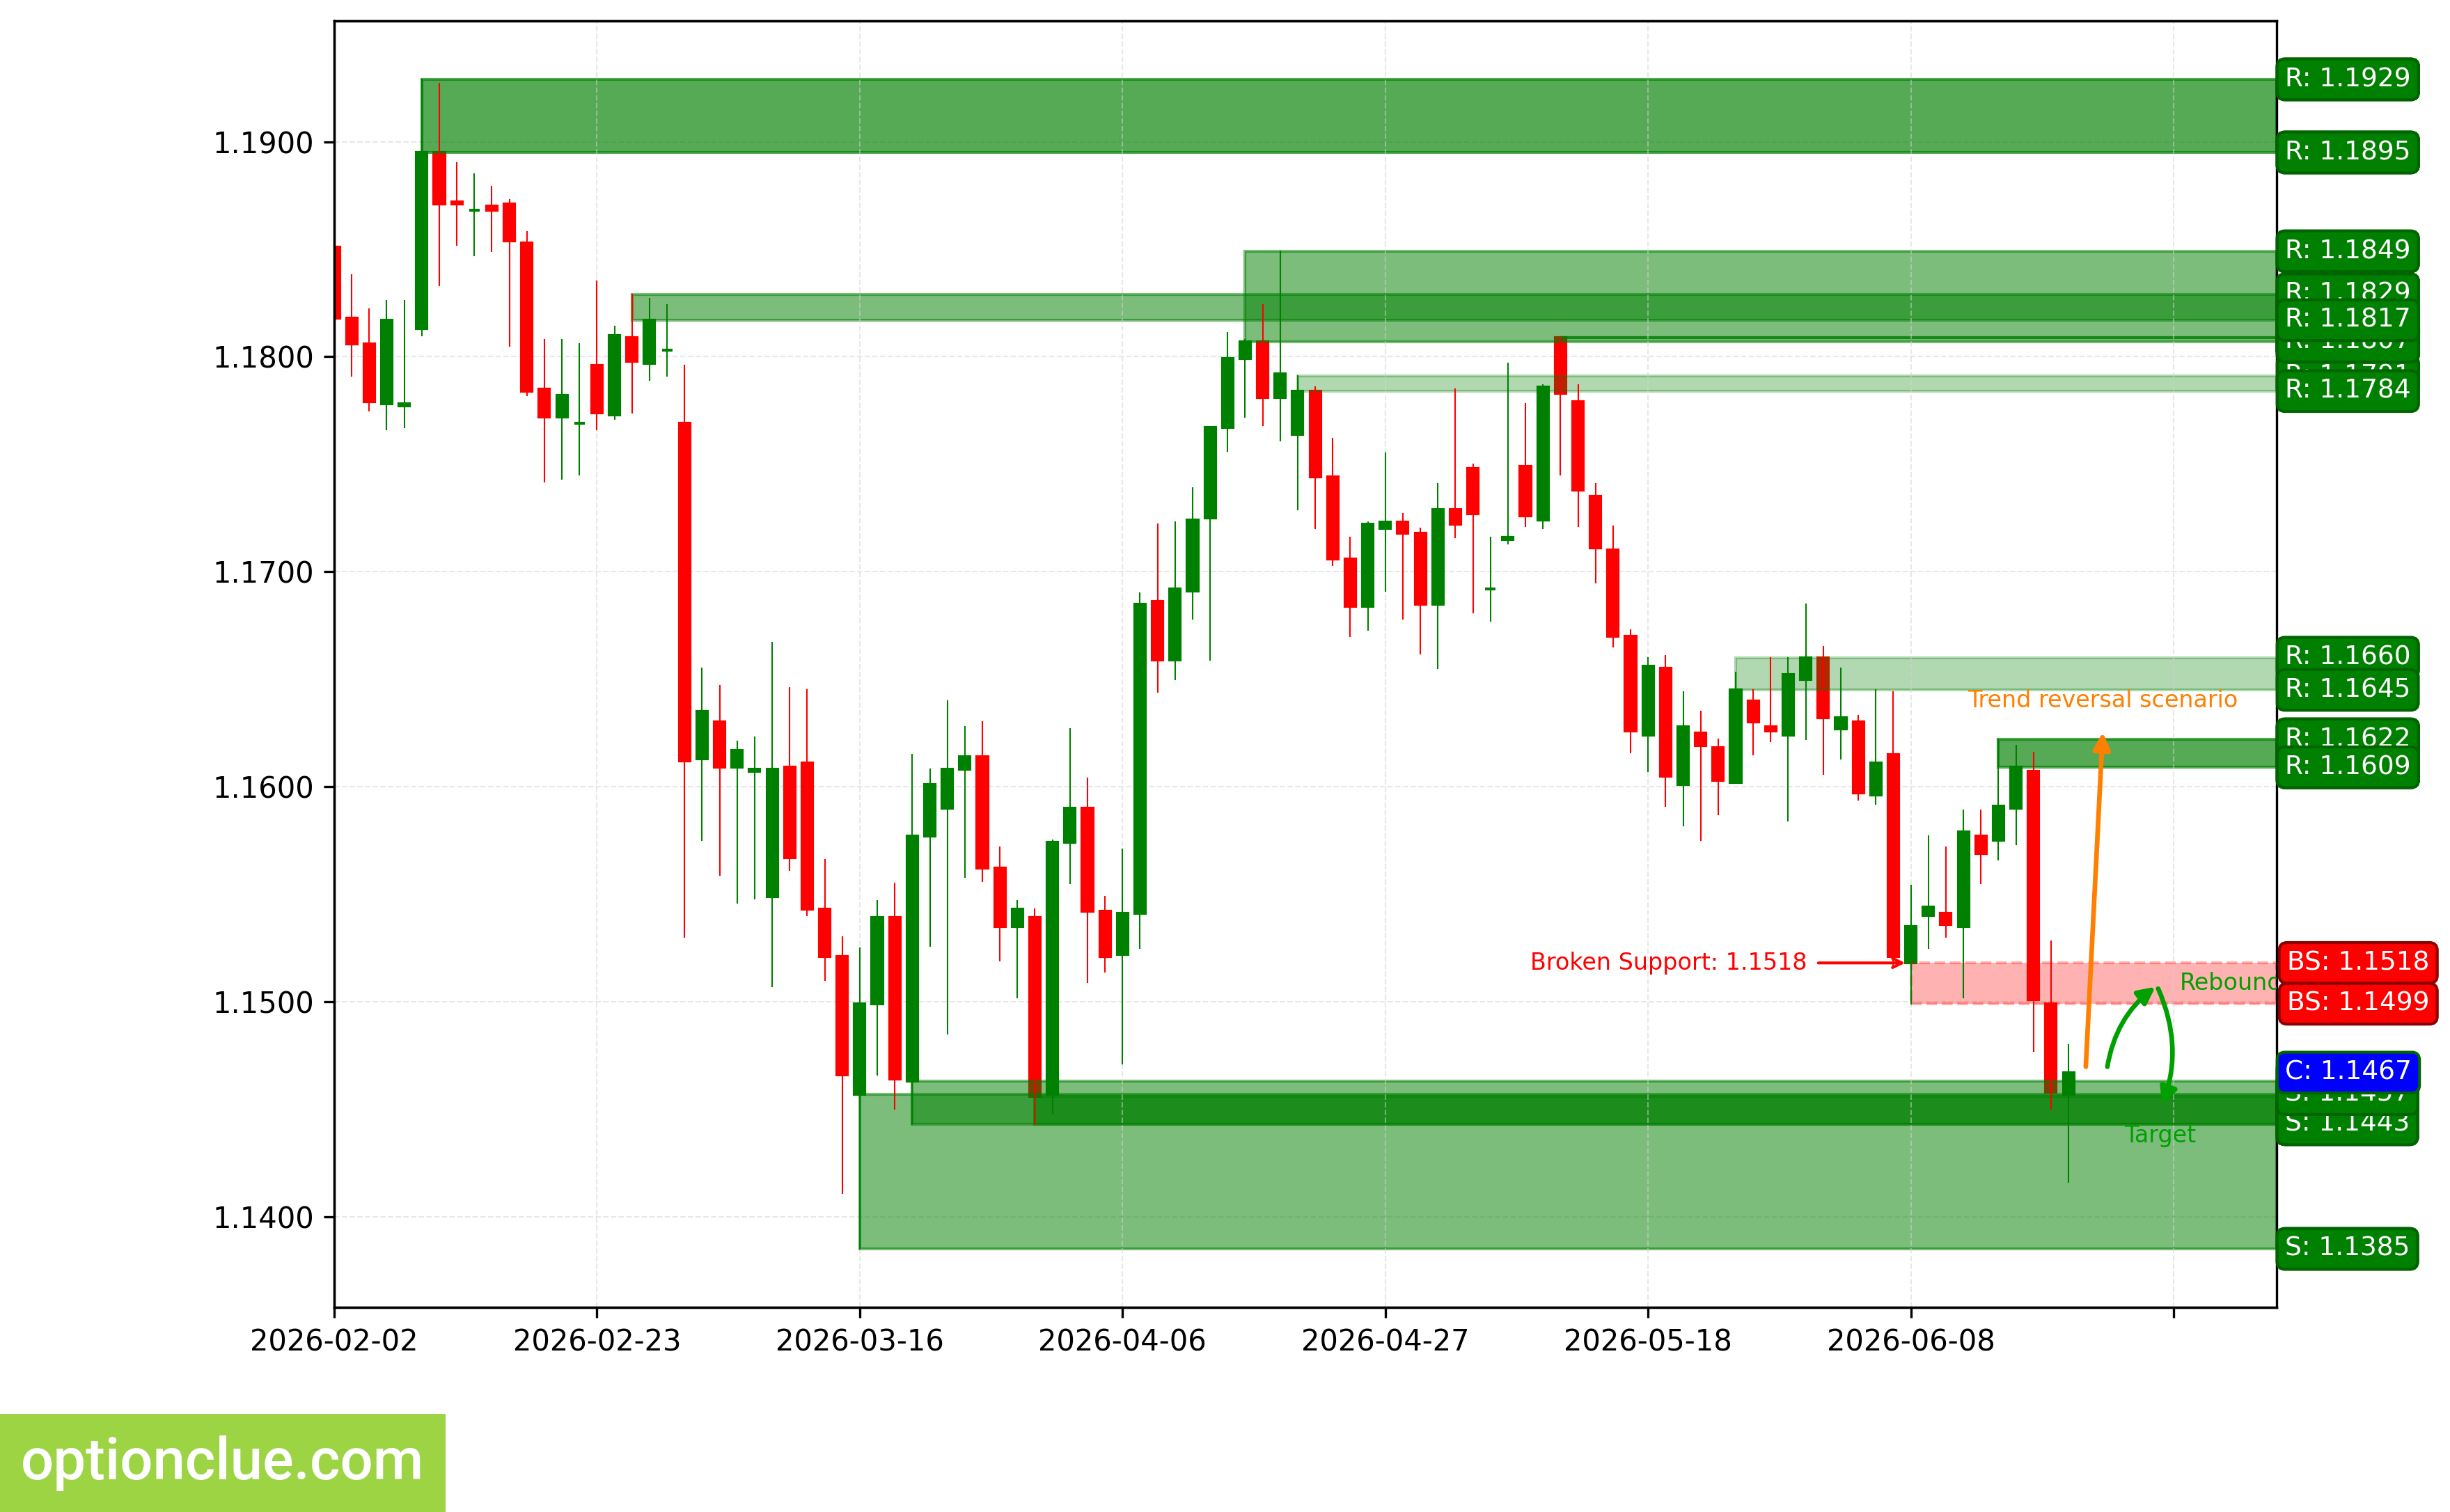
EURUSD. Technical analysis. D1.
British Pound (GBPUSD)
The bearish trend continues, and an impulse wave is developing. The last broken level is support (1.3305 — 1.3333). The breakout occurred 2 candlesticks ago. A short entry point on a rebound on the daily timeframe may appear after a correction develops.
The interim target for the downward move is the support level with boundaries at 1.3156 — 1.3196. If the trend develops successfully, the farther target will be at the support level with boundaries at 1.3038 — 1.3060.
If the new correction ends near the resistance level (1.3450 — 1.3461), the potential reward-to-risk ratio may be above 2:1. If choosing the farther target, it may be above 3:1. If the next correction ends near the last broken level (1.3305 — 1.3333), the potential reward-to-risk ratio may be small (around 0.5:1). For the farther target, it may be around 1.1:1.
Short positions will remain relevant as long as the market remains below the nearest resistance level with boundaries at 1.3450 — 1.3461. If the market successfully holds above this nearest resistance, the trend will reverse to the opposite direction (bullish).
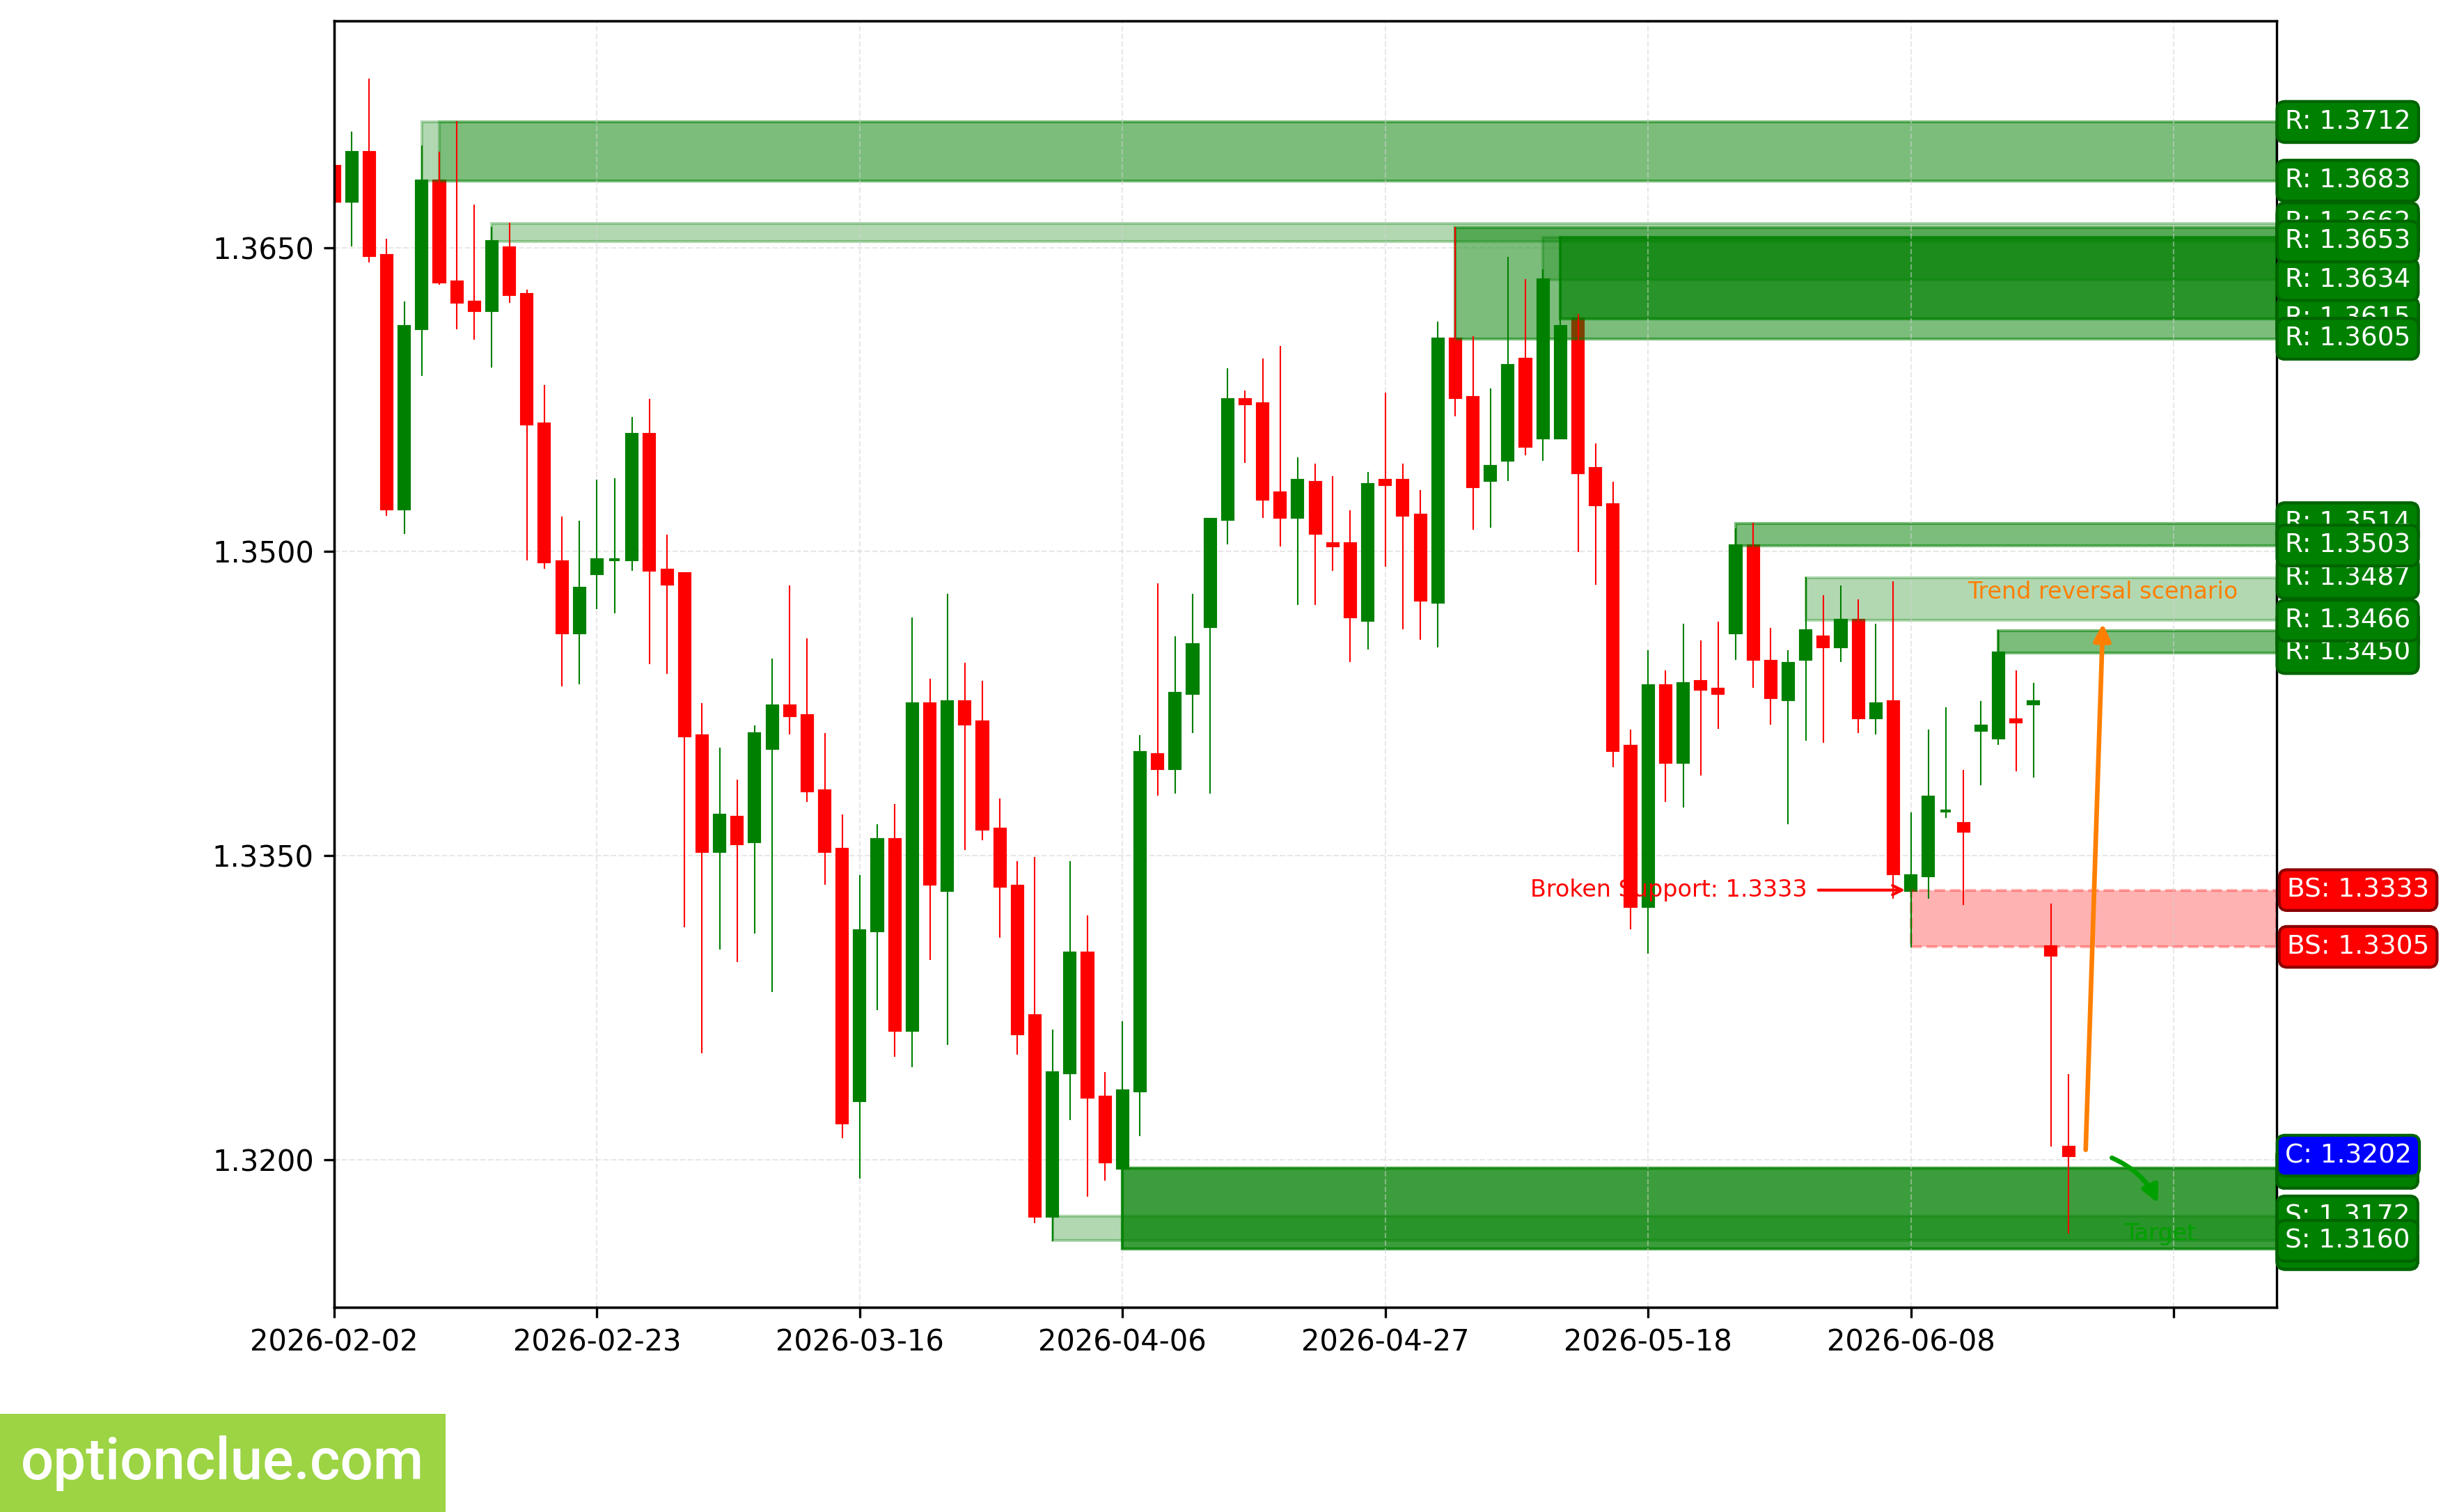
GBPUSD. Technical analysis. D1.
Swiss Franc (USDCHF)
The bullish trend continues, and an impulse wave is developing. New long entry points on a rebound on the daily timeframe may appear after a correction develops. The last broken level is resistance (0.7972 — 0.7975). The breakout occurred 3 candlesticks ago.
The interim target for the upward move is the resistance level with boundaries at 0.8087 — 0.8101. If the trend develops successfully, the farther target will be at the resistance level with boundaries at 0.8148 — 0.8171.
If the new correction ends near the support level (0.7908 — 0.7931), the potential reward-to-risk ratio may be around 2:1. If the next correction ends near the last broken level (0.7972 — 0.7975), the potential reward-to-risk ratio may be modest (around 0.9:1).
Long positions will remain relevant as long as the market is above the nearest support level on the daily timeframe, with boundaries at 0.7908 — 0.7931. If the market successfully holds below this nearest support, the trend will reverse to the opposite direction (bearish).
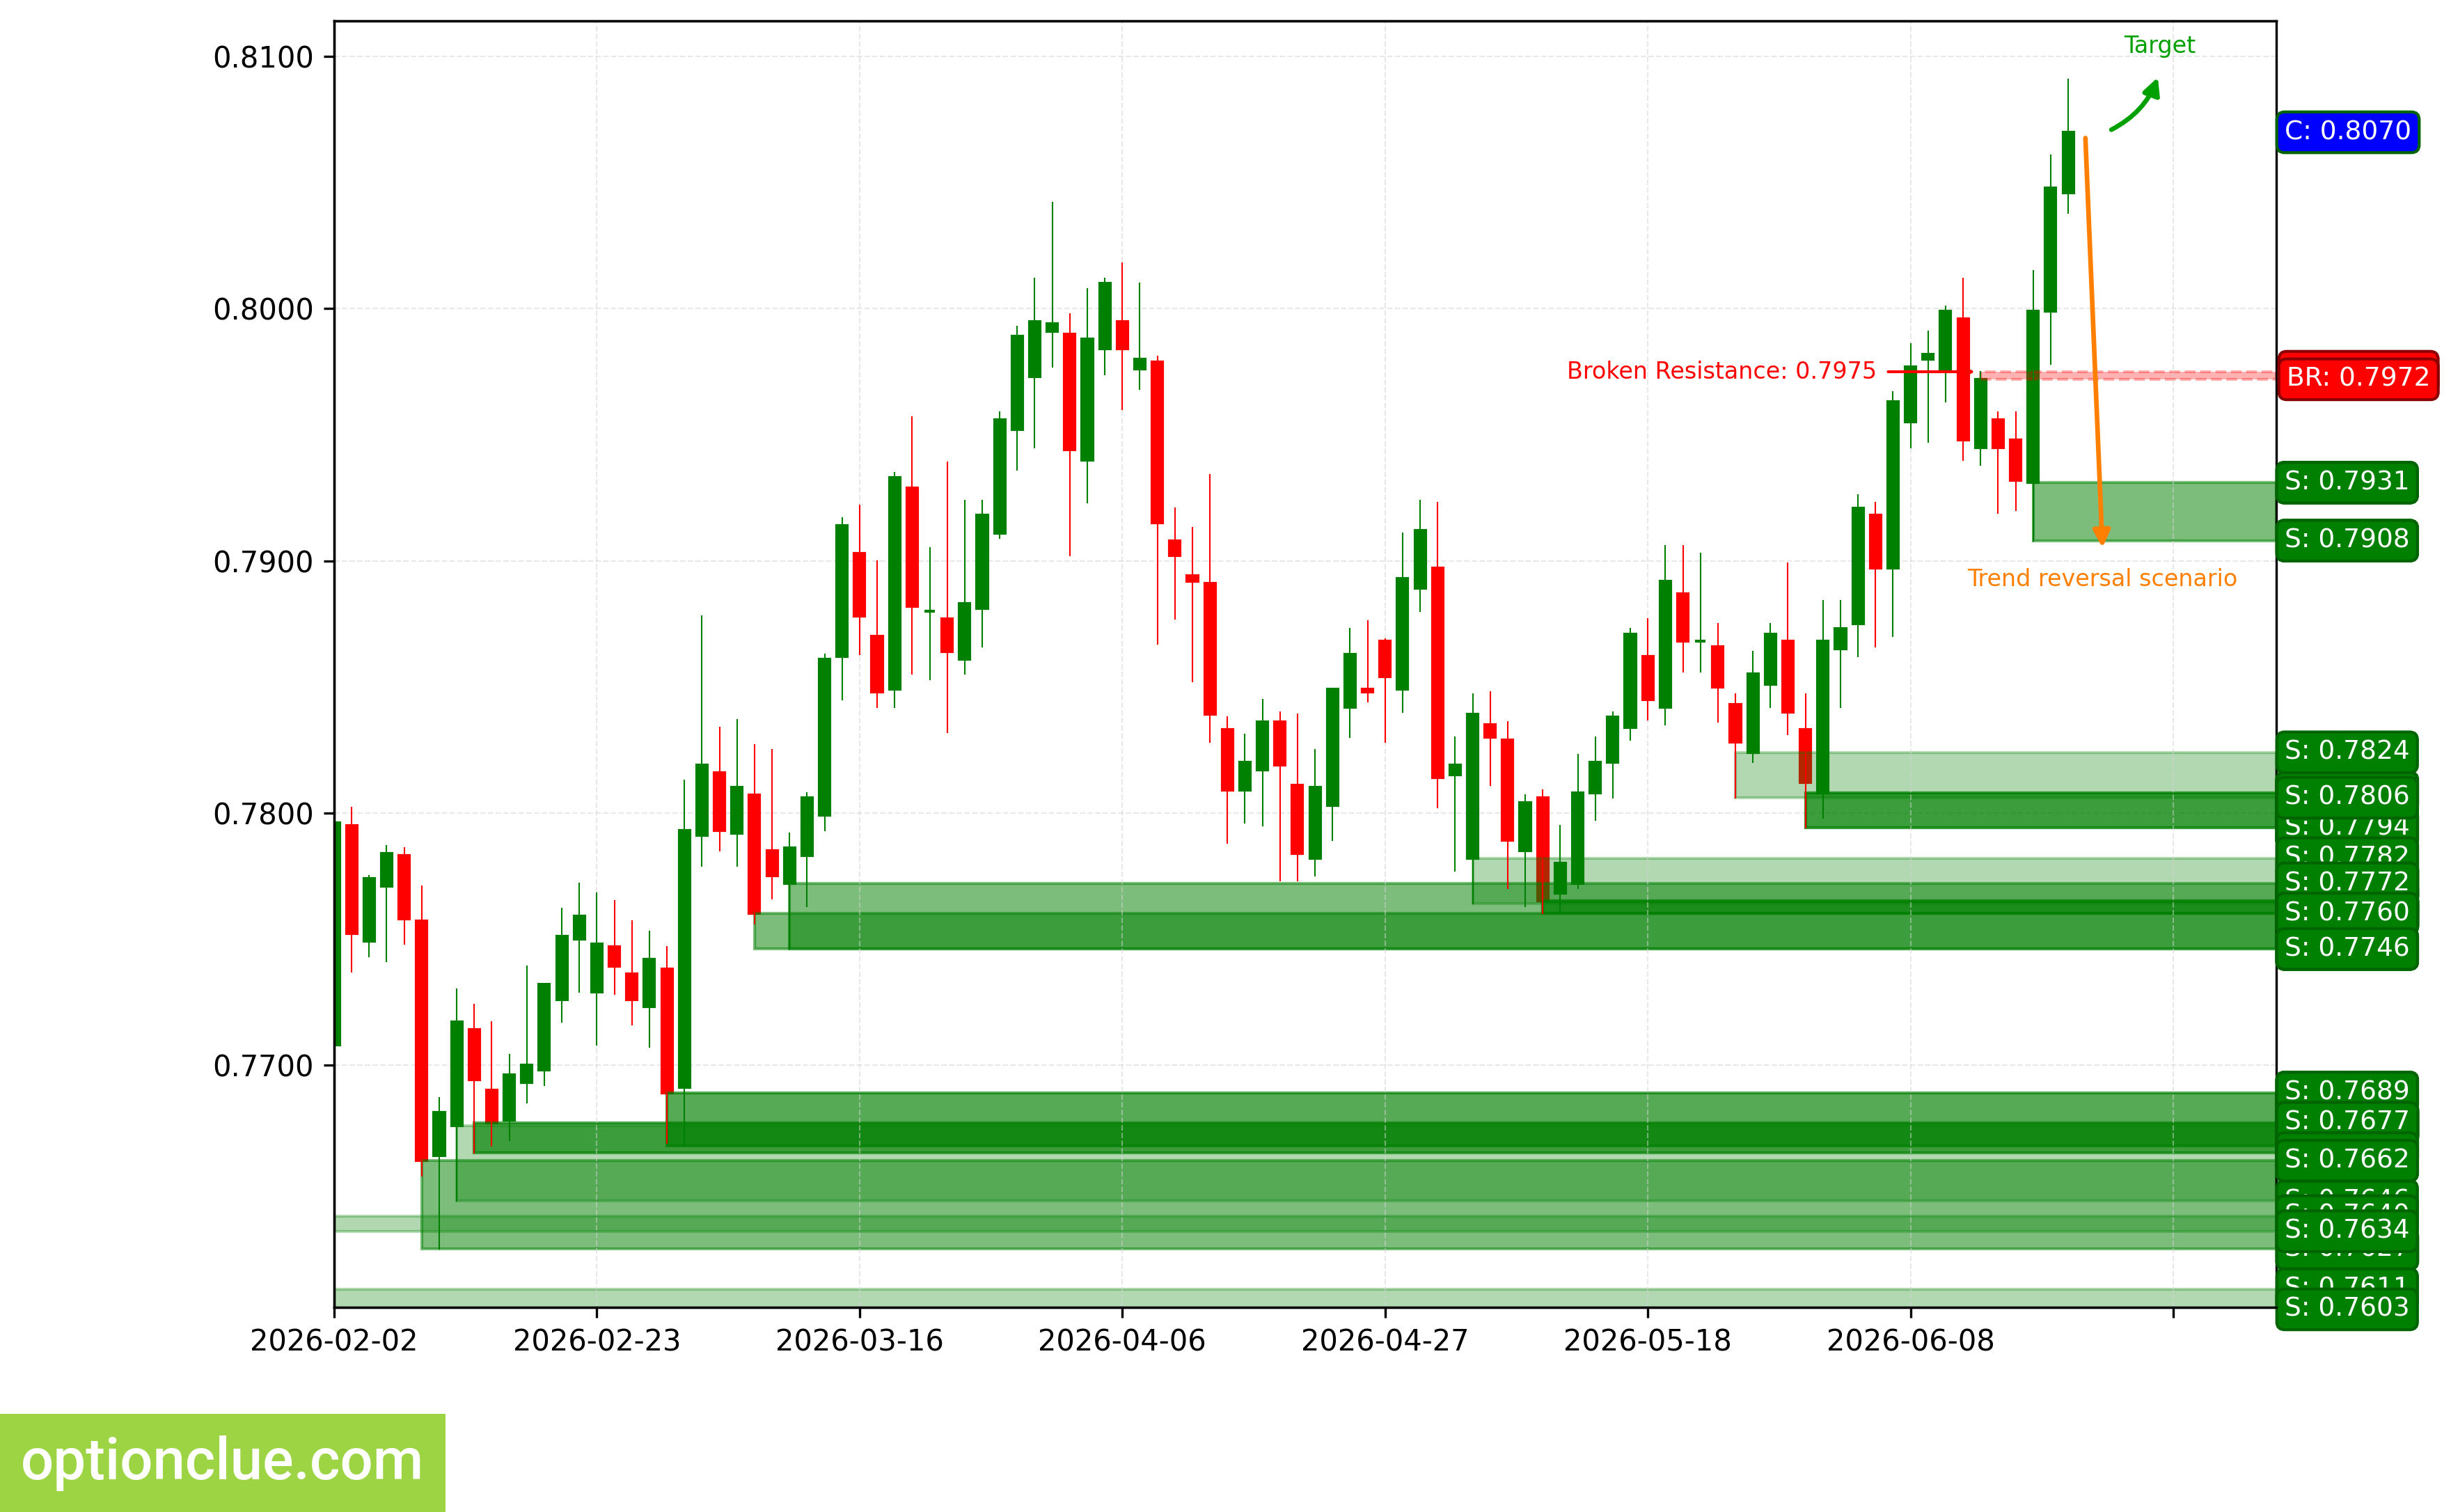
USDCHF. Technical analysis. D1.
Japanese Yen (USDJPY)
The market remains in a bullish trend, and an impulse wave is developing. A long entry point on a rebound may form after a correction develops. The last broken level is resistance (160.55 — 160.59). The breakout occurred 3 candlesticks ago.
No current targets for the upward move have been identified on the current timeframe.
Long positions will remain relevant as long as the market is above the nearest support level on the daily timeframe, with boundaries at 159.64 — 159.92. If the market successfully holds below this support, the trend will reverse to the opposite direction (bearish).
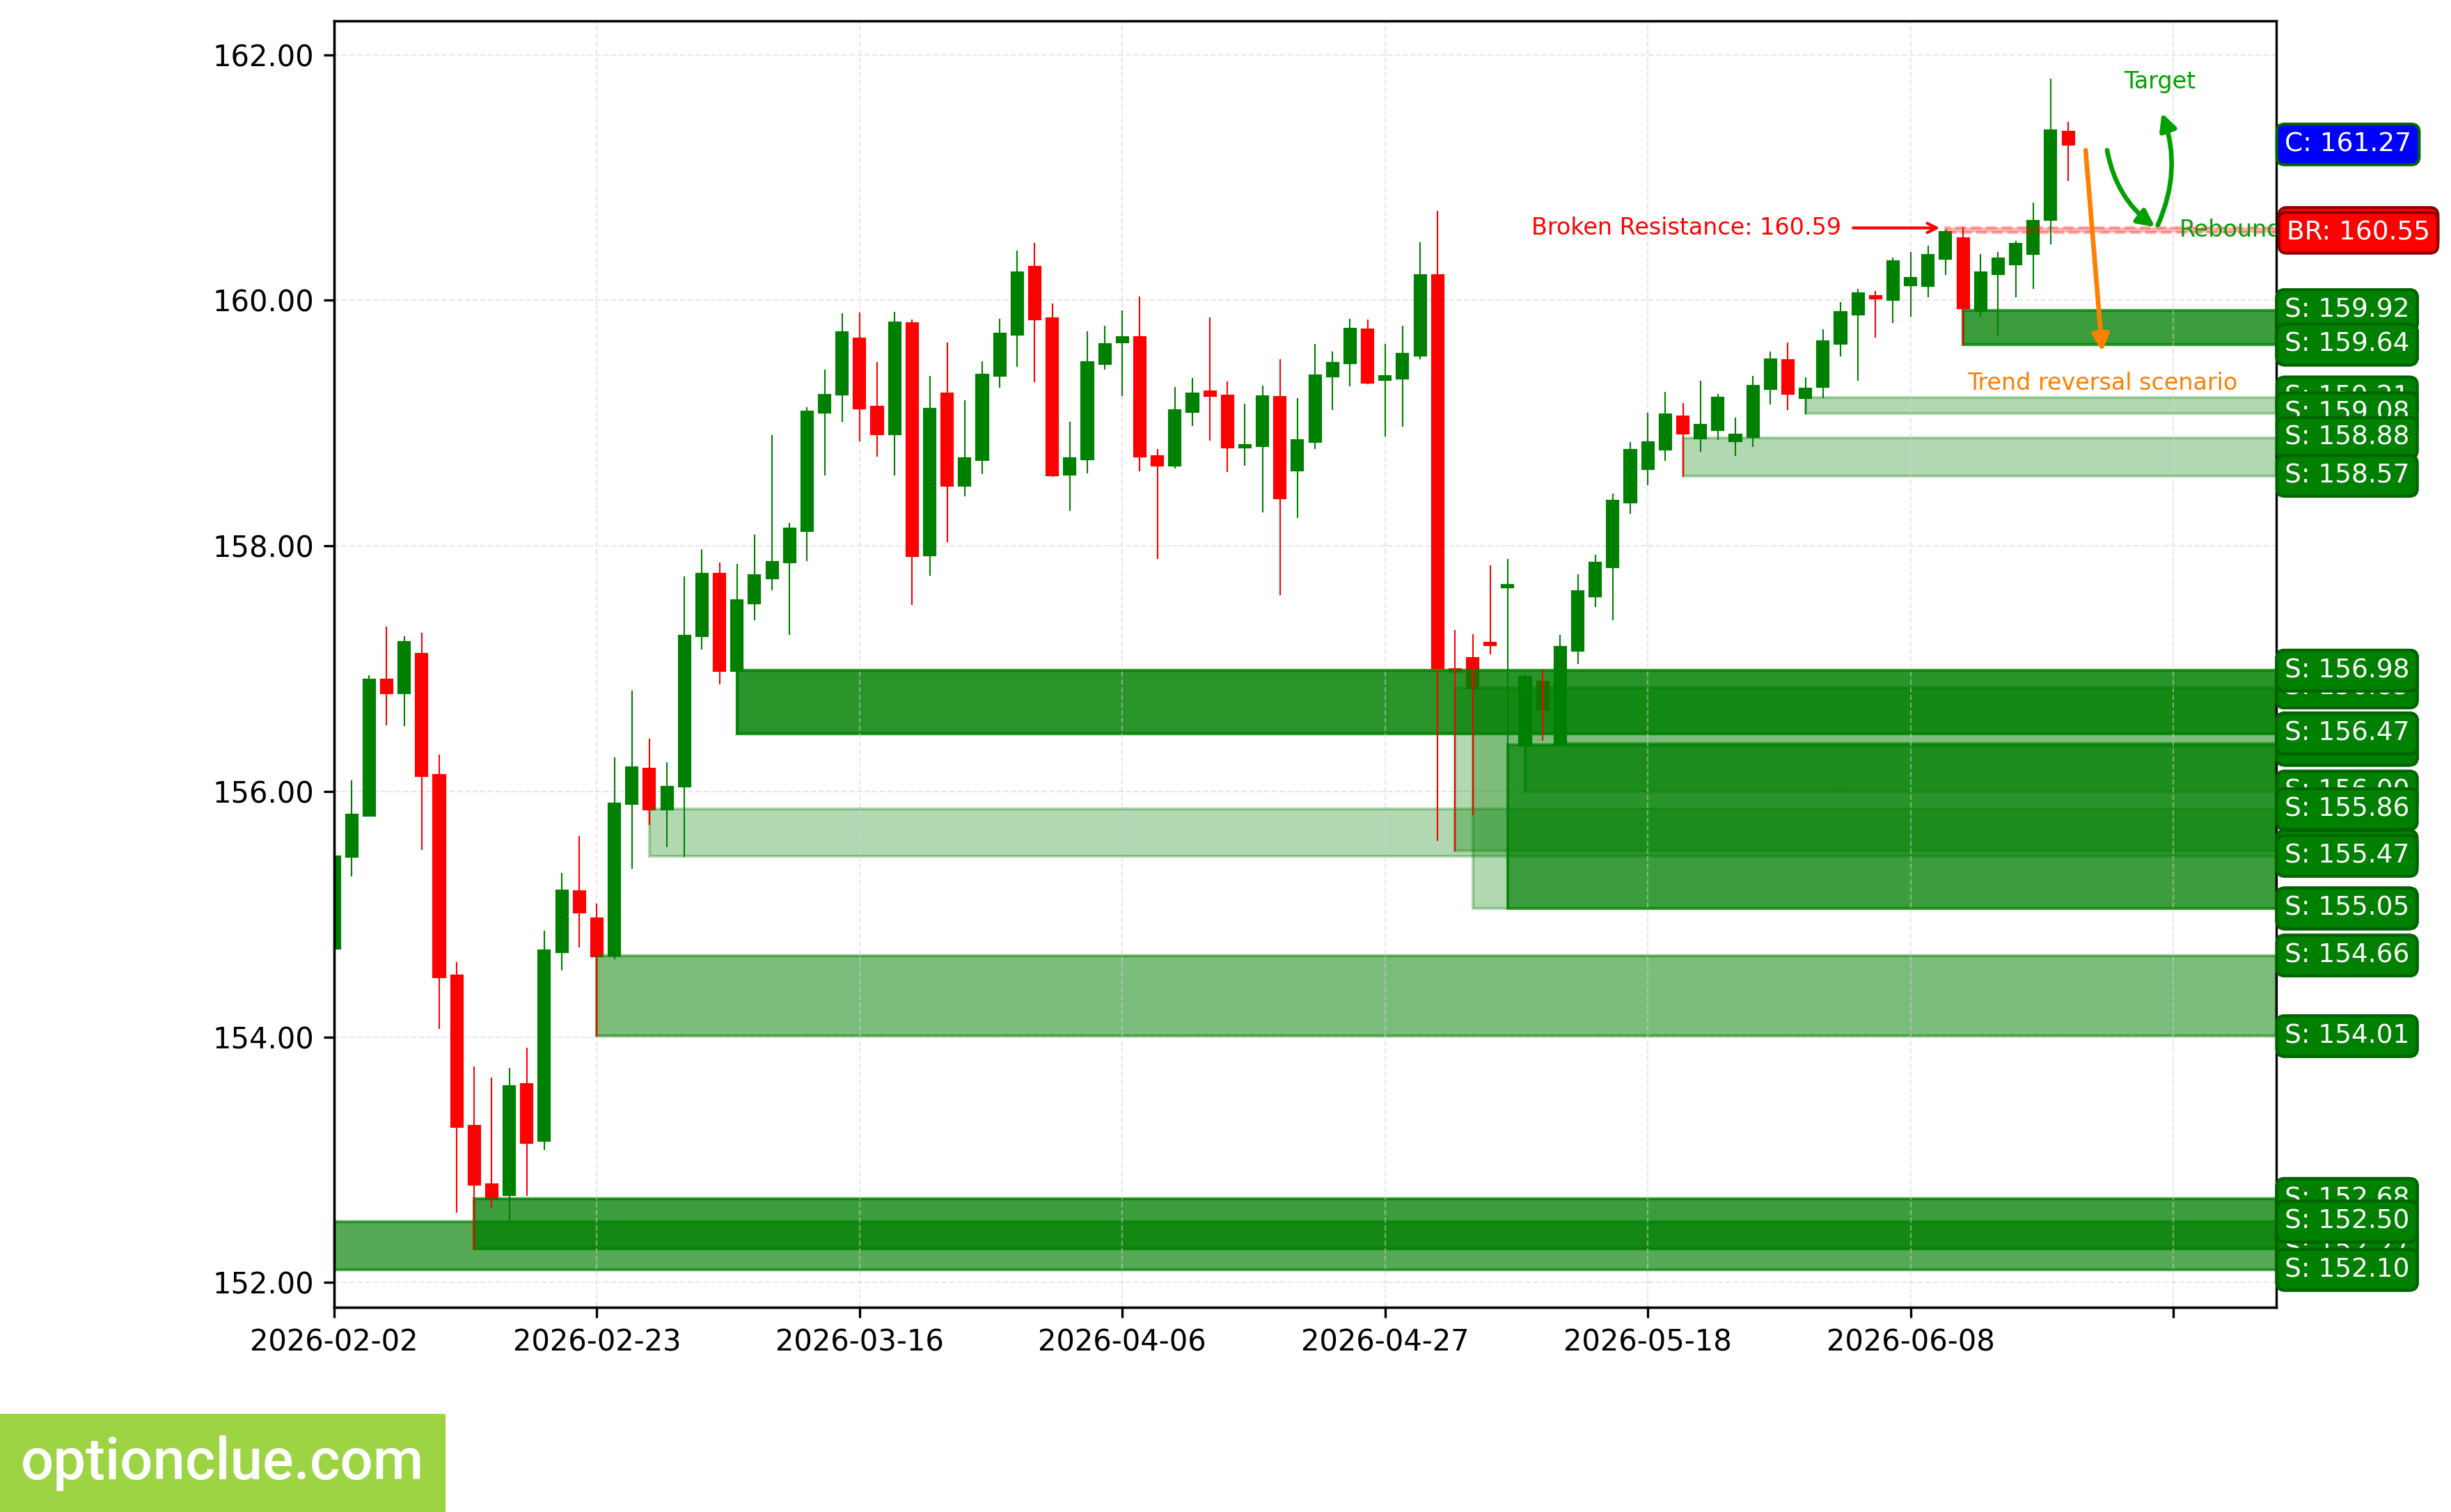
USDJPY. Technical analysis. D1.
Canadian Dollar (USDCAD)
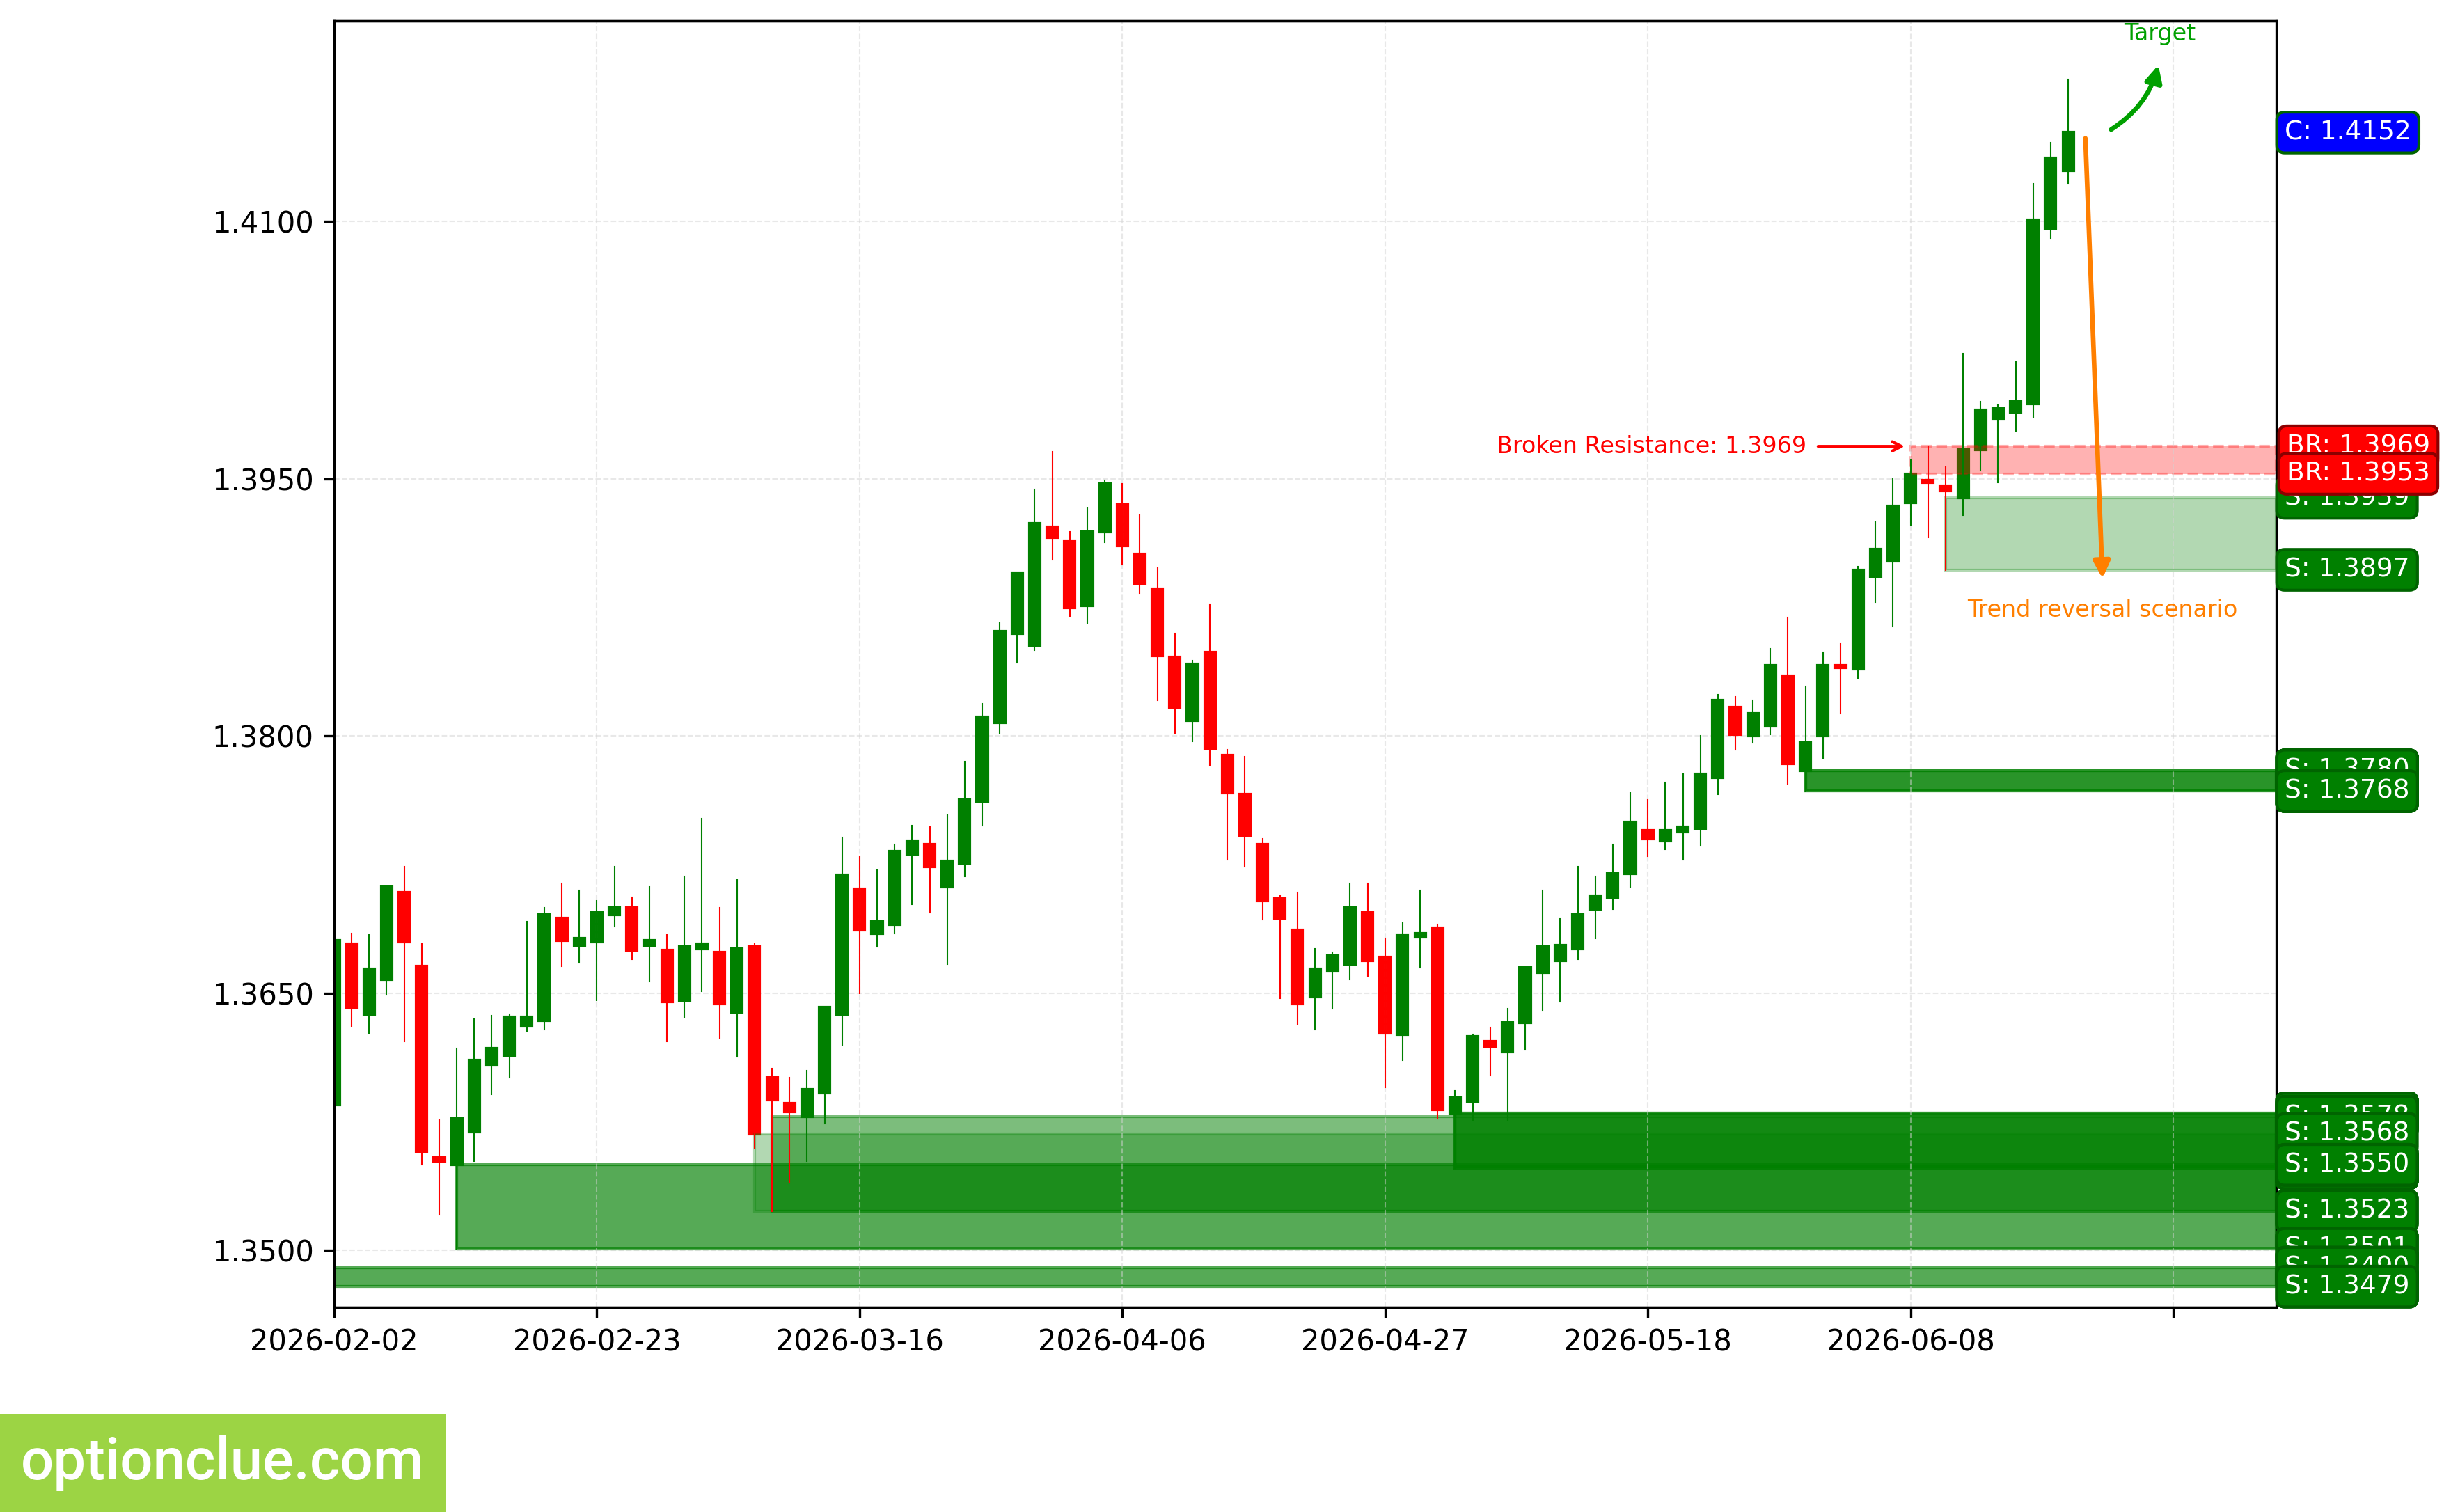
The bullish trend continues, and an impulse wave is developing. A long entry point on a rebound may appear after a correction develops. The last broken level is resistance (1.3953 — 1.3969). The breakout occurred 6 candlesticks ago.
The interim target for the upward move is the resistance level with boundaries at 1.4265 — 1.4296. If the trend develops successfully, the farther target will be at the resistance level with boundaries at 1.4388 — 1.4415.
The potential reward-to-risk ratio from current prices, when setting targets and defining risk by daily timeframe levels, may be small (around 0.3:1). When using the farther target, it may also be small (around 0.7:1). If the next correction ends near the support level (1.3897 — 1.3939), the potential reward-to-risk ratio may be above 3:1. For the farther target, it may be above 4:1. If the correction ends near the last broken level (1.3953 — 1.3969), the potential reward-to-risk ratio may be around 2:1. If choosing the farther target, it may be around 3:1.
Long positions will remain relevant as long as the market remains above the nearest support level with boundaries at 1.3897 — 1.3939. If the market successfully holds below this nearest support, the trend will reverse to the opposite direction (bearish).
USDCAD. Technical analysis. D1.
Australian Dollar (AUDUSD)
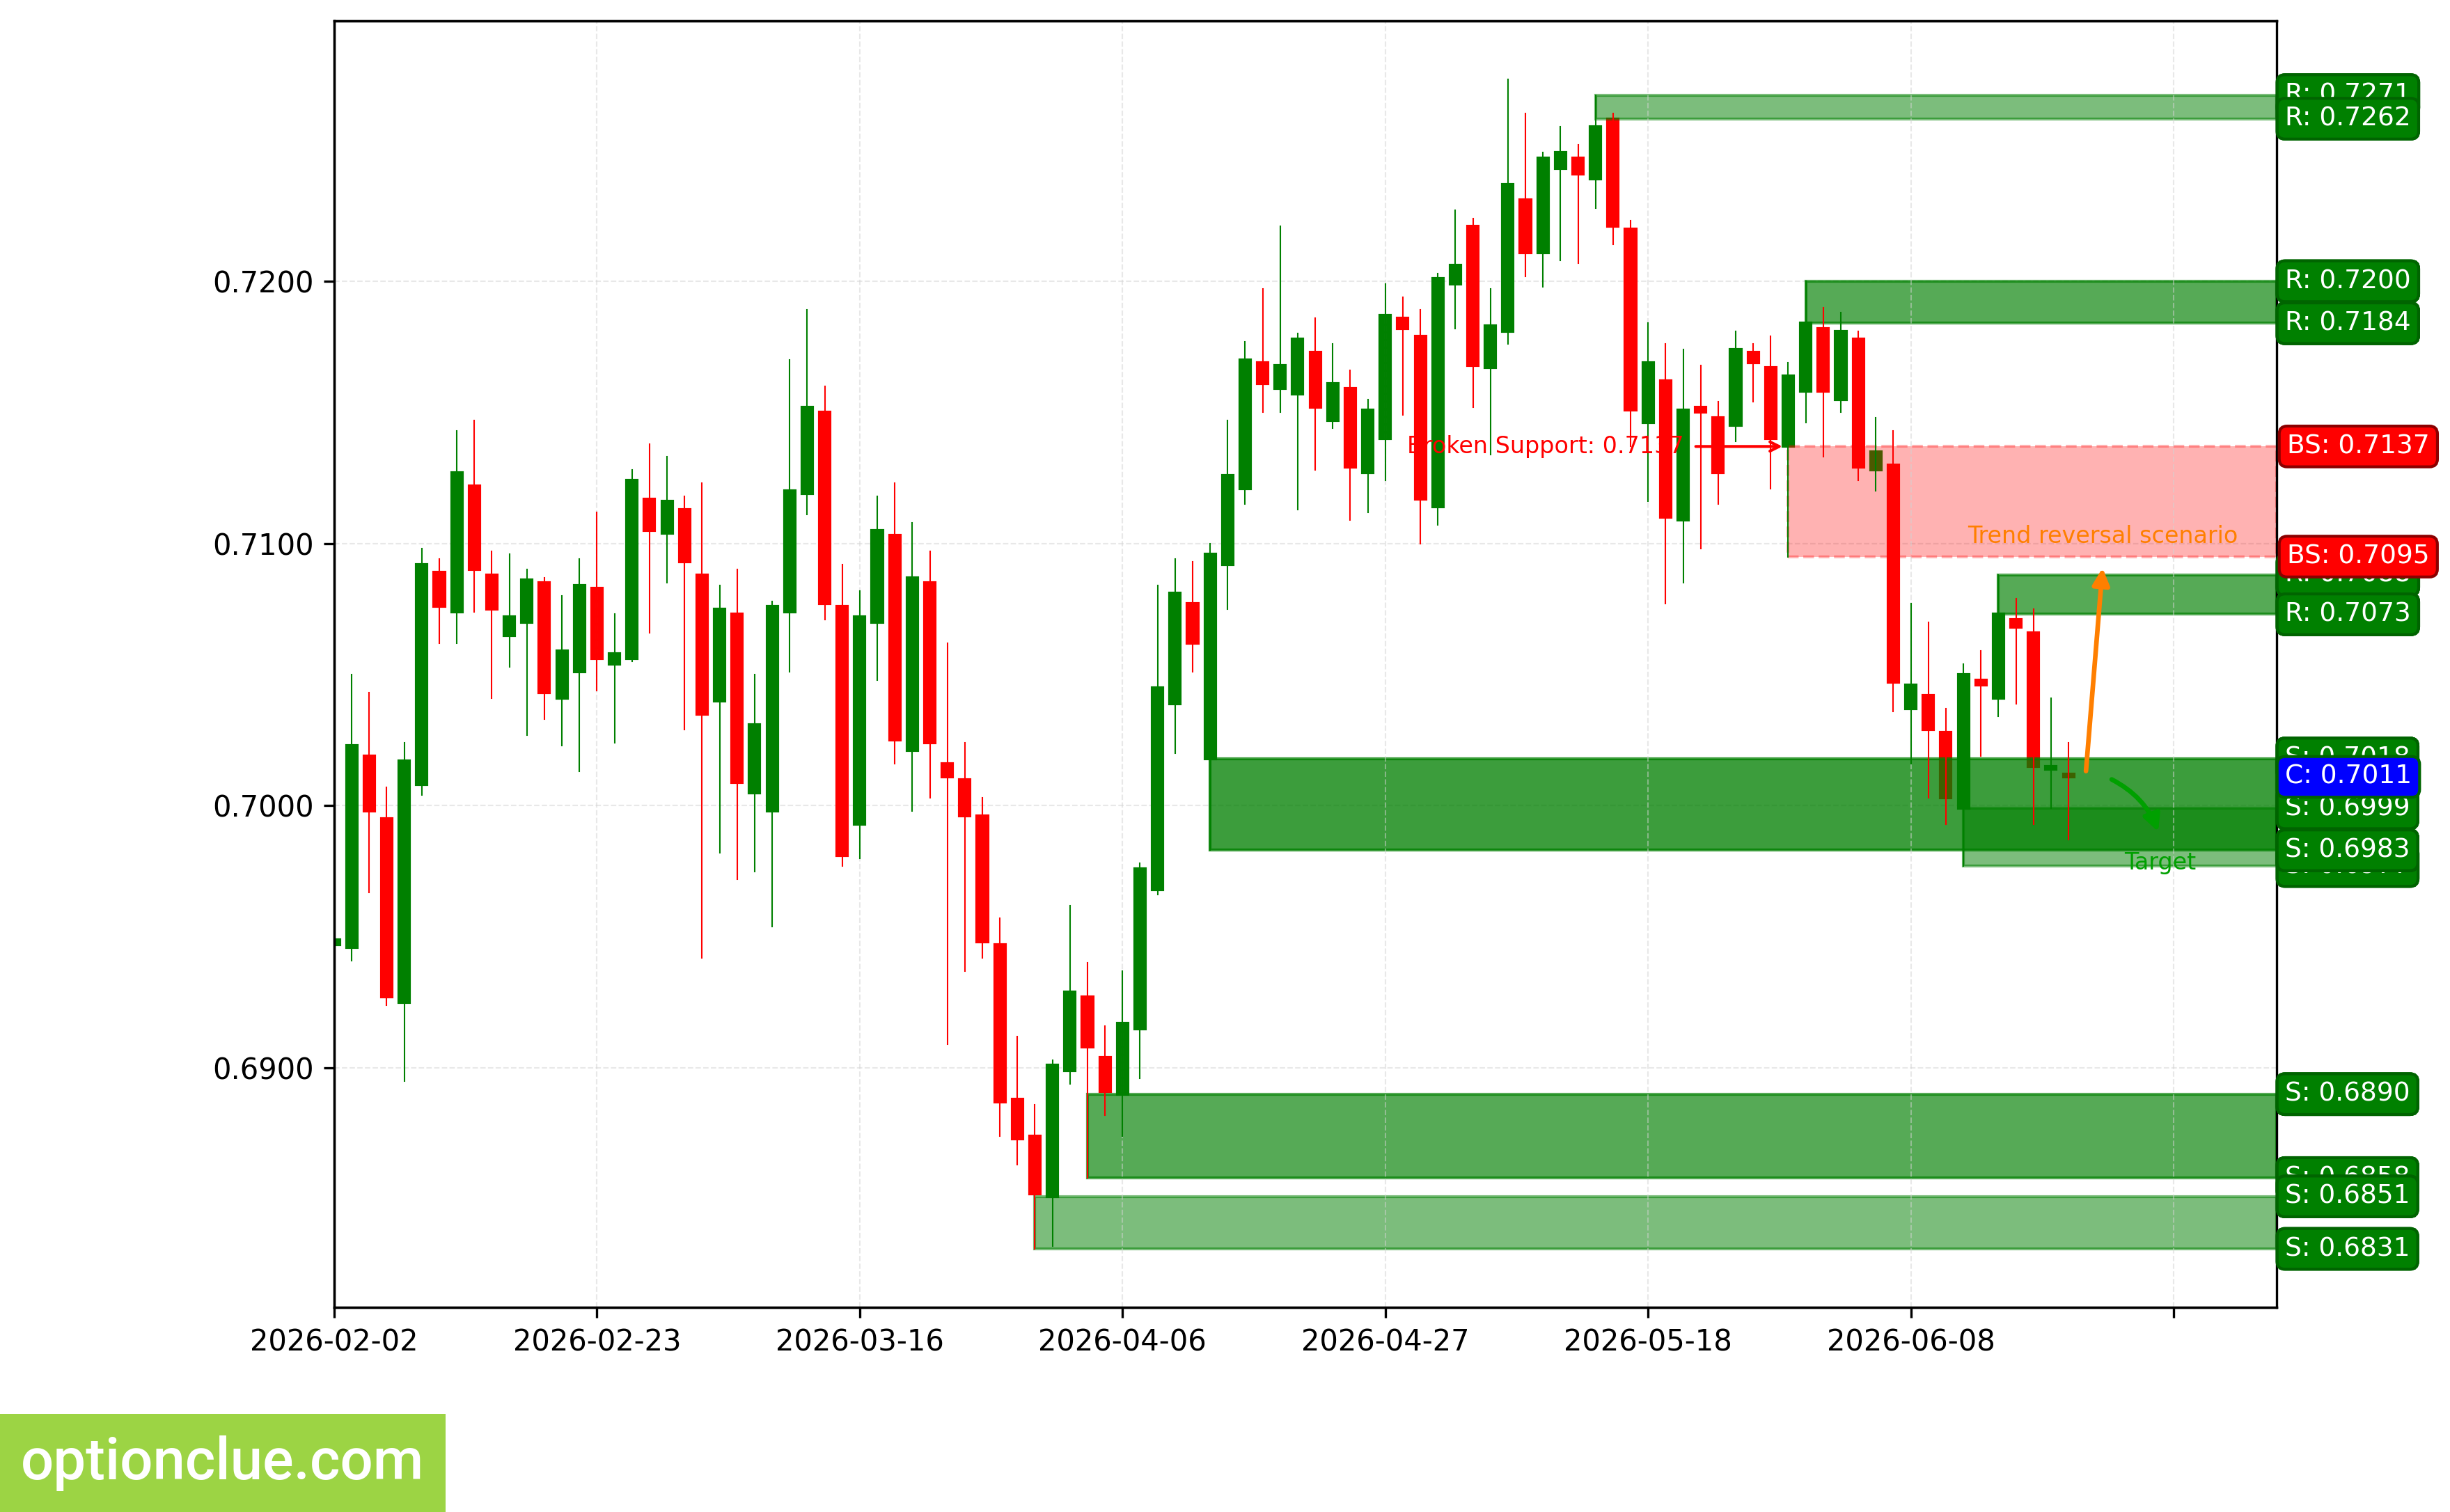
The bearish trend continues; the correction ended 4 candlesticks ago, and an impulse wave is developing. The last broken level is support (0.7095 — 0.7137). The breakout occurred 11 candlesticks ago.
The interim target for the downward move is the support level with boundaries at 0.6977 — 0.6999. If the trend develops successfully, the farther target will be at the support level with boundaries at 0.6858 — 0.6890.
The potential reward-to-risk ratio from current prices, when setting targets and defining risk by daily timeframe levels, may be small (around 0.1:1). When using the farther target, it may also be small (around 0.9:1).
Short positions will remain relevant as long as the market is below the nearest resistance level on the daily timeframe, with boundaries at 0.7073 — 0.7088. If the market successfully holds above this nearest resistance, the trend will reverse to the opposite direction (bullish).
AUDUSD. Technical analysis. D1.
Bitcoin (BTC)
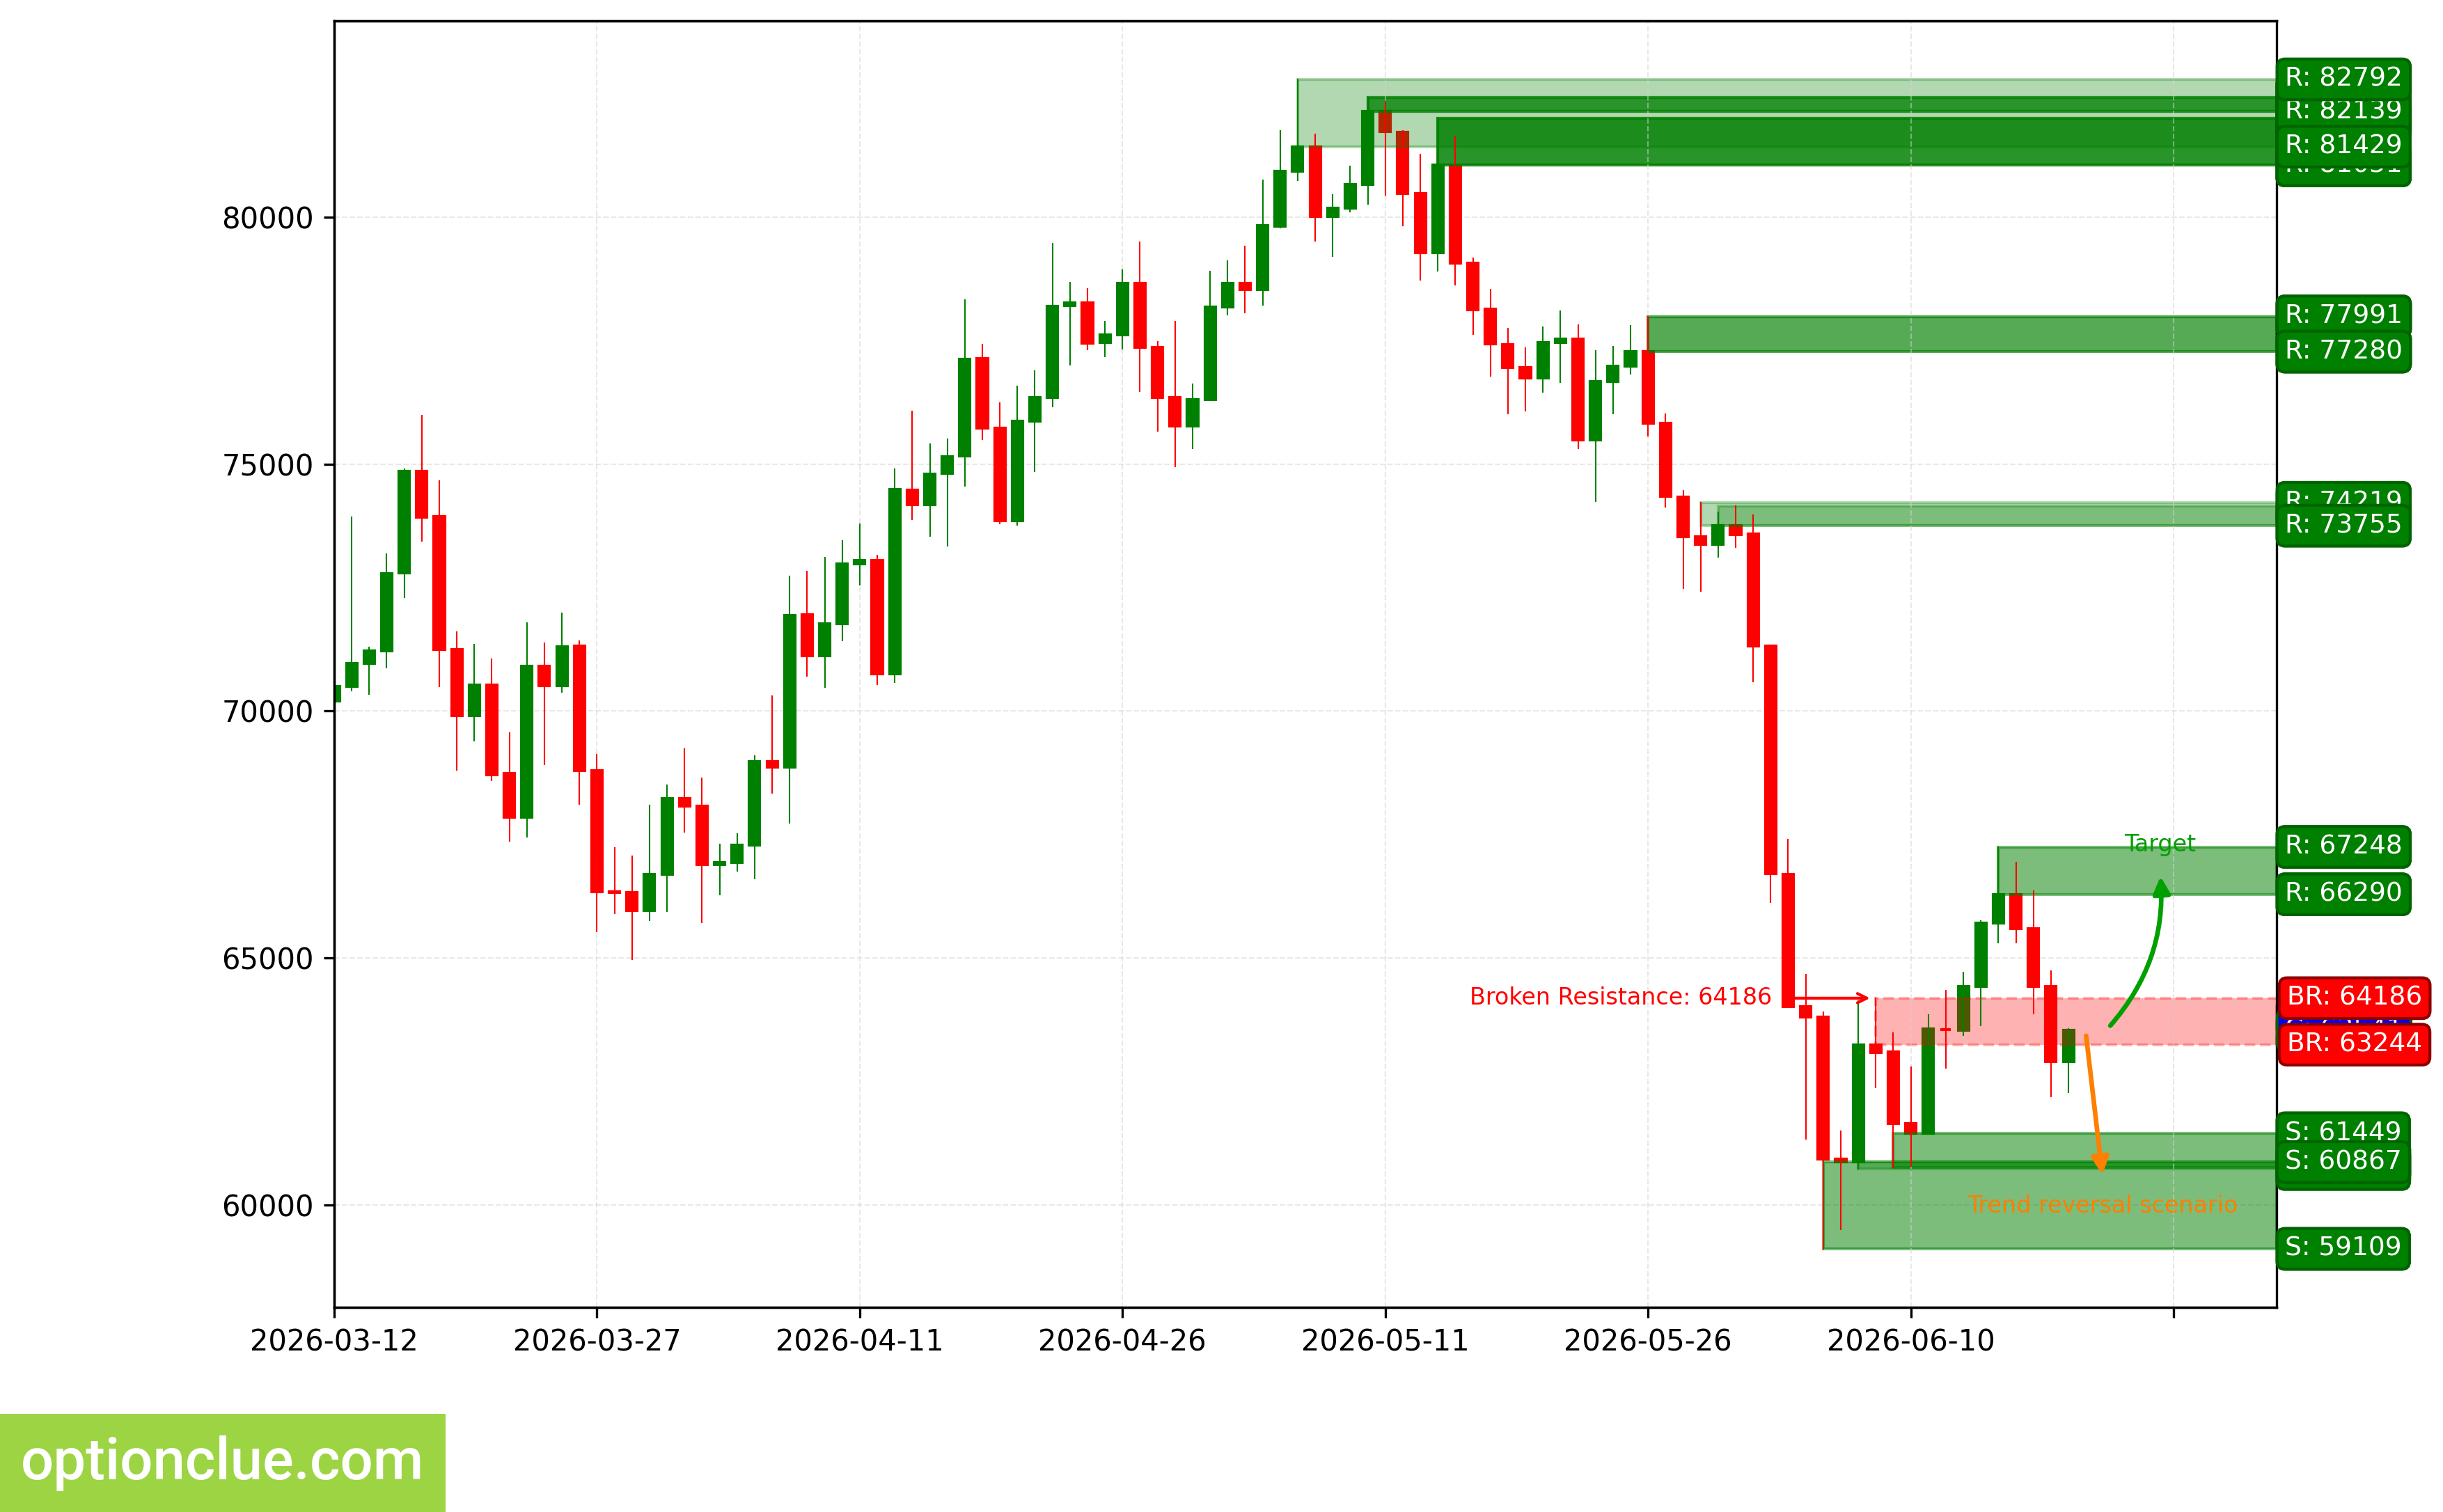
The bullish trend continues, and the price has returned to the last broken level. The last broken level is resistance (63244 — 64186). The breakout occurred 7 candlesticks ago, and the price has returned to this last broken level.
If the upward move resumes, the first target will be the resistance level with boundaries at 66290 — 67248. If the trend develops successfully, the farther target will be at the resistance level with boundaries at 73755 — 74154.
If the next correction ends near the support level (60757 — 61449), the potential reward-to-risk ratio may be around 2:1. If choosing the farther target, it may be around 5:1.
Long positions will remain relevant as long as the market is above the nearest support level on the daily timeframe, with boundaries at 60757 — 61449. If the market successfully holds below this support, the trend will reverse to the opposite direction (bearish).
BTC. Technical analysis. D1.
Ether (ETH)
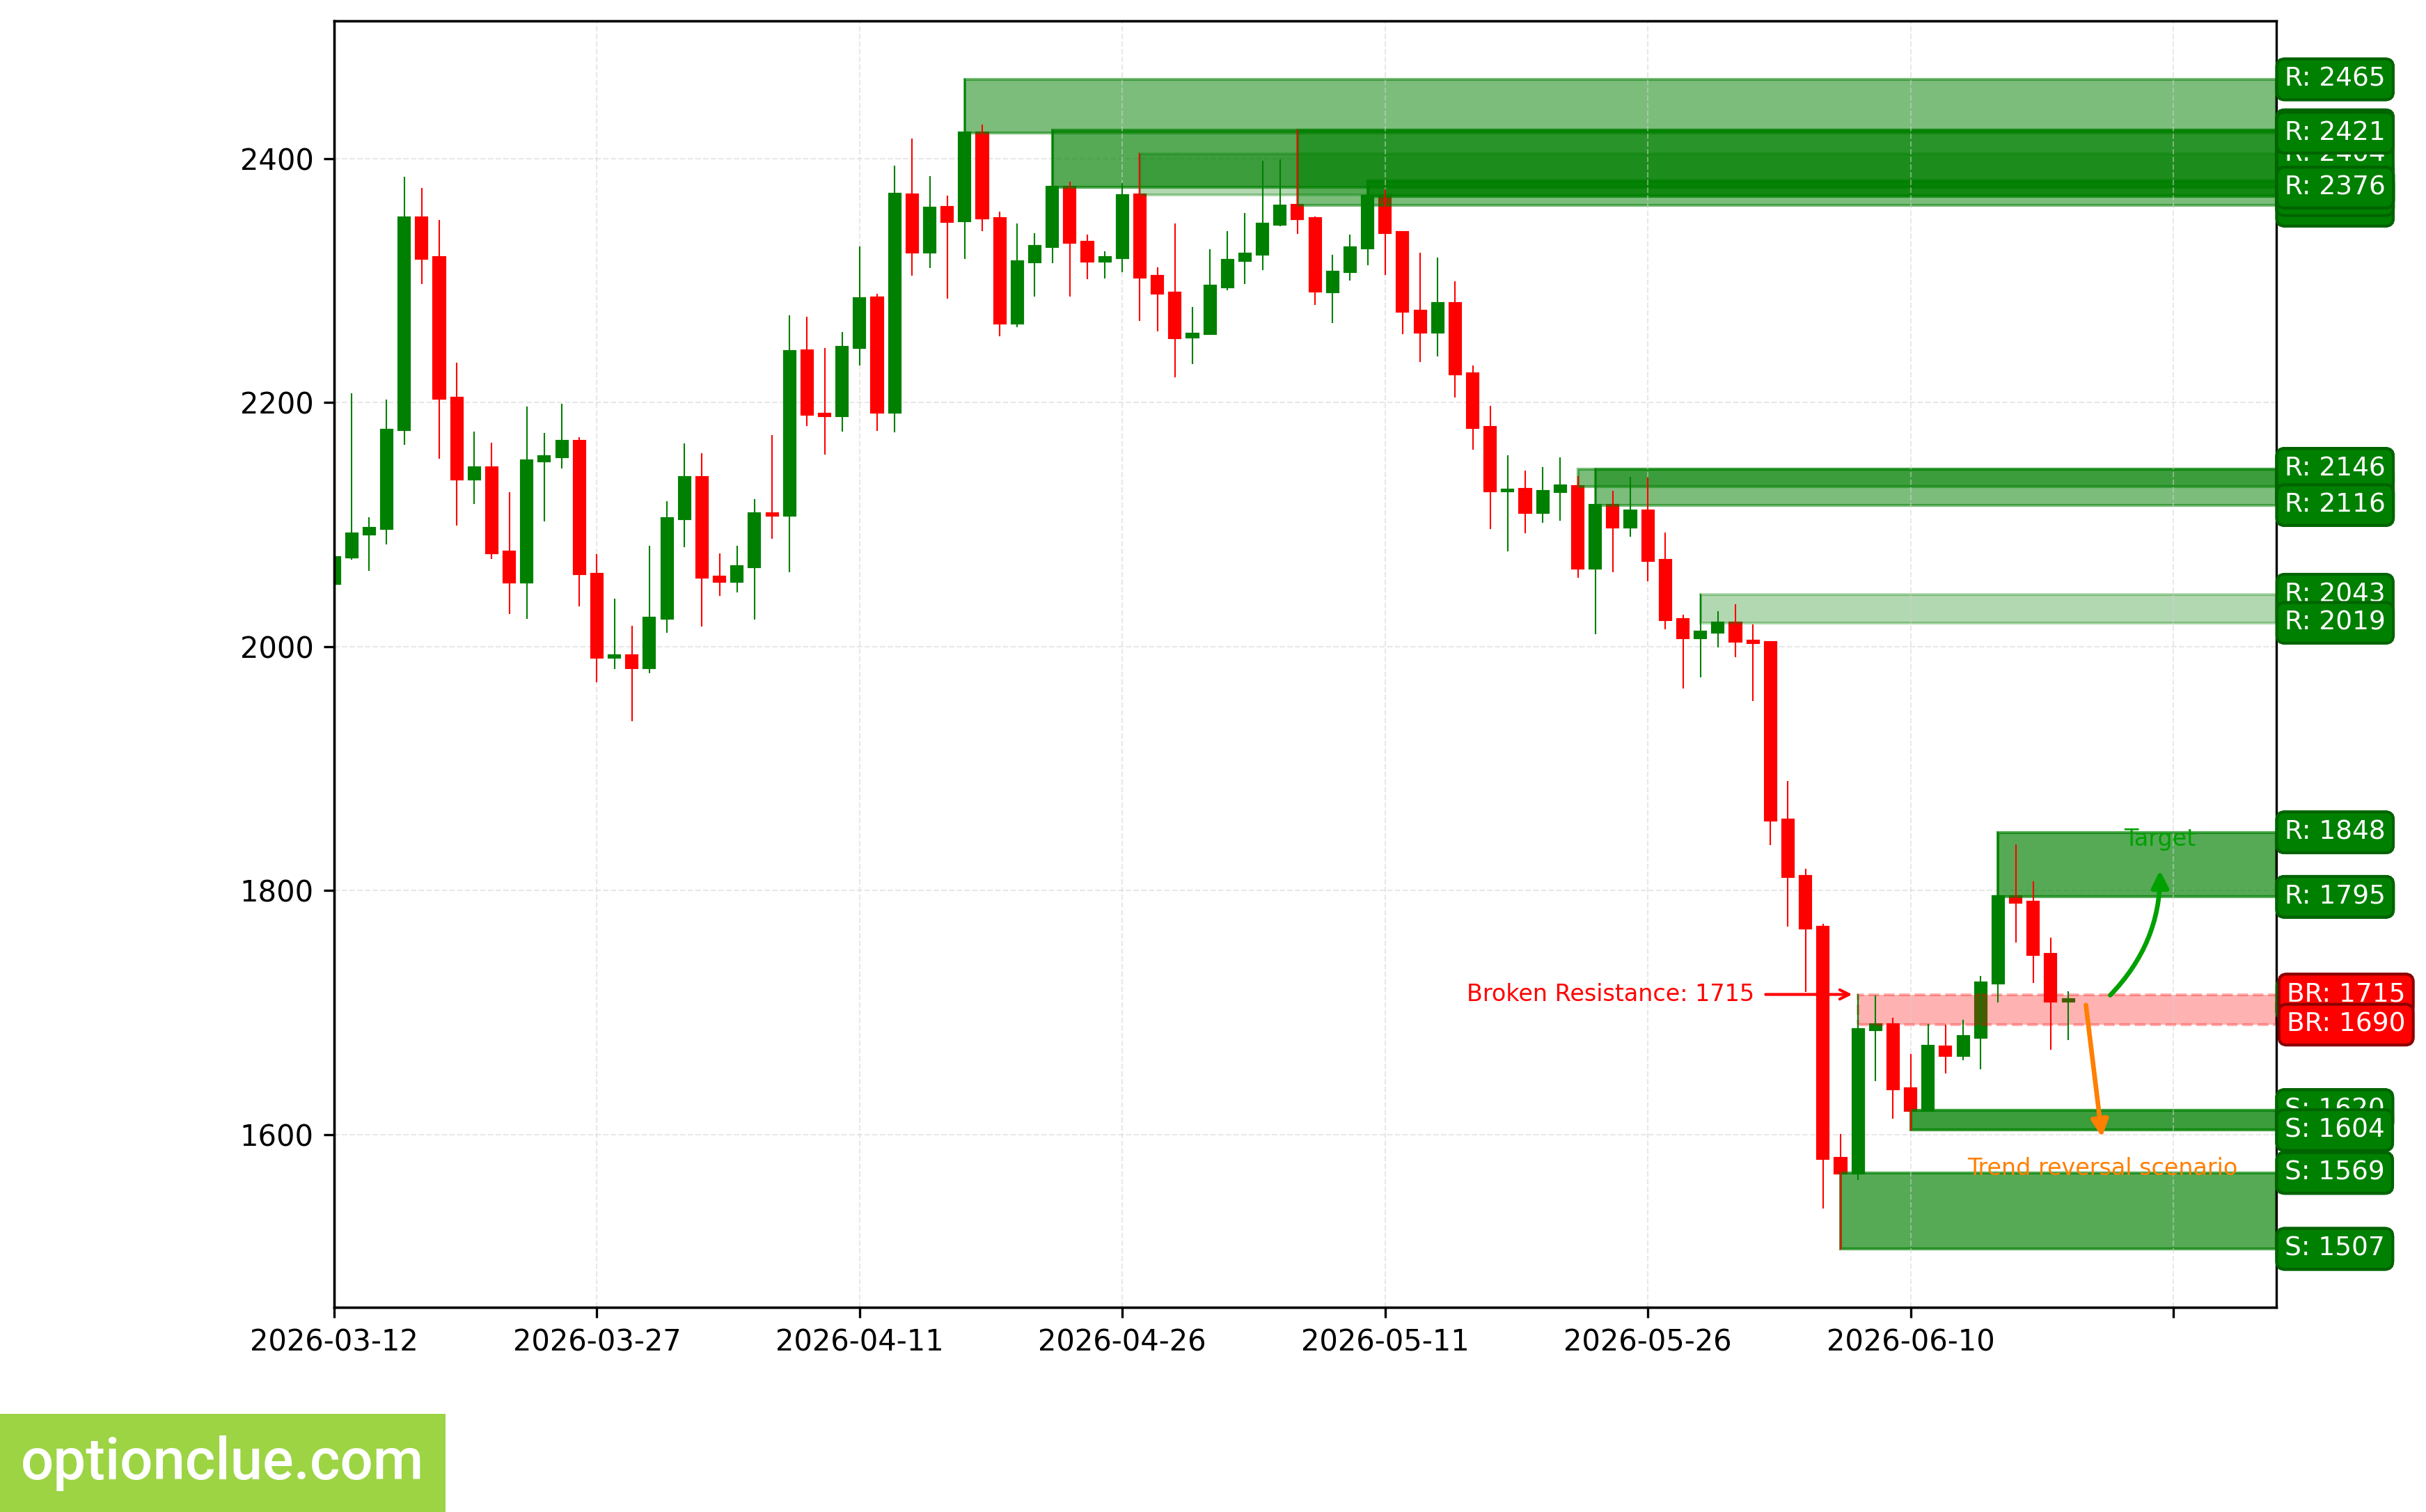
The trend has turned bullish after the resistance level (1690 — 1715) was broken last week. The breakout occurred 6 candlesticks ago, and the price has returned to this last broken level.
If the upward move resumes, the first target will be the resistance level with boundaries at 1795 — 1848. If the trend develops successfully, the farther target will be at the resistance level with boundaries at 2019 — 2043.
If the next correction ends near the support level (1604 — 1620), the potential reward-to-risk ratio may be around 2:1. If choosing the farther target, it may be above 4:1.
Long positions will remain relevant as long as the market is above the nearest support level on the daily timeframe, with boundaries at 1604 — 1620. If the market successfully holds below this nearest support, the trend will reverse to the opposite direction (bearish).
ETH. Technical analysis. D1.
Apple Inc (AAPL)
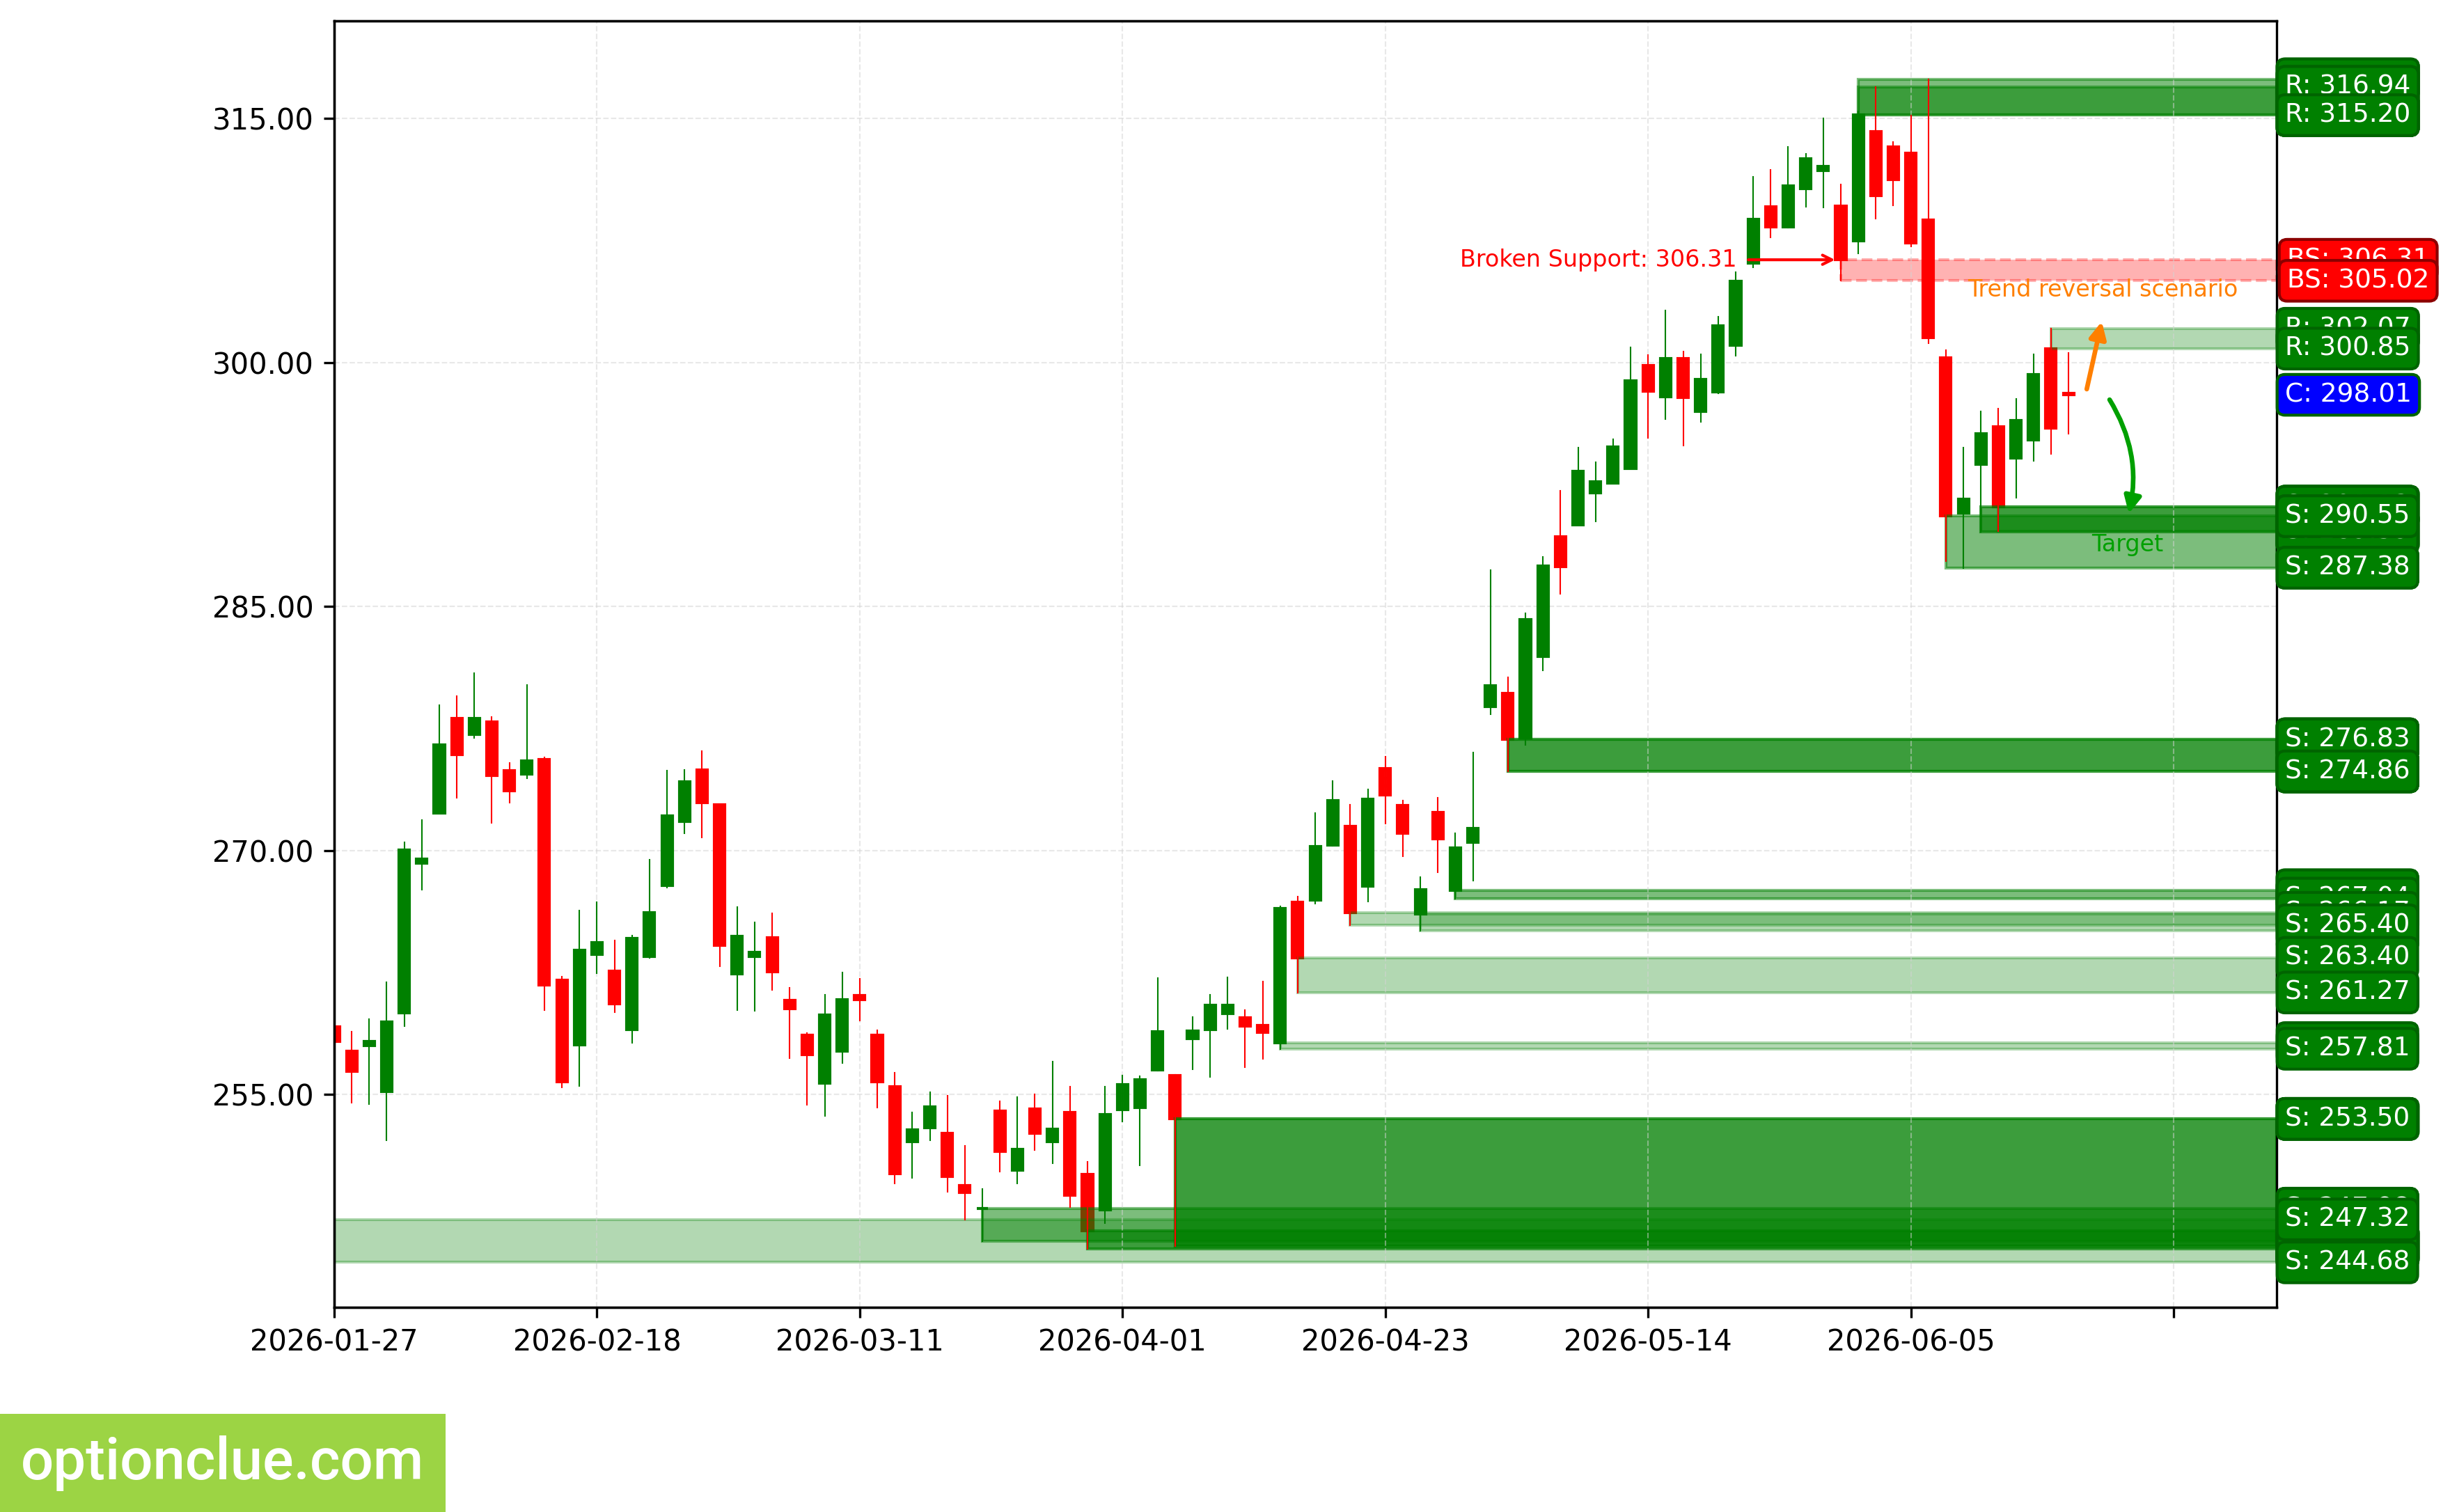
The bearish trend continues, and an impulse wave is developing. The last broken level is support (305.02 — 306.31). The breakout occurred 9 candlesticks ago. New short entry points on a rebound may appear after a correction develops.
The interim target for the downward move is the support level with boundaries at 289.59 — 291.13. If the trend develops successfully, the farther target will be at the support level with boundaries at 274.86 — 276.83.
The potential reward-to-risk ratio from current prices, when setting targets and defining risk by daily timeframe levels, may be small (around 0.5:1). When using the farther target, it may be above 1:1. If the next correction ends near the resistance level (300.85 — 302.07), the potential reward-to-risk ratio may be around 1.1:1. For the farther target, it may be above 2:1.
Short positions will remain relevant as long as the market remains below the nearest resistance level with boundaries at 300.85 — 302.07. If the market successfully holds above this nearest resistance, the trend will reverse to the opposite direction (bullish).
AAPL. Technical analysis. D1.
NVIDIA Corp (NVDA)
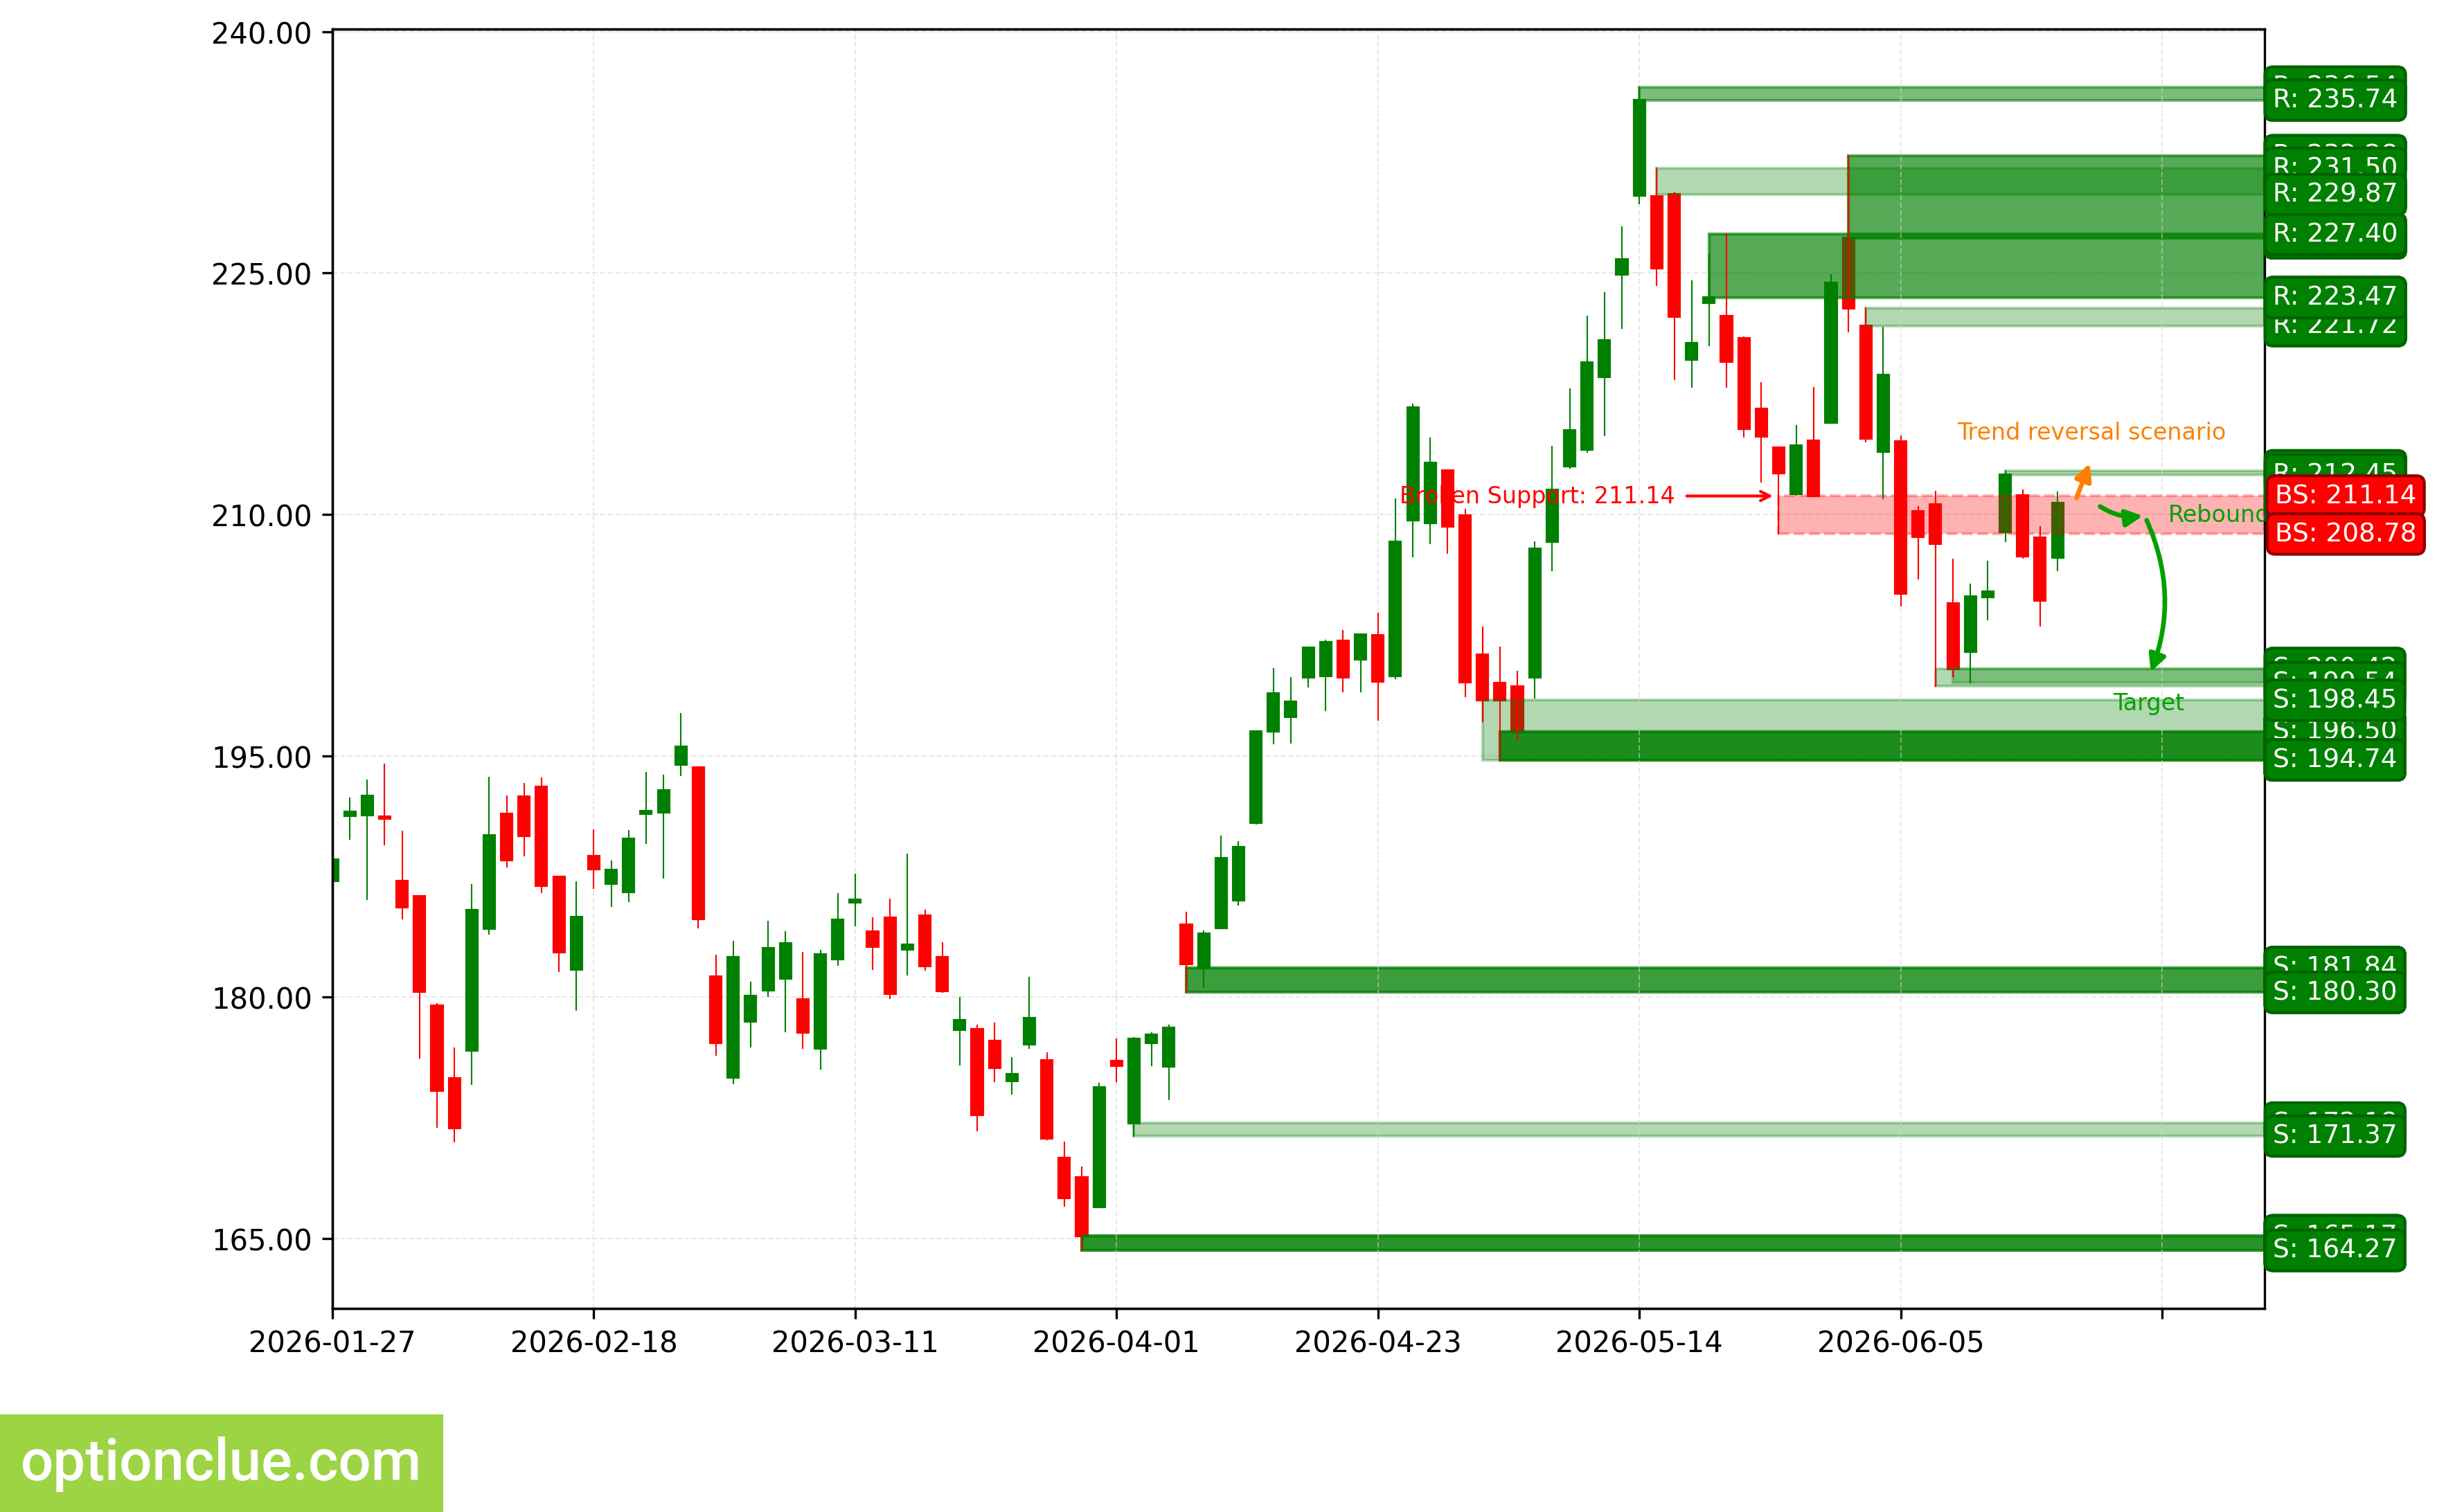
The bearish trend continues; the correction ended 3 candlesticks ago, and an impulse wave is developing. The last broken level is support (208.78 — 211.14). The breakout occurred 10 candlesticks ago, and the price has returned to this last broken level.
The interim target for the downward move is the support level with boundaries at 199.34 — 200.42. If the trend develops successfully, the farther target will be at the support level with boundaries at 180.30 — 181.84.
From current prices, the reward-to-risk ratio when setting targets and defining risk by daily timeframe levels is around 1:1. When using the farther target, it is above 2:1.
Short positions will remain relevant as long as the market remains below the nearest resistance level with boundaries at 212.45 — 212.71. If the market successfully holds above this nearest resistance, the trend will reverse to the opposite direction (bullish).
NVDA. Technical analysis. D1.
Tesla Inc (TSLA)
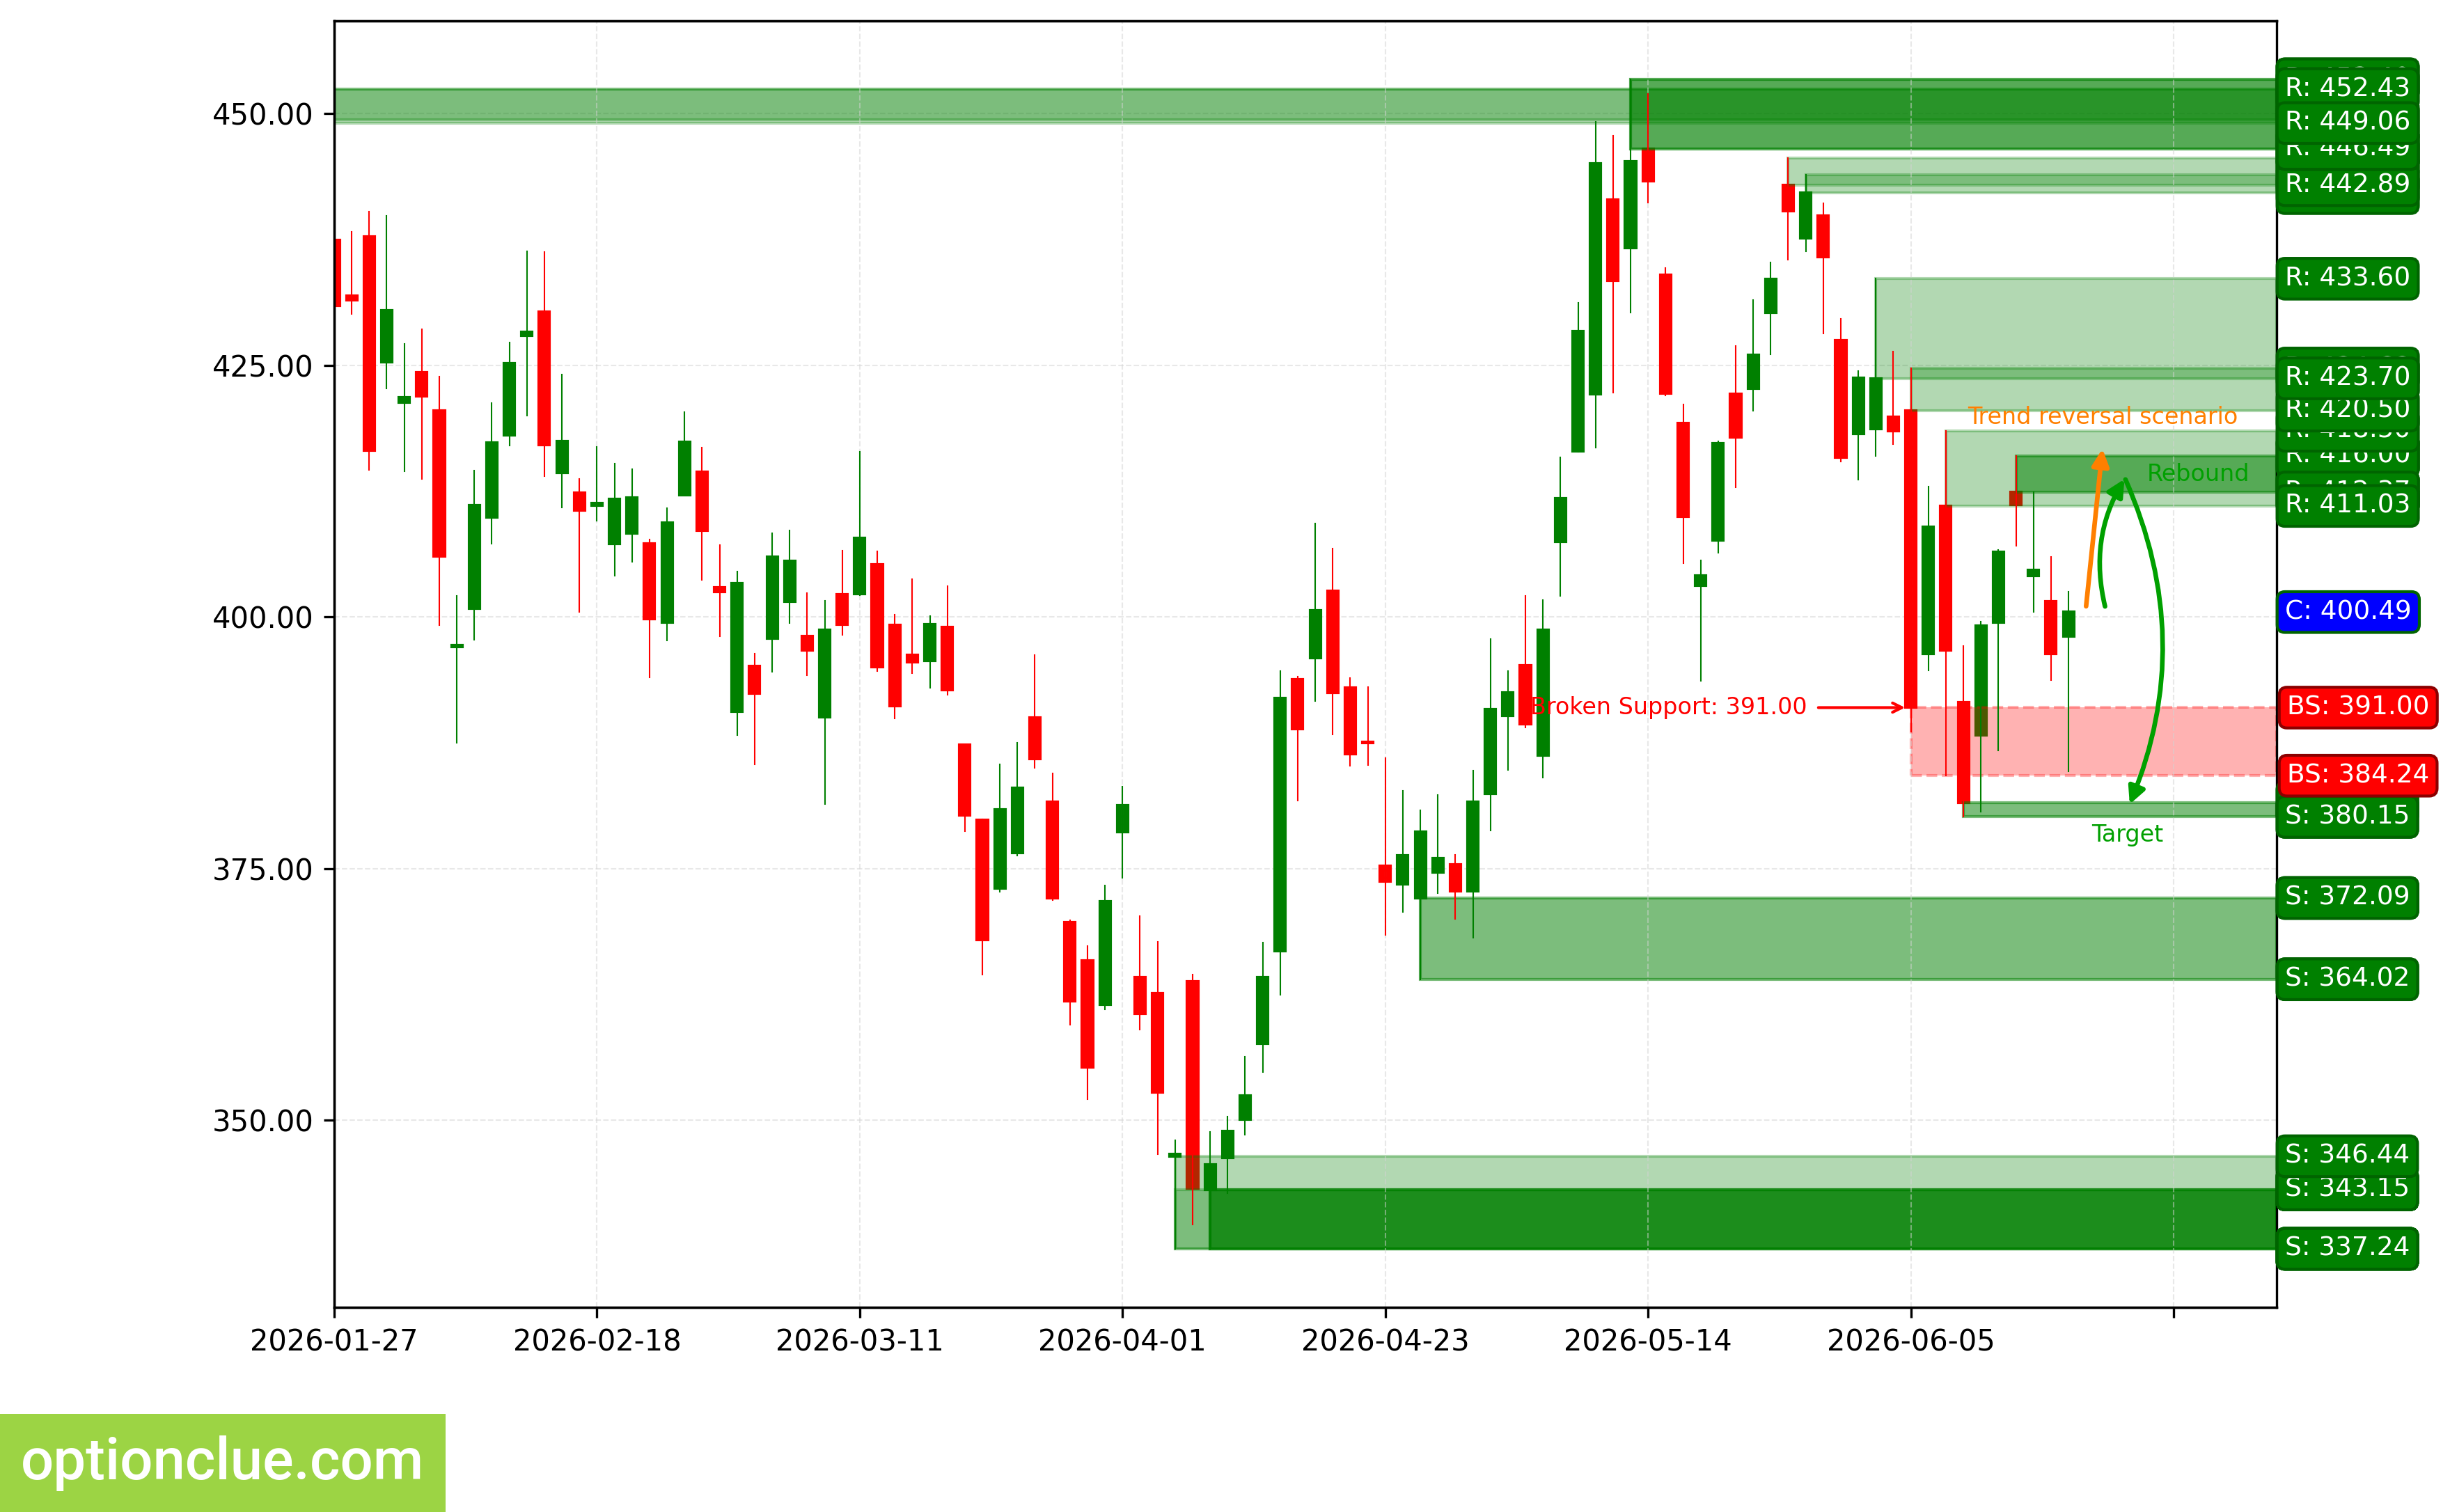
The bearish trend continues, and a corrective wave is developing. A short entry point on a rebound may form after the current correction is completed. The last broken level is support (384.24 — 391.00). The breakout occurred 7 candlesticks ago.
If the downward move resumes, the first target will be the support level with boundaries at 380.15 — 381.59. If the trend develops successfully, the farther target will be at the support level with boundaries at 337.25 — 343.15.
If the next correction ends near the resistance level (412.37 — 416.00), the potential reward-to-risk ratio may be above 1:1. For the farther target, it may be above 3:1.
Short positions will remain relevant as long as the market remains below the nearest resistance level with boundaries at 412.37 — 416.00. If the market successfully holds above this nearest resistance, the trend will reverse to the opposite direction (bullish).
TSLA. Technical analysis. D1.
Summary
From the standpoint of medium-term trading, the financial instruments with a correction close to completion on Daily and/or a potentially most attractive reward-to-risk ratio are: BTC, ETH. The following may become worthy of attention soon, depending on the depth of the market correction: EURUSD, GBPUSD, USDJPY.
The other financial instruments on the trading list may also be of interest, but conditions for a rebound on the daily timeframe in these markets will likely appear no earlier than in a week.