
We are reviewing the most important levels on key financial instruments and probable development scenarios.
Key Topics
- Euro (EURUSD)
- British Pound (GBPUSD)
- Swiss Franc (USDCHF)
- Japanese Yen (USDJPY)
- Canadian Dollar (USDCAD)
- Australian Dollar (AUDUSD)
- Ether (ETH)
- Apple Inc (AAPL)
- NVIDIA Corp (NVDA)
- Tesla Inc (TSLA)
- Summary
Euro (EURUSD)
Bullish trend continues, correction completed 7 candlesticks ago, impulse wave is developing. The last broken level is resistance (1.1590 — 1.1627). Breakout occurred 9 candlesticks ago.
Intermediate target for upside movement is the resistance level with boundaries 1.1895 — 1.1929. In case of successful trend development, a further target will be at the resistance level with boundaries 1.2041 — 1.2083.
Potential profit/risk ratio from current prices when setting targets and fixing risks at daily timeframe levels may be small (about 0.2:1). When using the further target — also small (approximately 0.6:1).
Long positions will remain relevant as long as the market is above the nearest support level with boundaries 1.1471 — 1.1521. If the market successfully settles below this support, the trend will reverse to the opposite (bearish).
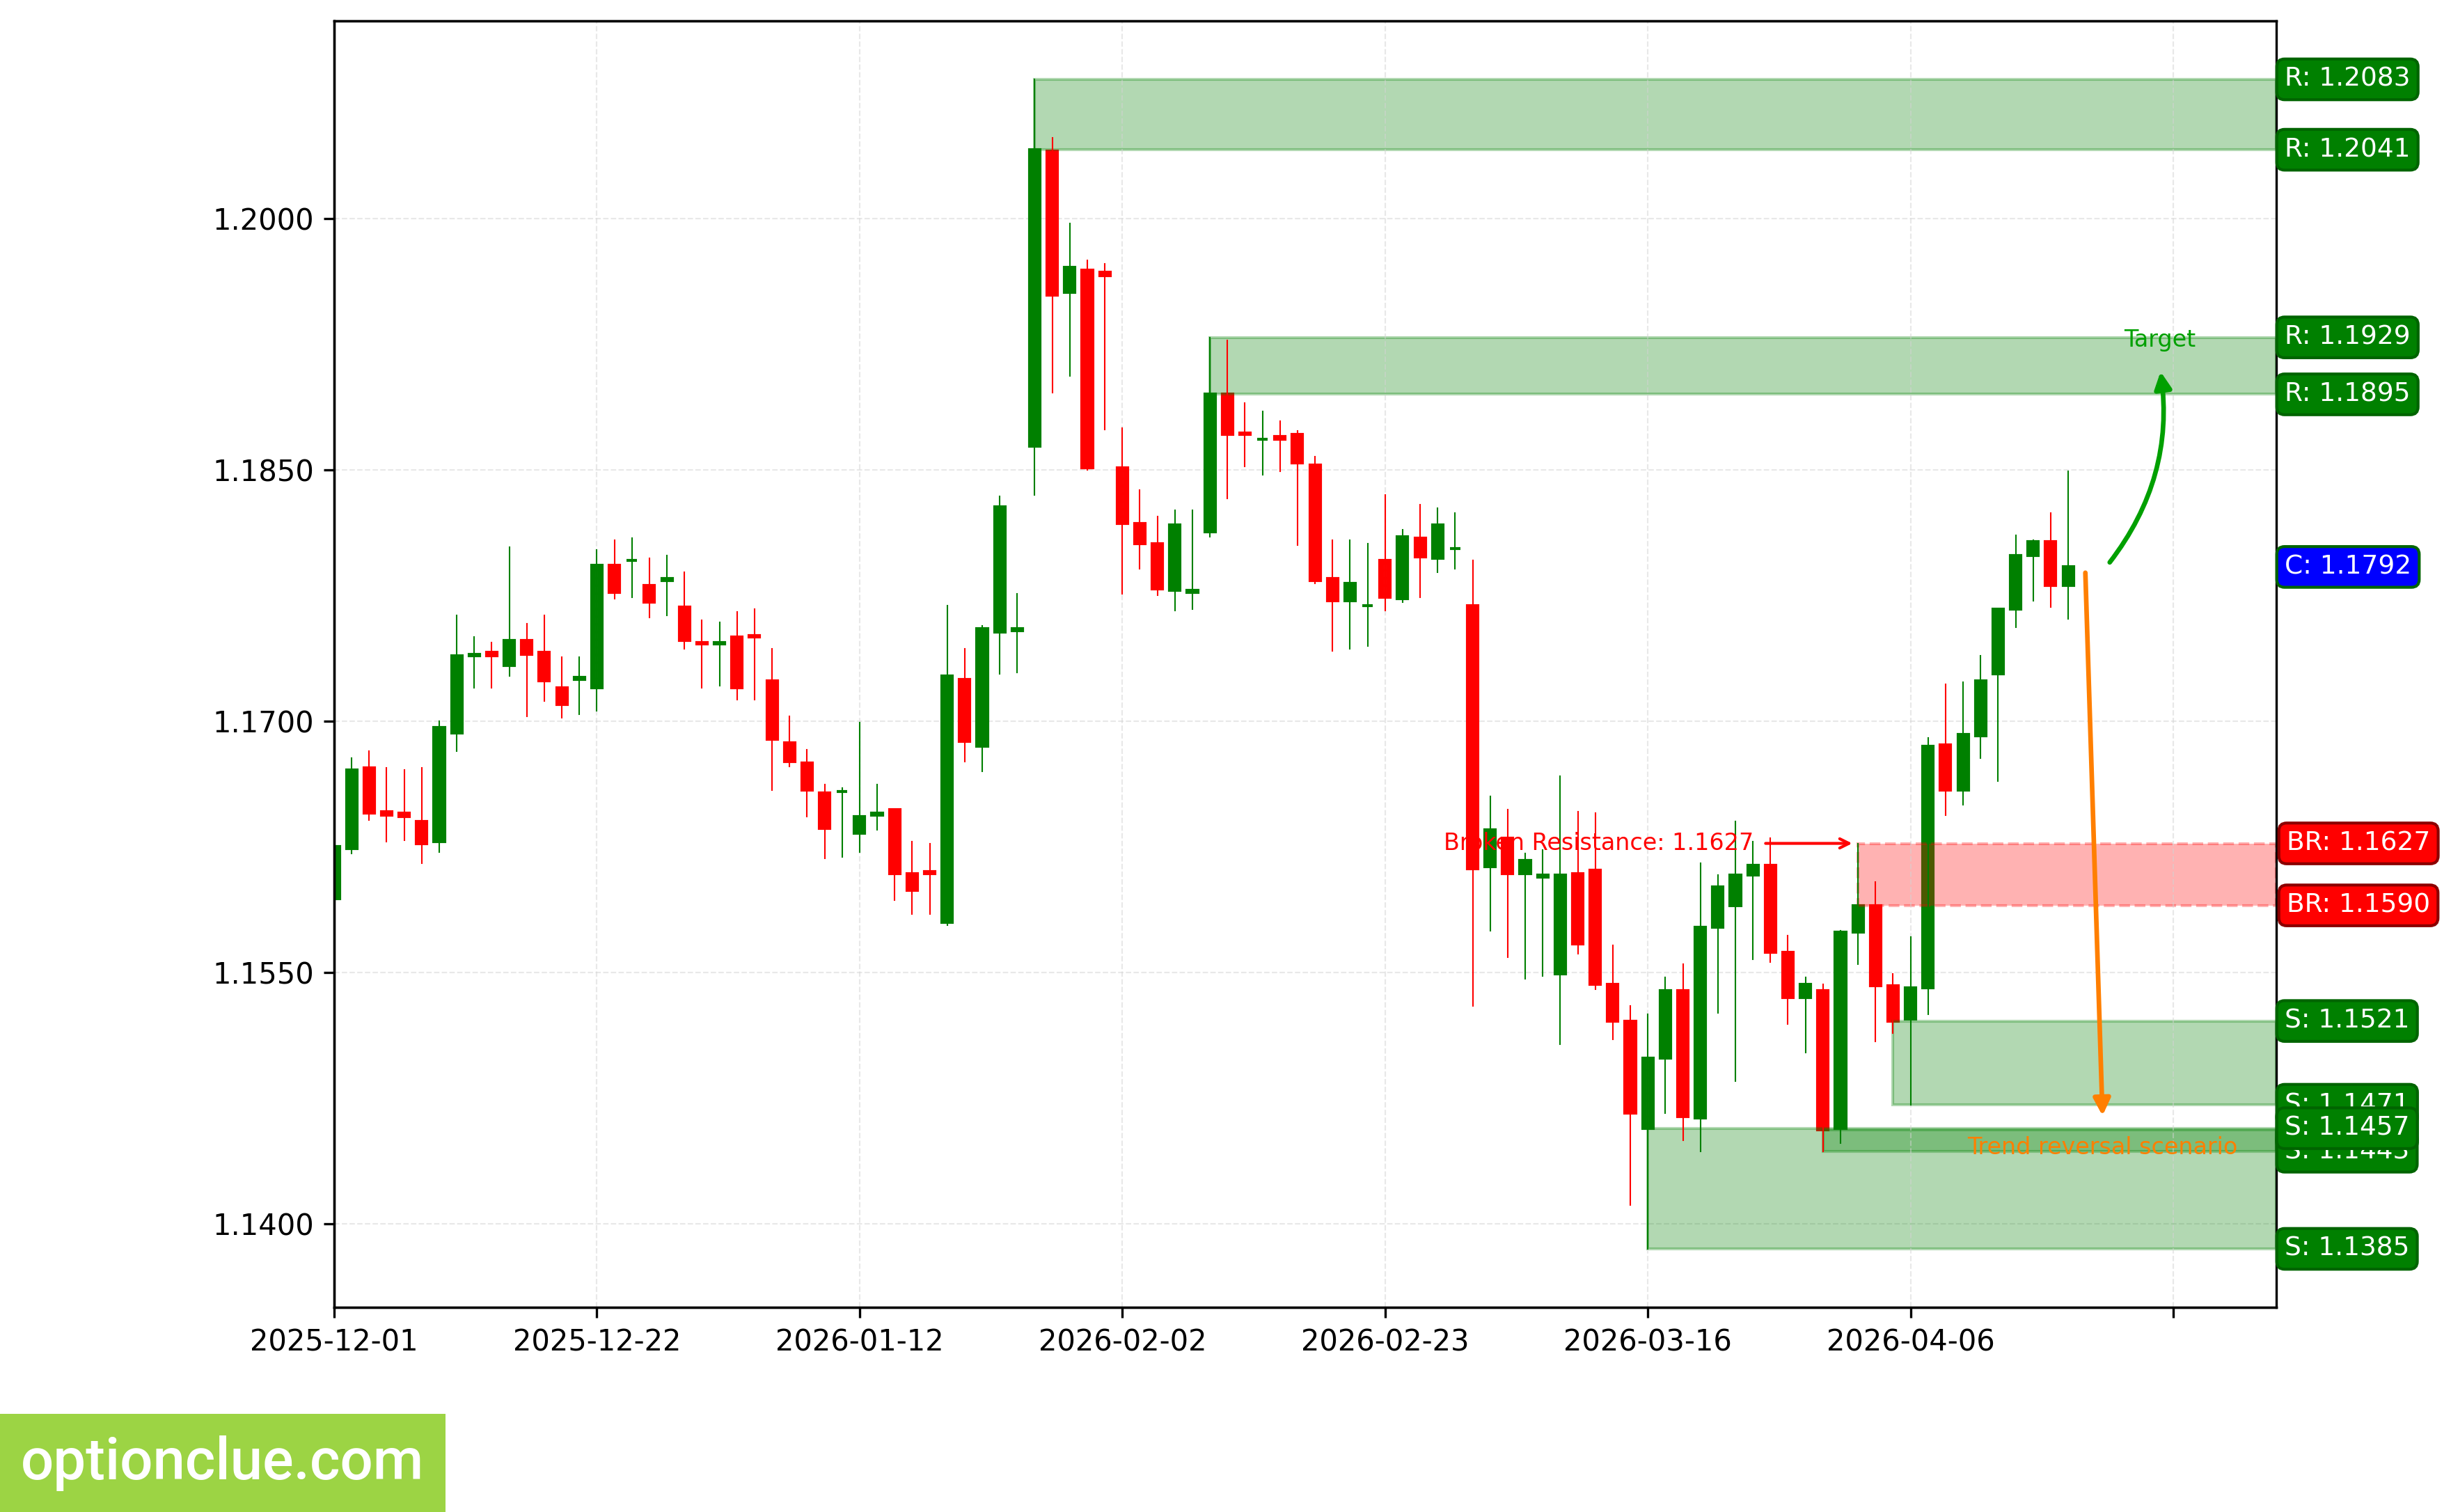
EURUSD. Technical analysis. D1.
British Pound (GBPUSD)
Bullish trend continues, correction wave is developing. Entry point for buy on rebound may form after completion of the current correction. The last broken level is resistance (1.3302 — 1.3347). Breakout occurred 9 candlesticks ago.
Intermediate target for upside movement is the resistance level with boundaries 1.3575 — 1.3595. In case of successful trend development, a further target will be at the resistance level with boundaries 1.3683 — 1.3712.
Potential profit/risk ratio from current prices when setting targets and fixing risks at daily timeframe levels may be small (about 0.1:1). When using the further target — also small (approximately 0.3:1). If correction completes near the support level (1.3156 — 1.3196), potential profit/risk ratio may be around 3:1. When selecting the further target — approximately 4:1. If correction completes near the last broken level (1.3302 — 1.3347), potential profit/risk ratio may be small (approximately 0.9:1). For the further target — approximately 1.3:1.
Long positions will remain relevant as long as the market is above the nearest support level with boundaries 1.3156 — 1.3196. If the market successfully settles below this nearest support, the trend will reverse to the opposite (bearish).
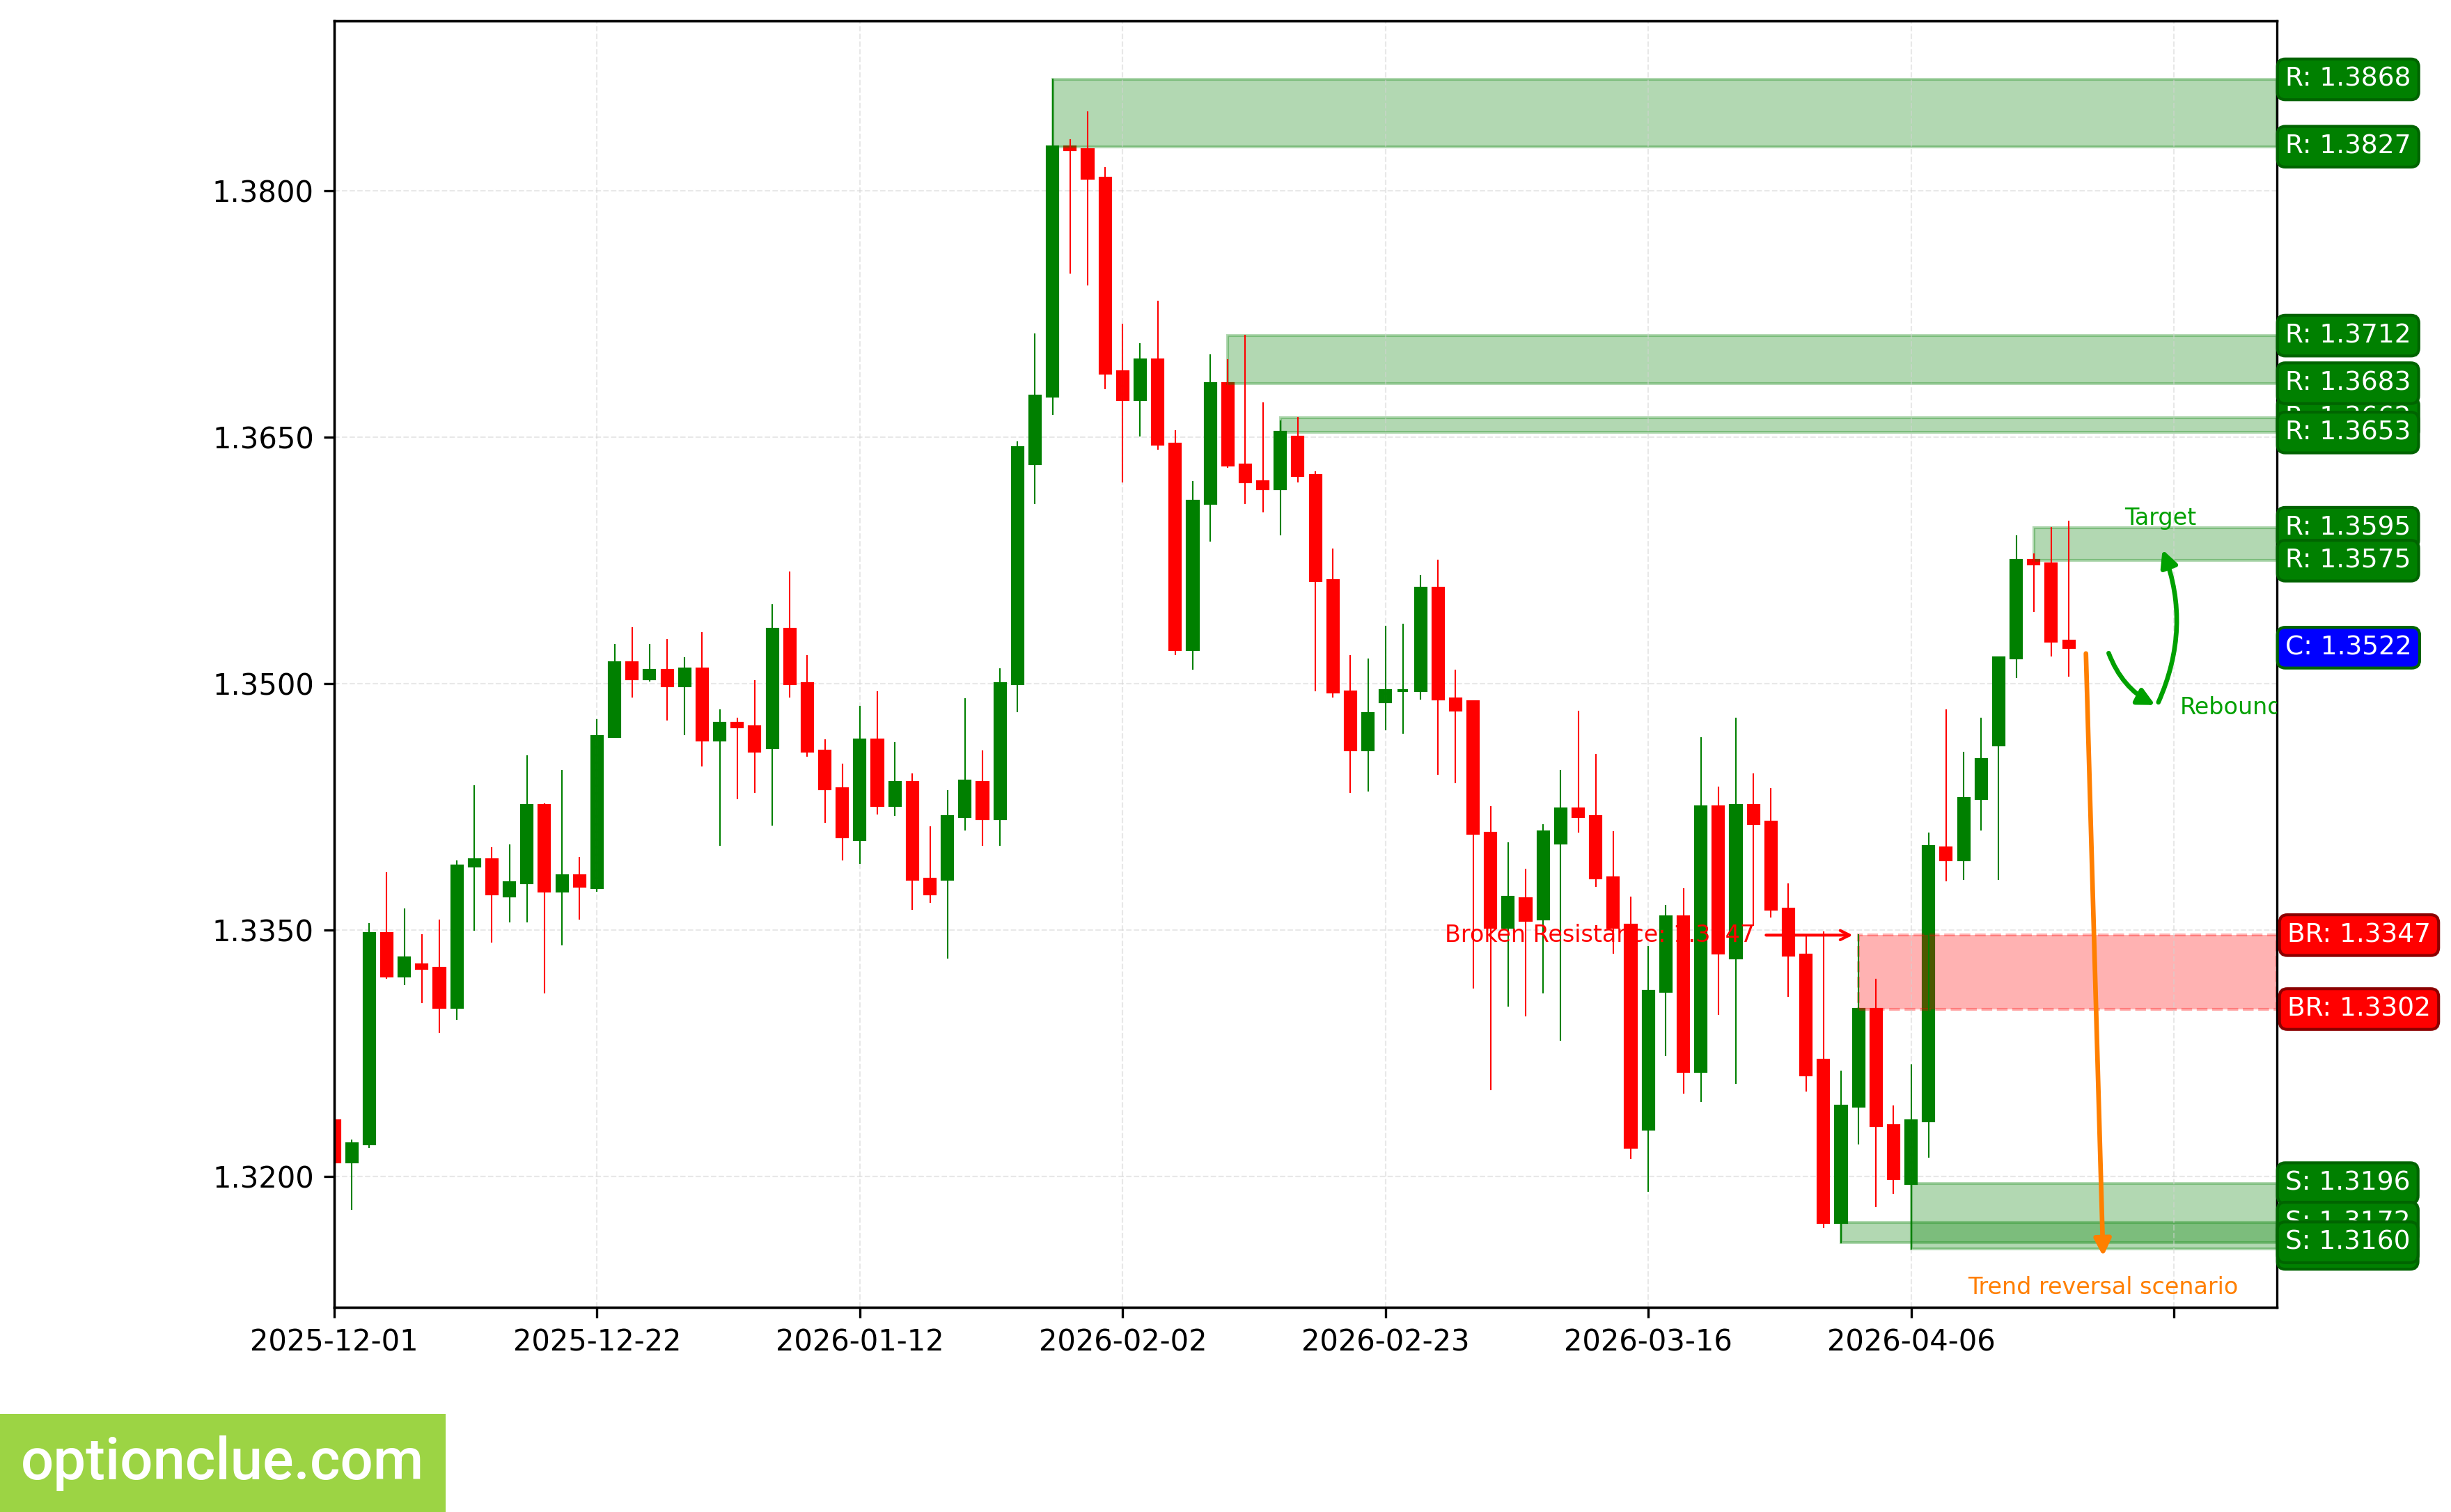
GBPUSD. Technical analysis. D1.
Swiss Franc (USDCHF)
Trend has reversed to bearish 4 candlesticks ago when support level (0.7832 — 0.7861) was broken. Correction wave is developing. Short entry points may appear after completion of the current correction.
Intermediate target for downside movement is the support level with boundaries 0.7788 — 0.7809. In case of successful trend development, a further target will be at the support level with boundaries 0.7665 — 0.7677.
If the new correction completes near the resistance level (0.7995 — 0.8042), potential profit/risk ratio may be approximately 2:1. When using the further target — more than 3:1. If correction completes near the last broken level (0.7832 — 0.7861), potential profit/risk ratio may be small (about 0.1:1). When selecting the further target — also small (approximately 0.6:1).
Short positions will remain relevant as long as the market remains below the nearest resistance level with boundaries 0.7995 — 0.8042. If the market successfully settles above this nearest resistance, the trend will reverse to the opposite (bullish).
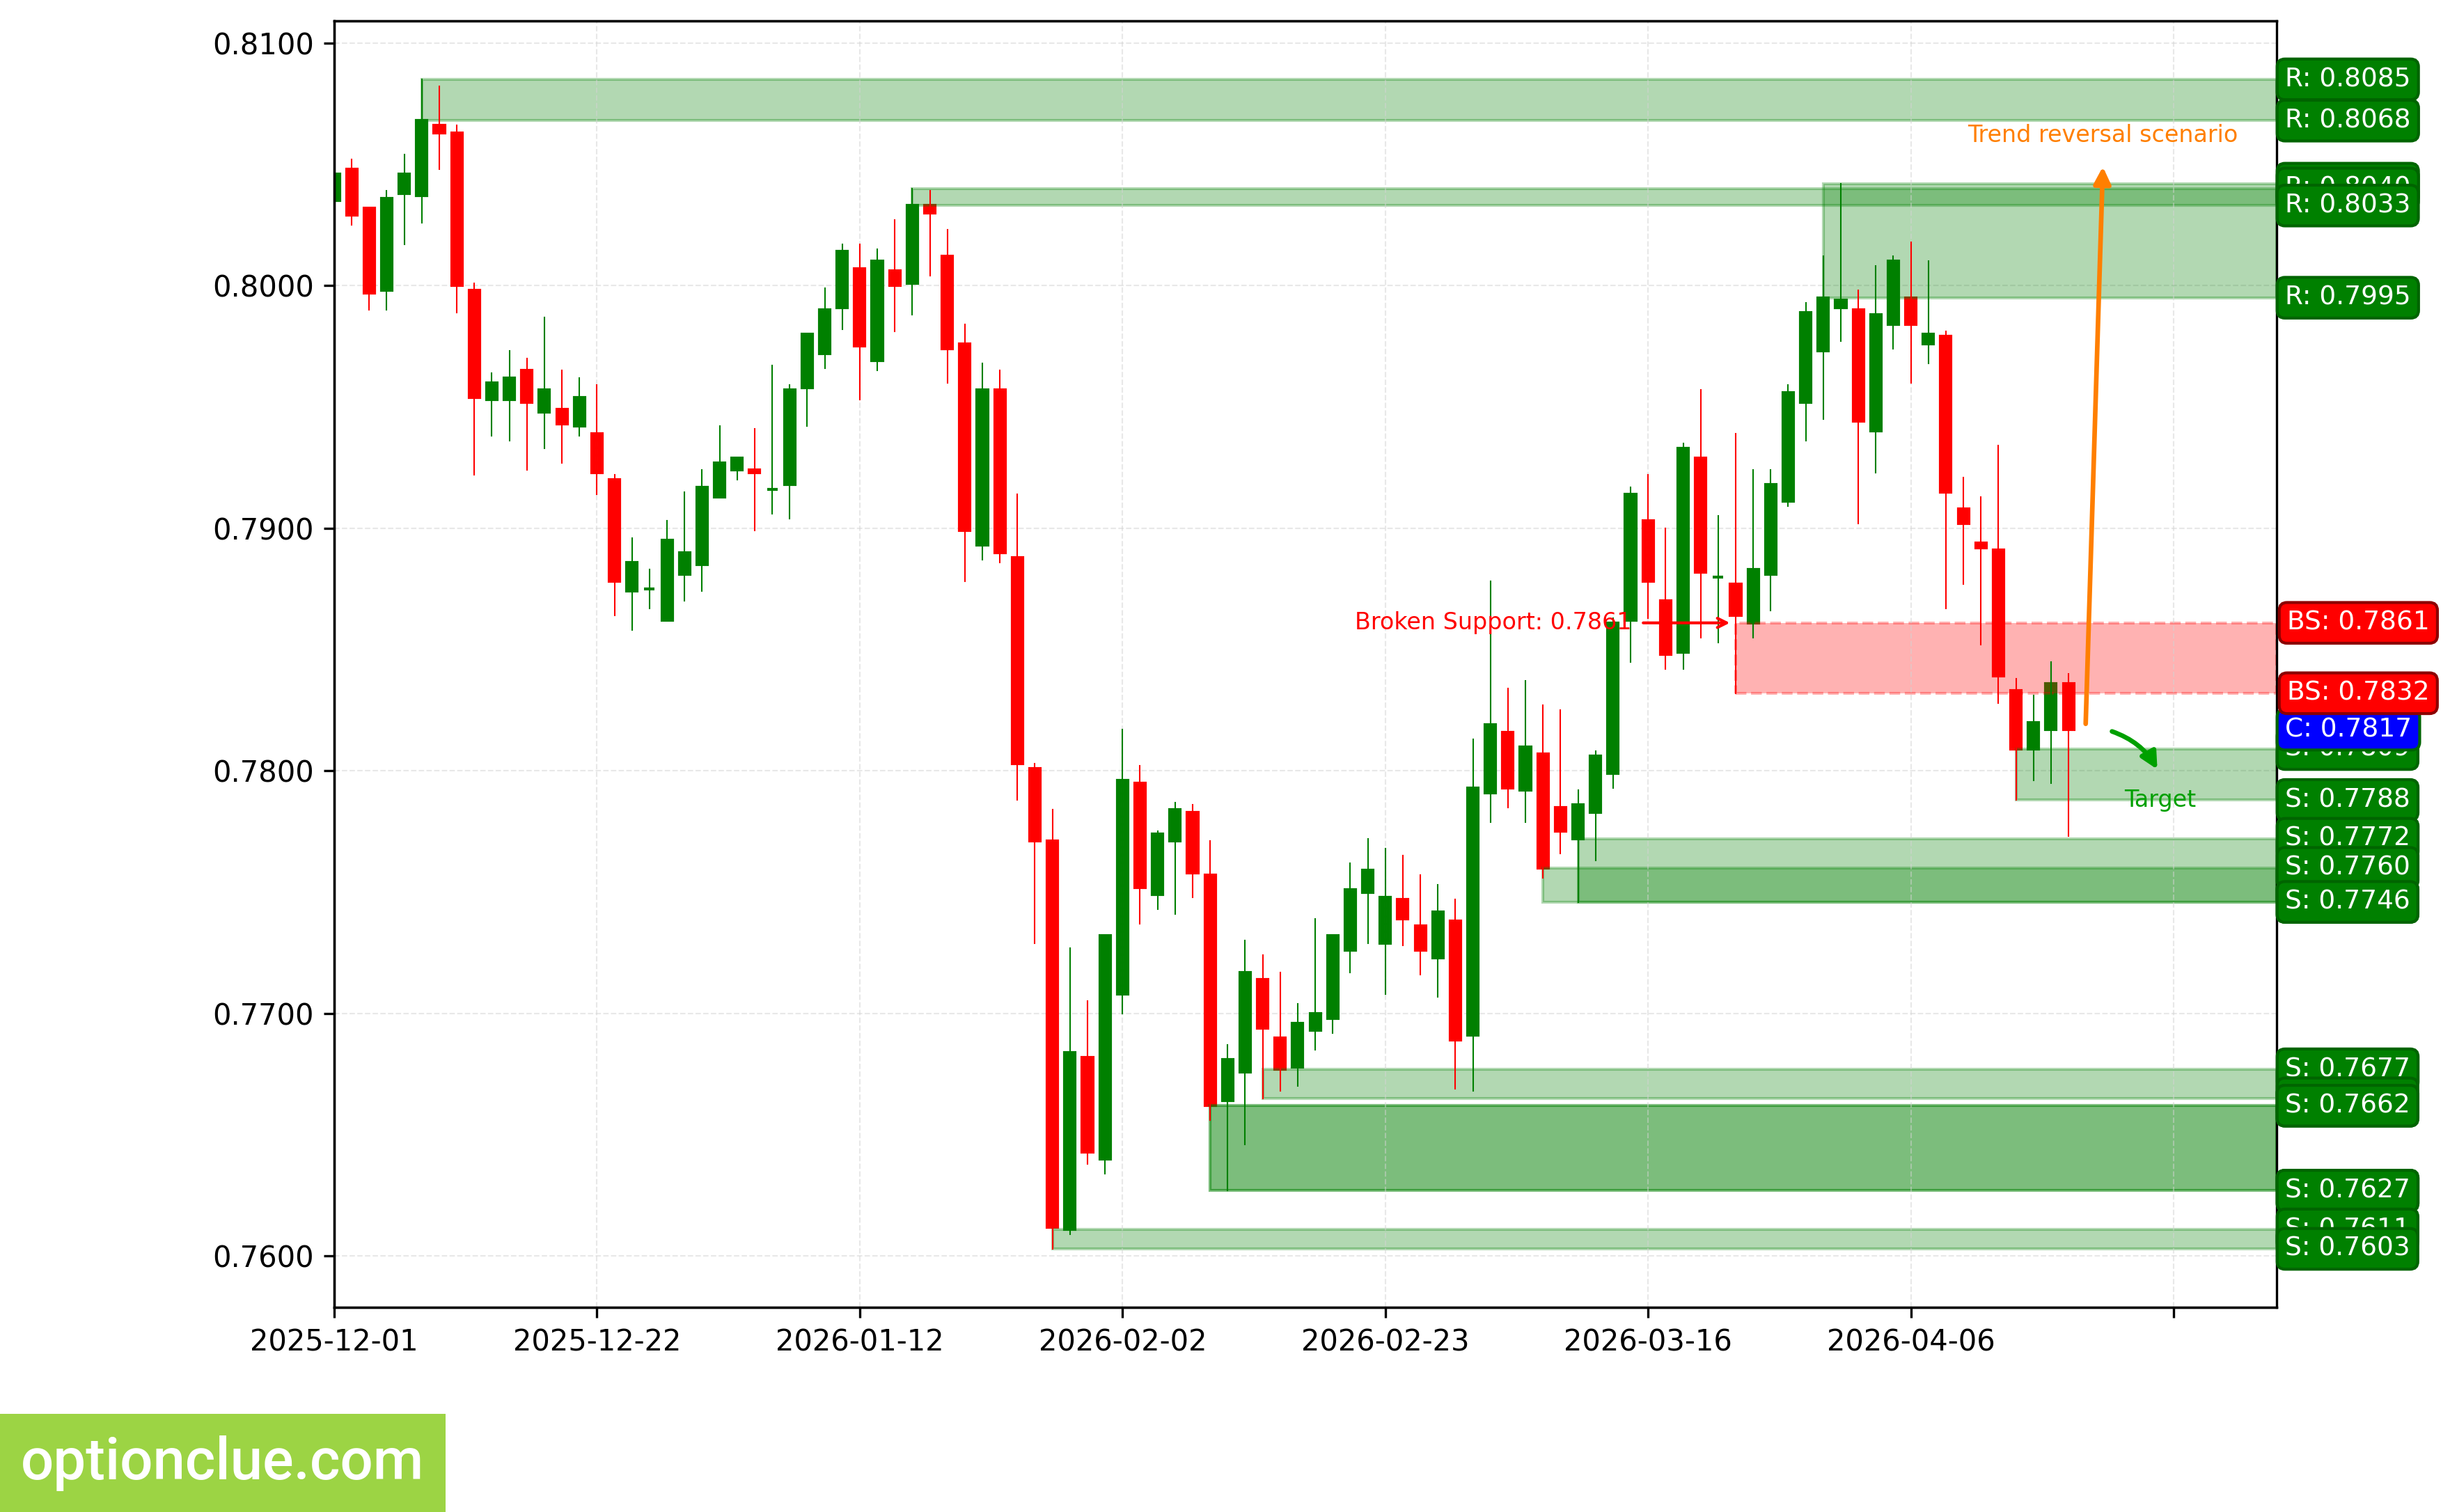
USDCHF. Technical analysis. D1.
Japanese Yen (USDJPY)
Bullish trend continues, correction wave is developing. Price has reached the rebound zone, confirmation is expected. The last broken level is resistance (159.74 — 159.89). Breakout occurred 16 candlesticks ago.
Intermediate target for upside movement is the resistance level with boundaries 160.27 — 160.46.
If correction completes near the support level (158.28 — 158.81), potential profit/risk ratio may be around 1.6:1.
Long positions will remain relevant as long as the market is above the nearest support level with boundaries 158.28 — 158.81. If the market successfully settles below this support, the trend will reverse to the opposite (bearish).
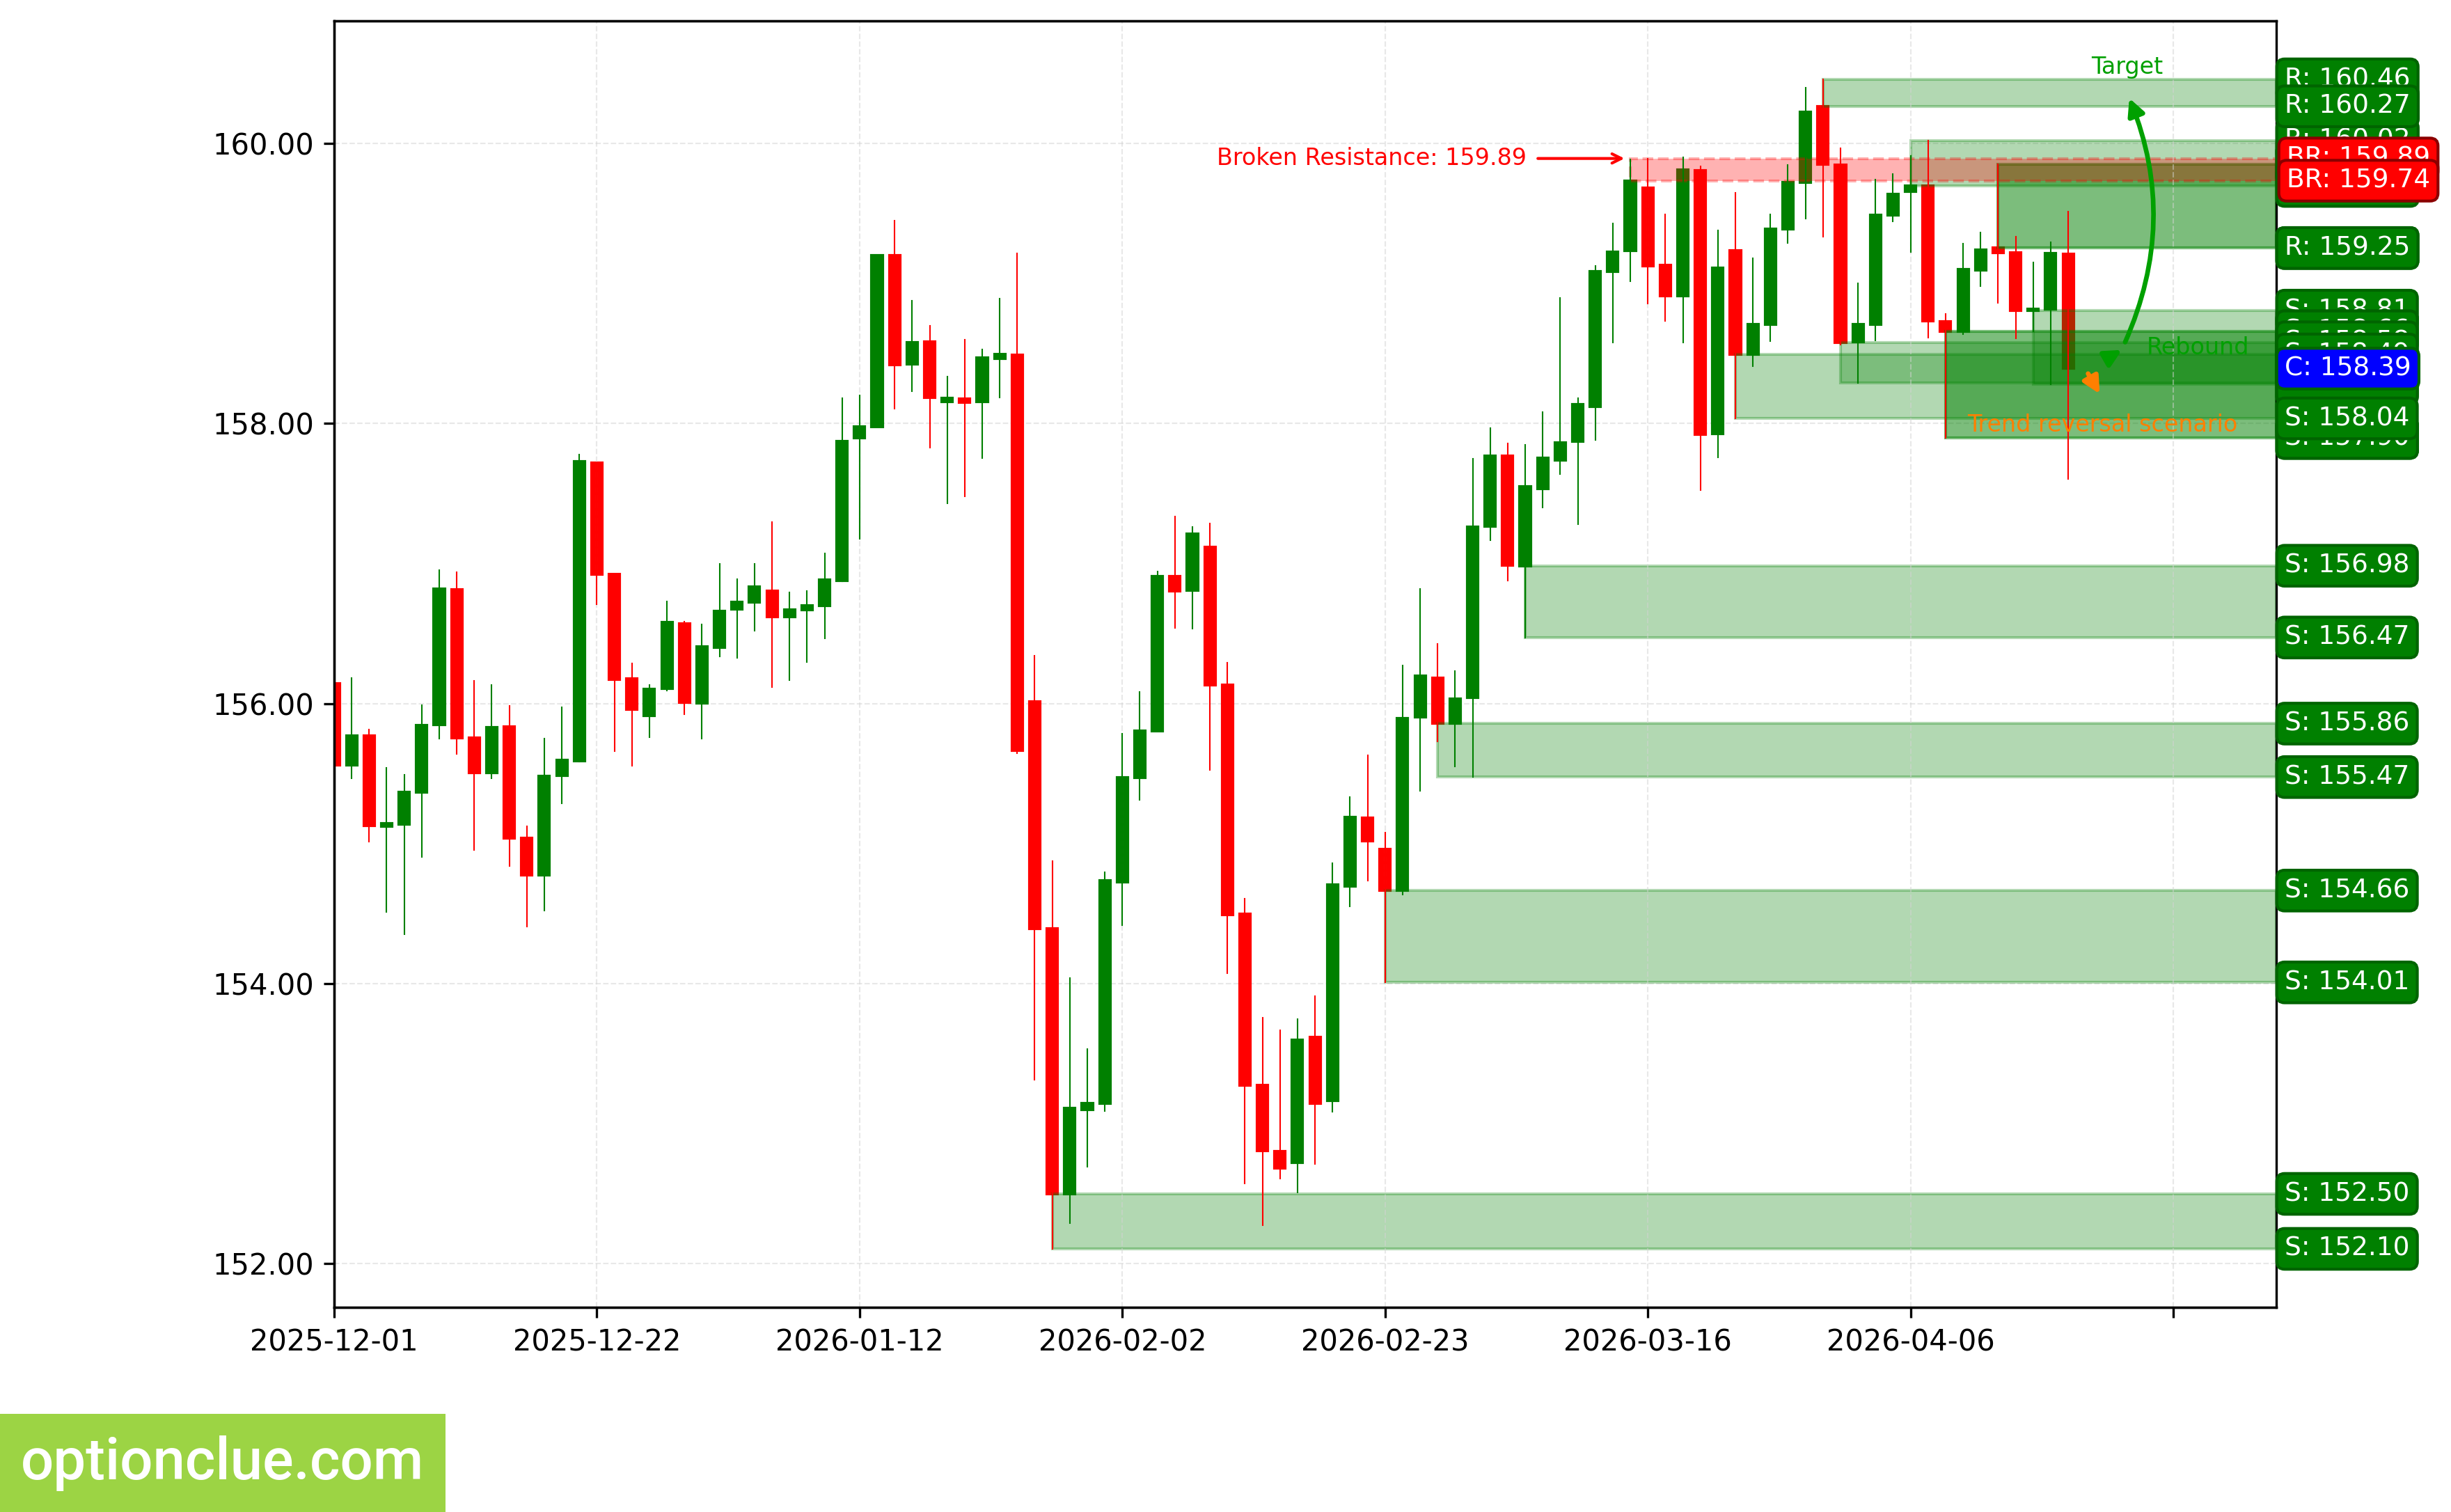
USDJPY. Technical analysis. D1.
Canadian Dollar (USDCAD)
Bearish trend continues, correction completed 5 candlesticks ago, impulse wave is developing. The last broken level is support (1.3866 — 1.3875). Breakout occurred 8 candlesticks ago.
Intermediate target for downside movement is the support level with boundaries 1.3650 — 1.3685. In case of successful trend development, a further target will be at the support level with boundaries 1.3523 — 1.3578.
Potential profit/risk ratio from current prices when setting targets and fixing risks at daily timeframe levels may be less than 0.1:1. When using the further target — small (approximately 0.4:1).
Short positions will remain relevant as long as the market remains below the nearest resistance level with boundaries 1.3947 — 1.3949. If the market successfully settles above this nearest resistance, the trend will reverse to the opposite (bullish).
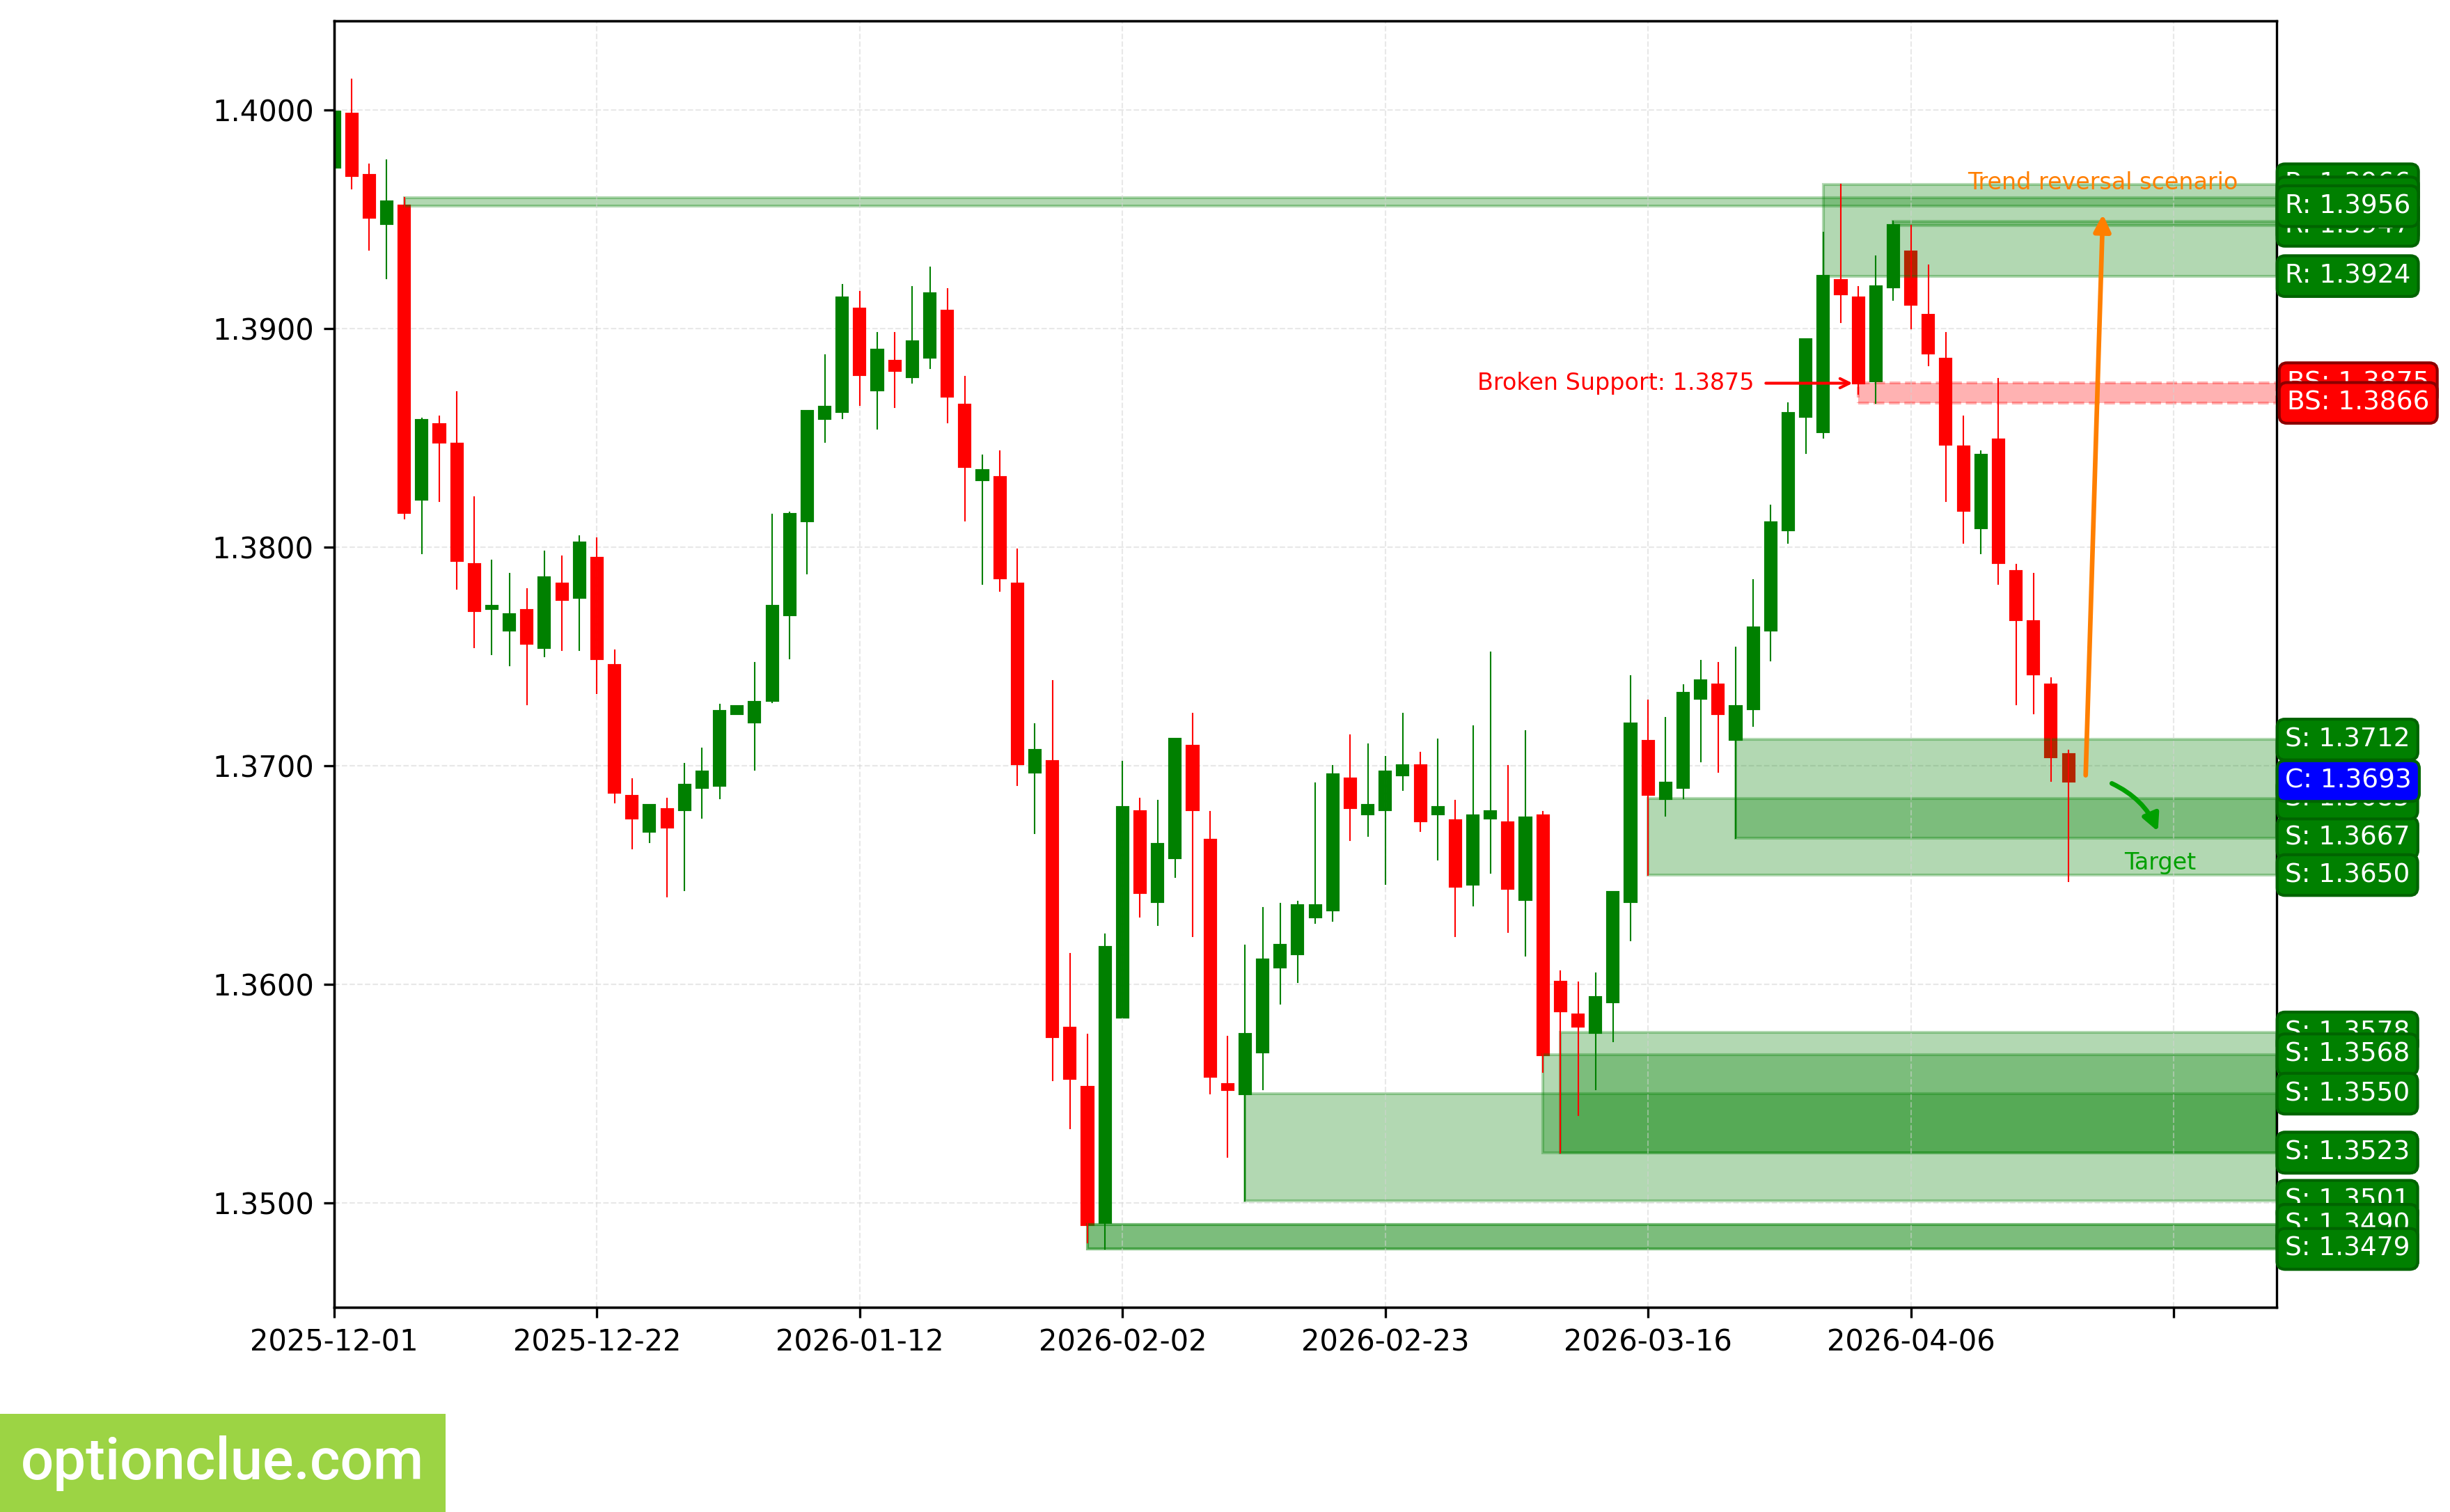
USDCAD. Technical analysis. D1.
Australian Dollar (AUDUSD)
Bullish trend continues, correction wave is developing. Entry point for buy on rebound may form after completion of the current correction. The last broken level is resistance (0.6929 — 0.6962). Breakout occurred 9 candlesticks ago.
Upon resumption of upside movement, the first target will be the resistance level.
Long positions will remain relevant as long as the market is above the nearest support level with boundaries 0.6858 — 0.6890. If the market successfully settles below this support, the trend will reverse to the opposite (bearish).
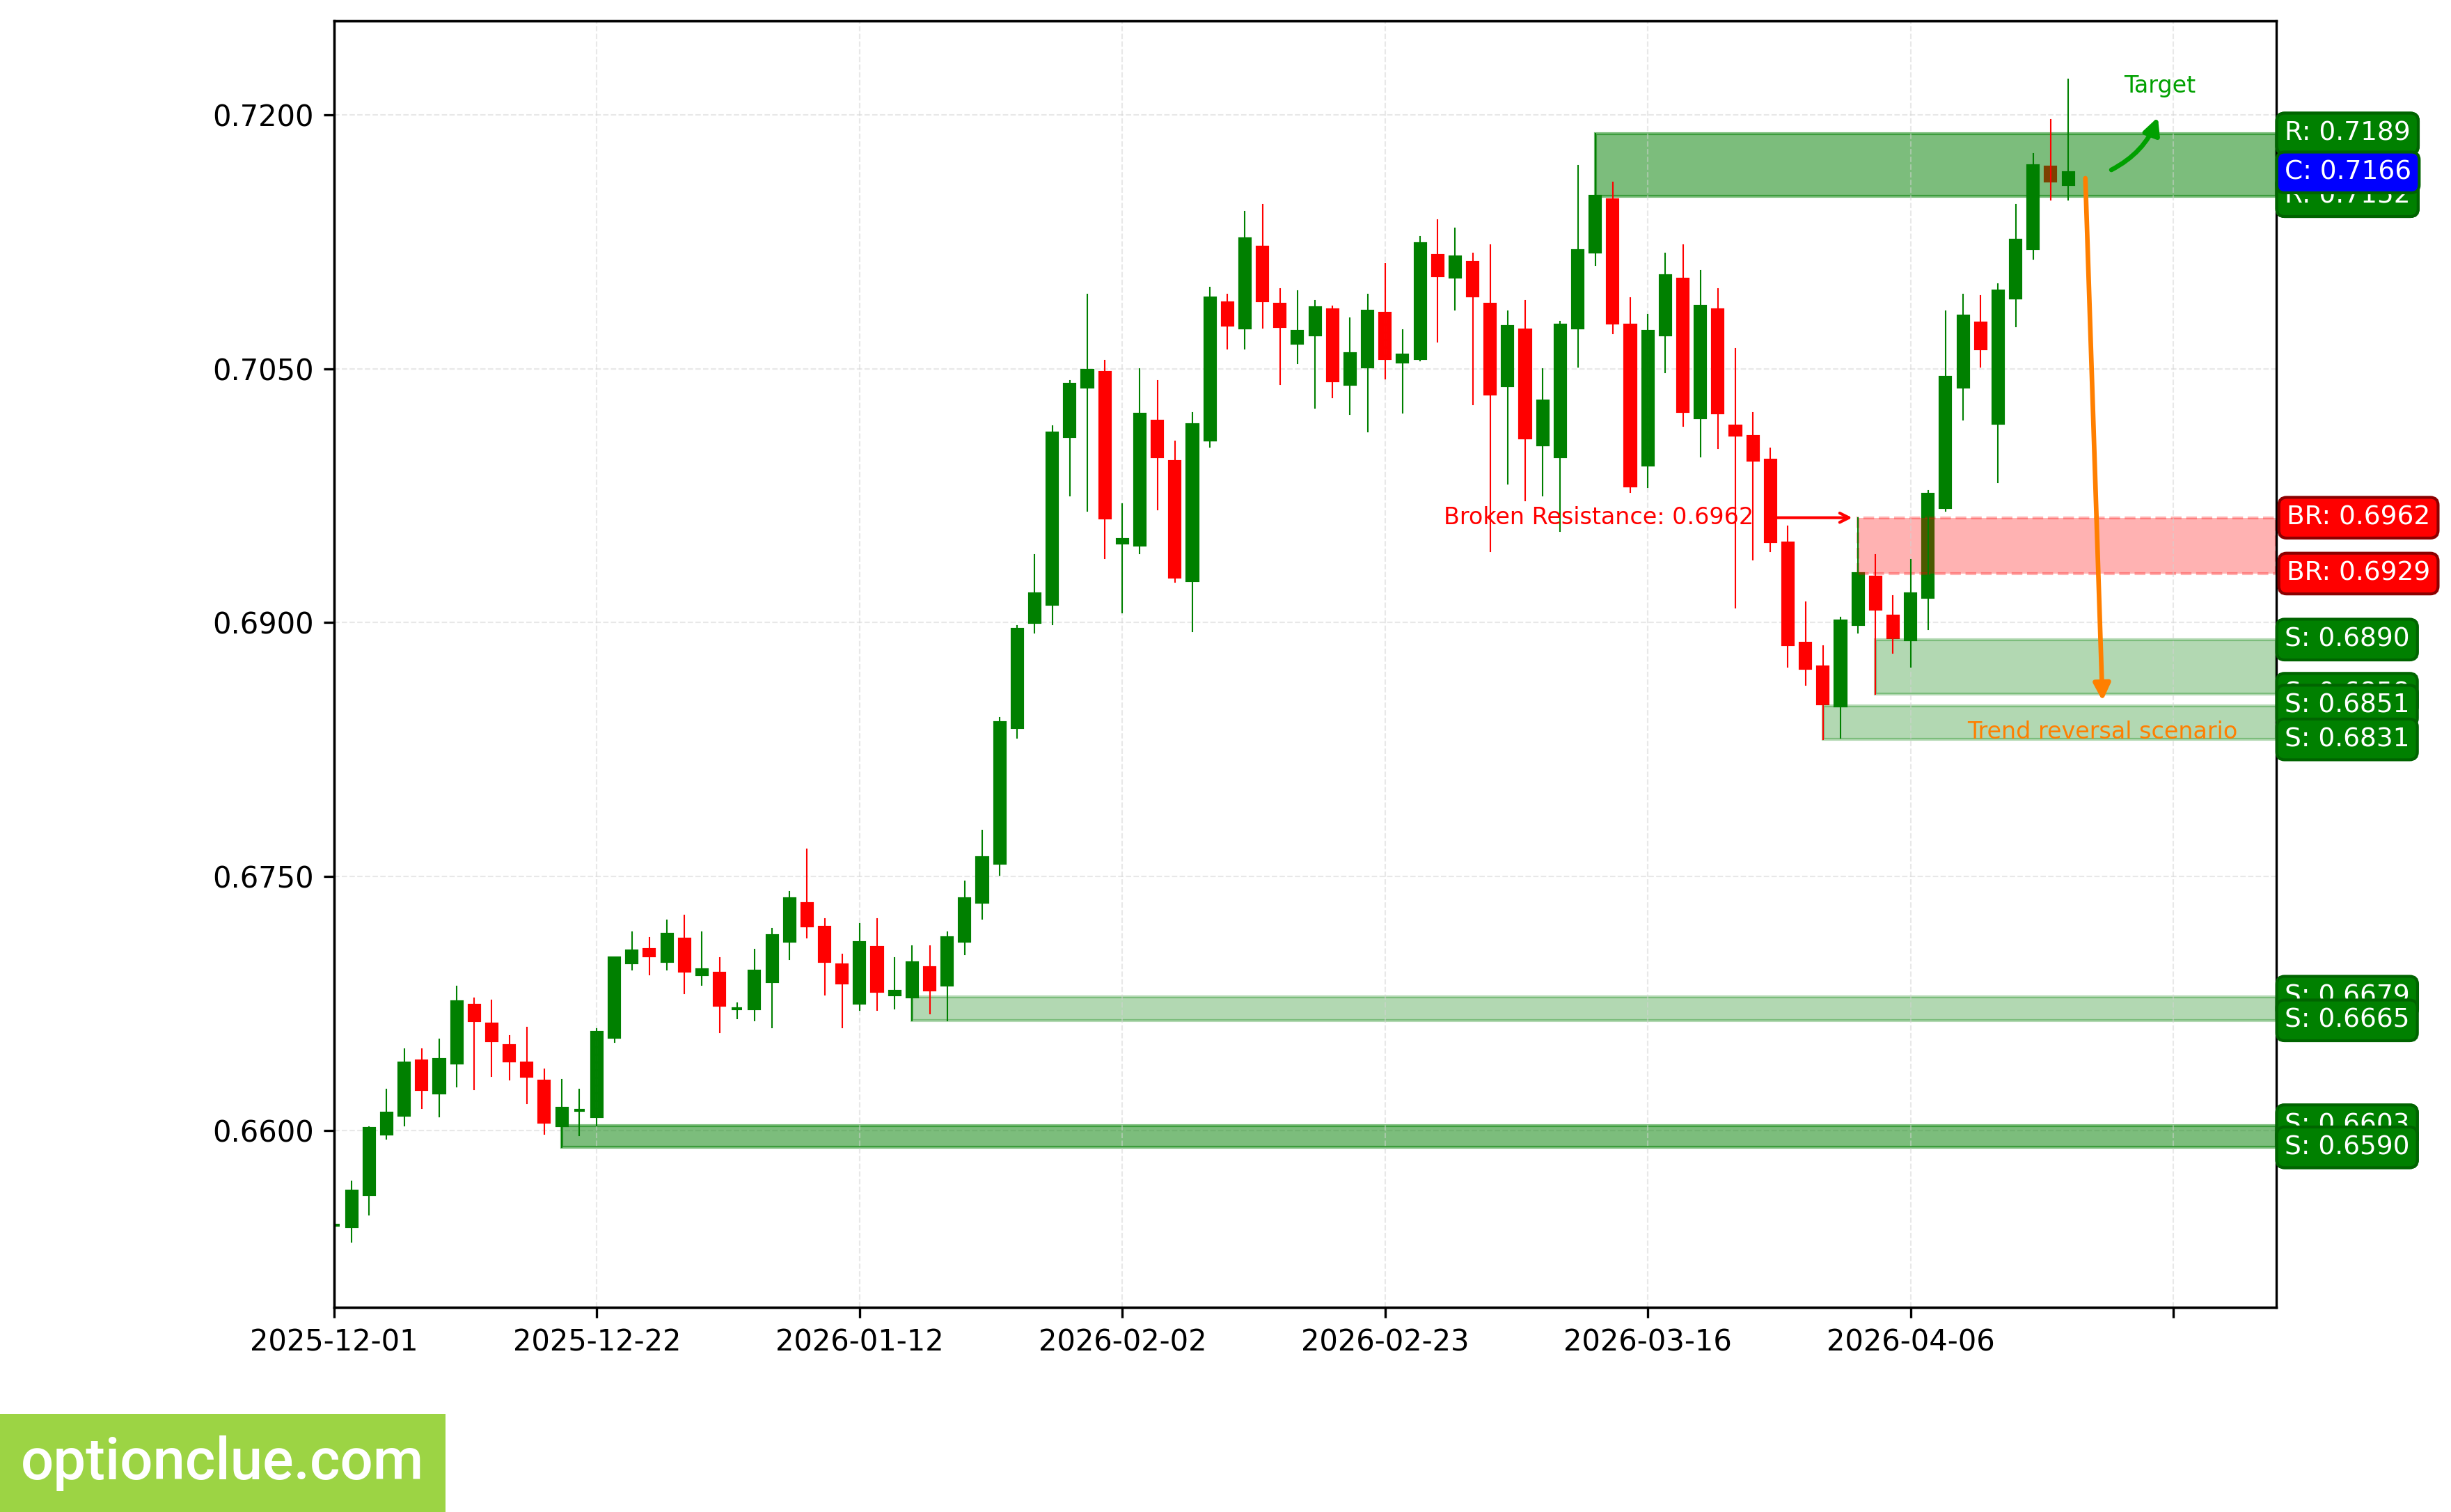
AUDUSD. Technical analysis. D1.
Bitcoin (BTC)
Bullish trend continues, impulse wave is developing. The last broken level is resistance (68233 — 69230). Breakout occurred 11 candlesticks ago.
Intermediate target for upside movement is the resistance level with boundaries 89185 — 90439. In case of successful trend development, a further target will be at the resistance level with boundaries 96931 — 97861.
Potential profit/risk ratio from current prices when setting targets and fixing risks at daily timeframe levels may be around 1.3:1. When using the further target — approximately 2:1. If the new correction completes near the support level (70486 — 71121), potential profit/risk ratio may be approximately 6:1. When using the further target — around 9:1.
Long positions will remain relevant as long as the market remains above the nearest support level with boundaries 70486 — 71121. If the market successfully settles below this support, the trend will reverse to the opposite (bearish).
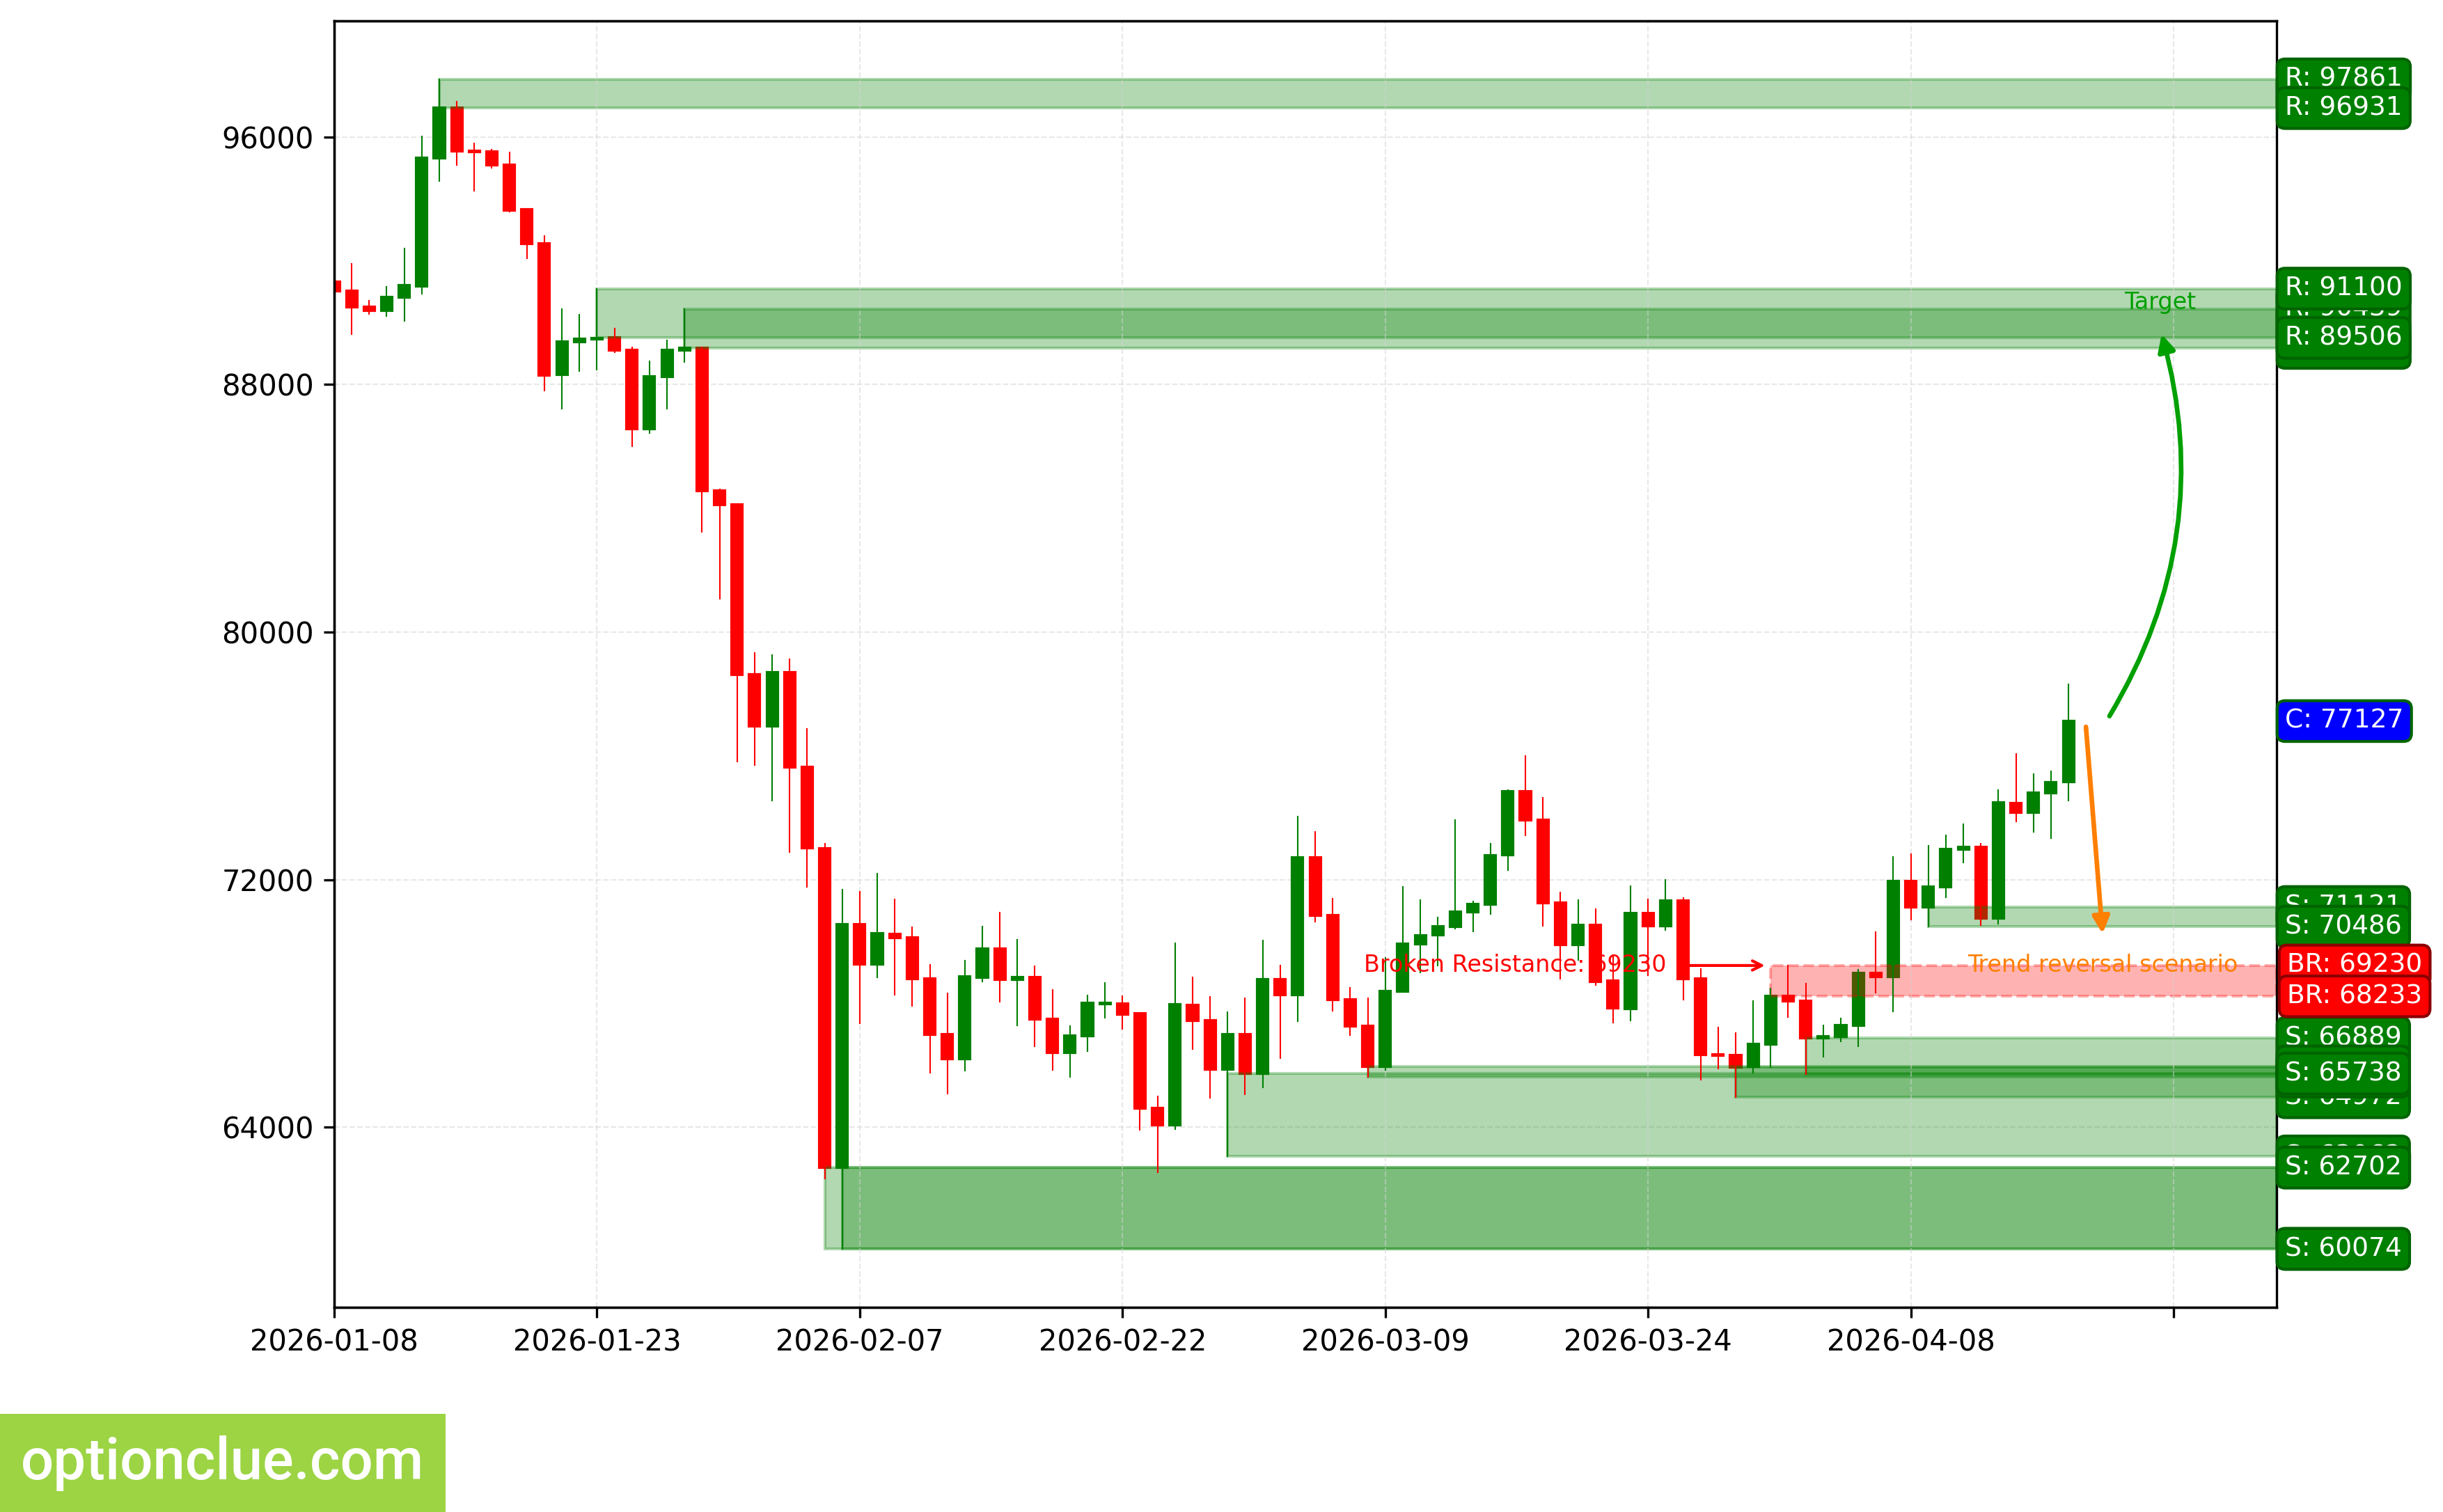
BTC. Technical analysis. D1.
Ether (ETH)
Bullish trend continues, correction completed 5 candlesticks ago, impulse wave is developing. The last broken level is resistance (2242 — 2271). Breakout occurred 7 candlesticks ago.
Intermediate target for upside movement is the resistance level with boundaries 3022 — 3041. In case of successful trend development, a further target will be at the resistance level with boundaries 3355 — 3398.
Potential profit/risk ratio from current prices when setting targets and fixing risks at daily timeframe levels may be approximately 2.4:1. When using the further target — around 3.7:1.
Long positions will remain relevant as long as the market is above the nearest support level with boundaries 2286 — 2323. If the market successfully settles below this support, the trend will reverse to the opposite (bearish).
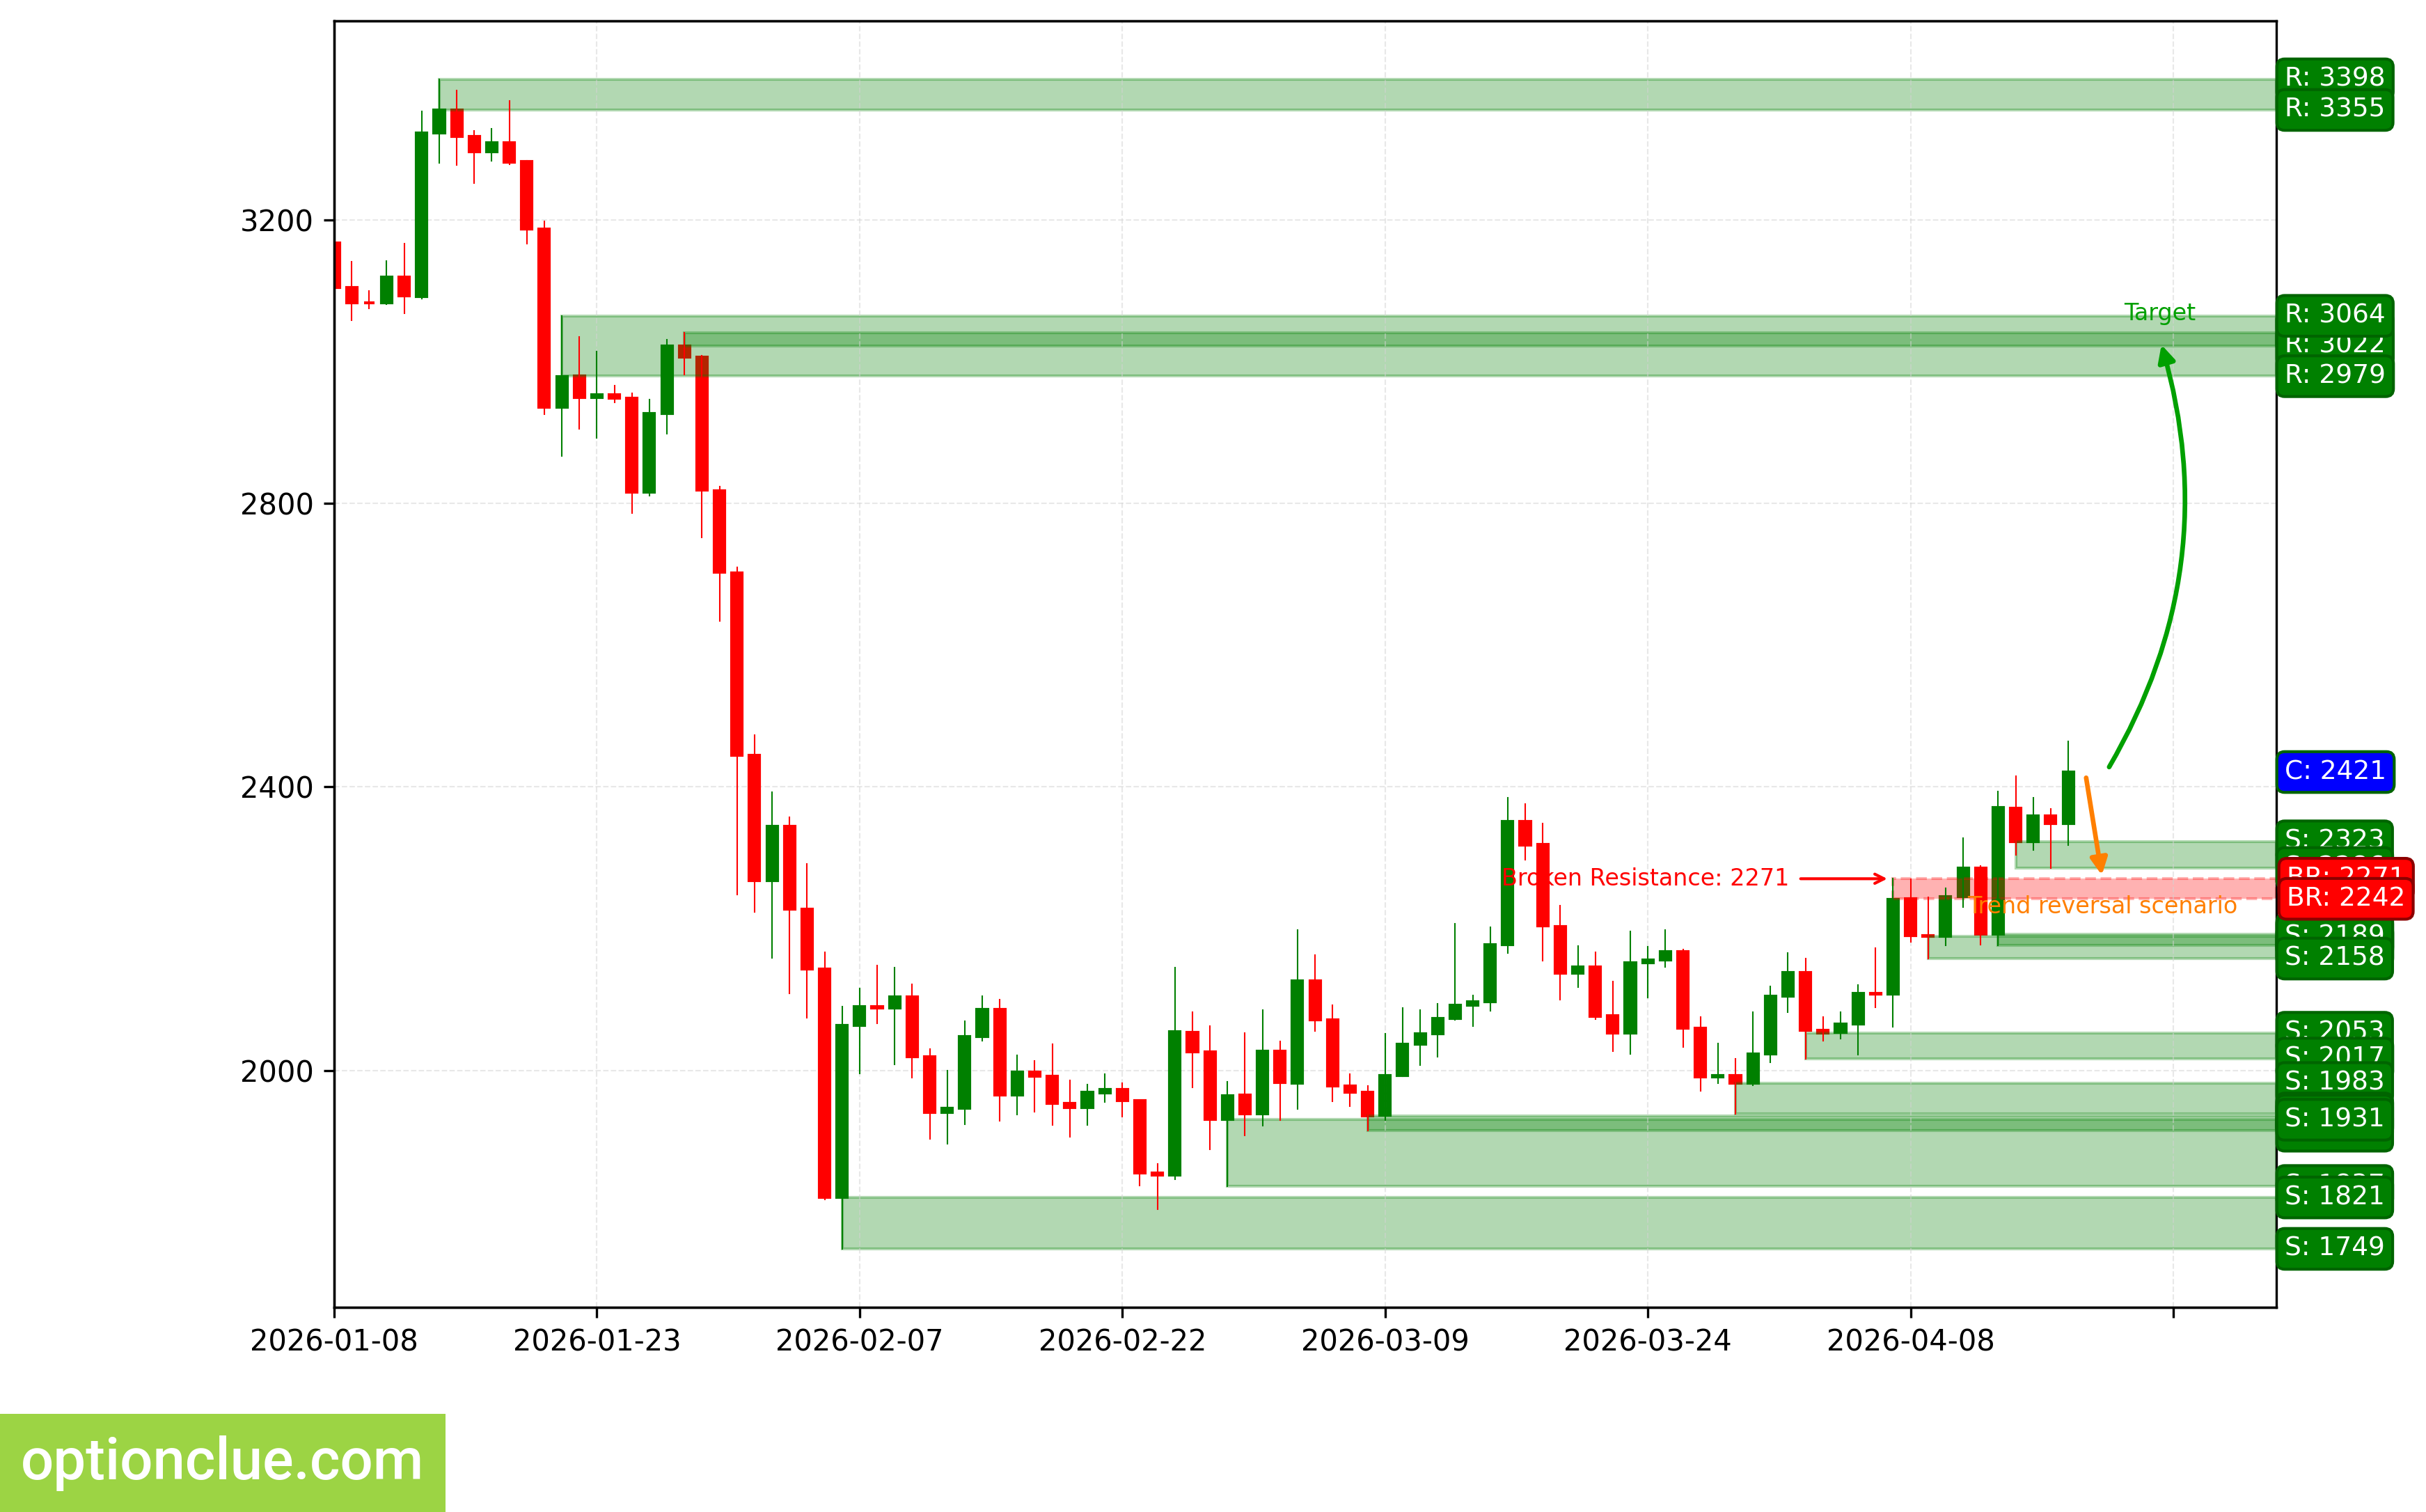
ETH. Technical analysis. D1.
Apple Inc (AAPL)
Bullish trend continues, impulse wave is developing. Entry point for buy on rebound may form after full correction. The last broken level is resistance (260.48 — 262.19). Breakout occurred 3 candlesticks ago.
Intermediate target for upside movement is the resistance level with boundaries 274.95 — 276.11. In case of successful trend development, a further target will be at the resistance level with boundaries 286.20 — 288.62.
If correction completes near the support level (245.70 — 253.50), potential profit/risk ratio may be approximately 2.4:1. When using the further target — around 3.5:1. If correction completes near the last broken level (260.48 — 262.19), potential profit/risk ratio may be insignificant (around 0.6:1). When using the further target — also small (approximately 1.1:1).
Long positions will remain relevant as long as the market remains above the nearest support level with boundaries 245.70 — 253.50. If the market successfully settles below this support, the trend will reverse to the opposite (bearish).
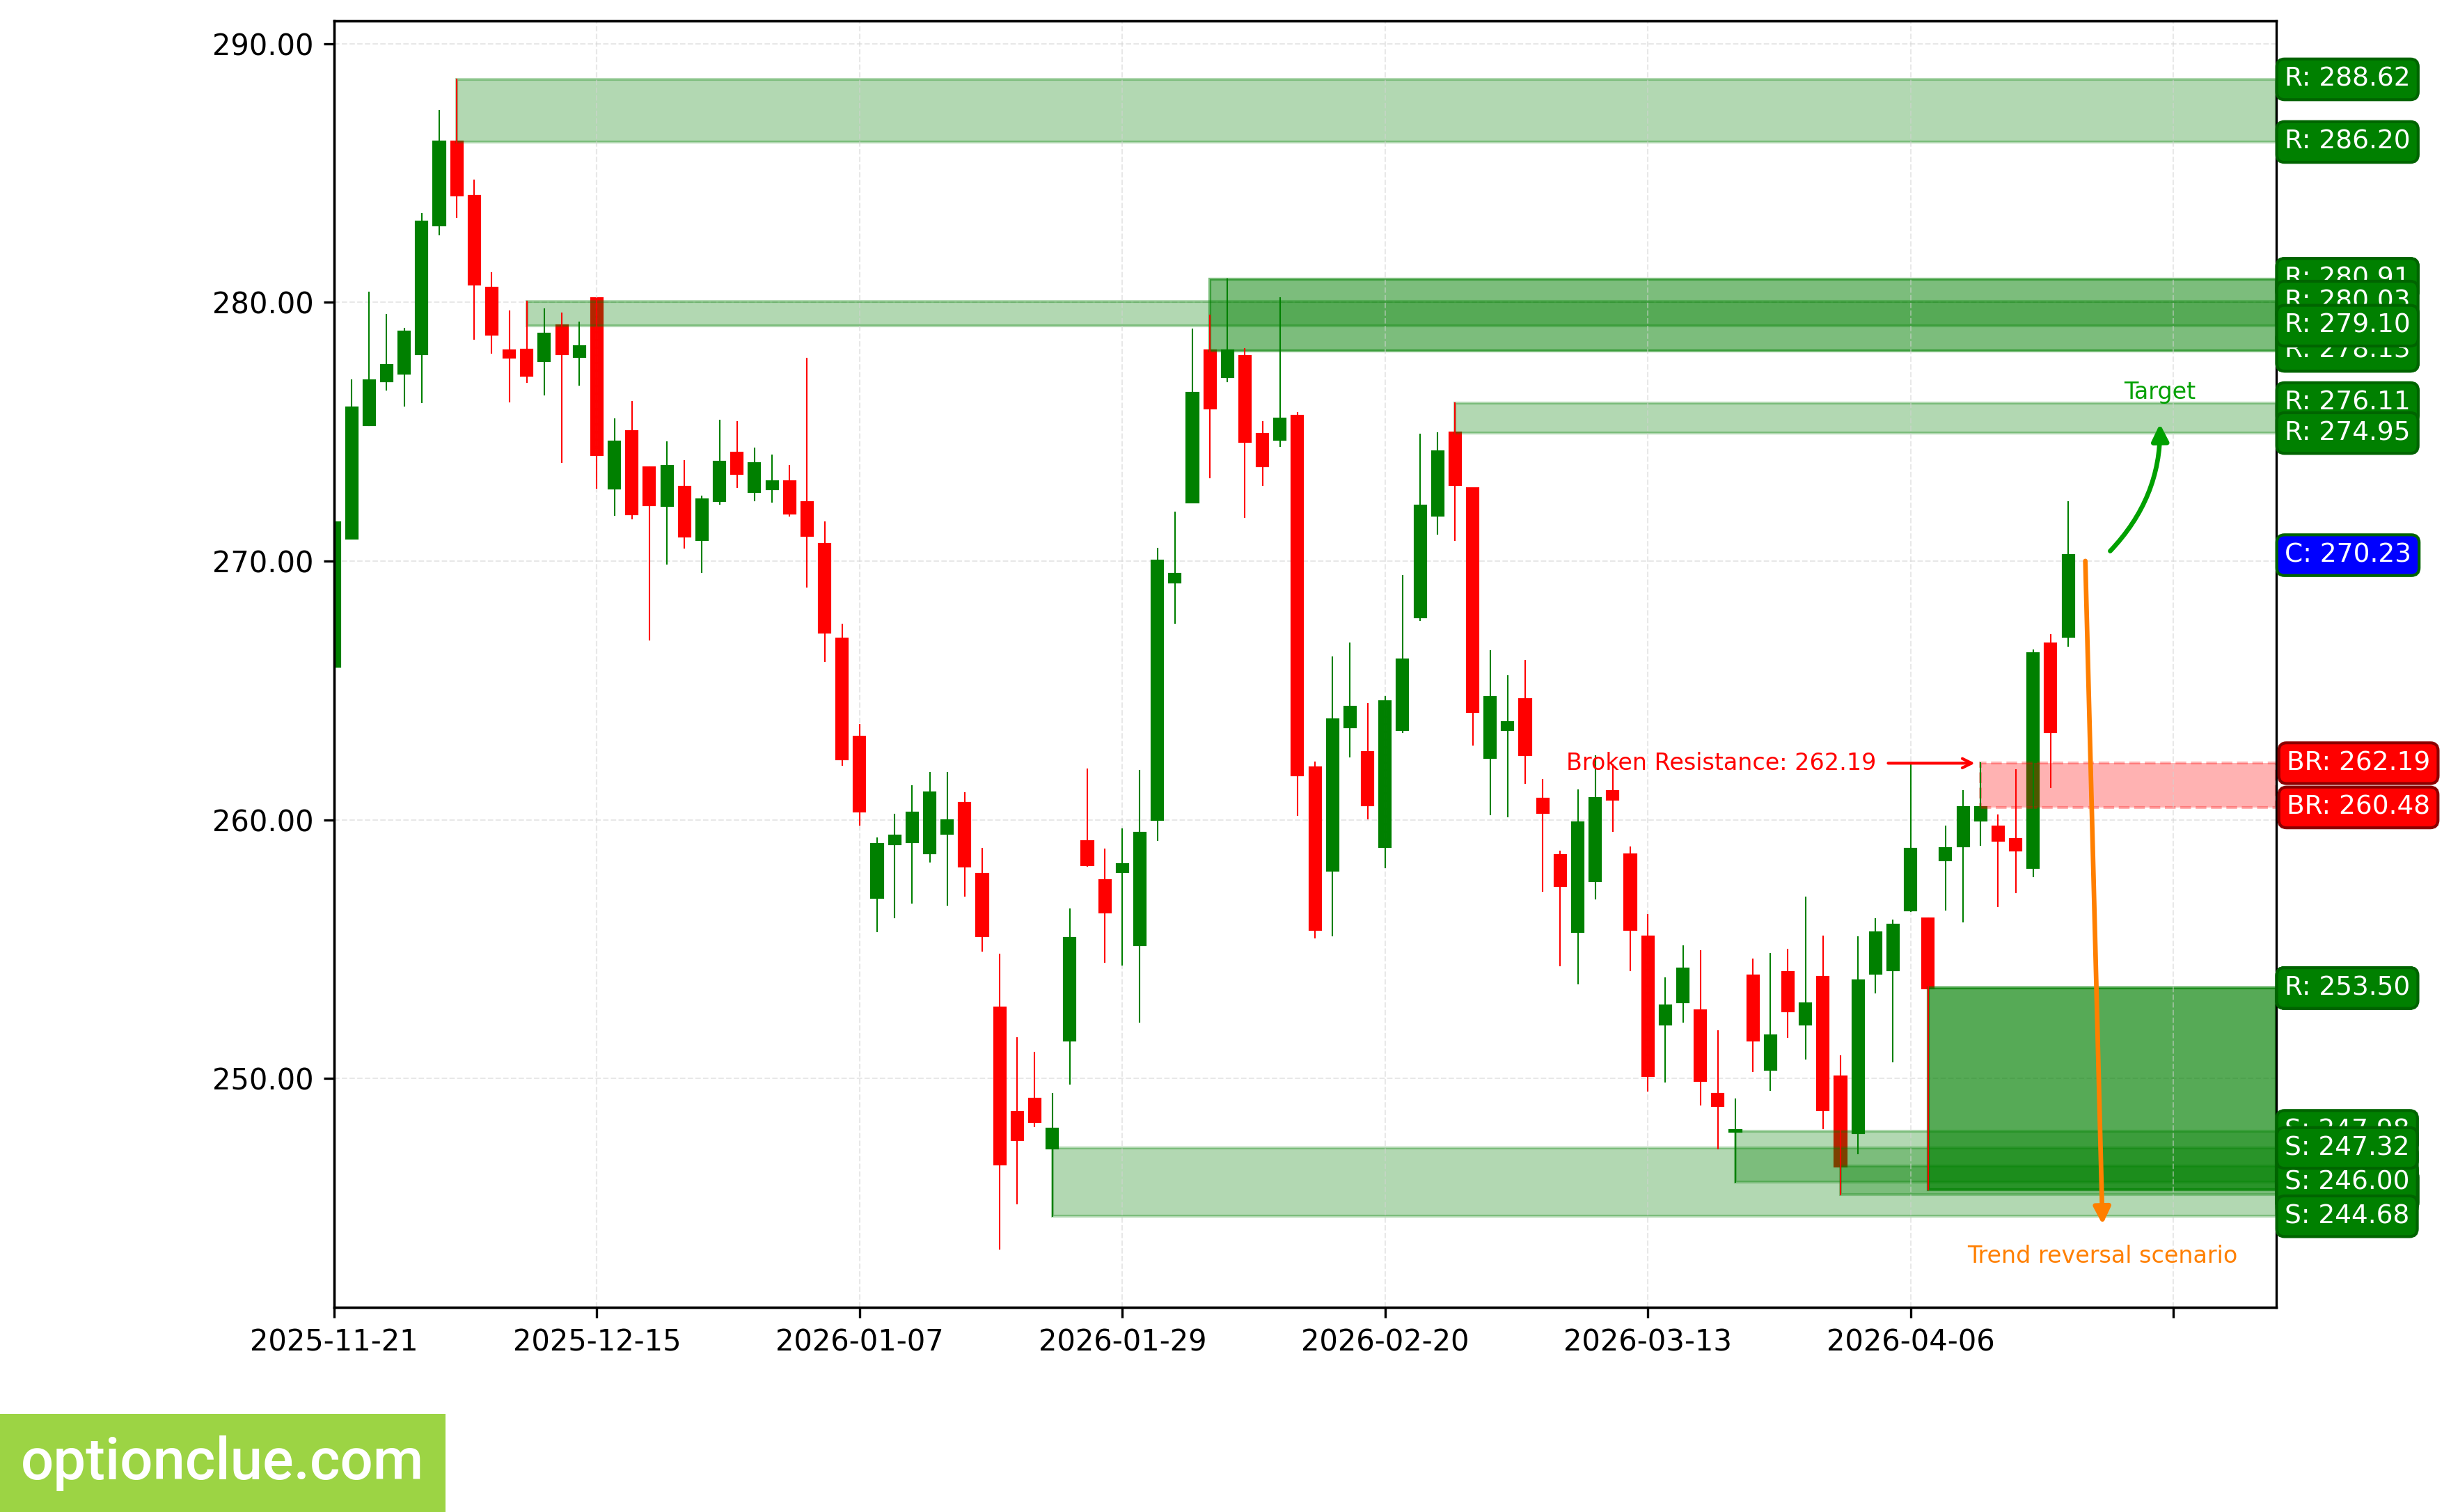
AAPL. Technical analysis. D1.
NVIDIA Corp (NVDA)
Bullish trend continues, price bounced from the support zone, impulse wave is developing. The last broken level is resistance (178.68 — 181.22). Breakout occurred 8 candlesticks ago.
Intermediate target for upside movement is the resistance level with boundaries 208.08 — 211.34.
Potential profit/risk ratio from current prices when setting targets and fixing risks at daily timeframe levels may be small (approximately 0.2:1). If the next correction completes near the support level (180.30 — 181.84), potential profit/risk ratio may be around 4.5:1.
Long positions will remain relevant as long as the market remains above the nearest support level with boundaries 180.30 — 181.84. If the market successfully settles below this support, the trend will reverse to the opposite (bearish).
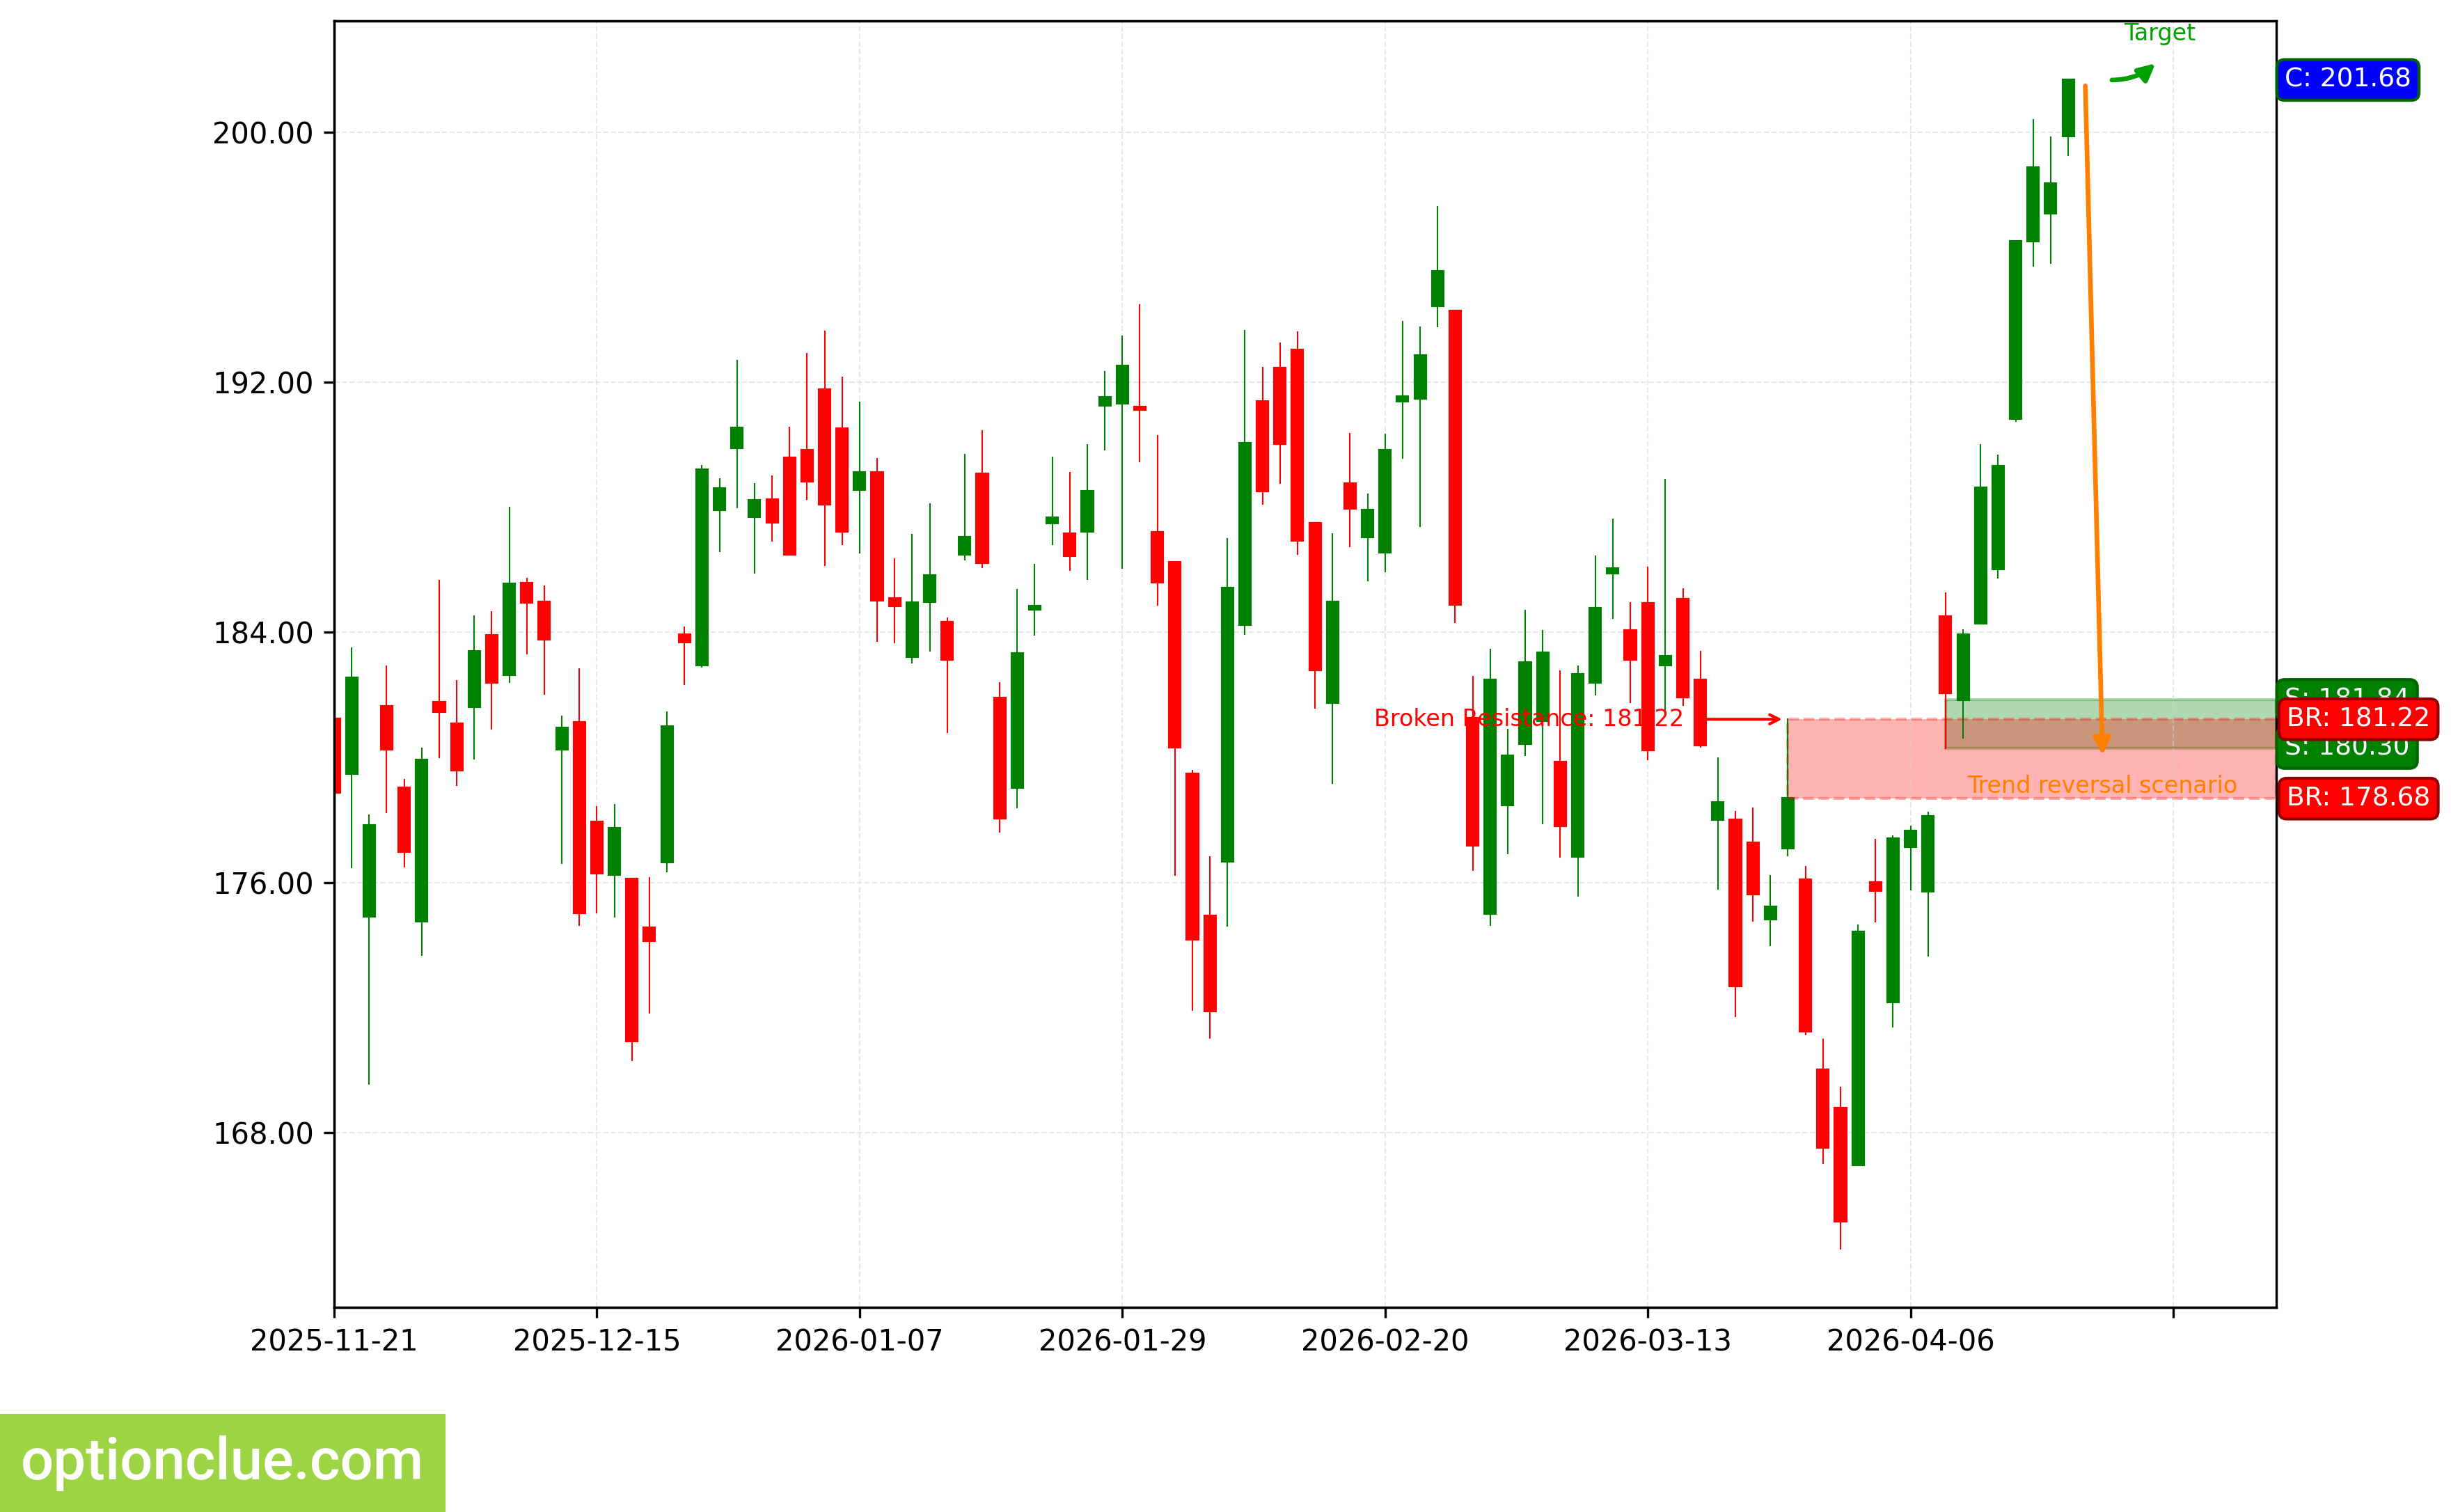
NVDA. Technical analysis. D1.
Tesla Inc (TSLA)
Trend has reversed to bullish when resistance level (381.26 — 383.14) was broken 3 candlesticks ago. Correction wave is developing.
Intermediate target for upside movement is the resistance level with boundaries 407.82 — 416.38. In case of successful trend development, a further target will be at the resistance level with boundaries 430.41 — 439.88.
If the new correction completes near the support level (337.25 — 343.15), potential profit/risk ratio may be approximately 3.4:1. When using the further target — around 4.5:1. If correction completes near the last broken level (381.26 — 383.14), potential profit/risk ratio may be small (about 0.4:1). When selecting the further target — also small (approximately 0.8:1).
Long positions will remain relevant as long as the market remains above the nearest support level with boundaries 337.25 — 343.15. If the market successfully settles below this support, the trend will reverse to the opposite (bearish).
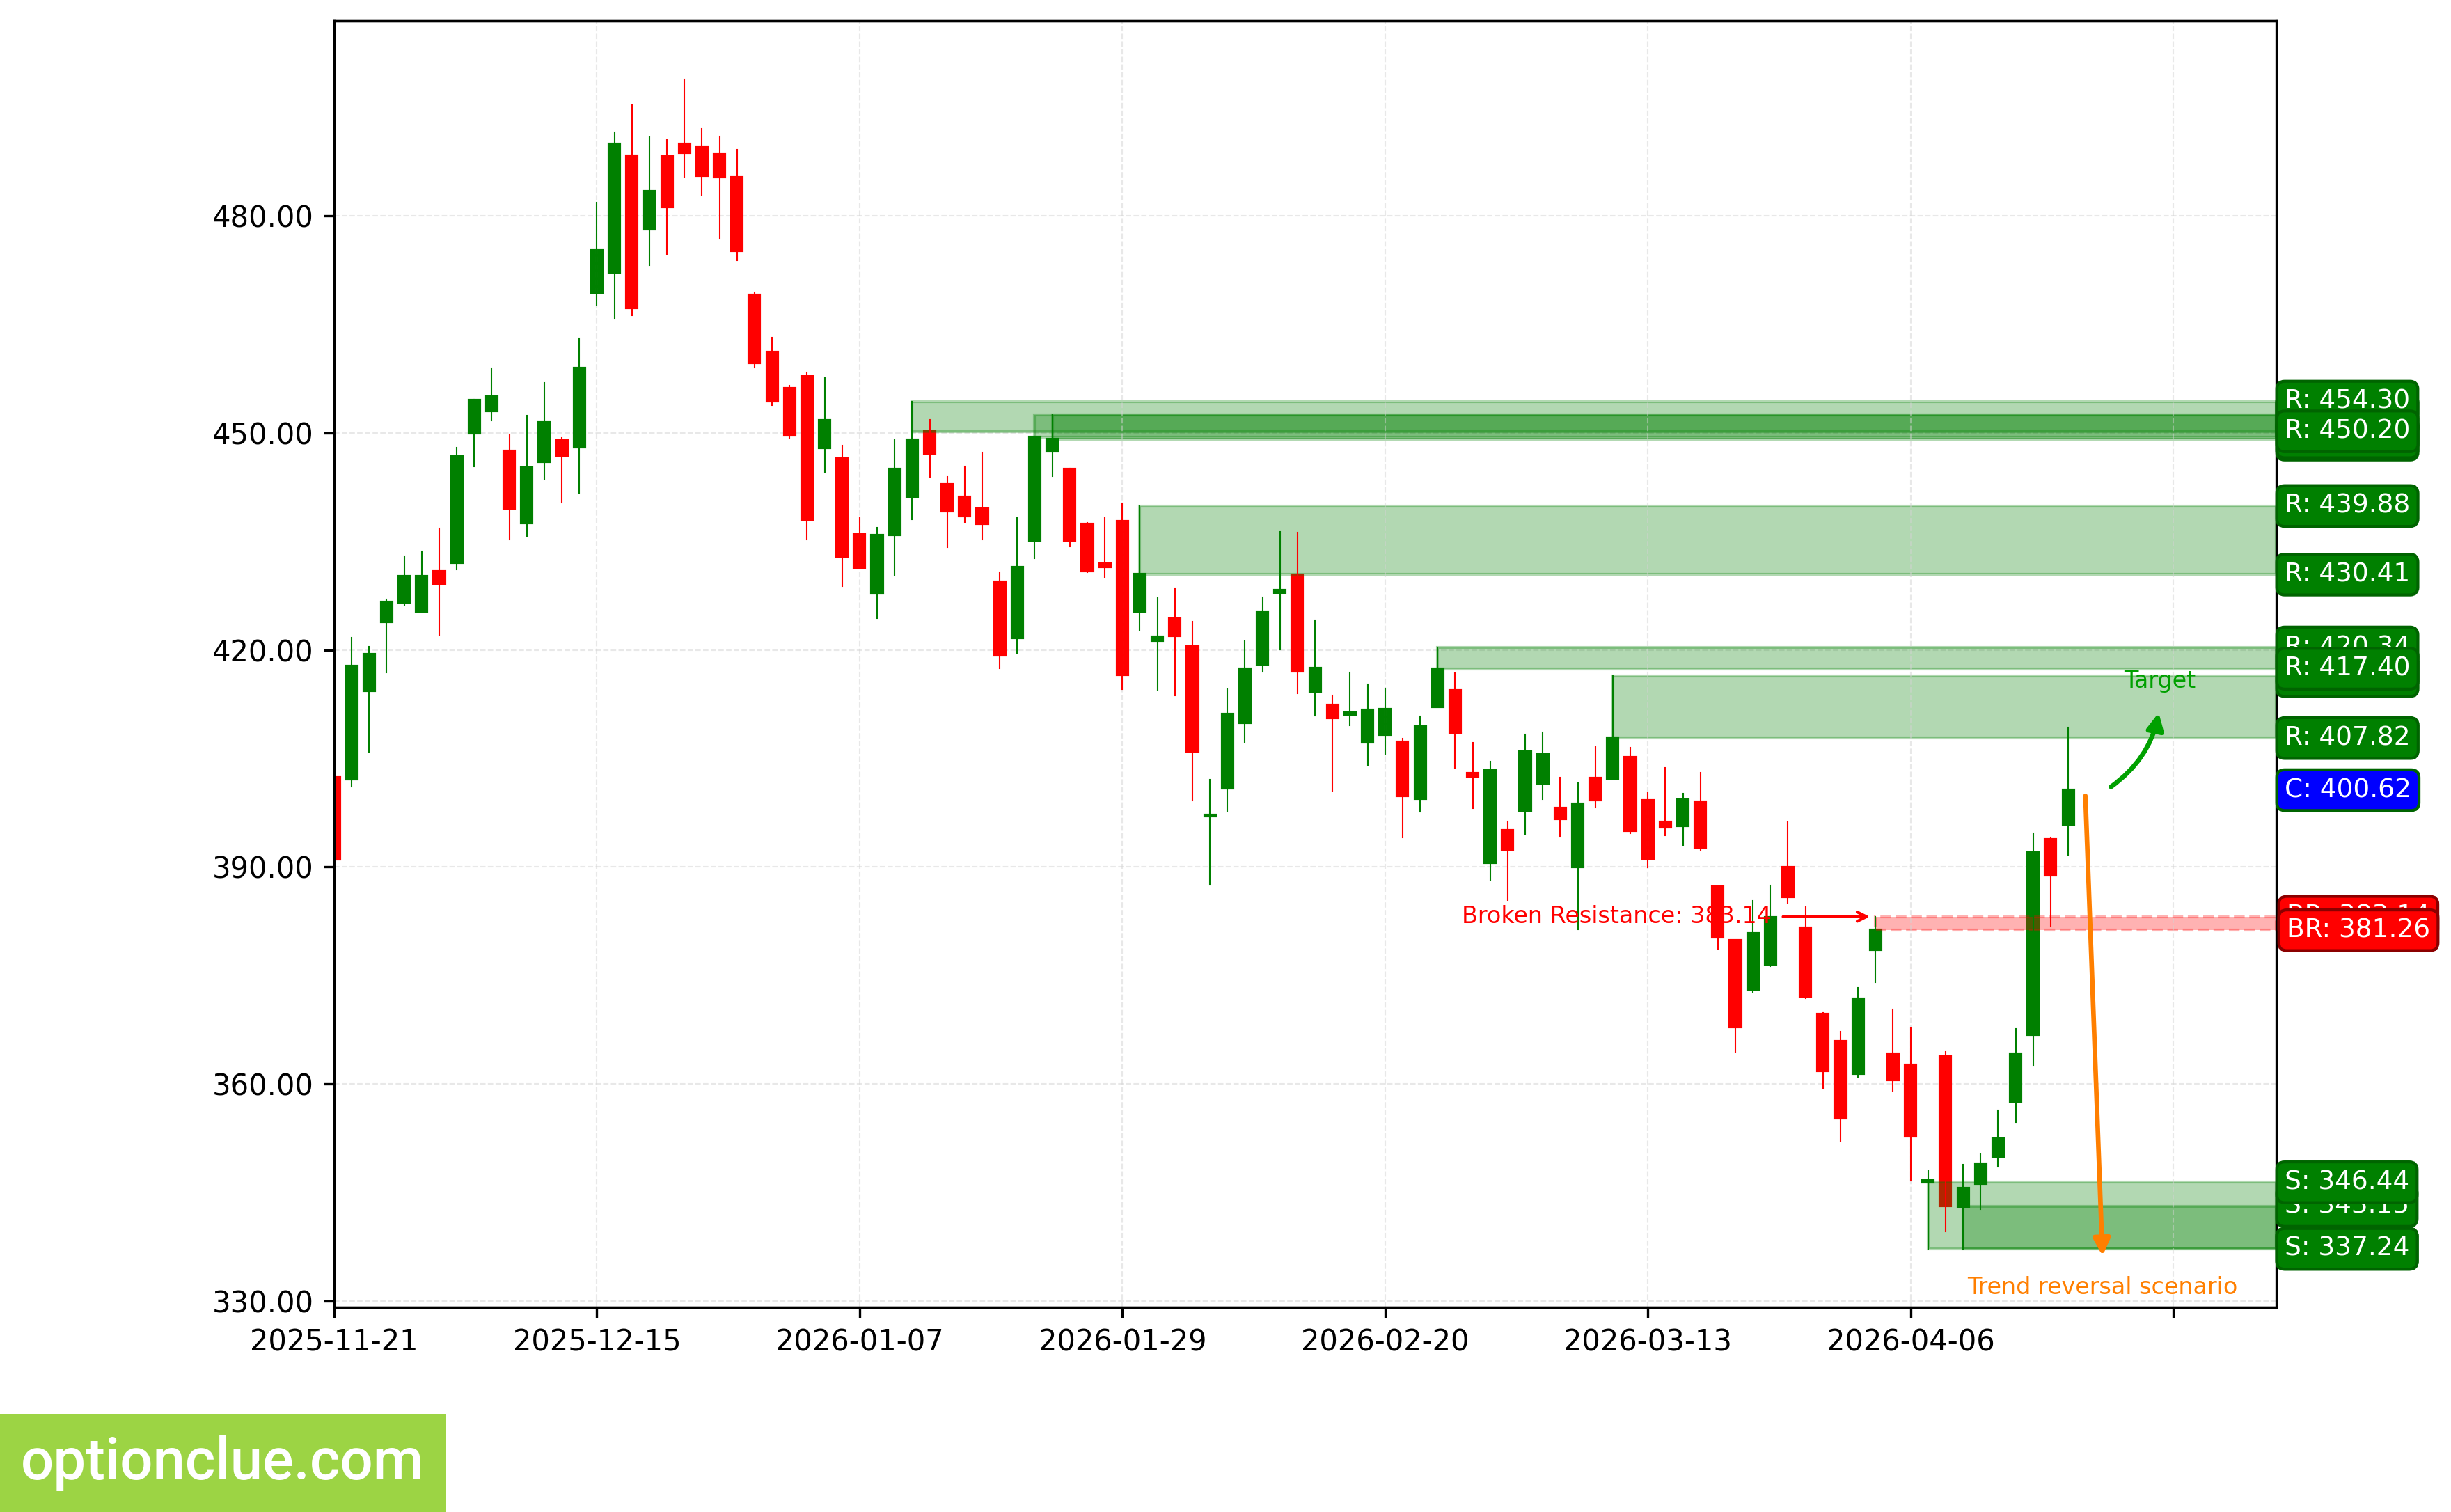
TSLA. Technical analysis. D1.
Summary
From a medium-term trading perspective, the following may soon be worth attention depending on the depth of market correction: GBPUSD, USDJPY, AAPL, TSLA.
The other financial instruments on the trading list may also be of interest, but rebound signals on Daily are likely to appear no earlier than in a week.