We examine key levels for each financial instrument and likely event development scenarios.
Key Topics
- Euro (EURUSD)
- British Pound (GBPUSD)
- Swiss Franc (USDCHF)
- Canadian Dollar (USDCAD)
- Australian Dollar (AUDUSD)
- Bitcoin (BTC)
- Ether (ETH)
- Apple Inc (AAPL)
- NVIDIA Corp (NVDA)
- Tesla Inc (TSLA)
- Summary
Euro (EURUSD)
Bearish trend continues, correction completed 4 candlesticks ago and an entry point for selling on rebound formed, impulse wave is developing. The last broken level is support (1.1703 — 1.1710). Breakout occurred 9 candlesticks ago.
Intermediate target for the downward movement is the support level with boundaries 1.1491 — 1.1513. In case of successful trend development, a further target will be at the support level with boundaries 1.1392 — 1.1422.
Potential profit/risk ratio from current prices when setting targets and fixing risks at daily timeframe levels may be small (approximately 0.6:1). When using a further target — around 1.2:1.
Short positions will remain relevant, as long as the market remains below the nearest resistance level with boundaries 1.1668 — 1.1699. If the market successfully closes above this nearest resistance, the trend will reverse to the opposite (bullish).
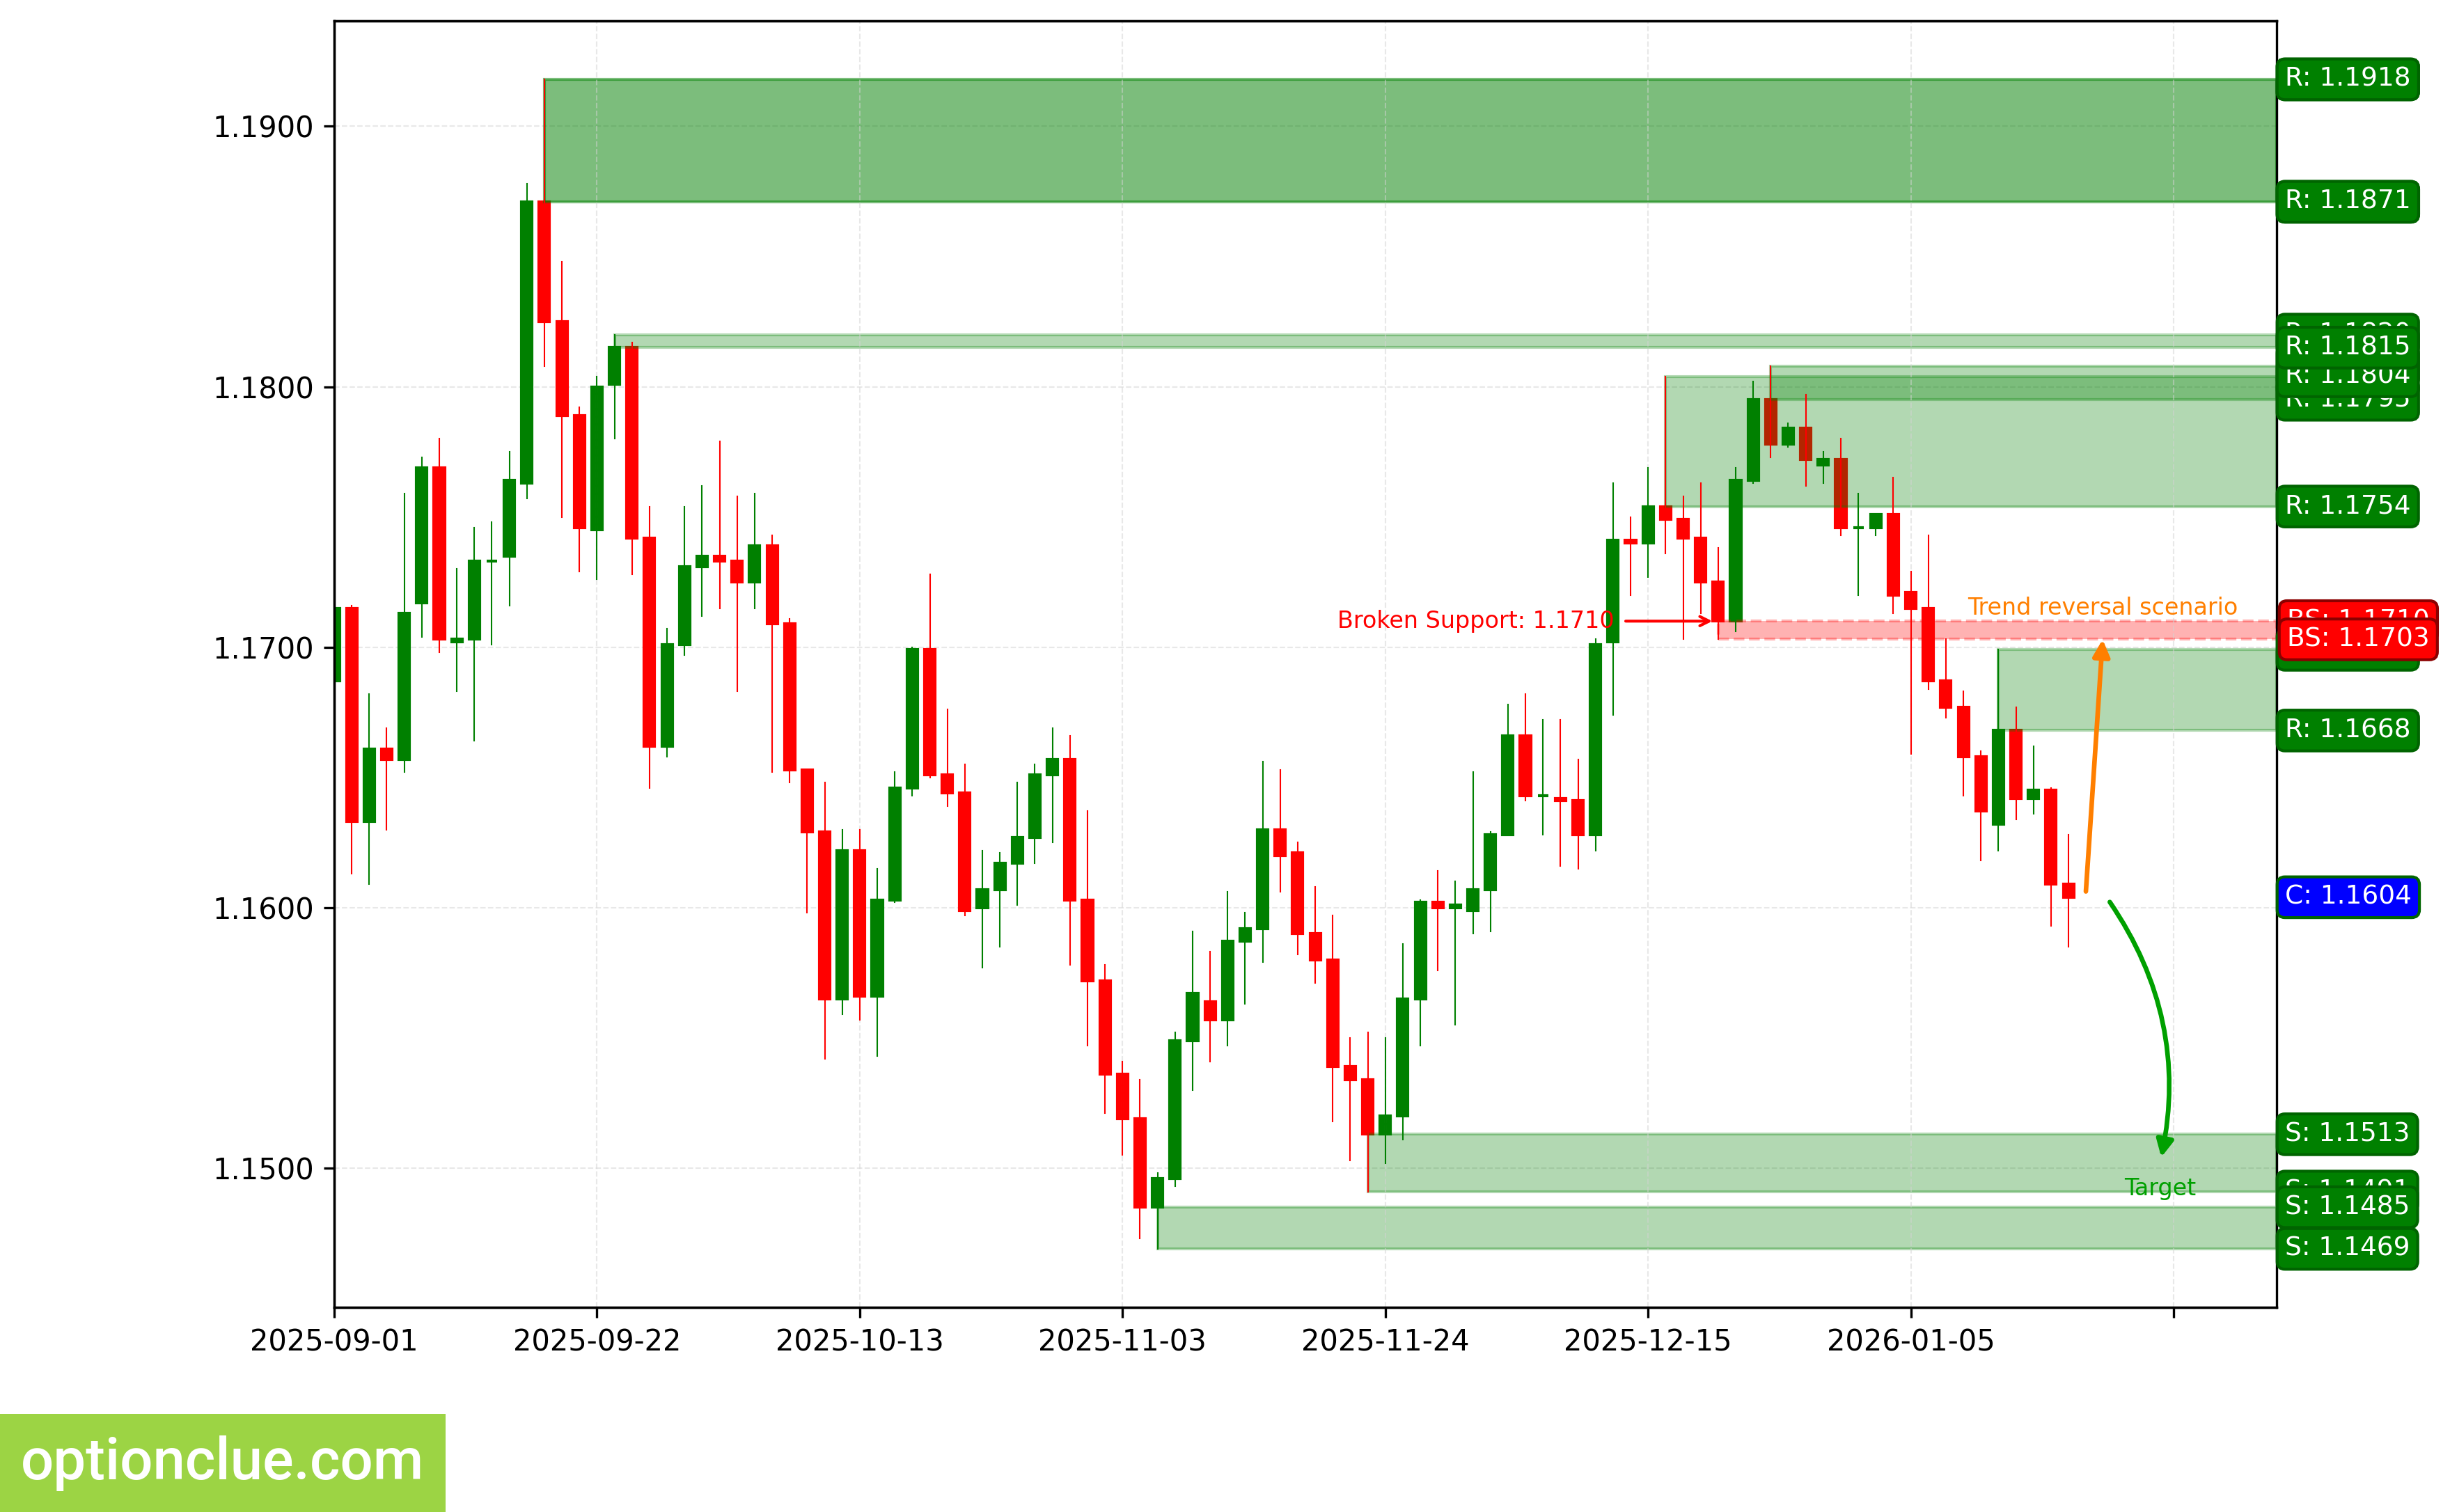
EURUSD. Technical analysis. D1.
British Pound (GBPUSD)
Bullish trend continues, correction wave is developing. An entry point for buying on rebound may form after the current correction completes. The last broken level is resistance (1.3476 — 1.3502). Breakout occurred 10 candlesticks ago.
Intermediate target for the upward movement is the resistance level with boundaries 1.3533 — 1.3568. In case of successful trend development, a further target will be at the resistance level with boundaries 1.3653 — 1.3726.
If the correction completes near the support level (1.3312 — 1.3374), the potential profit/risk ratio may be around 1.1:1. When using a further target — around 1.9:1.
Long positions will remain relevant, as long as the market is above the nearest support level with boundaries 1.3312 — 1.3374. If the market successfully closes below this support, the trend will reverse to the opposite (bearish).
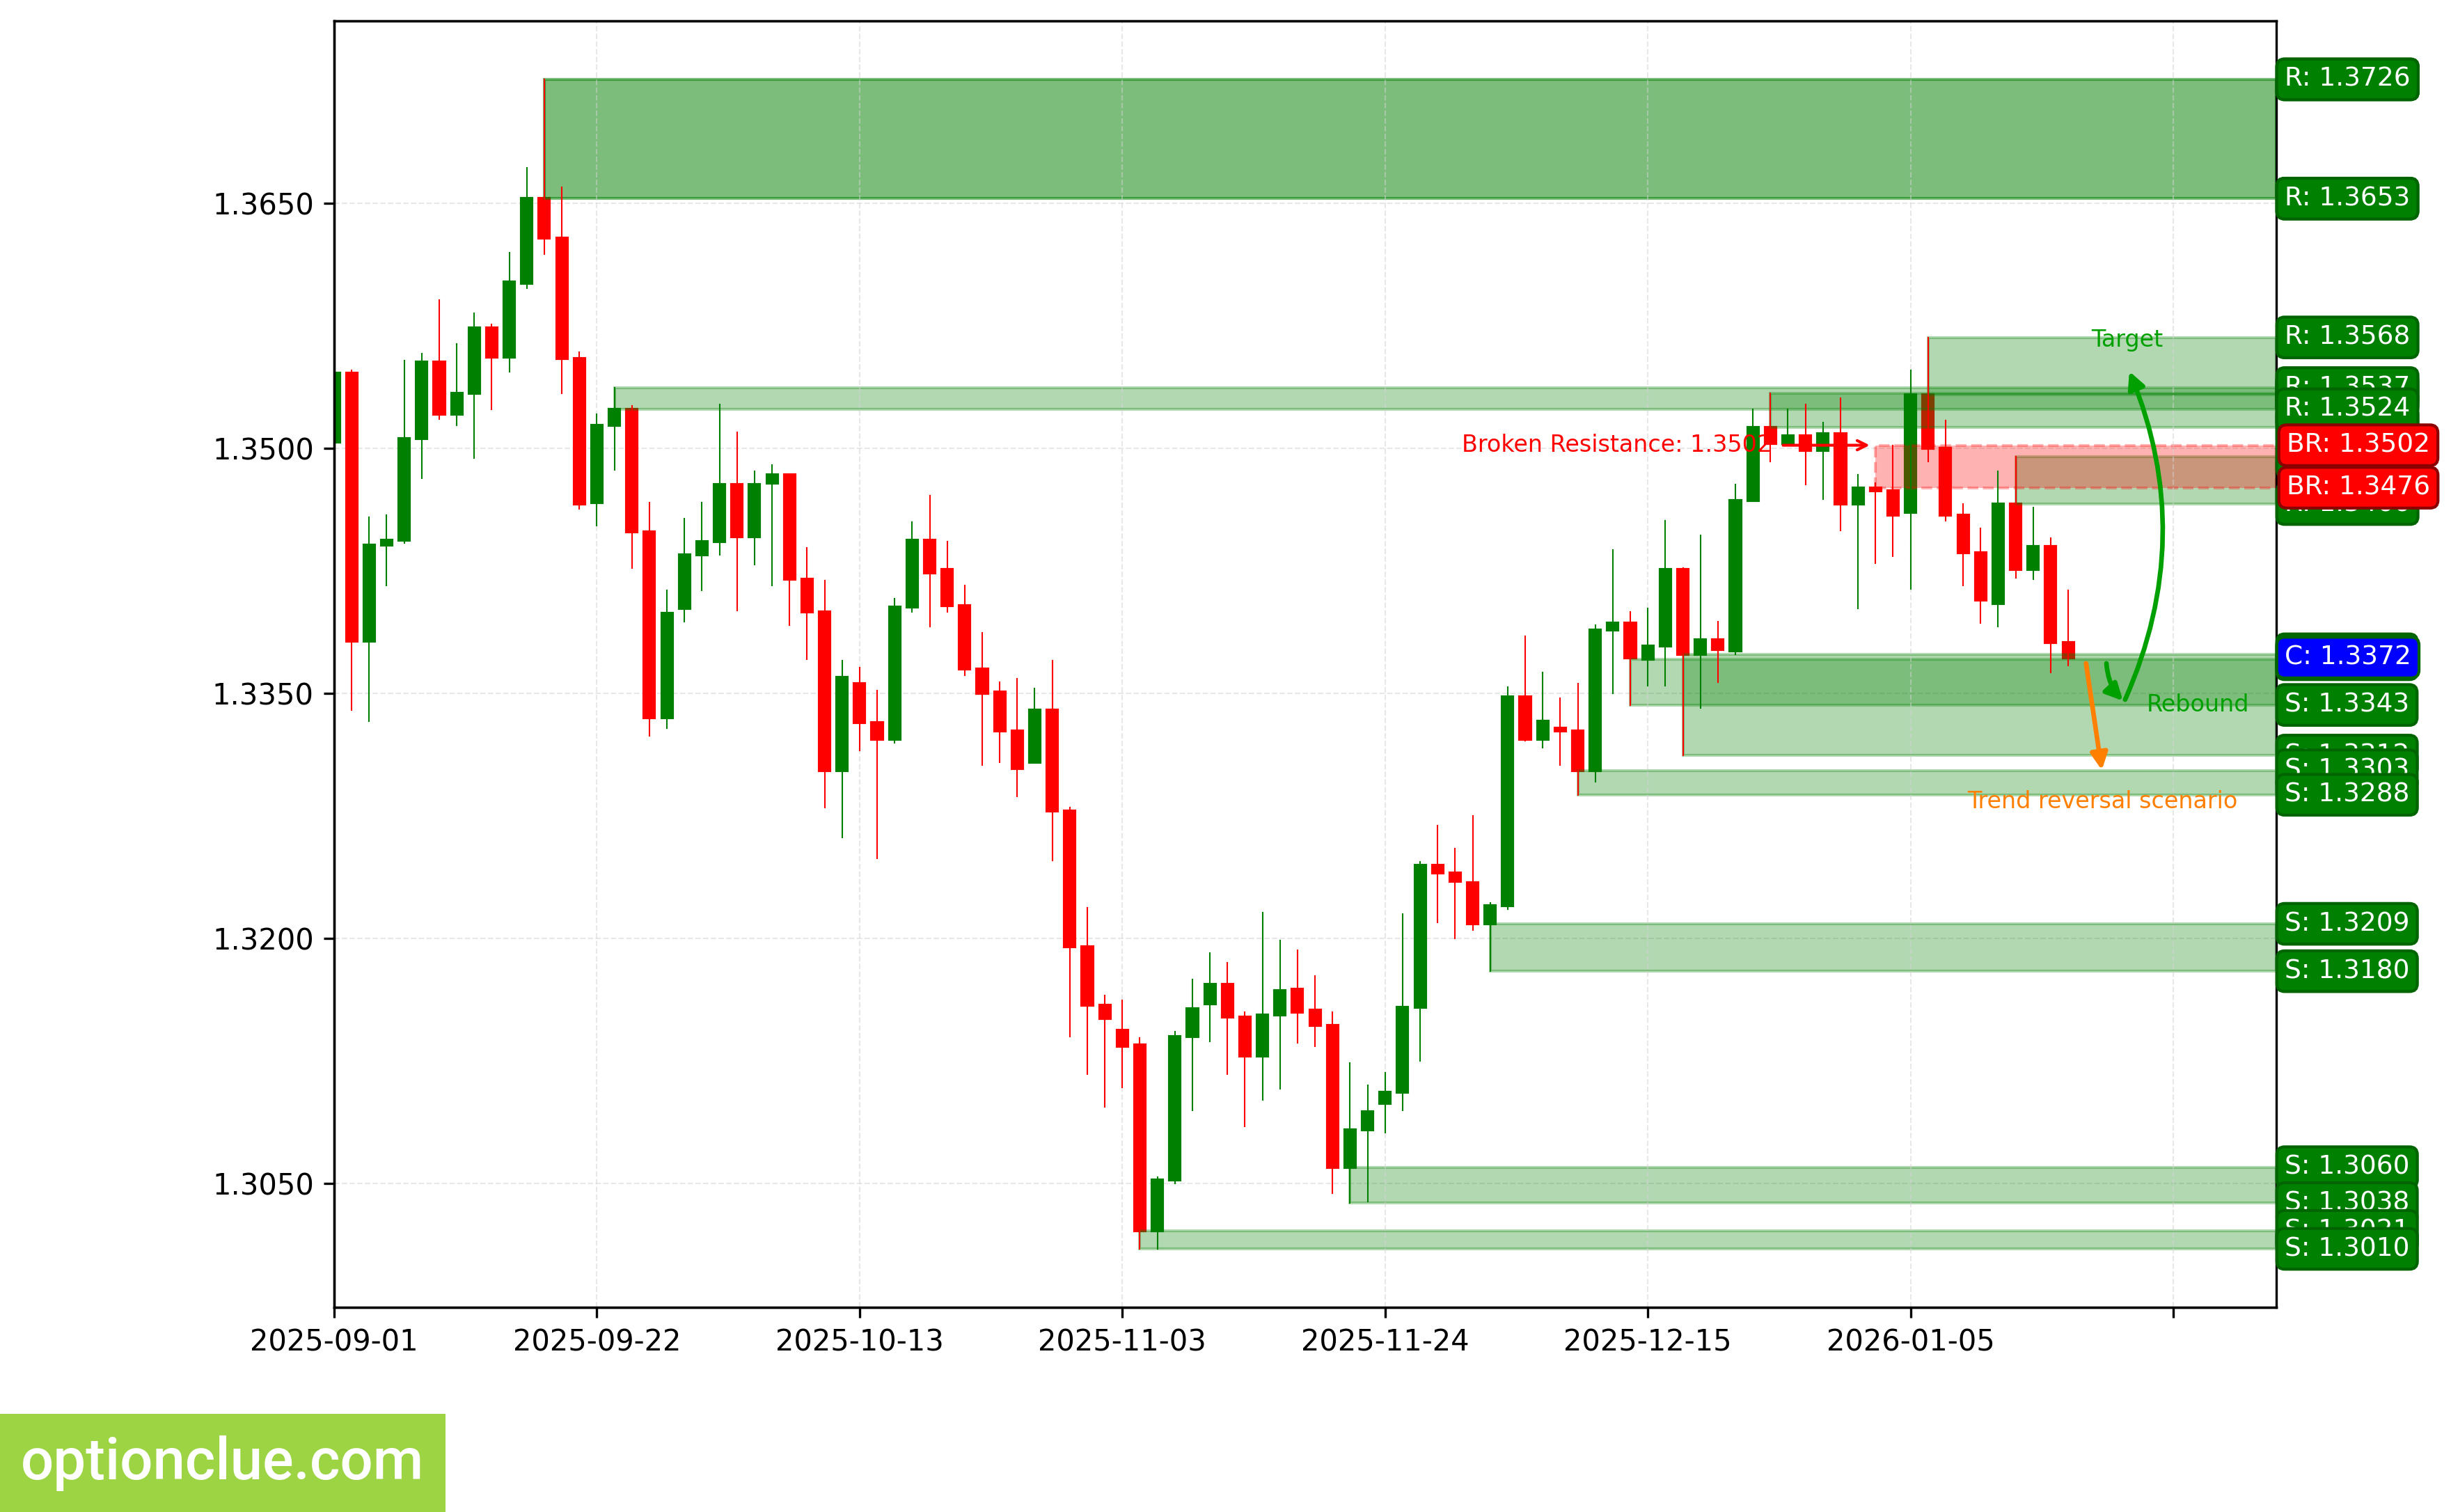
GBPUSD. Technical analysis. D1.
Swiss Franc (USDCHF)
Bearish trend continues, correction wave is developing. The last broken level is support (0.7924 — 0.7942). Breakout occurred 20 candlesticks ago.
Intermediate target for the downward movement is the support level with boundaries 0.7953 — 0.7969. In case of successful trend development, a further target will be at the support level with boundaries 0.7858 — 0.7874.
If the new correction completes near the resistance level (0.8068 — 0.8085), the potential profit/risk ratio may be approximately 1.8:1. When using a further target — around 3.4:1.
Short positions will remain relevant, as long as the market remains below the nearest resistance level with boundaries 0.8068 — 0.8085. If the market successfully closes above this nearest resistance, the trend will reverse to the opposite (bullish).
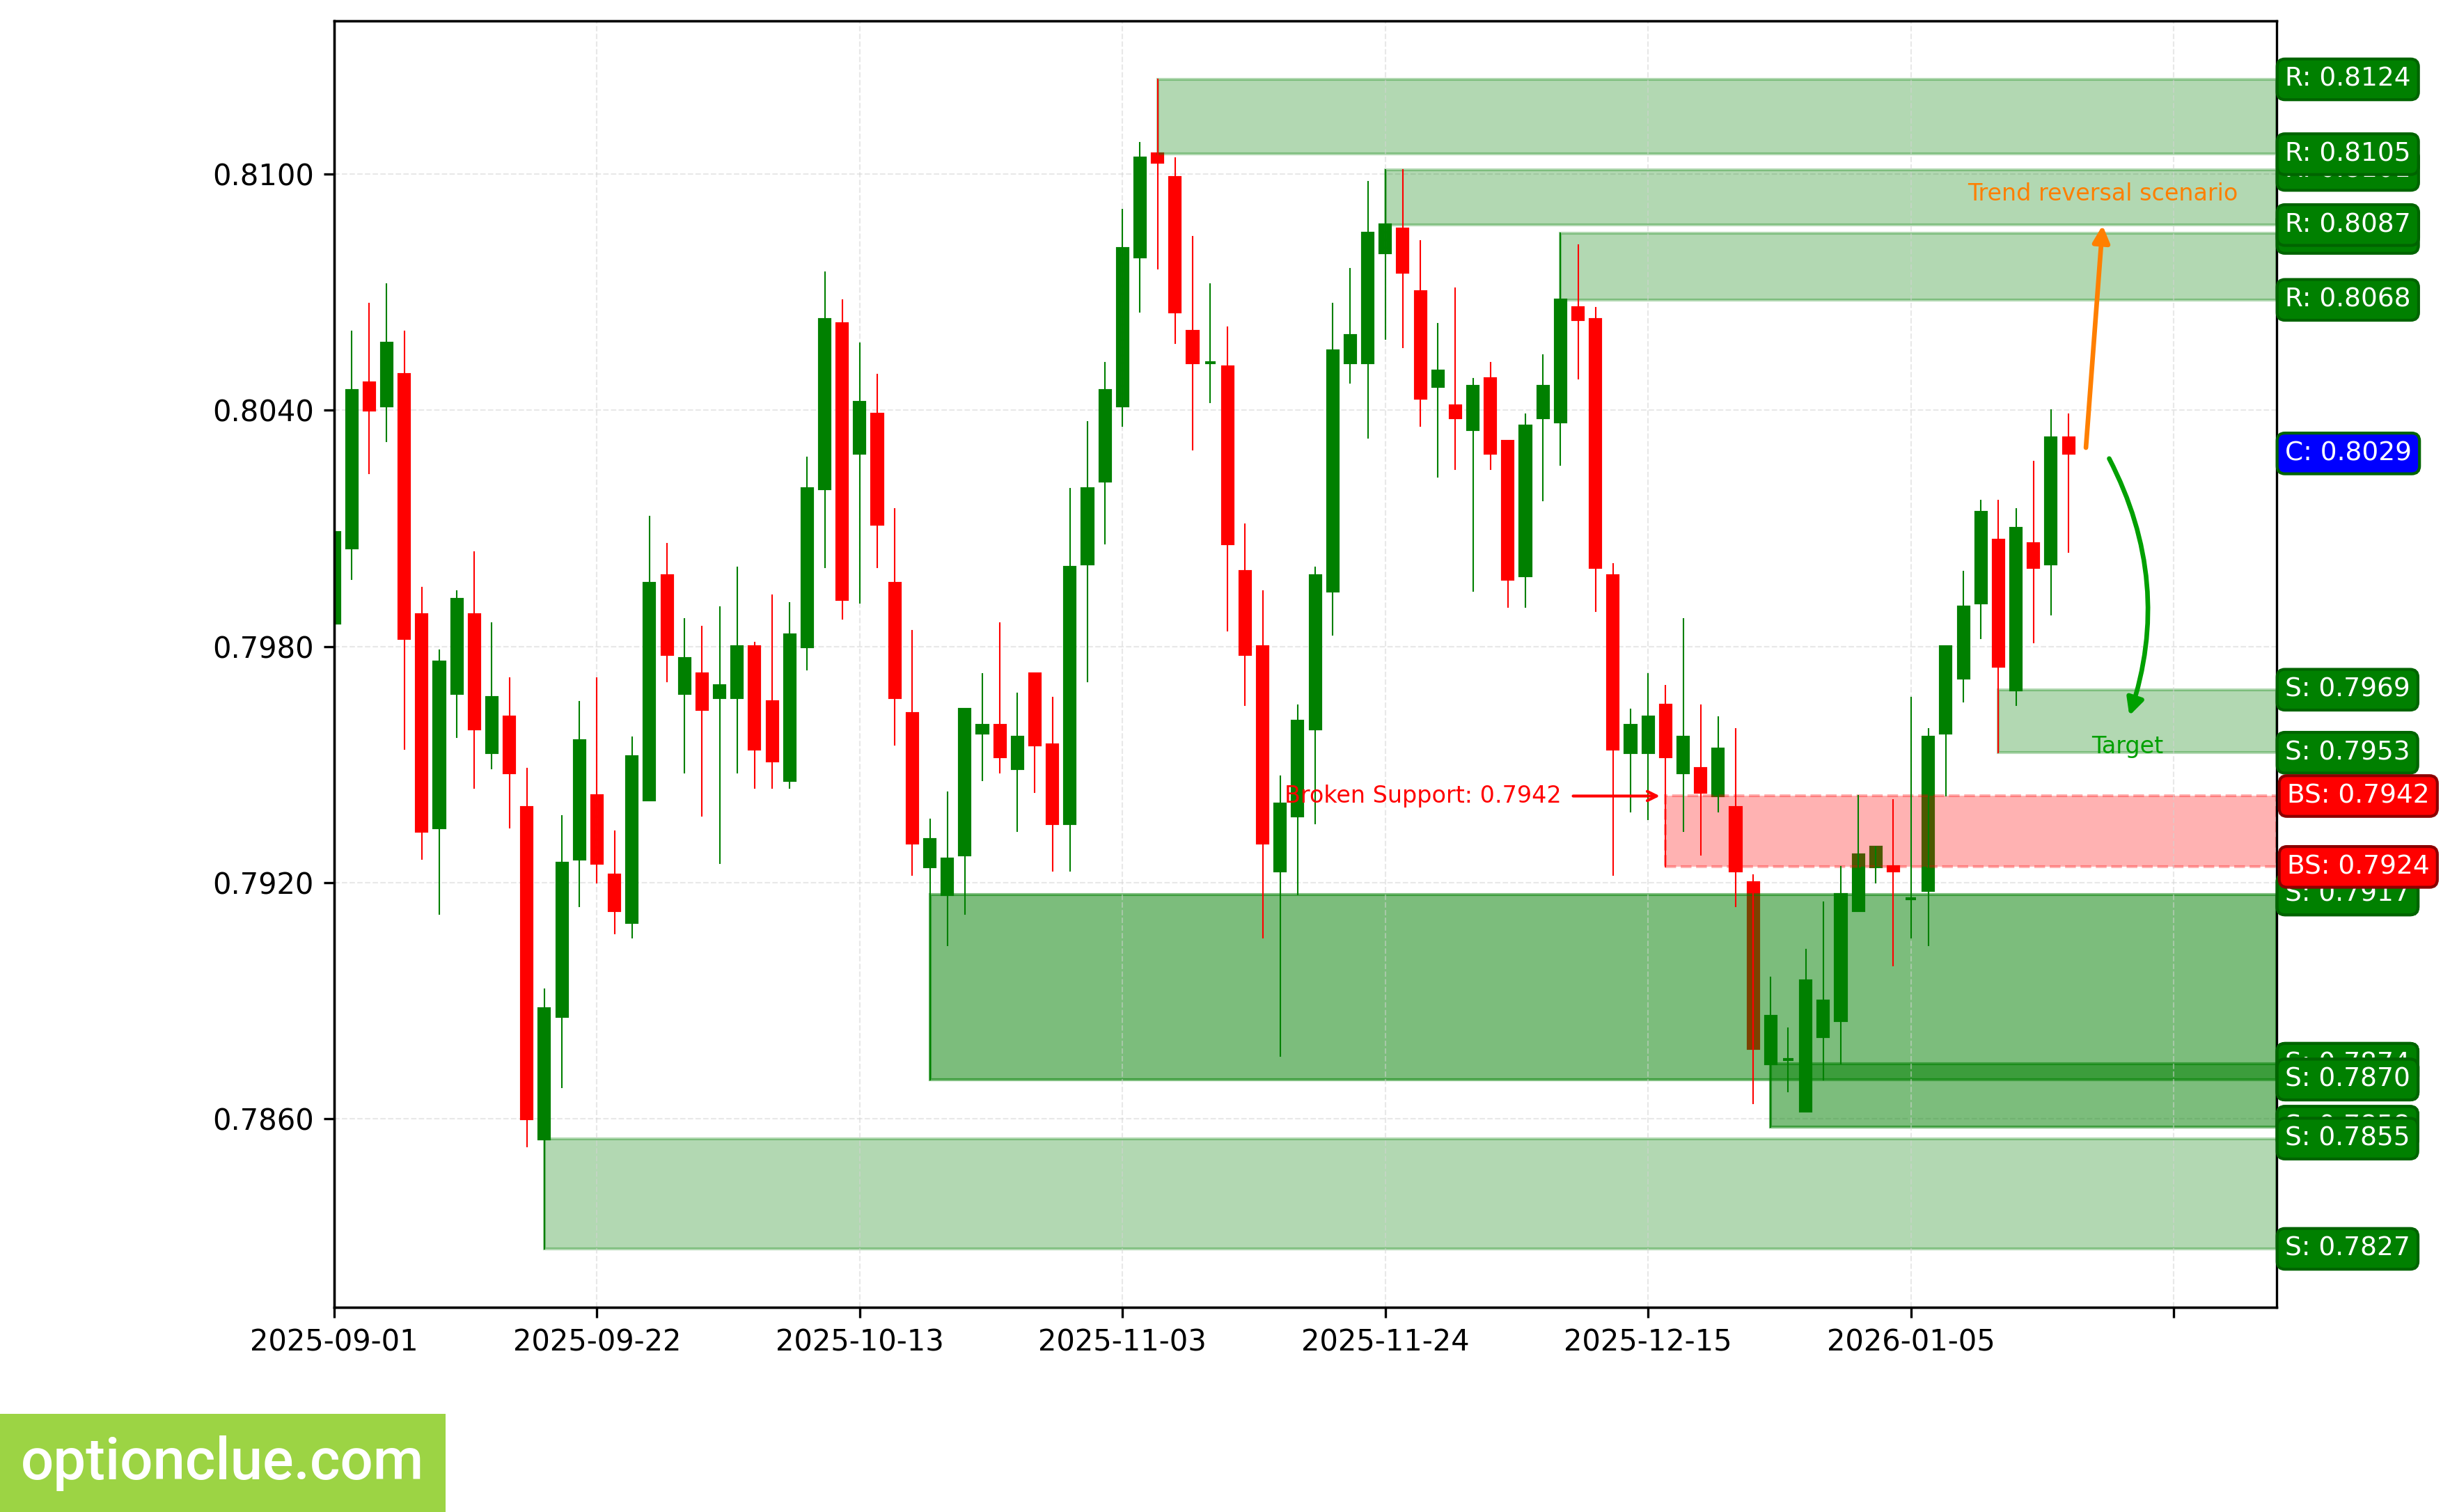
USDCHF. Technical analysis. D1.
Canadian Dollar (USDCAD)
Bullish trend continues, impulse wave is developing. The last broken level is resistance (1.3802 — 1.3805). Breakout occurred 9 candlesticks ago.
Intermediate target for the upward movement is the resistance level with boundaries 1.3956 — 1.3960. In case of successful trend development, a further target will be at the resistance level with boundaries 1.4108 — 1.4124.
Potential profit/risk ratio from current prices when setting targets and fixing risks at daily timeframe levels may be small (approximately 0.3:1). When using a further target — approximately 1.6:1. If the next correction completes near the support level (1.3854 — 1.3872), the potential profit/risk ratio may be around 1.3:1. When using a further target — around 3.4:1.
Long positions will remain relevant, as long as the market is above the nearest support level with boundaries 1.3854 — 1.3872. If the market successfully closes below this support, the trend will reverse to the opposite (bearish).
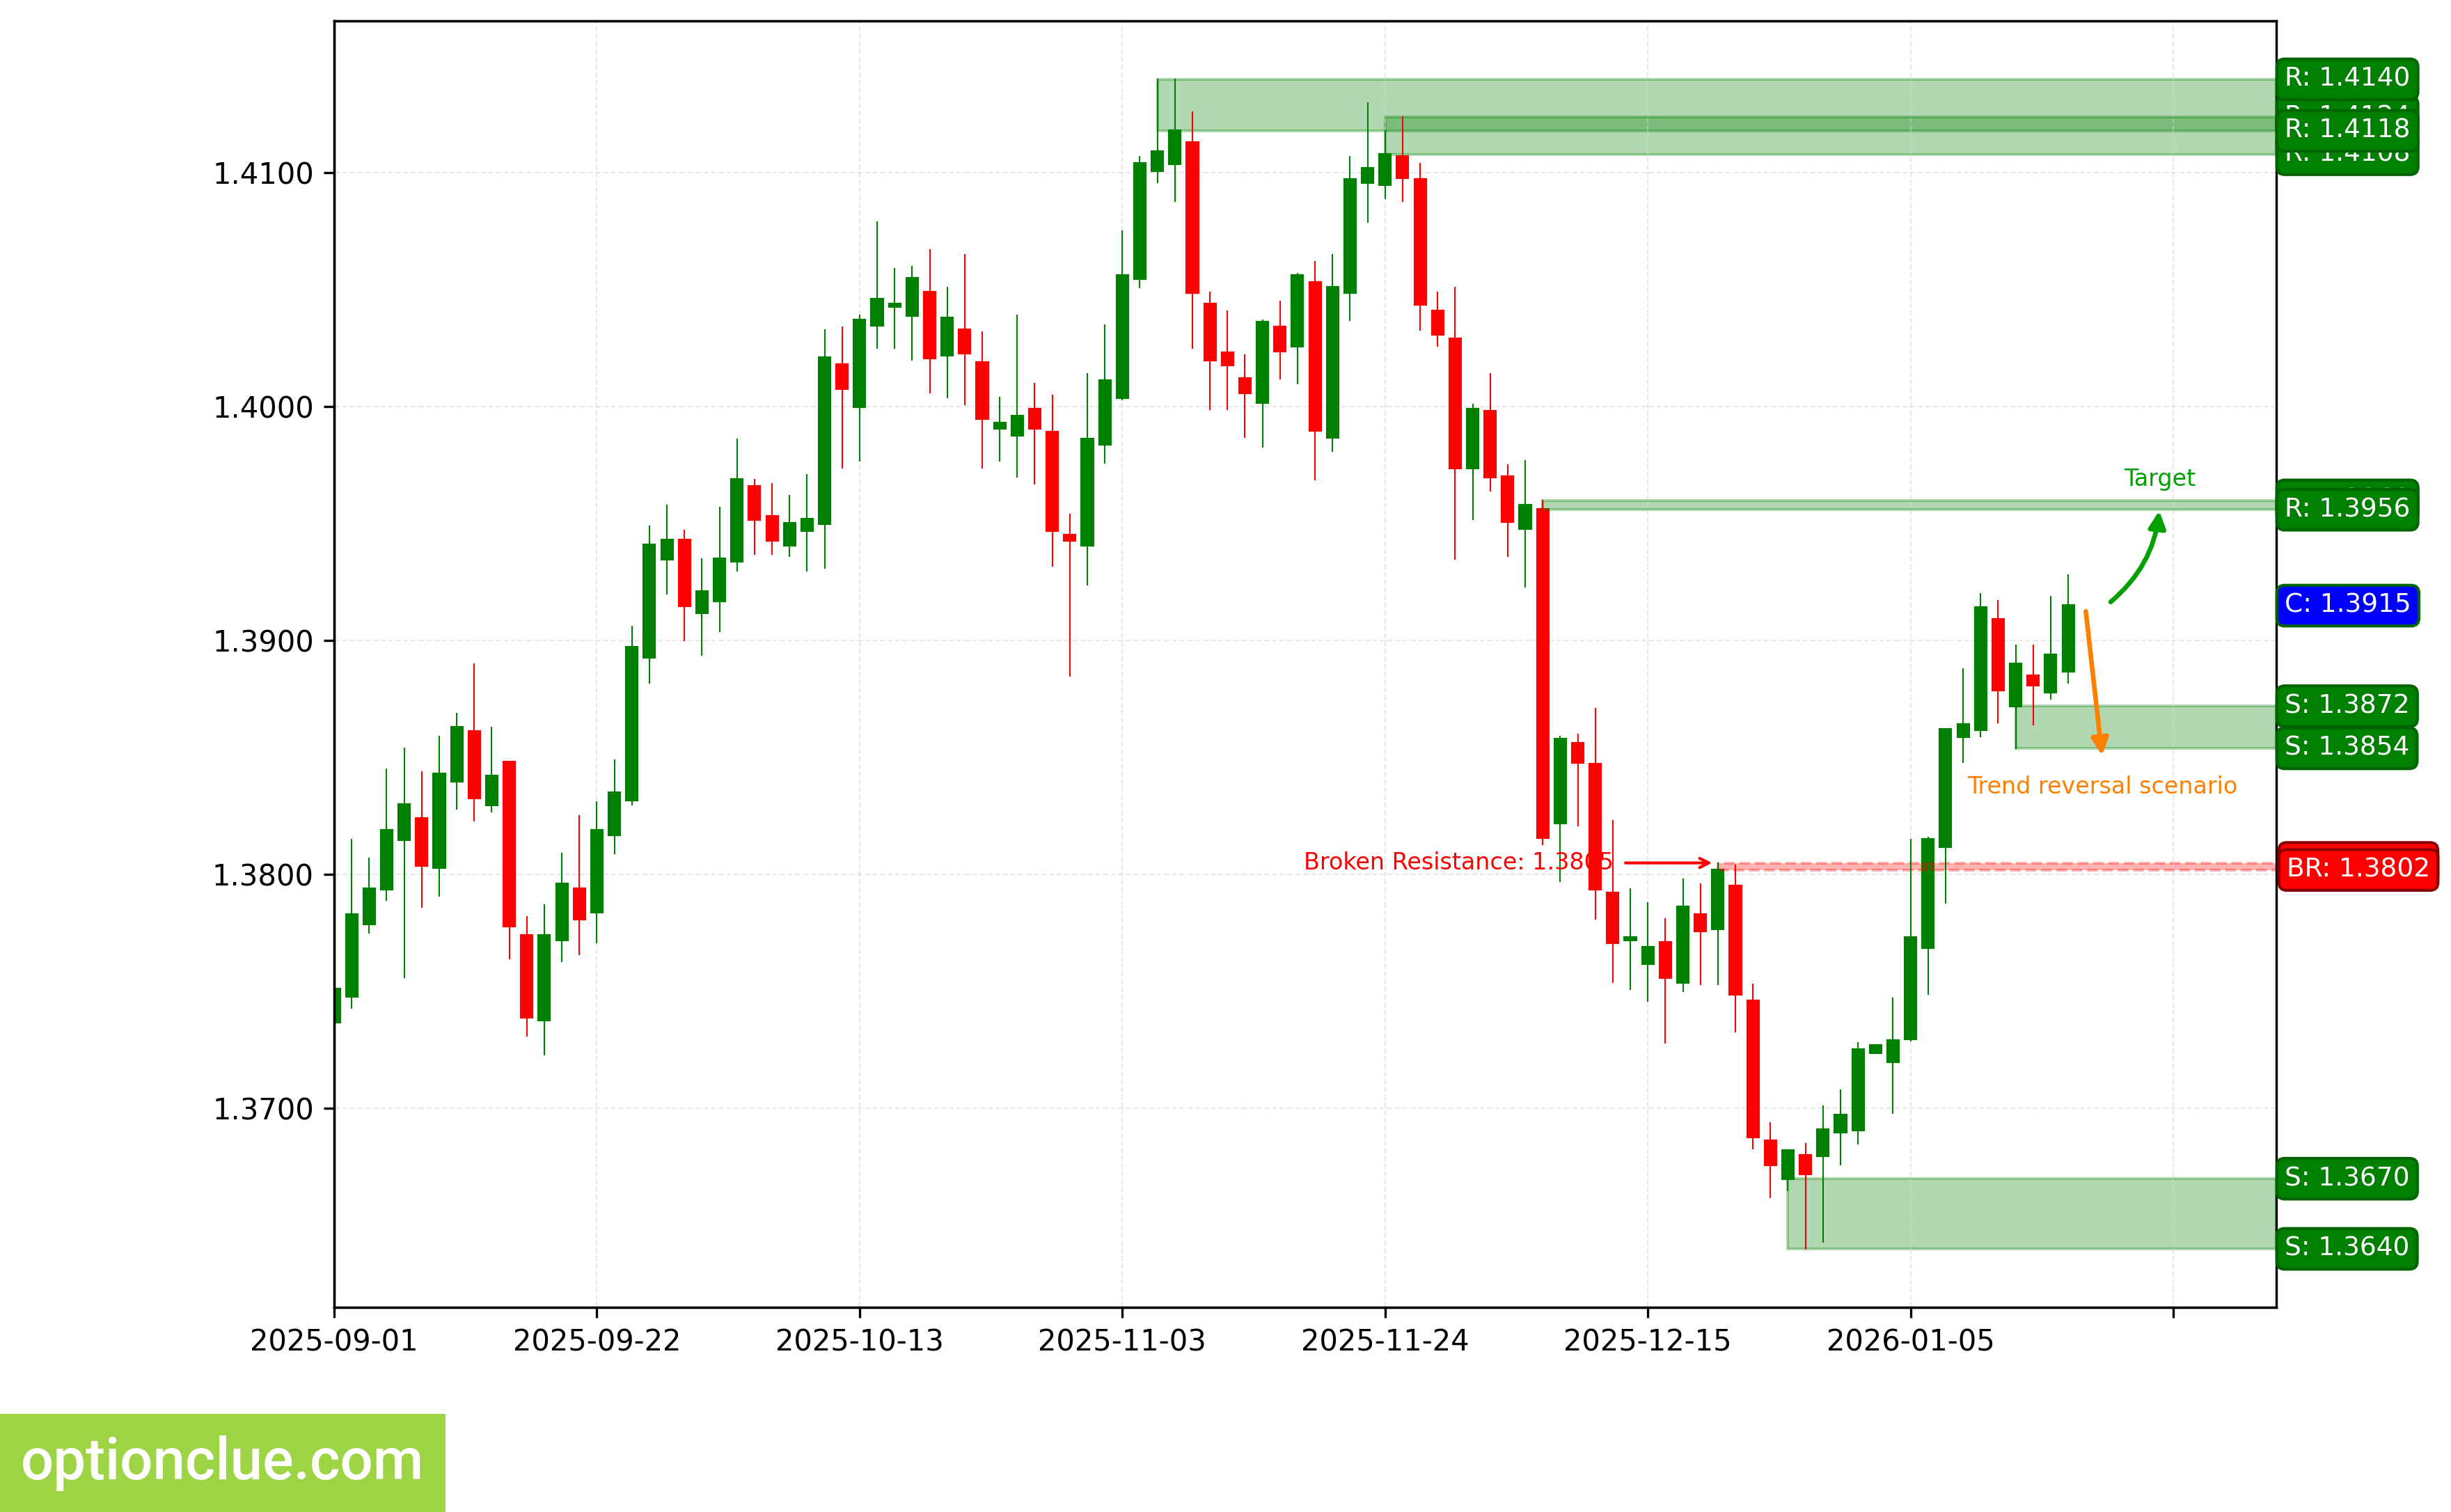
USDCAD. Technical analysis. D1.
Australian Dollar (AUDUSD)
Bullish trend continues, price is consolidating. The last broken level is resistance (0.6716 — 0.6727). Breakout occurred 9 candlesticks ago.
Intermediate target for the upward movement is the resistance level with boundaries 0.6737 — 0.6766. In case of successful trend development, a further target will be at the resistance level with boundaries 0.6915 — 0.6942.
Potential profit/risk ratio from current prices when setting targets and fixing risks at daily timeframe levels may be small (approximately 0.9:1). When using a further target — more than 3:1.
Long positions will remain relevant, as long as the market is above the nearest support level with boundaries 0.6665 — 0.6679. If the market successfully closes below this support, the trend will reverse to the opposite (bearish).
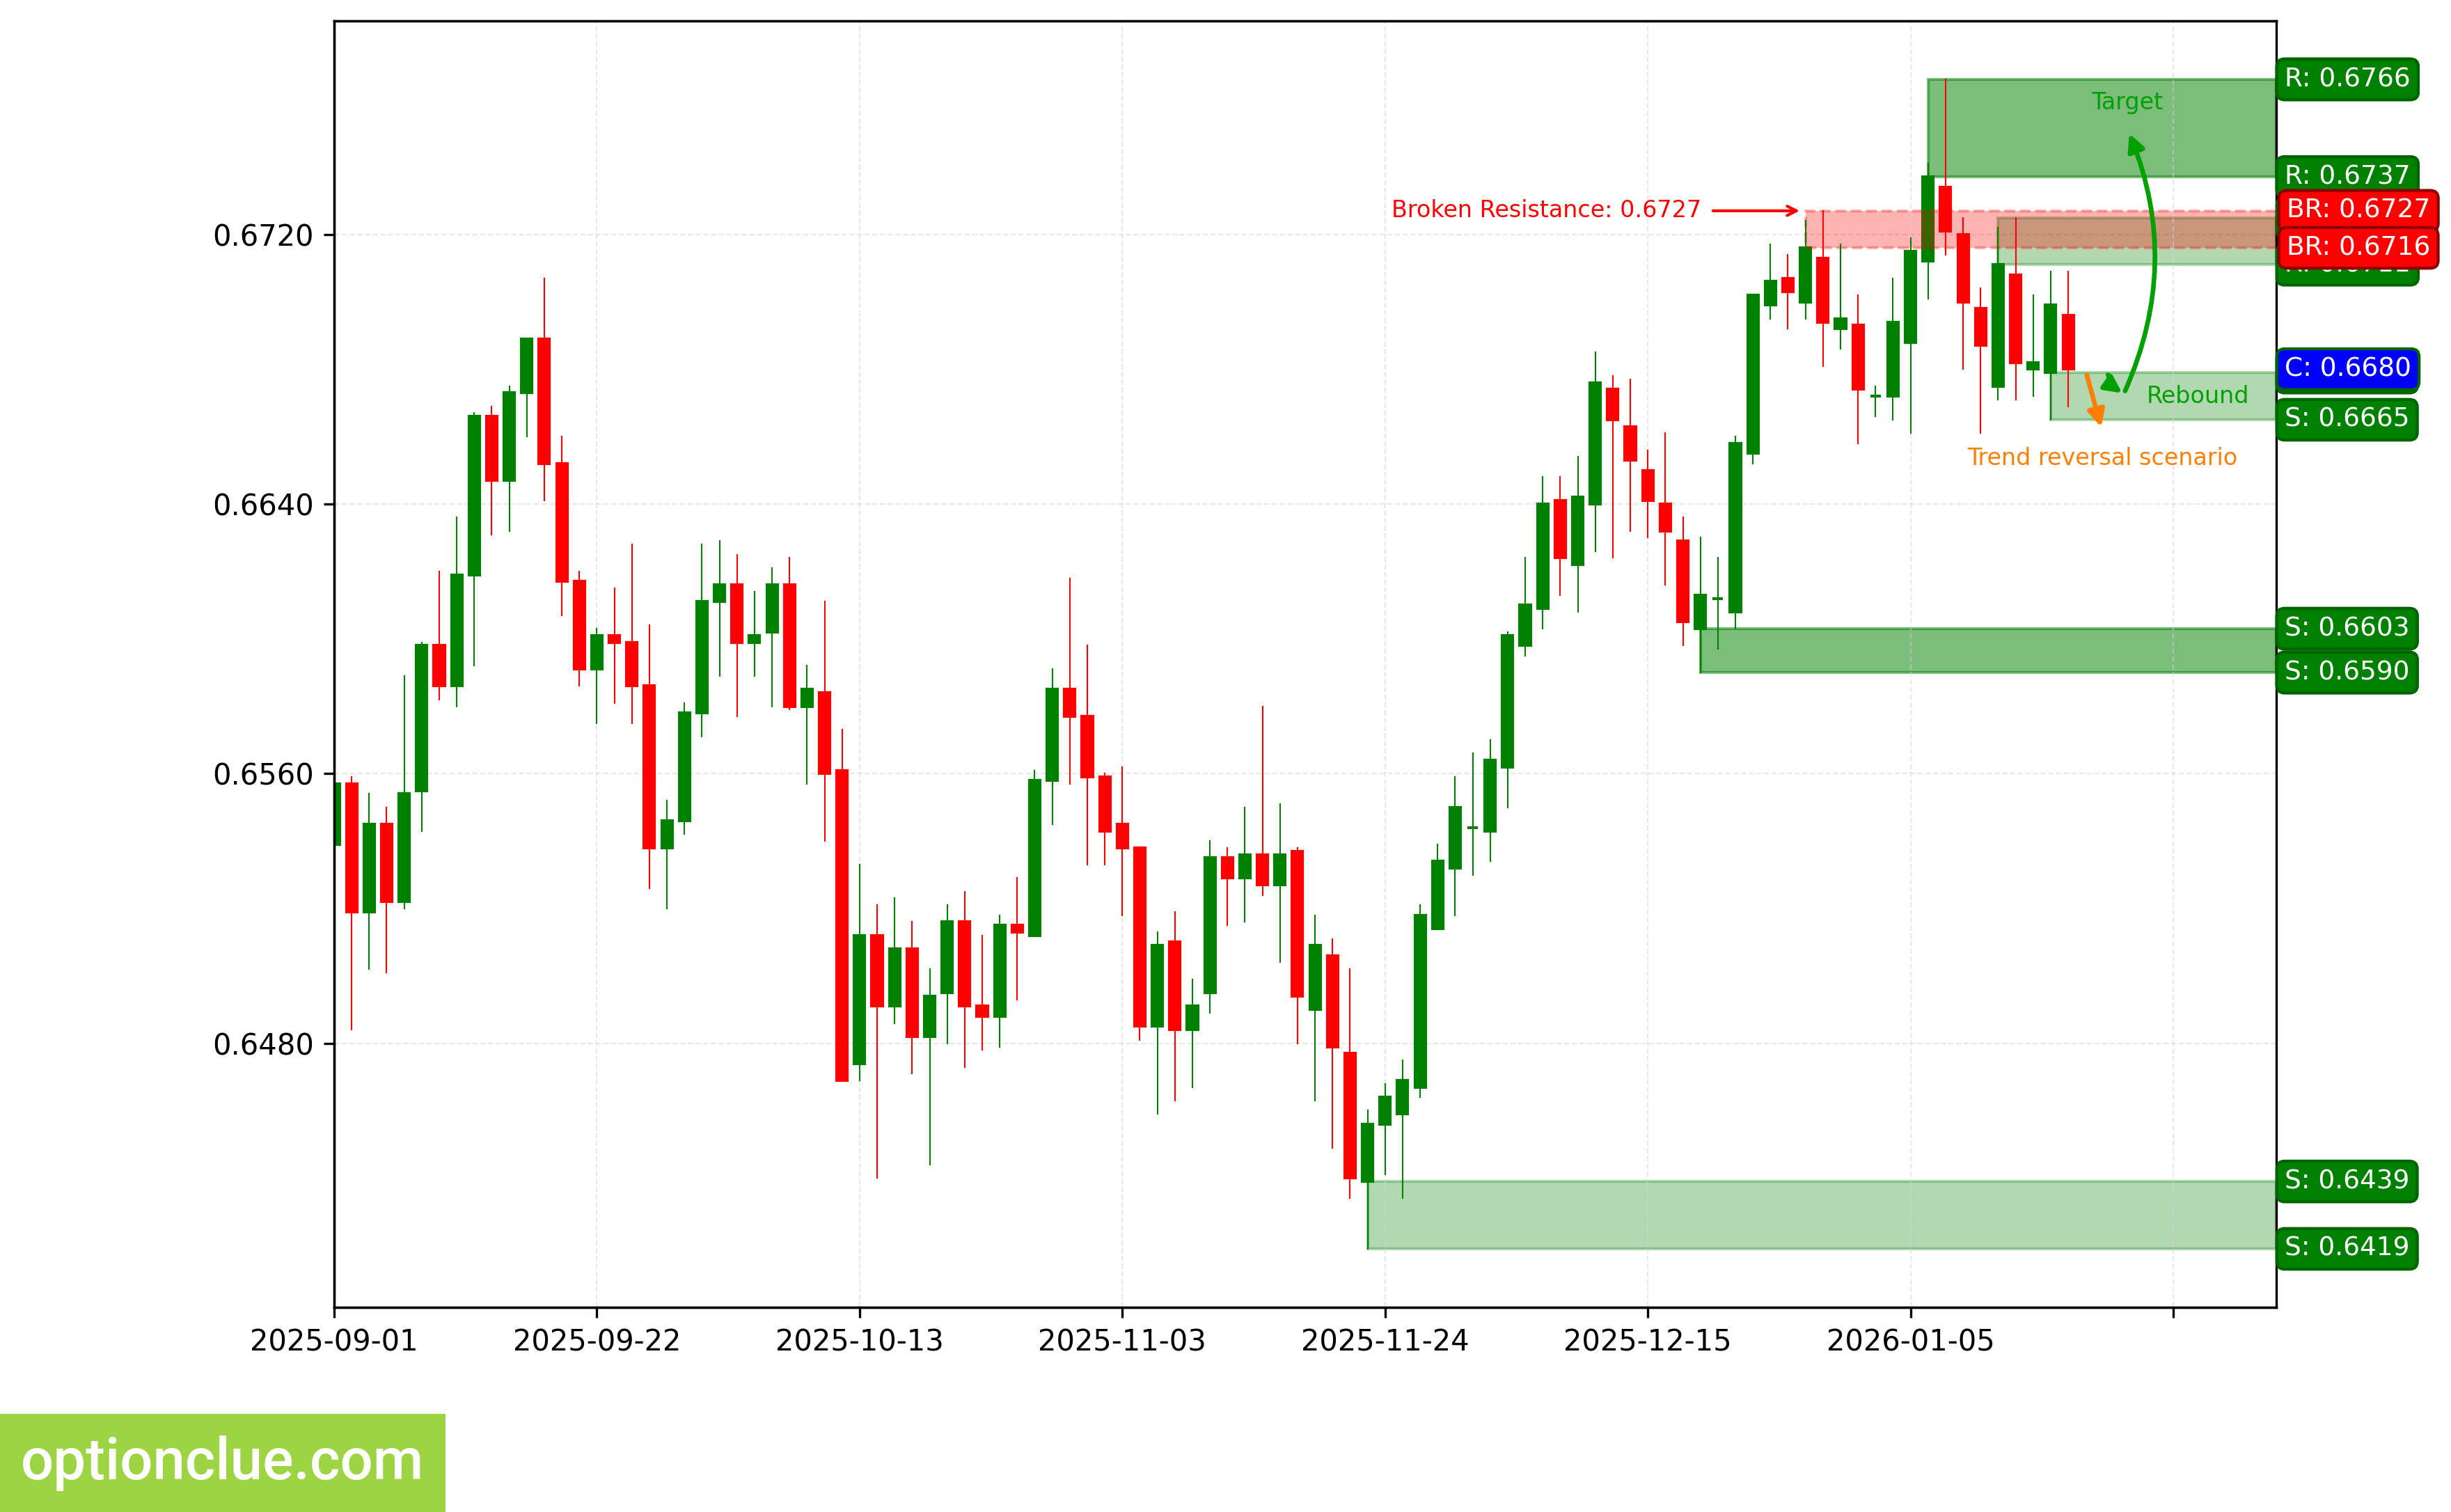
AUDUSD. Technical analysis. D1.
Bitcoin (BTC)
Bullish trend continues, correction wave is developing. An entry point for buying on rebound may form after the current correction completes. The last broken level is resistance (93883 — 94762). Breakout occurred 4 candlesticks ago.
Intermediate target for the upward movement is the resistance level with boundaries 96931 — 97861. In case of successful trend development, a further target will be at the resistance level with boundaries 105997 — 107428.
Potential profit/risk ratio from current prices when setting targets and fixing risks at daily timeframe levels may be small (around 0.2:1). When using a further target — approximately 1.3:1. If the next correction completes near the support level (89625 — 90385), the potential profit/risk ratio may be approximately 2.5:1. When using a further target — around 6:1. If the next correction completes near the last broken level (93883 — 94762), the potential profit/risk ratio may be small (approximately 0.4:1). When selecting a further target — approximately 1.6:1.
Long positions will remain relevant, as long as the market is above the nearest support level with boundaries 89625 — 90385. If the market successfully closes below this support, the trend will reverse to the opposite (bearish).
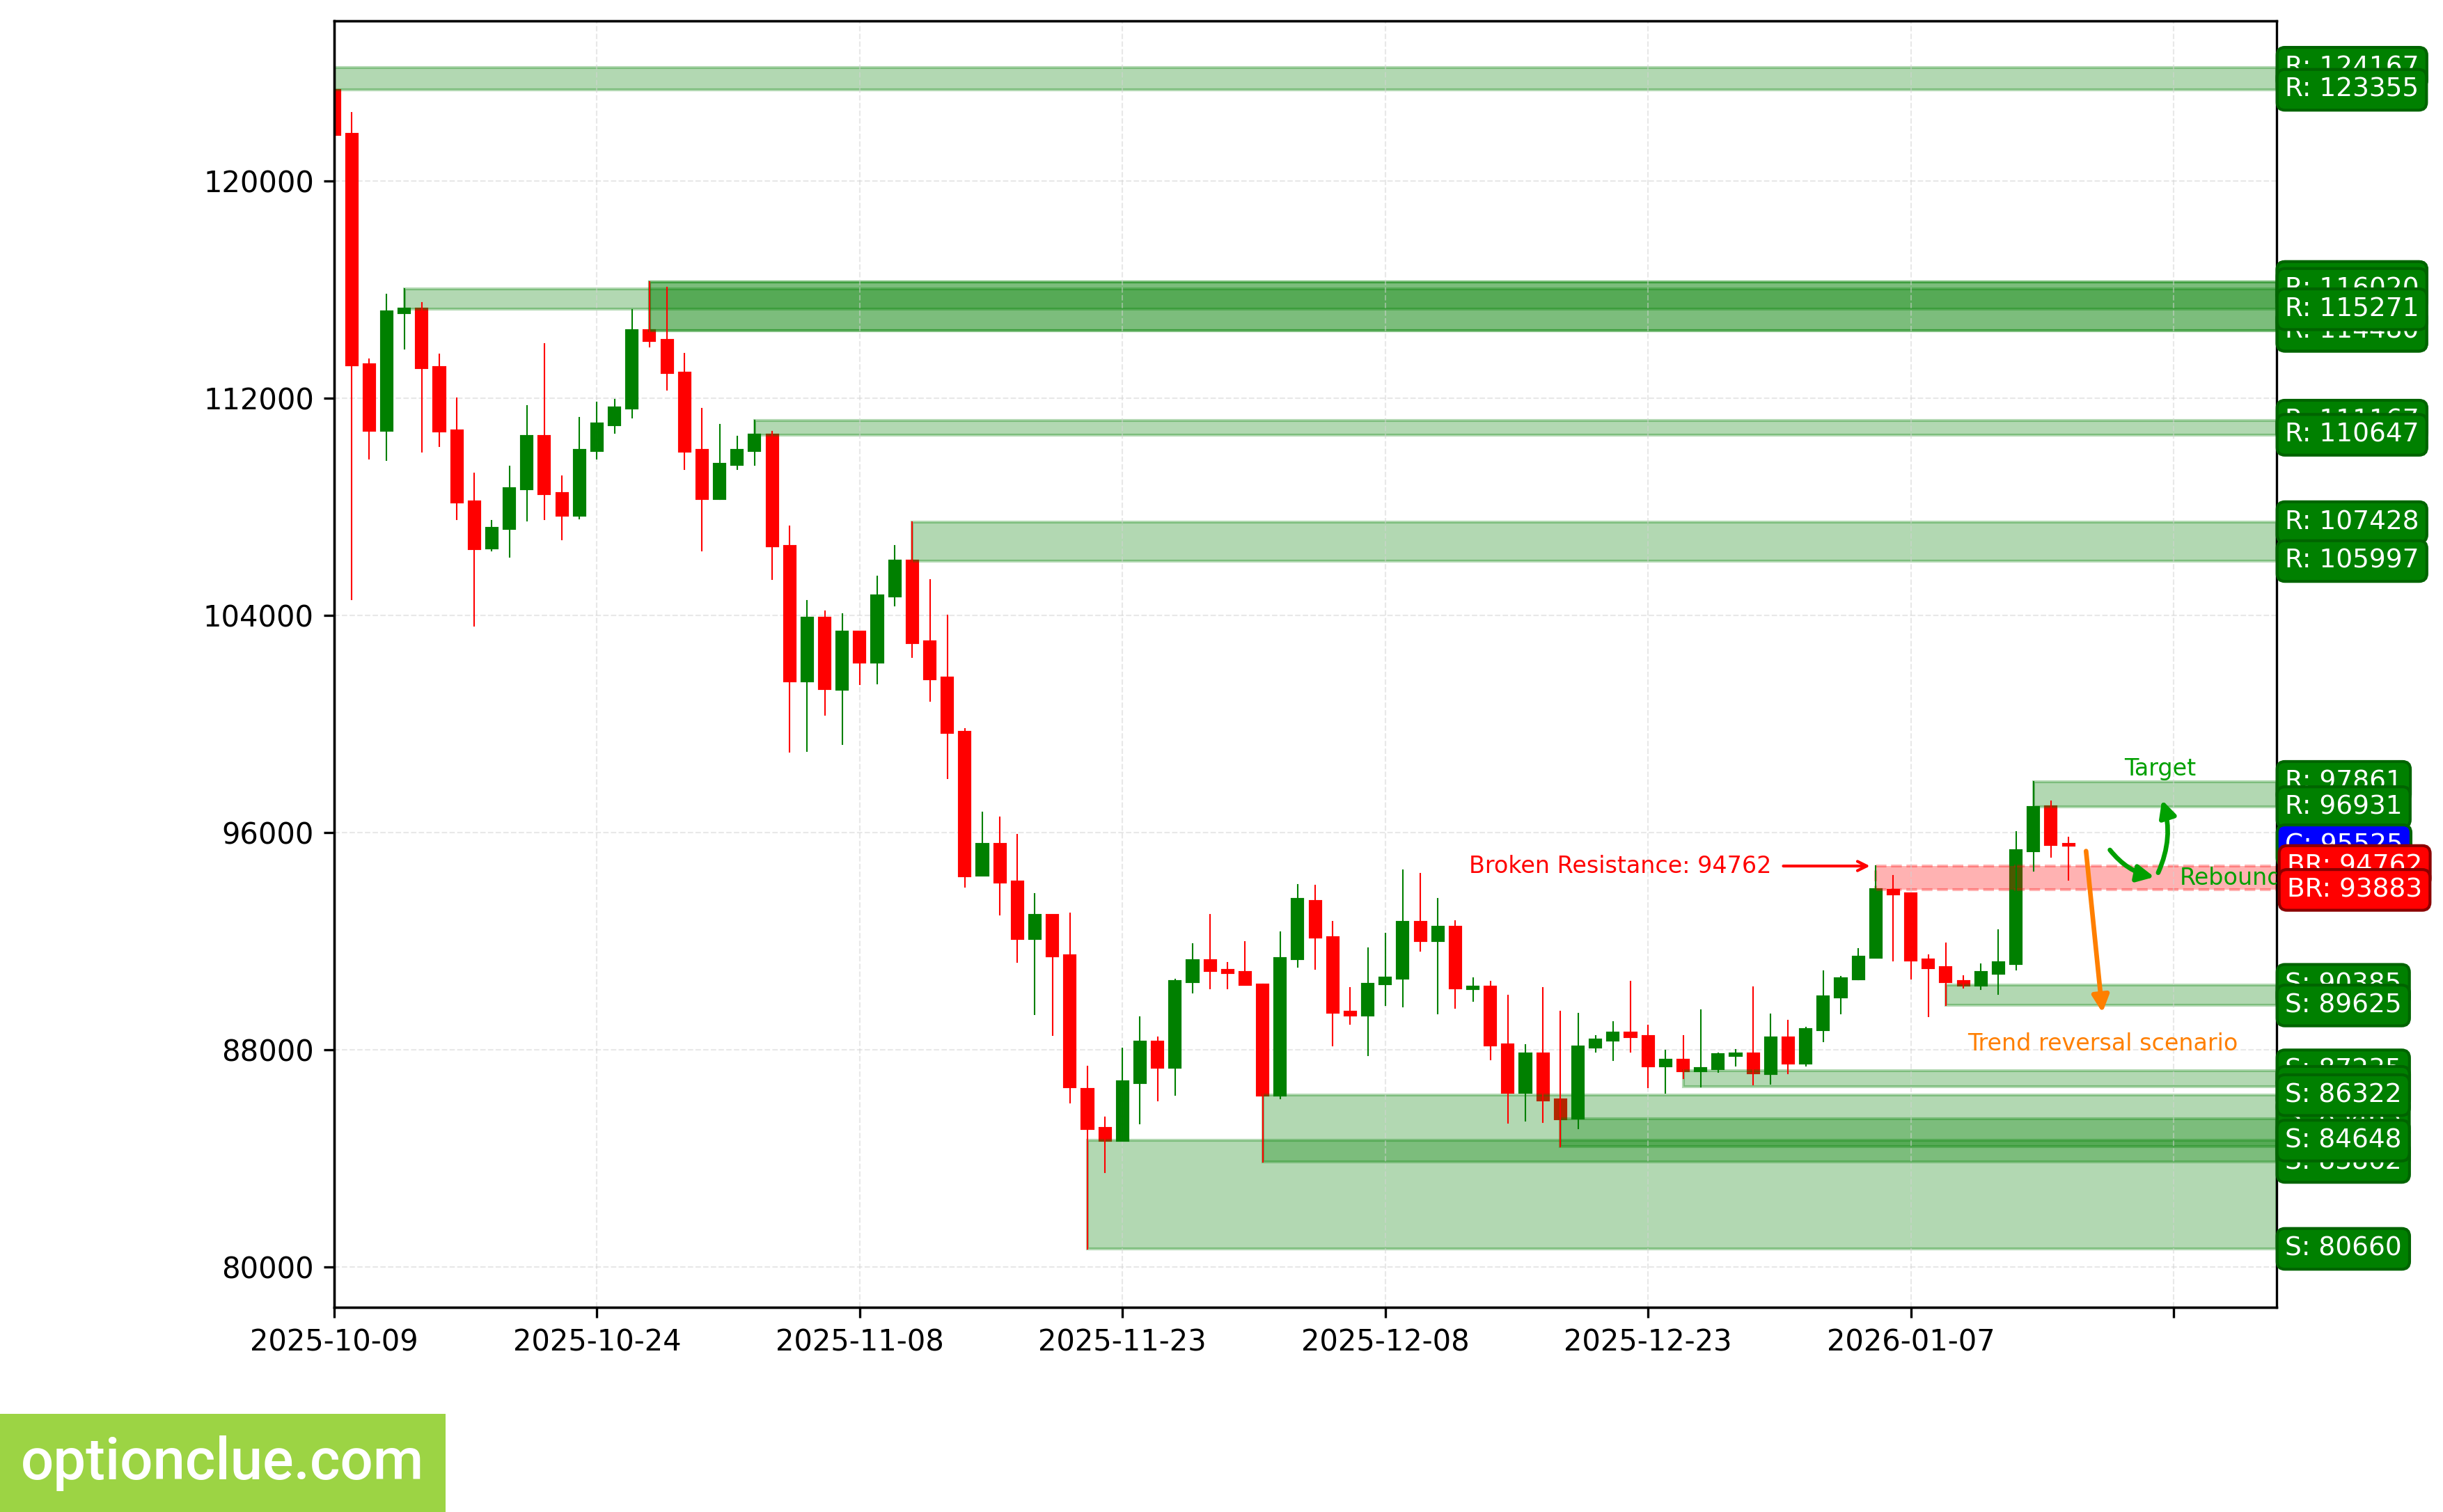
BTC. Technical analysis. D1.
Ether (ETH)
Bullish trend continues, correction wave is developing. An entry point for buying on rebound may form after the current correction completes. The last broken level is resistance (3296 — 3304). Breakout occurred 4 candlesticks ago.
Intermediate target for the upward movement is the resistance level with boundaries 3355 — 3398. In case of successful trend development, a further target will be at the resistance level with boundaries 3583 — 3656.
Potential profit/risk ratio from current prices when setting targets and fixing risks at daily timeframe levels may be small (around 0.1:1). When using a further target — also small (approximately 0.6:1). If the correction completes near the support level (2891 — 2904), the potential profit/risk ratio may be around 3.9:1. When using a further target — around 5.9:1.
Long positions will remain relevant, as long as the market remains above the nearest support level with boundaries 2891 — 2904. If the market successfully closes below this support, the trend will reverse to the opposite (bearish).
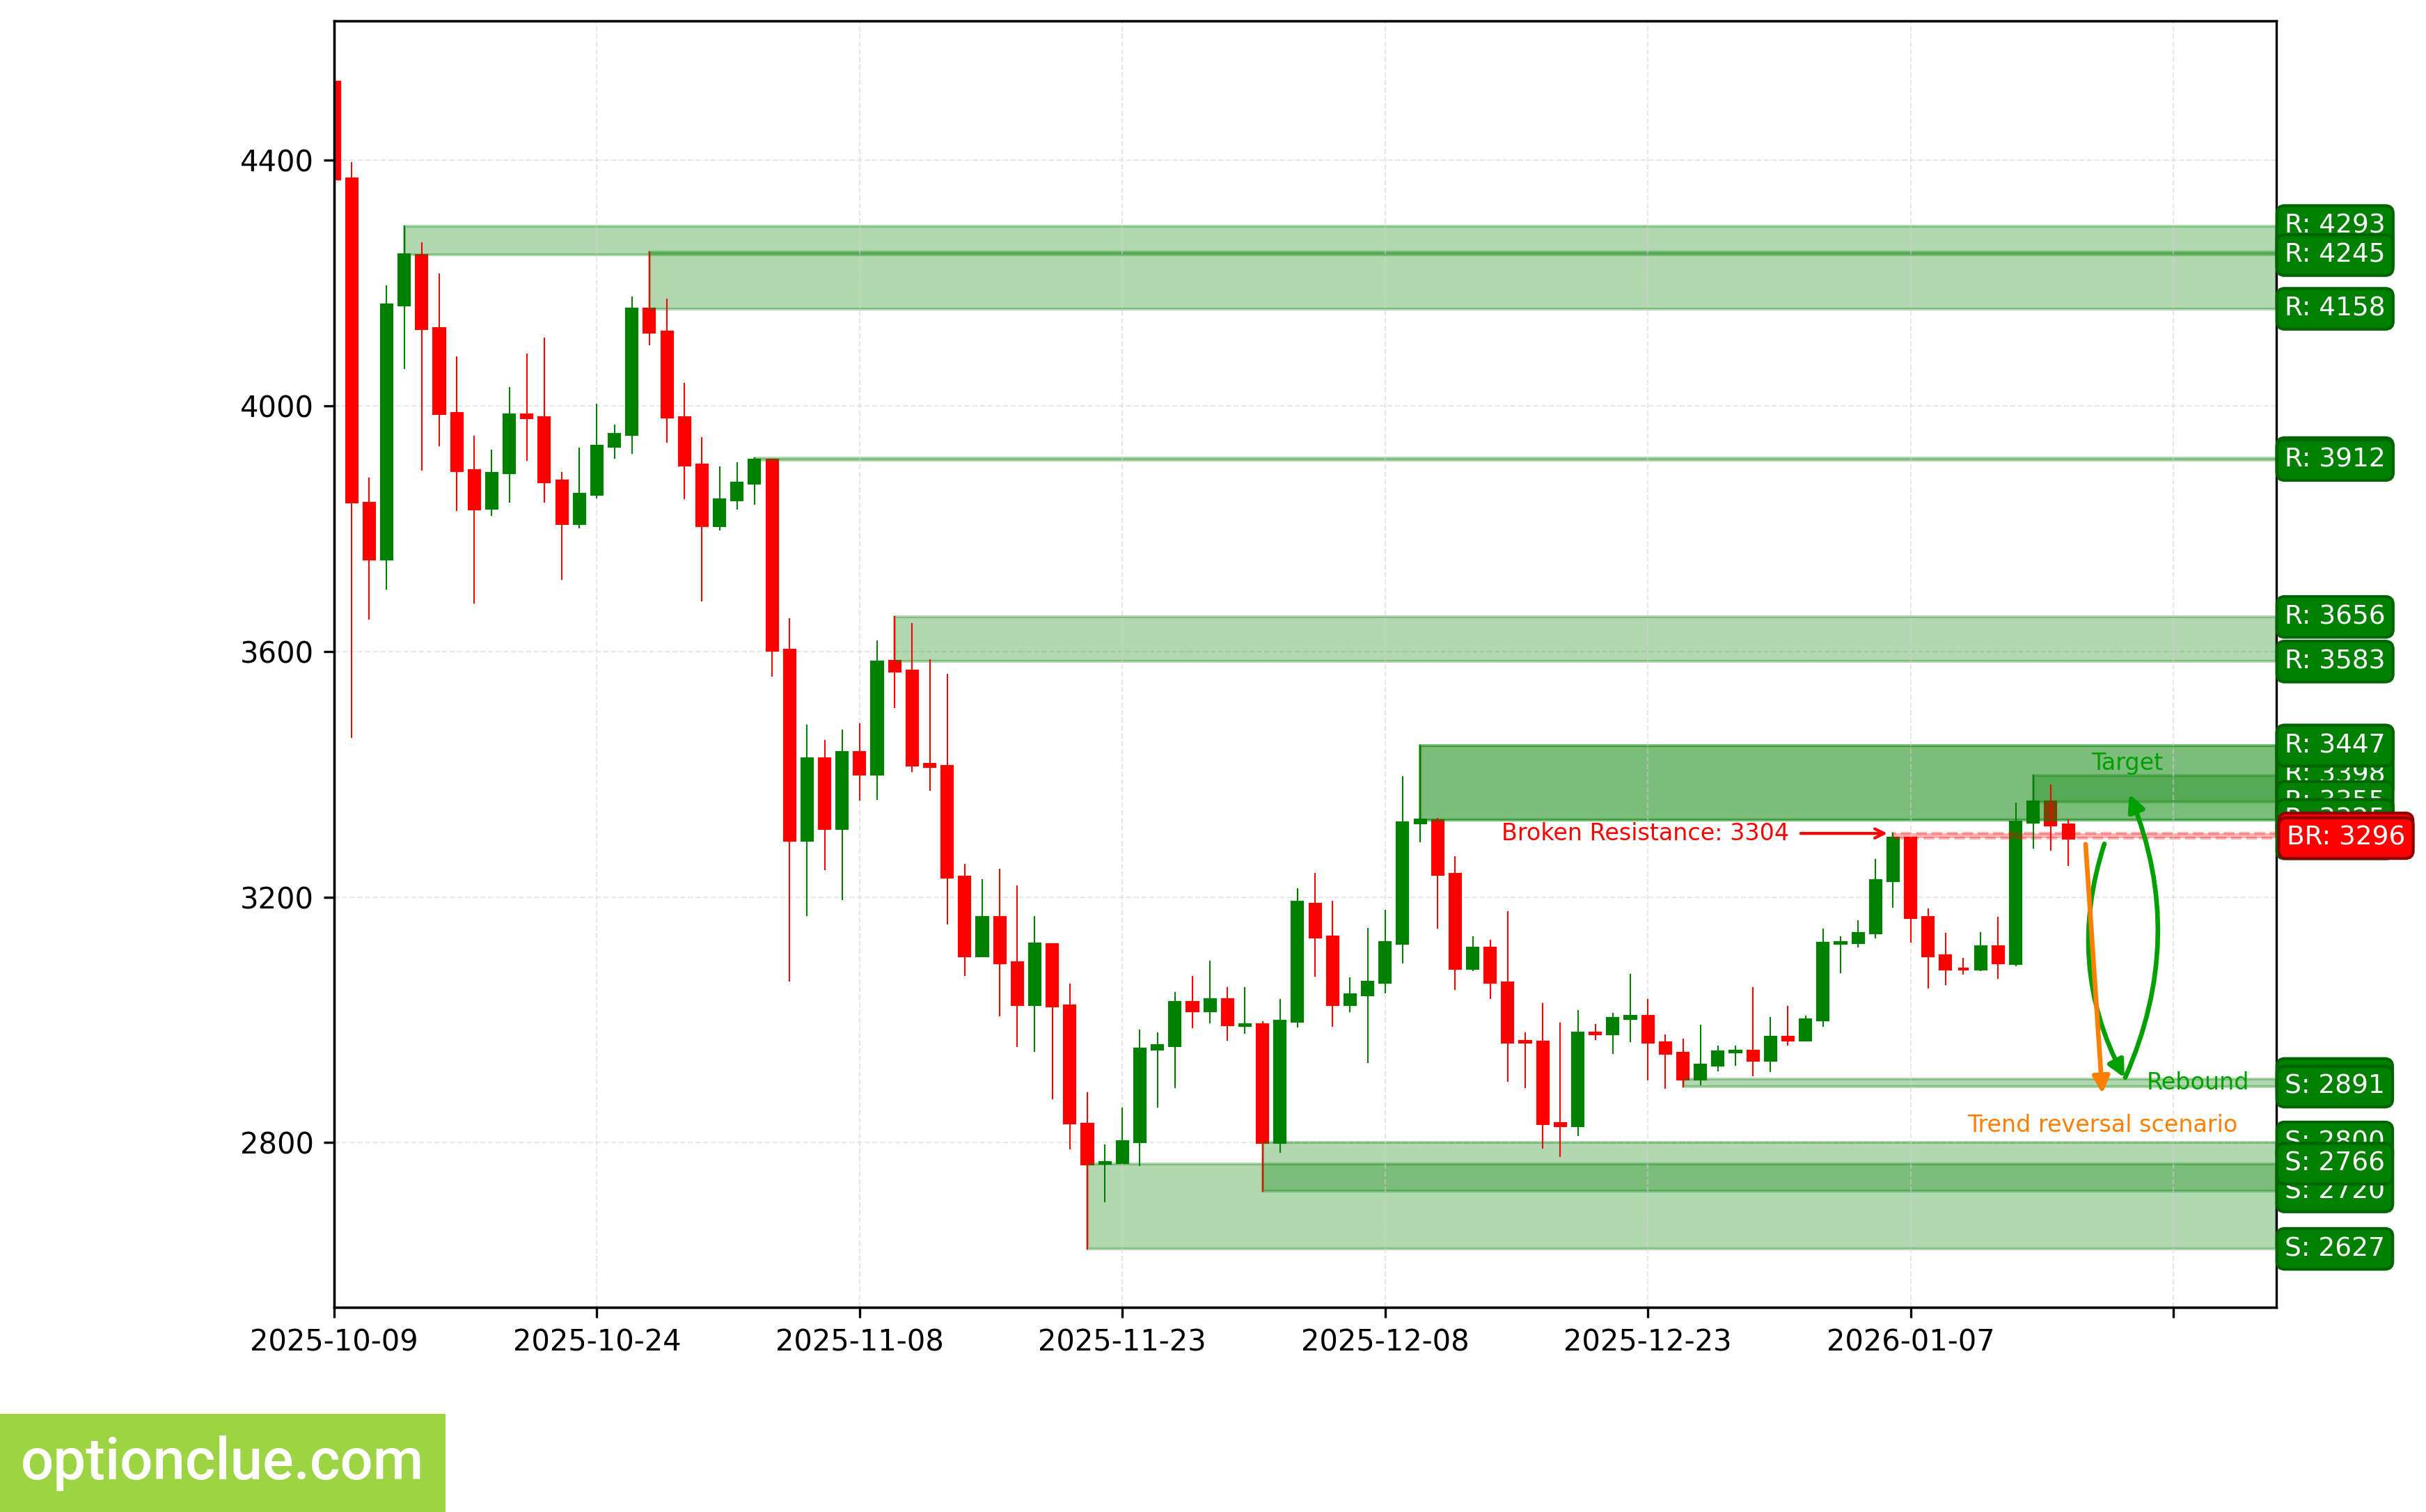
ETH. Technical analysis. D1.
Apple Inc (AAPL)
Bearish trend continues, impulse wave is developing after the breakout of the level. The last broken level is support (255.70 — 257.02). Breakout occurred on the last closed candlestick.
Intermediate target for the downward movement is the support level with boundaries 245.13 — 247.45. In case of successful trend development, a further target will be at the support level with boundaries 225.95 — 226.79.
If the next correction completes near the resistance level (260.65 — 261.82), the potential profit/risk ratio may be approximately 2.7:1. When using a further target — around 6.8:1.
Short positions will remain relevant, as long as the market remains below the nearest resistance level with boundaries 260.65 — 261.82. If the market successfully closes above this nearest resistance, the trend will reverse to the opposite (bullish).
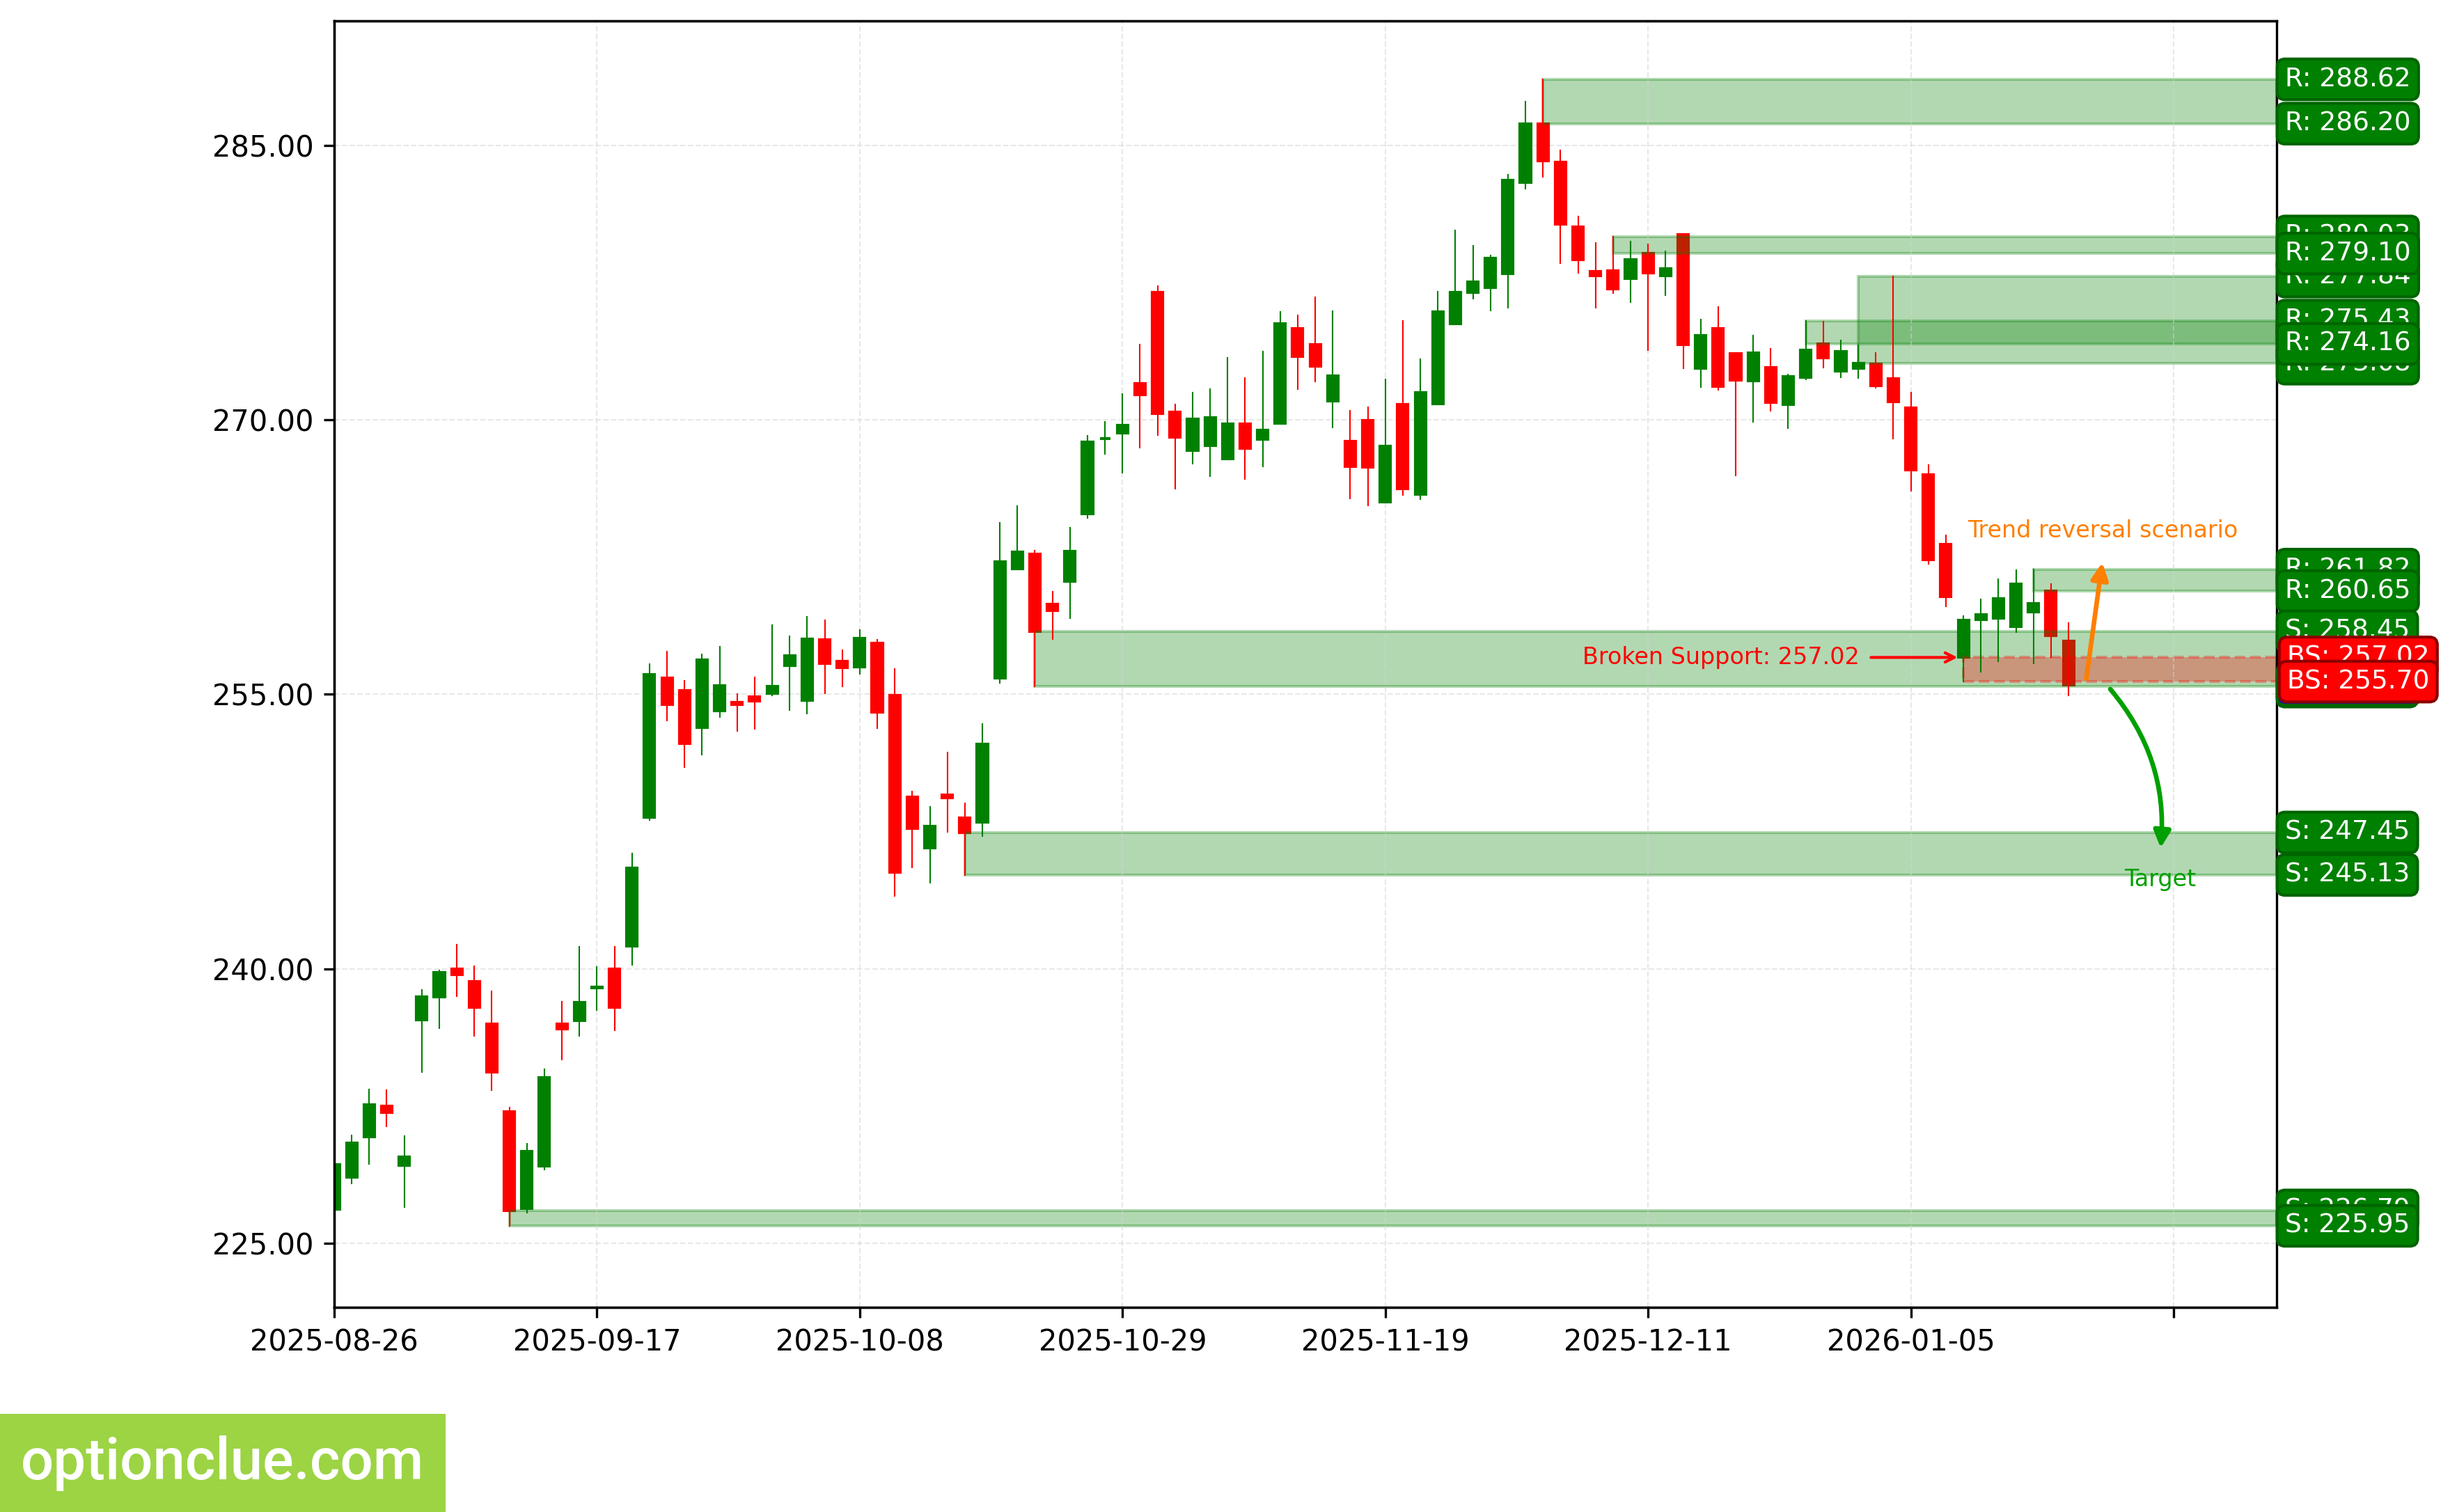
AAPL. Technical analysis. D1.
NVIDIA Corp (NVDA)
Bullish trend continues, correction wave is developing. An entry point for buying on rebound may form after the current correction completes. The last broken level is resistance (185.56 — 188.00). Breakout occurred 17 candlesticks ago, and price has returned to this last broken level.
Upon resumption of the upward movement, the first target will be the resistance level with boundaries 190.53 — 192.69. In case of successful trend development, a further target will be at the resistance level with boundaries 199.05 — 199.94.
If the correction completes near the support level (183.02 — 183.22), the potential profit/risk ratio may be approximately 1.4:1. When using a further target — around 3:1.
Long positions will remain relevant, as long as the market remains above the nearest support level with boundaries 183.02 — 183.22. If the market successfully closes below this support, the trend will reverse to the opposite (bearish).
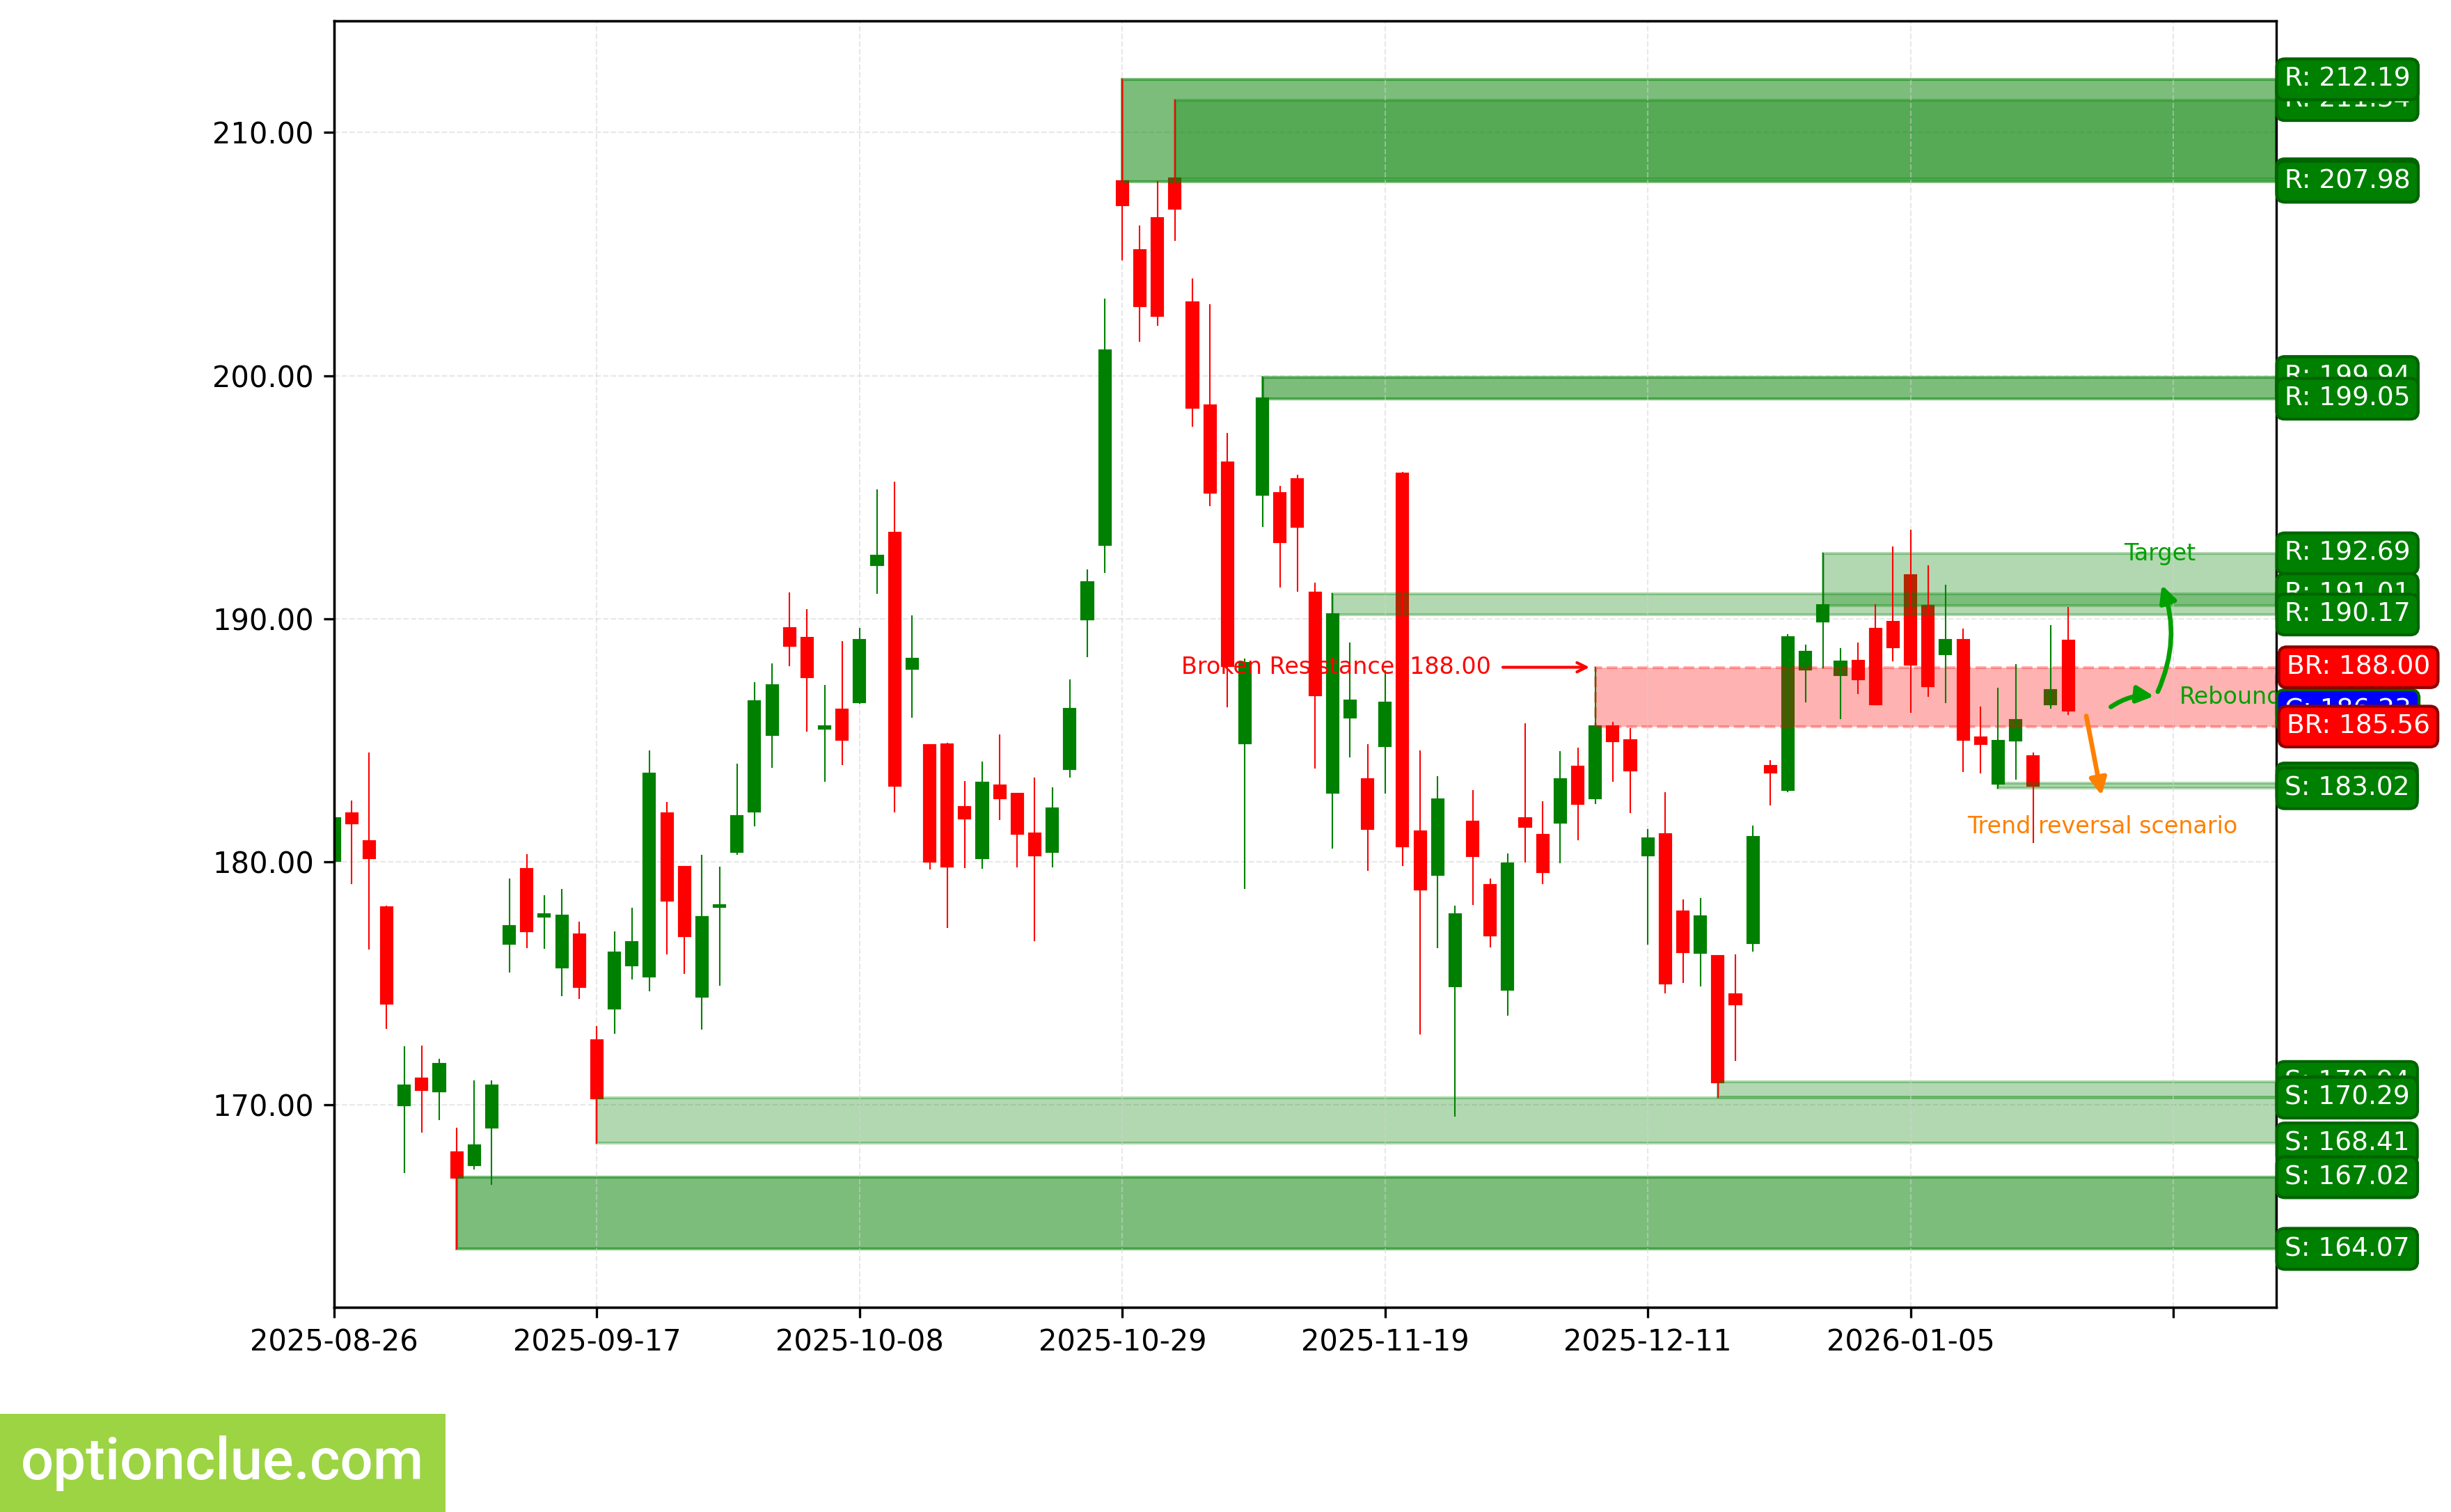
NVDA. Technical analysis. D1.
Tesla Inc (TSLA)
Bearish trend continues, impulse wave is developing. The last broken level is support (465.83 — 467.26). Breakout occurred 14 candlesticks ago.
Intermediate target for the downward movement is the support level with boundaries 424.37 — 427.89. In case of successful trend development, a further target will be at the support level with boundaries 383.76 — 391.09.
Potential profit/risk ratio from current prices when setting targets and fixing risks at daily timeframe levels may be small (around 0.3:1). When using a further target — approximately 1.5:1. If the next correction completes near the resistance level (450.20 — 454.30), the potential profit/risk ratio may be around 1.5:1. When assessing a further target — around 3.8:1.
Short positions will remain relevant, as long as the market remains below the nearest resistance level with boundaries 450.20 — 454.30. If the market successfully closes above this nearest resistance, the trend will reverse to the opposite (bullish).
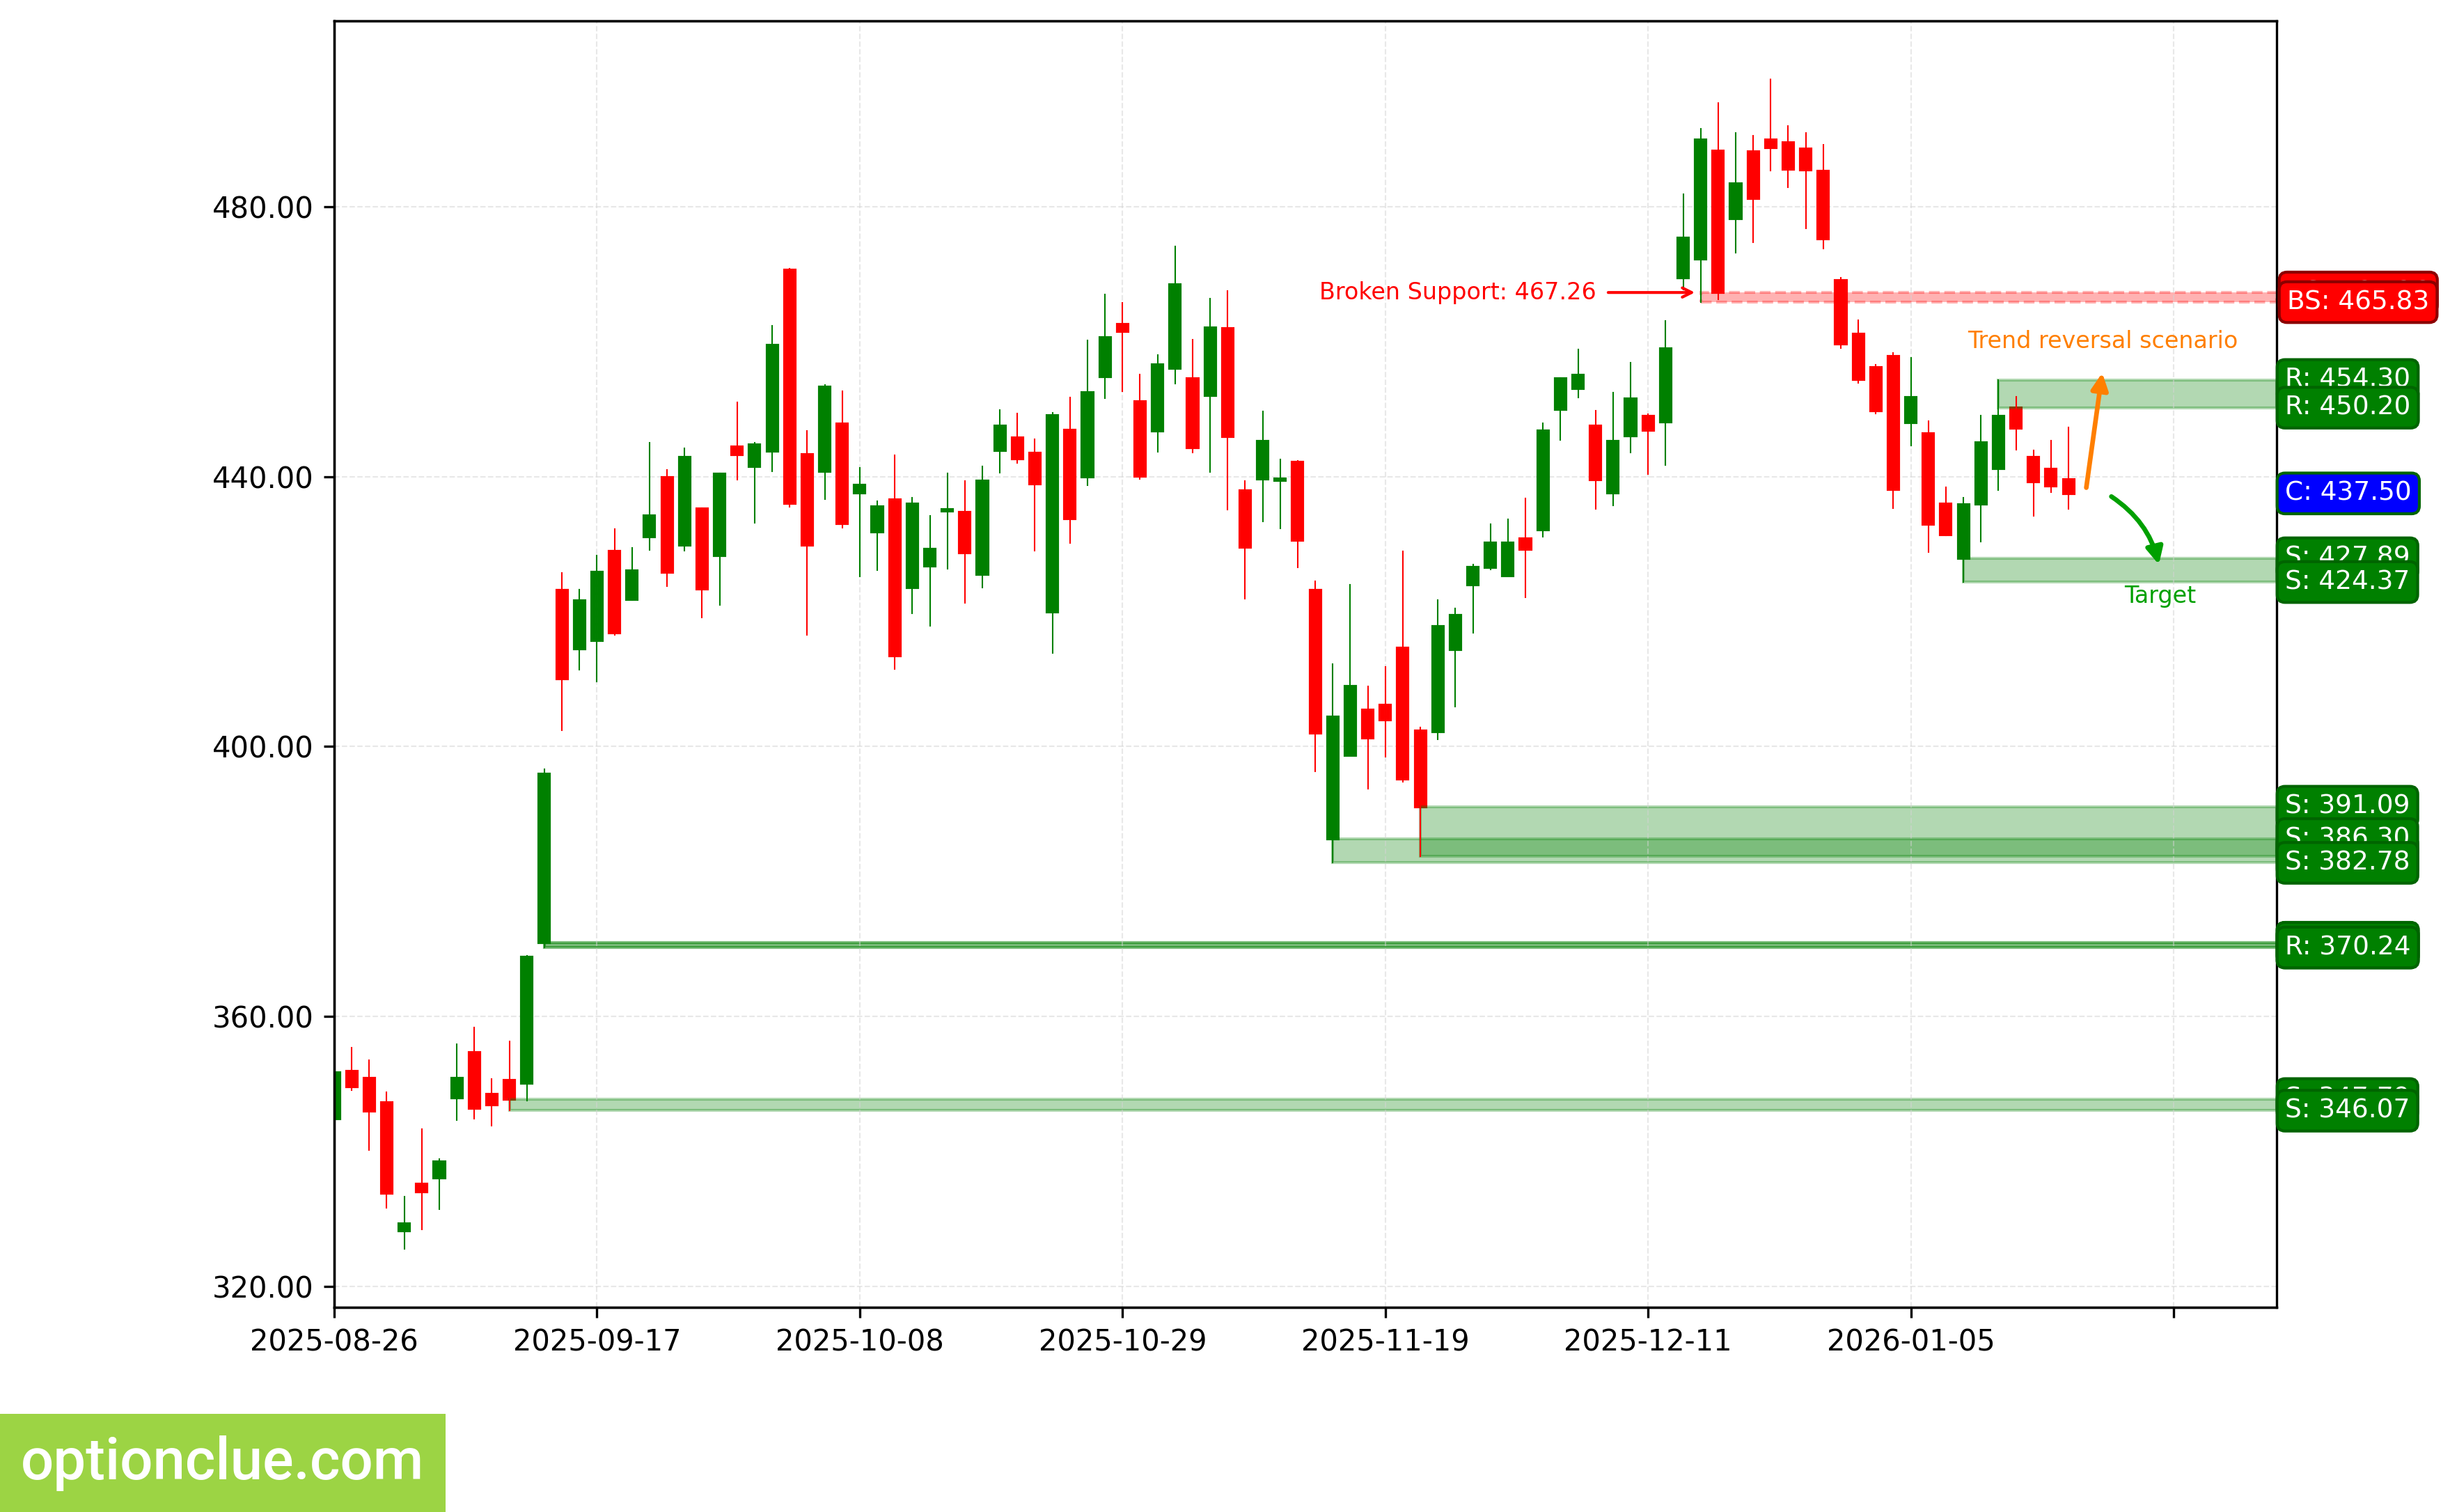
TSLA. Technical analysis. D1.
Summary
From the perspective of medium-term trading, financial instruments with correction close to completion on Daily and/or potentially the most promising profit-to-risk ratios include: TSLA, GBPUSD. Soon may be worth attention depending on the depth of market correction: NVDA, ETH, BTC.
The rest of the trading list instruments may also be interesting, but on these markets rebound signals on Daily are likely to appear no earlier than in a week.