
We are examining the most important levels for key financial instruments and probable scenarios for developments.
Key Topics
- Euro (EURUSD)
- British Pound (GBPUSD)
- Swiss Franc (USDCHF)
- Canadian Dollar (USDCAD)
- Australian Dollar (AUDUSD)
- Bitcoin (BTC)
- Ether (ETH)
- Apple Inc (AAPL)
- NVIDIA Corp (NVDA)
- Tesla Inc (TSLA)
- Summary
Euro (EURUSD)
Bullish trend continues, a corrective wave is developing. An entry point for buying on rebound may form after the current correction completes. The last broken level is resistance (1.1818 — 1.1838). The breakout occurred 5 candlesticks ago.
Intermediate target for the upside move is the resistance level with boundaries 1.1913 — 1.1928. In case of successful trend development, a farther target will be at the resistance level with boundaries 1.2041 — 1.2078.
Potential profit/risk ratio from current prices when setting targets and fixing risks based on daily timeframe levels may be small (around 0.2:1). When using the farther target — also small (approximately 0.9:1). If the correction completes near the support level (1.1764 — 1.1775), the potential profit/risk ratio may be around 1.4:1. For the farther target — more than 2:1. If the correction completes near the last broken level (1.1818 — 1.1838), the potential profit/risk ratio may be small (approximately 0.5:1). When choosing the farther target — approximately 1.3:1.
Long positions will remain relevant as long as the market is above the nearest support level with boundaries 1.1764 — 1.1775. If the market successfully settles below this support, the trend will reverse to the opposite (bearish).
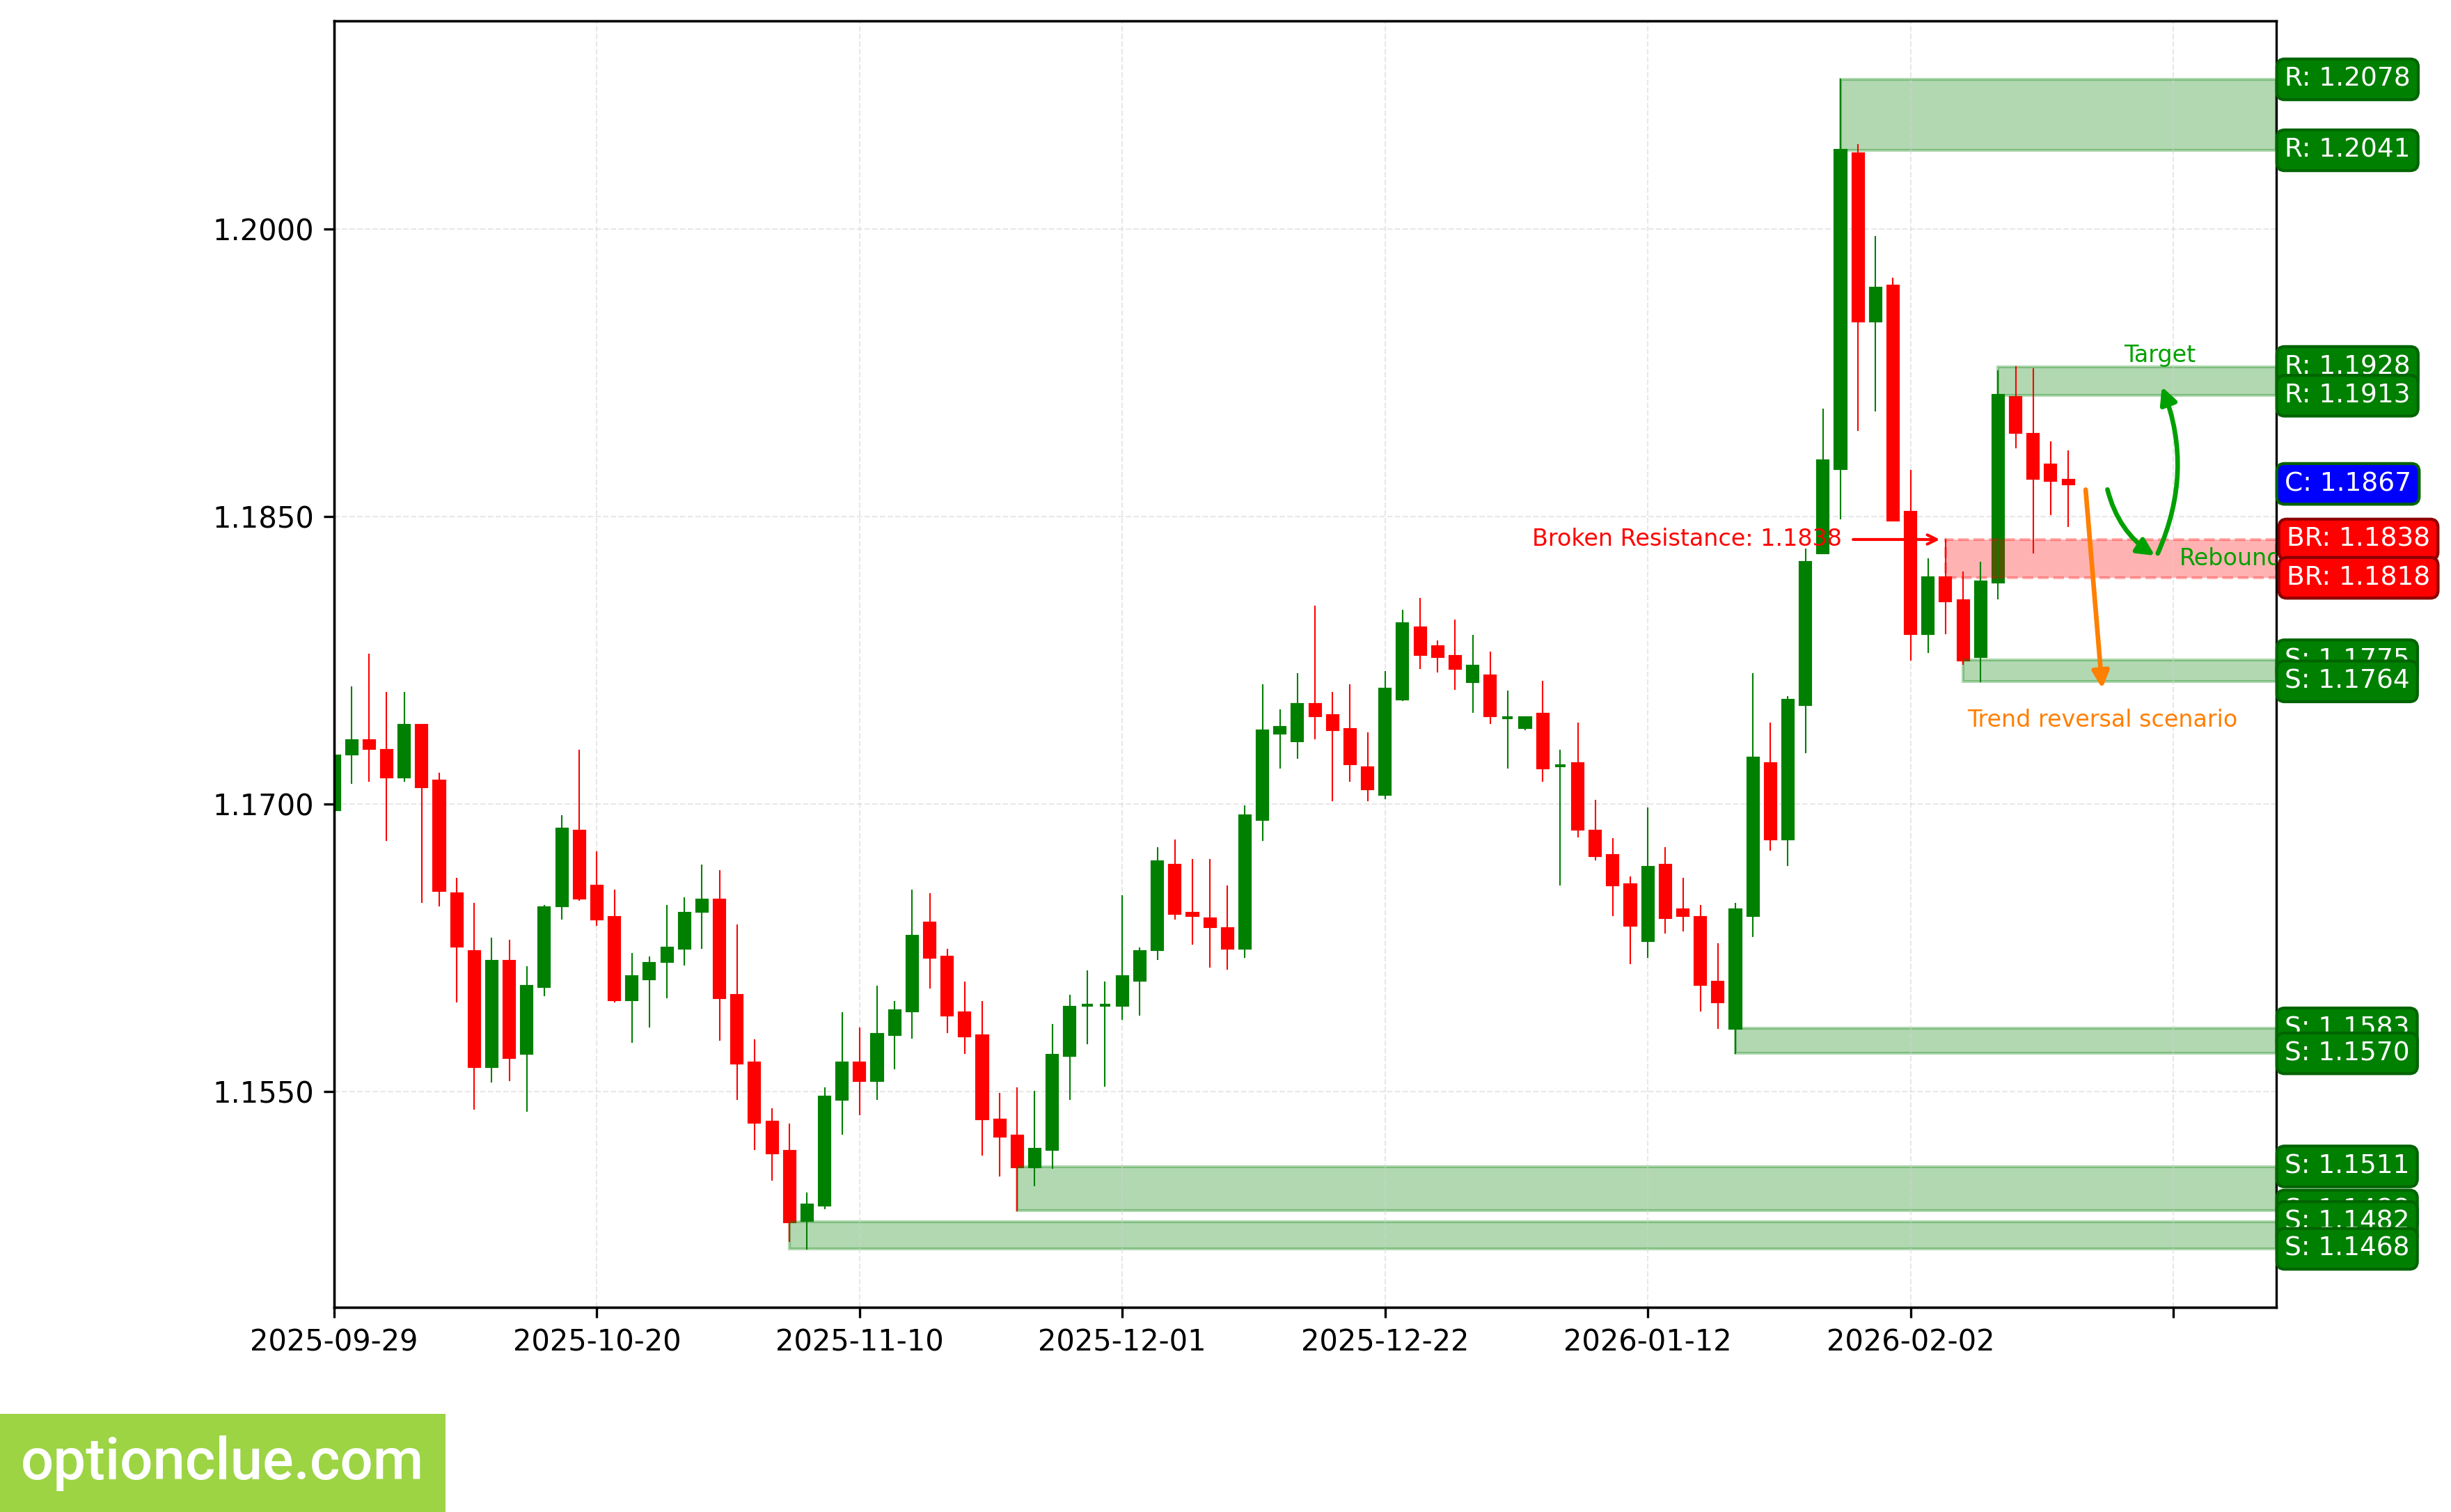
EURUSD. Technical analysis. D1.
British Pound (GBPUSD)
Bearish trend continues, a corrective wave is developing. The last broken level is support (1.3623 — 1.3673). The breakout occurred 7 candlesticks ago, and price has returned to this last broken level.
Intermediate target for the downside move is the support level with boundaries 1.3509 — 1.3521. In case of successful trend development, a farther target will be at the support level with boundaries 1.3333 — 1.3372.
Potential profit/risk ratio from current prices when setting targets and fixing risks based on daily timeframe levels may be small (approximately 0.8:1). When using the farther target — approximately 1.6:1.
Short positions will remain relevant as long as the market remains below the nearest resistance level with boundaries 1.3683 — 1.3712. If the market successfully settles above this nearest resistance, the trend will reverse to the opposite (bullish).
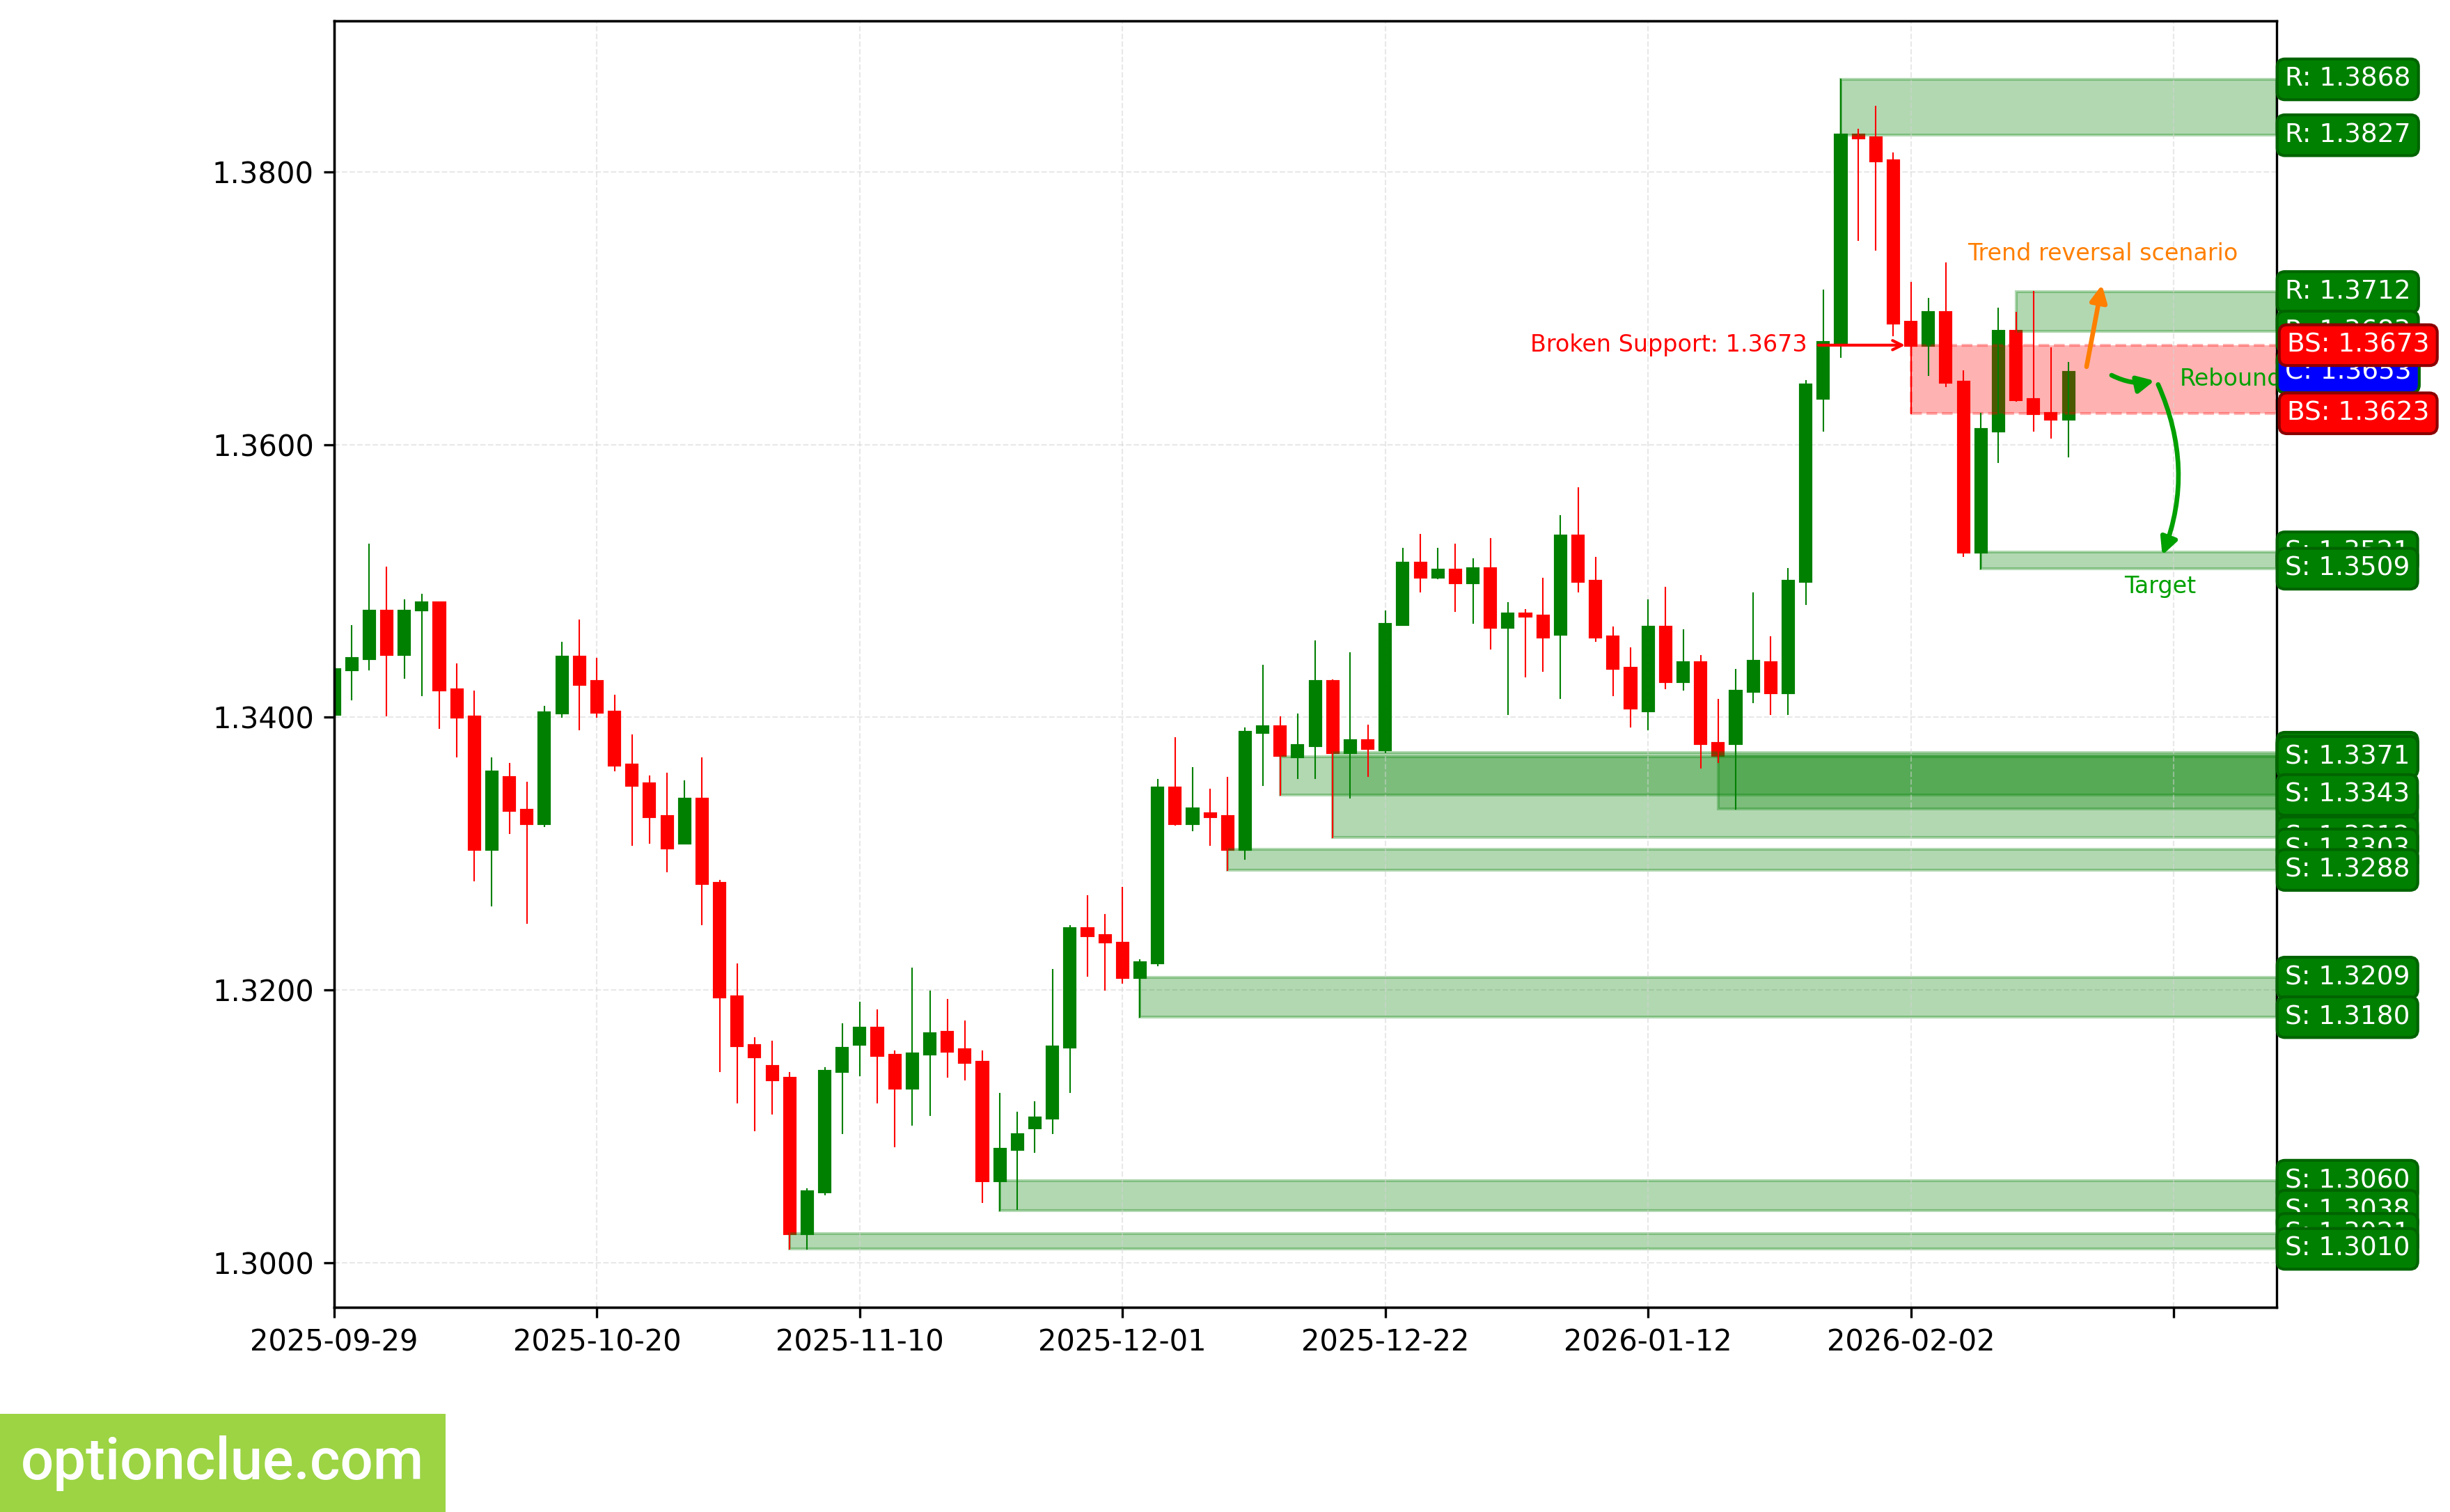
GBPUSD. Technical analysis. D1.
Swiss Franc (USDCHF)
Bearish trend continues, 2 candlesticks ago the correction likely completed and an entry point for selling on rebound formed, an impulse wave is developing. The last broken level is support (0.7737 — 0.7749). The breakout occurred 5 candlesticks ago.
Intermediate target for the downside move is the support level with boundaries 0.7627 — 0.7662.
Potential profit/risk ratio from current prices when setting targets and fixing risks based on daily timeframe levels may be small (around 0.1:1).
Short positions will remain relevant as long as the market remains below the nearest resistance level with boundaries 0.7717 — 0.7730. If the market successfully settles above this nearest resistance, the trend will reverse to the opposite (bullish).
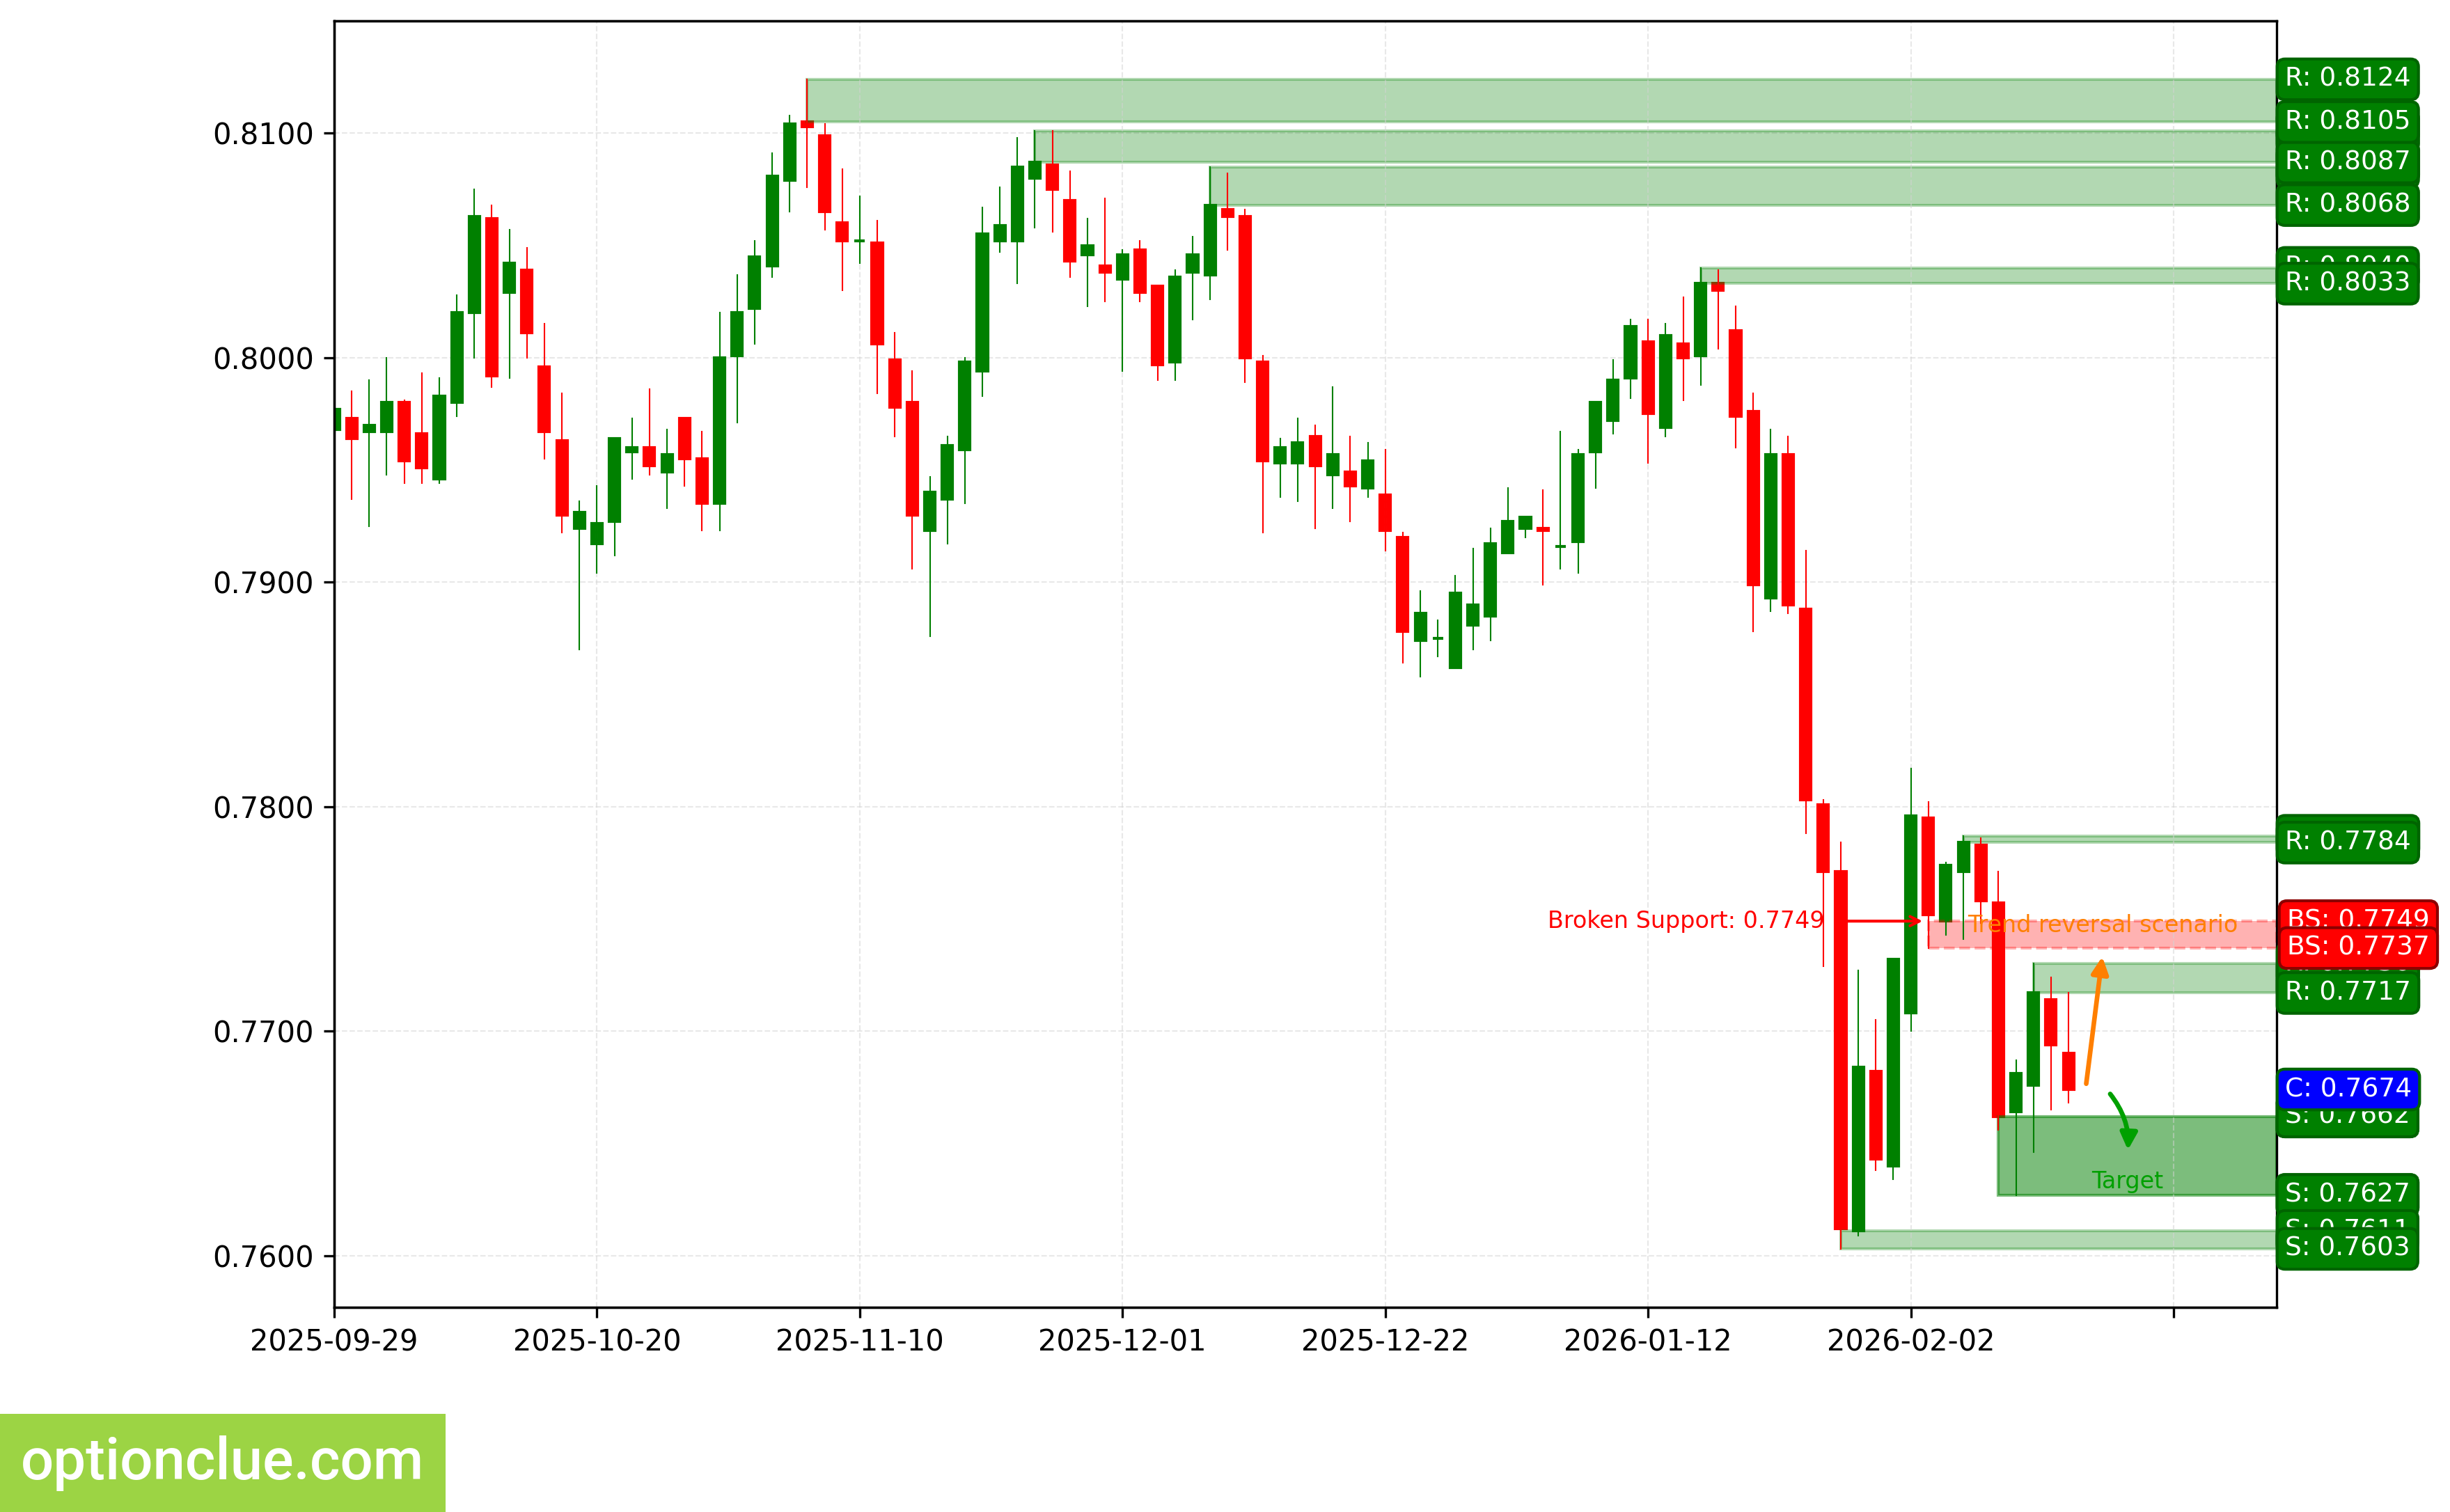
USDCHF. Technical analysis. D1.
Canadian Dollar (USDCAD)
Bearish trend continues, a corrective wave is developing. An entry point for selling on rebound may form after the current correction completes. The last broken level is support (1.3627 — 1.3638). The breakout occurred 5 candlesticks ago.
Intermediate target for the downside move is the support level with boundaries 1.3501 — 1.3550.
Potential profit/risk ratio from current prices when setting targets and fixing risks based on daily timeframe levels may be small (approximately 0.3:1). If the new correction completes near the resistance level (1.3712 — 1.3724), the potential profit/risk ratio may be approximately 1.5:1. If the correction completes near the last broken level (1.3627 — 1.3638), the potential profit/risk ratio may be small (around 0.4:1).
Short positions will remain relevant as long as the market remains below the nearest resistance level with boundaries 1.3712 — 1.3724. If the market successfully settles above this nearest resistance, the trend will reverse to the opposite (bullish).
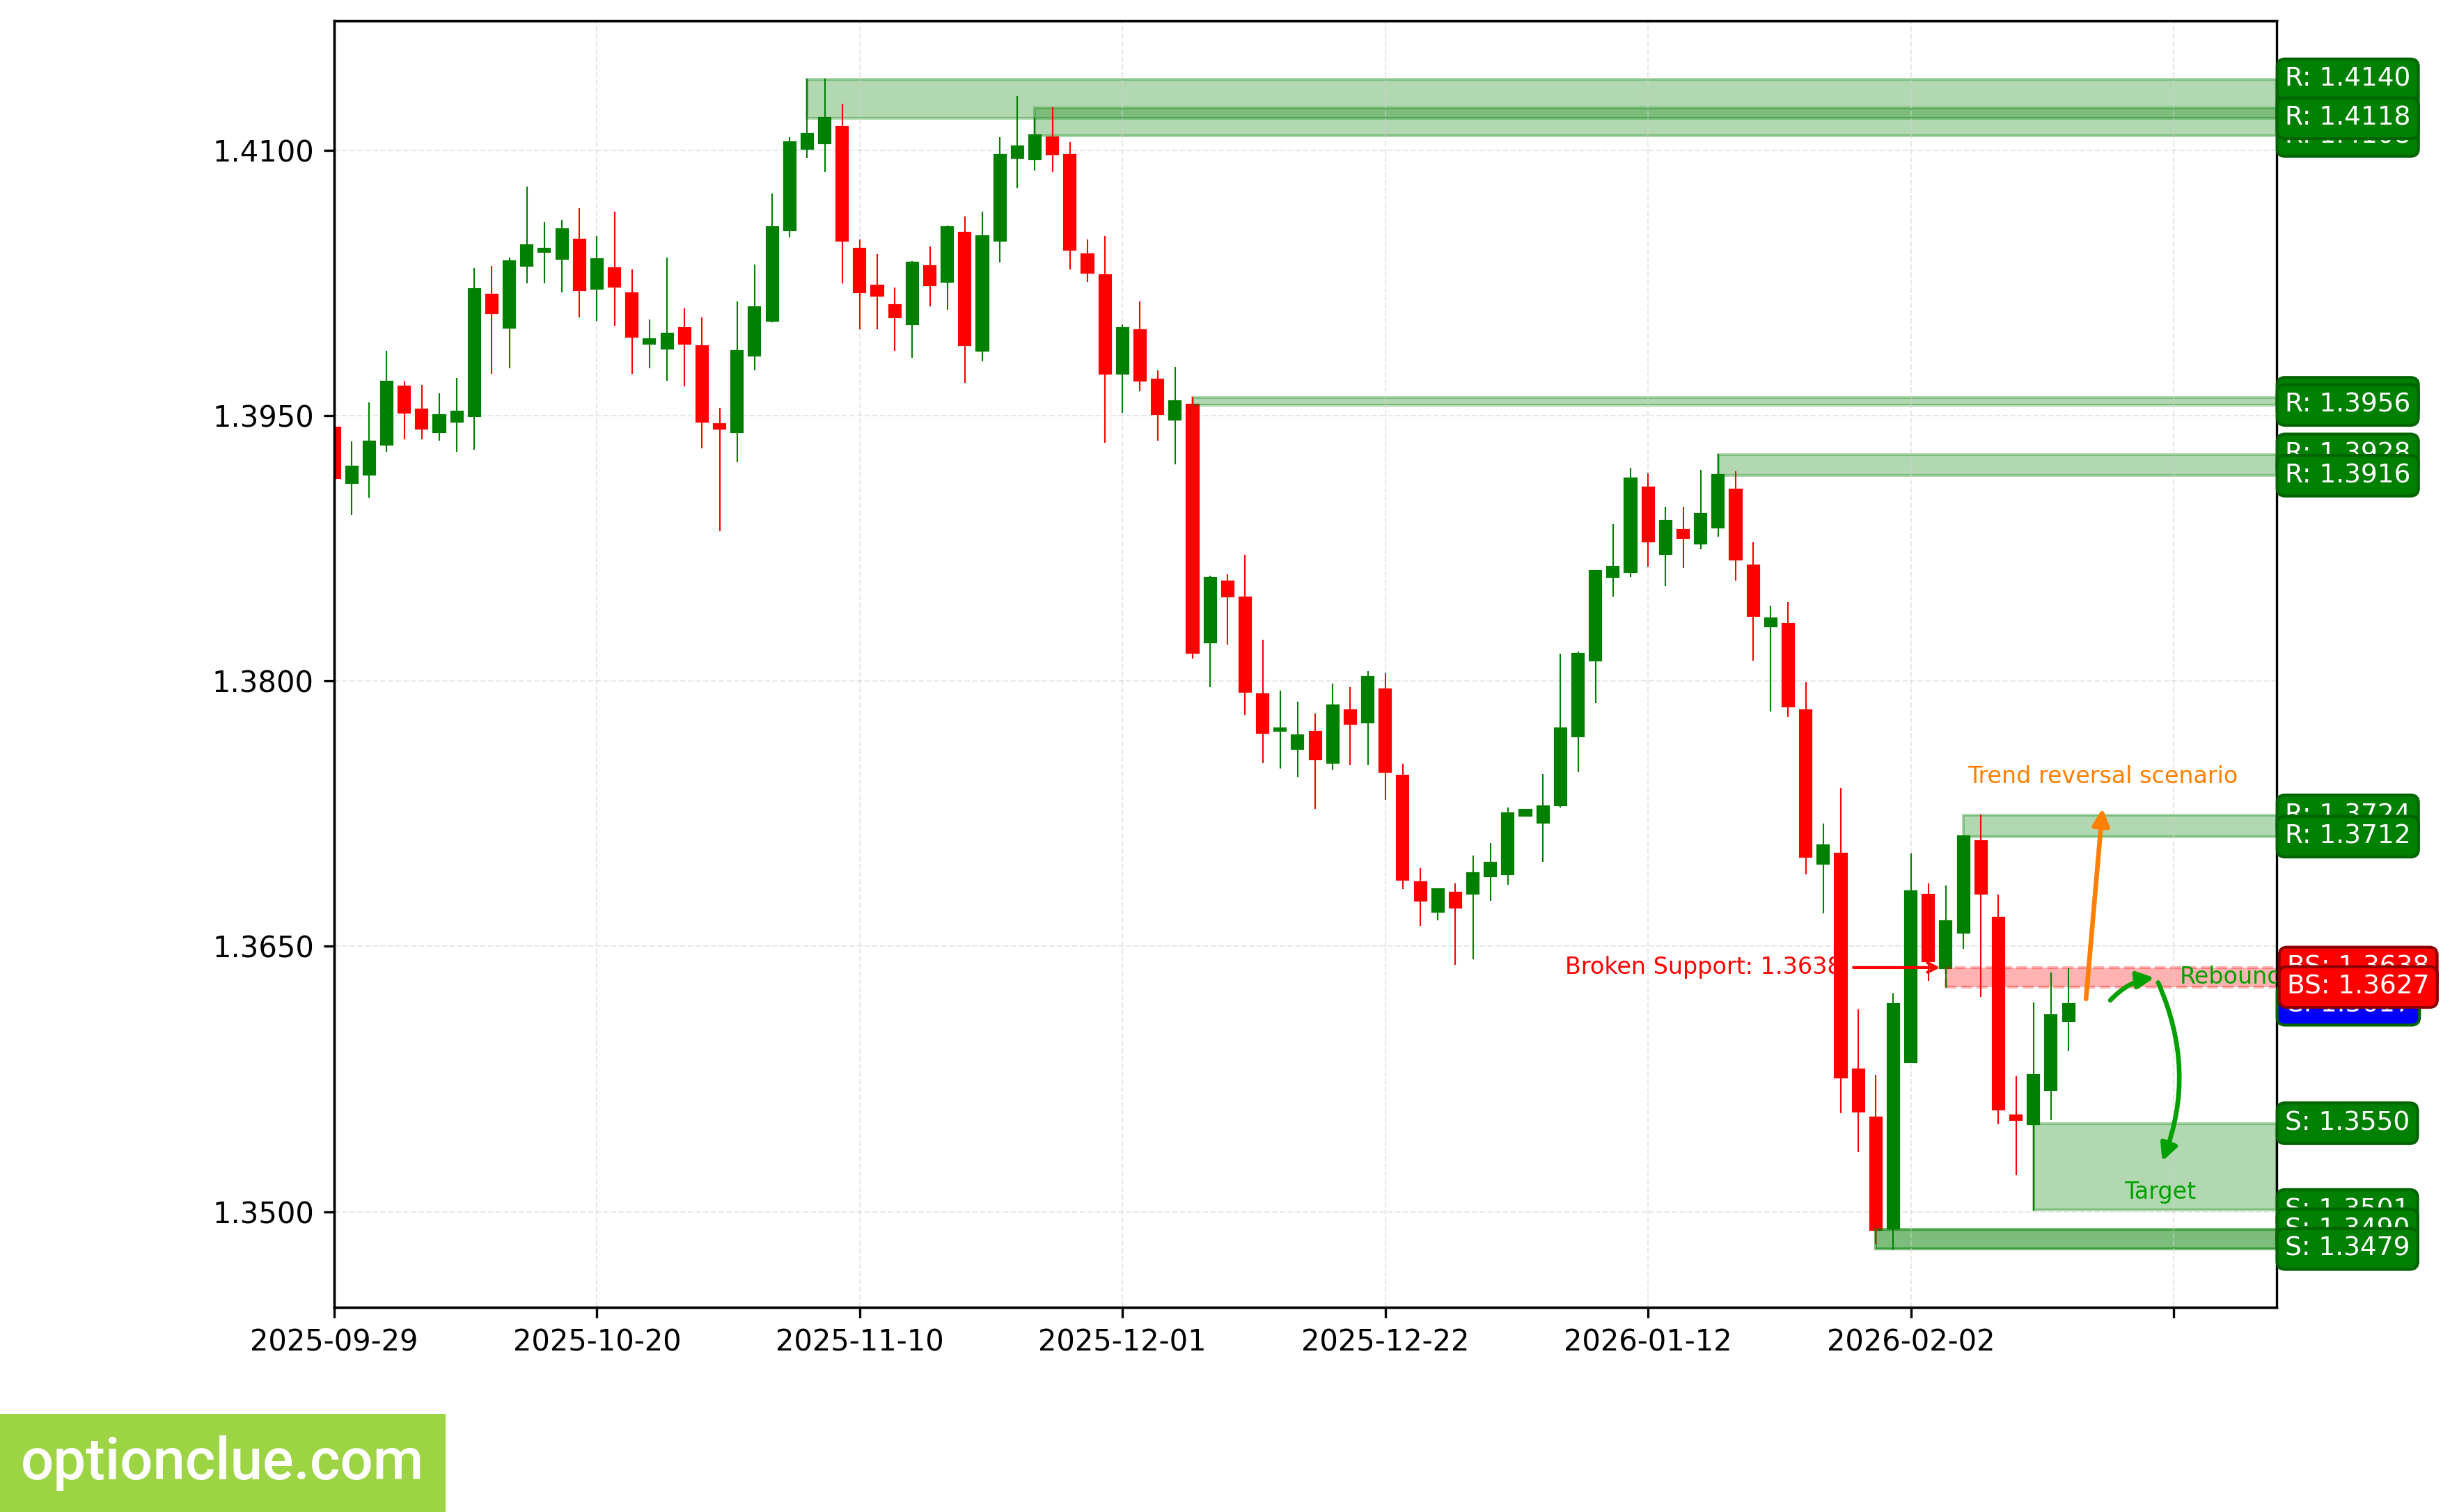
USDCAD. Technical analysis. D1.
Australian Dollar (AUDUSD)
Bullish trend continues, a corrective wave is developing. An entry point for buying on rebound may form after the current correction completes. The last broken level is resistance (0.7023 — 0.7050). The breakout occurred 5 candlesticks ago.
Upon resumption of the upside move, the first target will be the resistance level with boundaries 0.7127 — 0.7147.
If the correction completes near the support level (0.6895 — 0.6925), the potential profit/risk ratio may be around 2:1. If the correction completes near the last broken level (0.7023 — 0.7050), the potential profit/risk ratio may be small (around 0.4:1).
Long positions will remain relevant as long as the market is above the nearest support level with boundaries 0.6895 — 0.6925. If the market successfully settles below this support, the trend will reverse to the opposite (bearish).
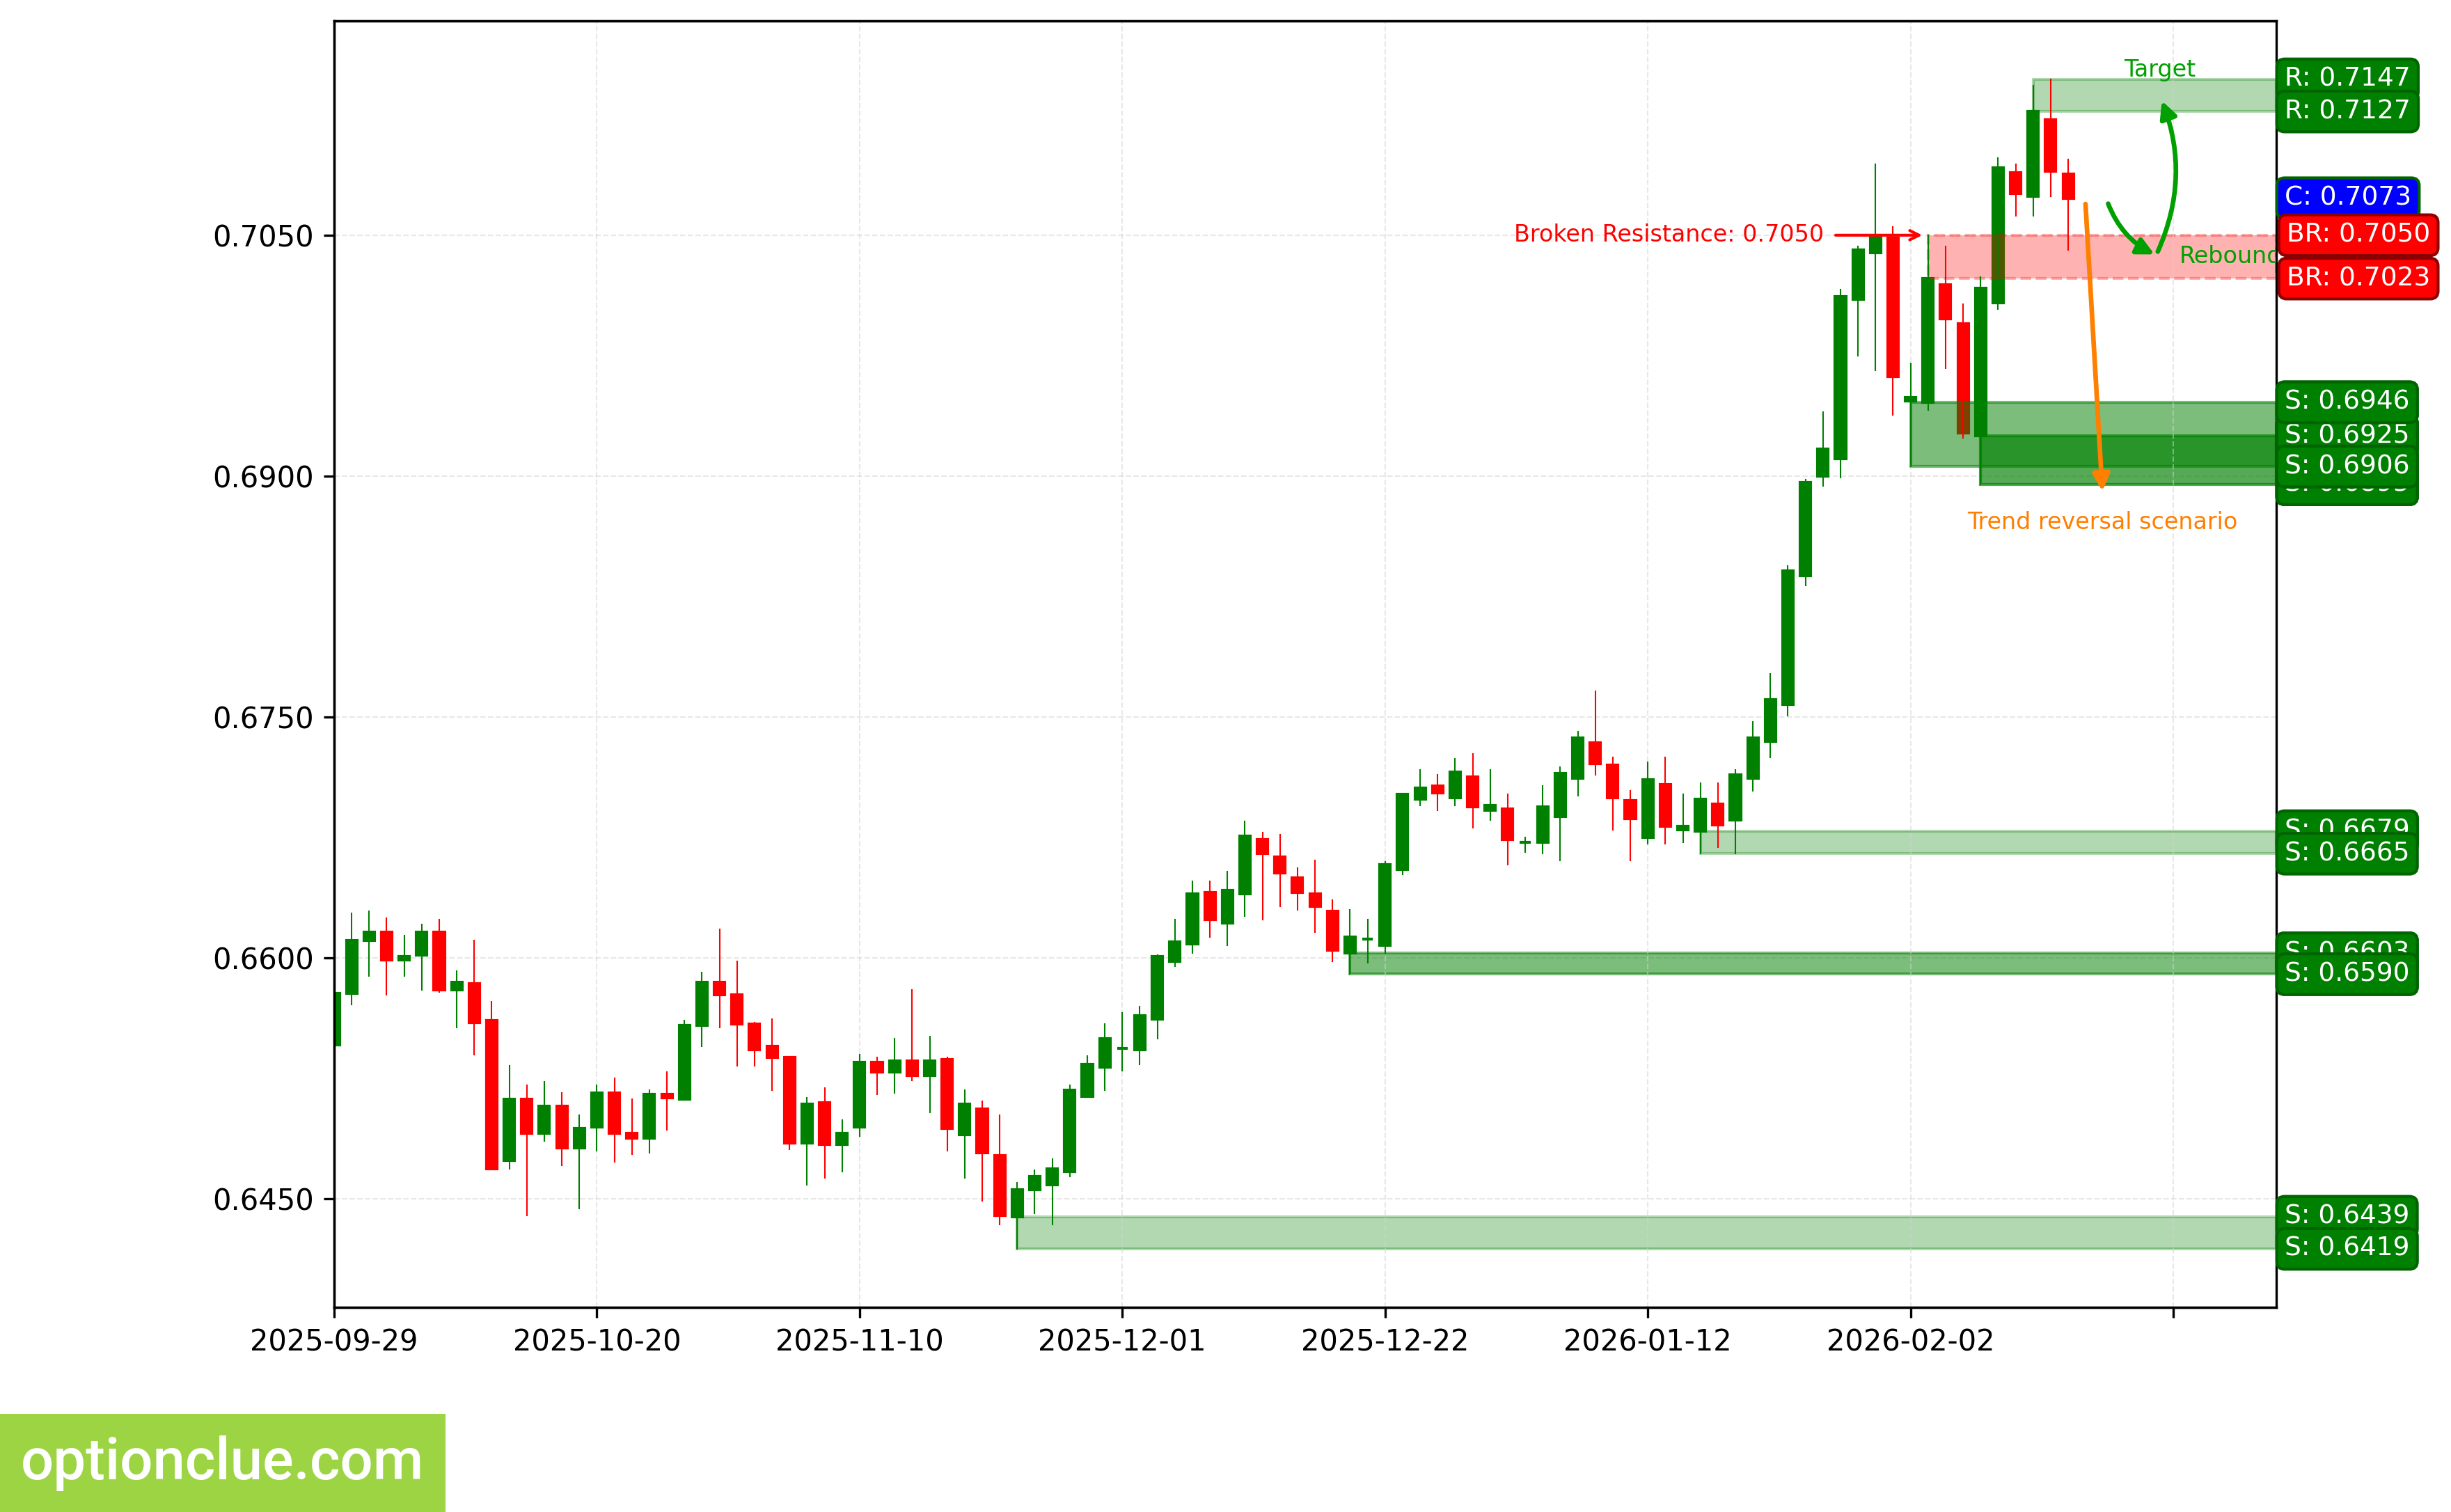
AUDUSD. Technical analysis. D1.
Bitcoin (BTC)
Bearish trend continues, a corrective wave is developing. An entry point for selling on rebound may form after the current correction completes. The last broken level is support (86004 — 86567). The breakout occurred 16 candlesticks ago.
Intermediate target for the downside move is the support level with boundaries 60074 — 62704.
Potential profit/risk ratio from current prices when setting targets and fixing risks based on daily timeframe levels may be small (approximately 0.7:1). If the new correction completes near the resistance level (70265 — 72207), the potential profit/risk ratio may be around 1.3:1.
Short positions will remain relevant as long as the market remains below the nearest resistance level with boundaries 70265 — 72207. If the market successfully settles above this nearest resistance, the trend will reverse to the opposite (bullish).
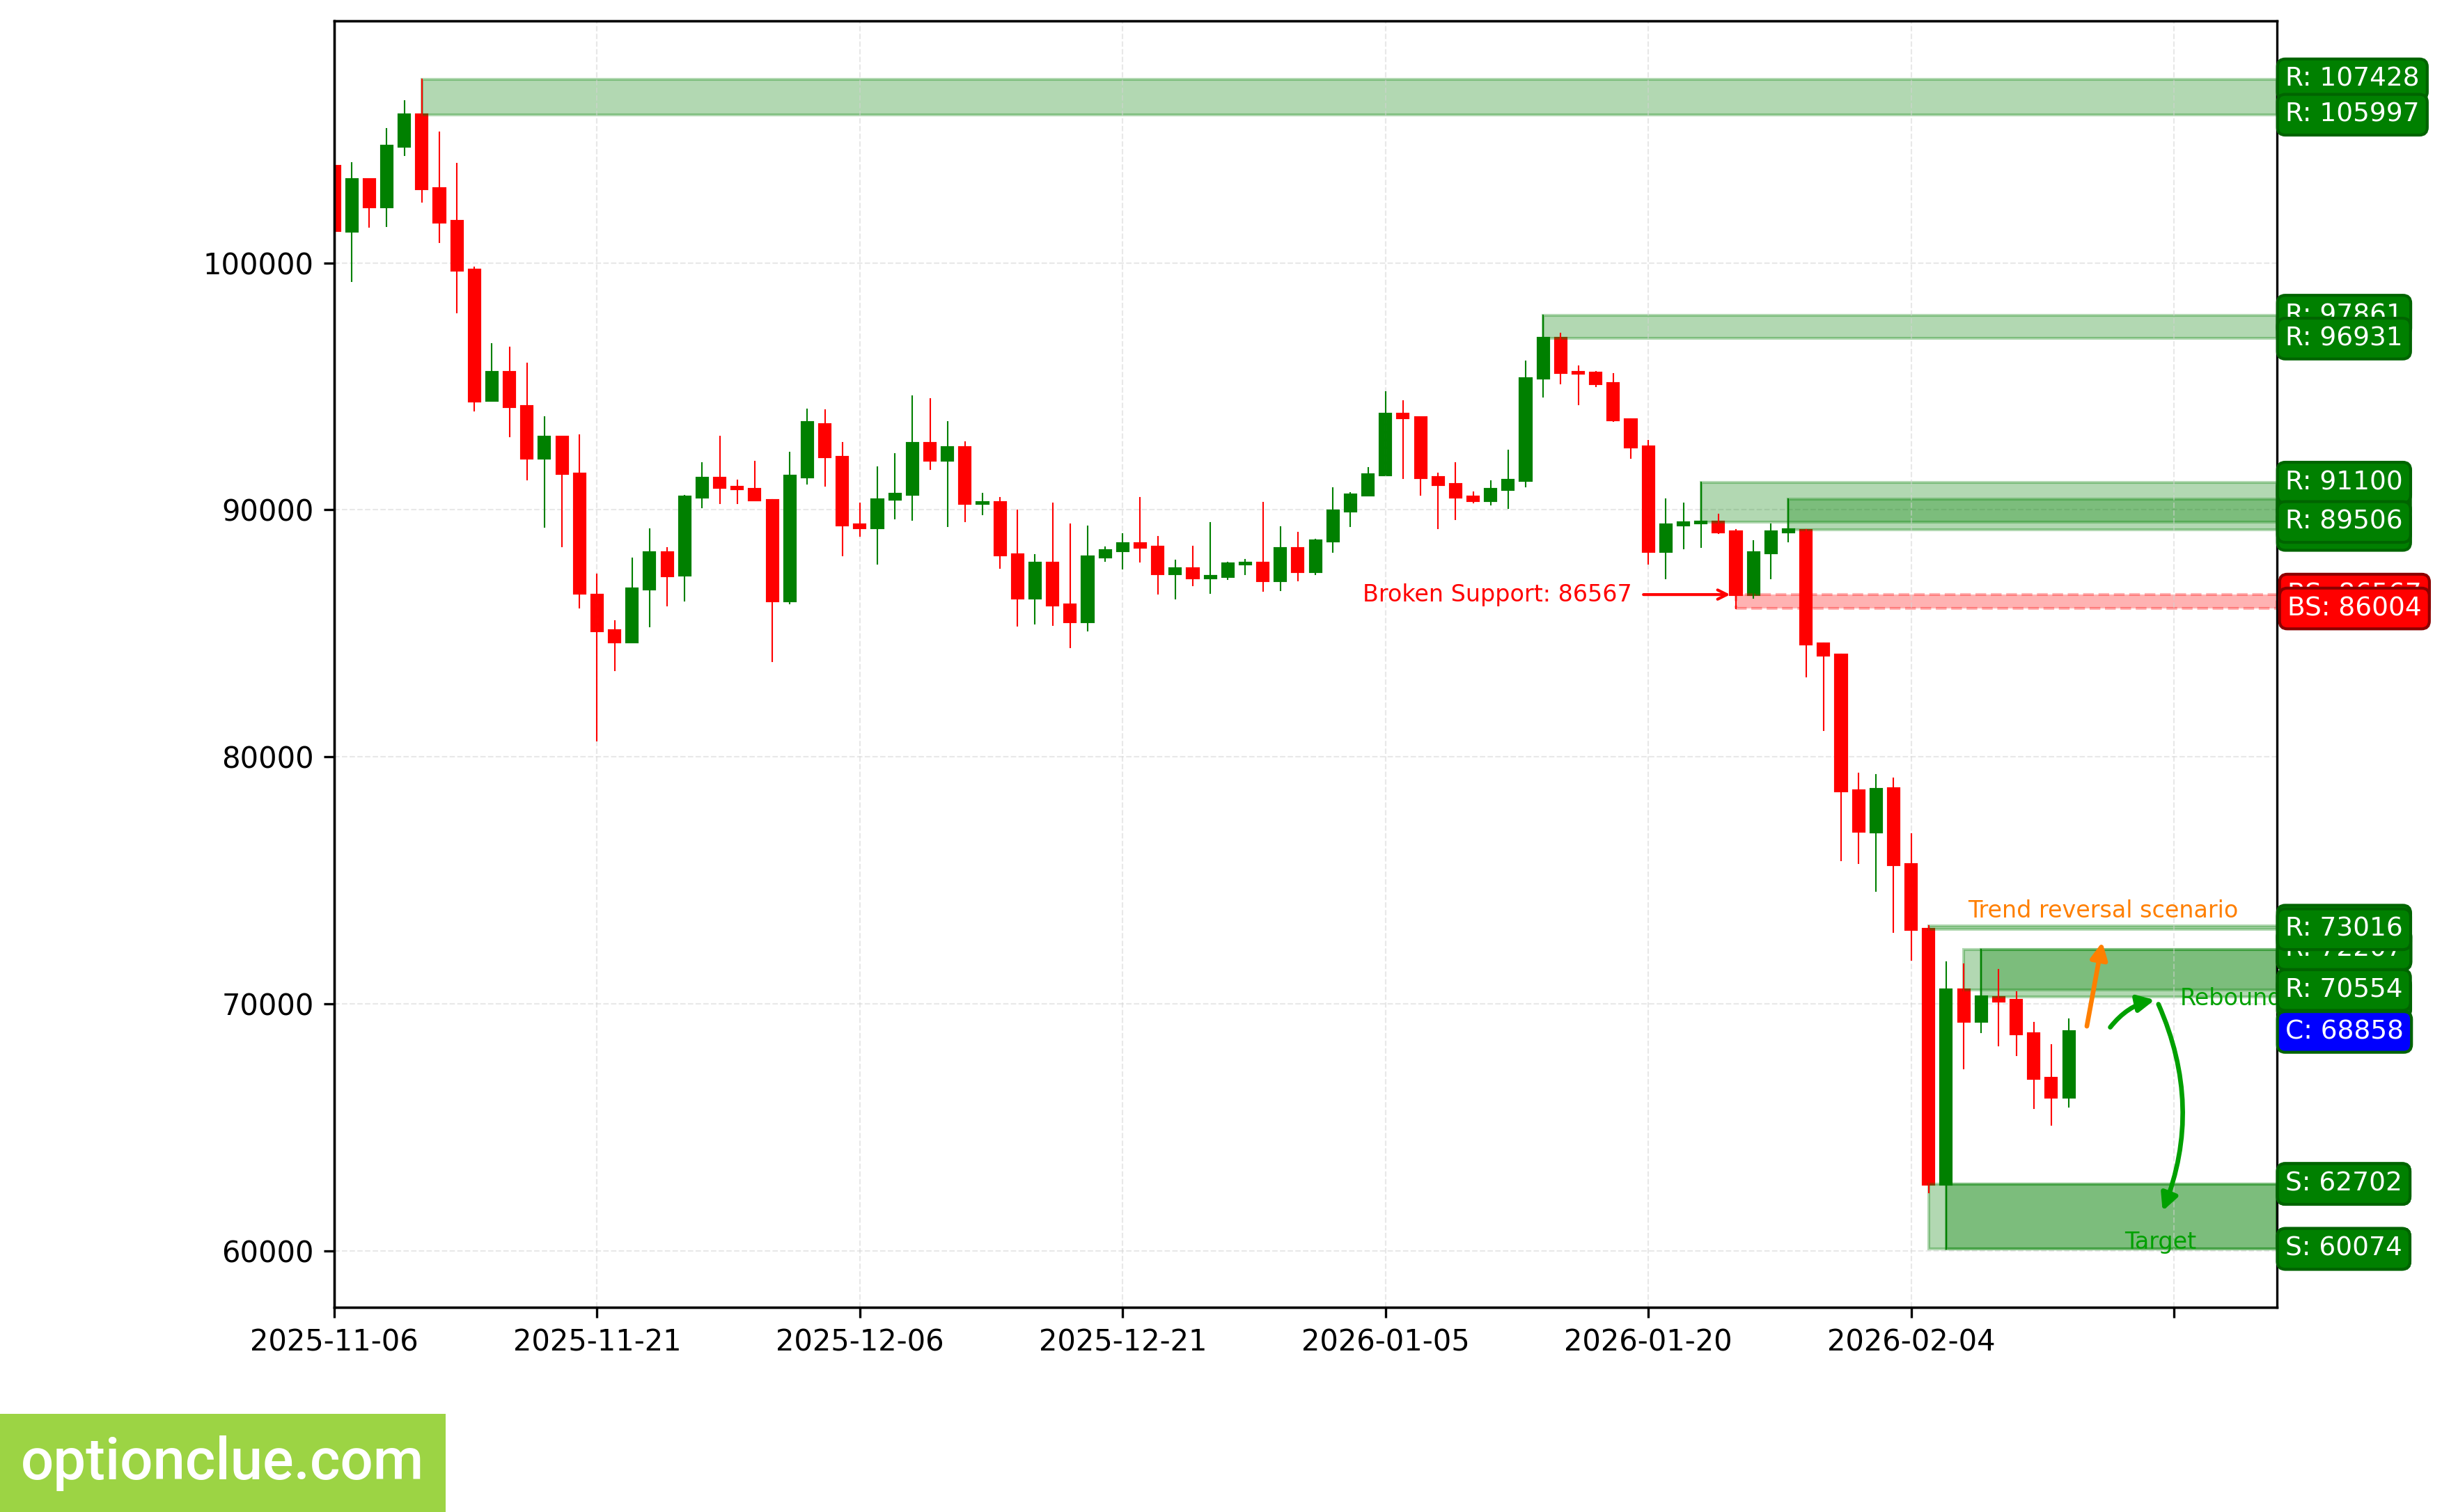
BTC. Technical analysis. D1.
Ether (ETH)
Bearish trend continues, a corrective wave is developing. An entry point for selling on rebound may form after the current correction completes. The last broken level is support (2786 — 2816). The breakout occurred 15 candlesticks ago.
Intermediate target for the downside move is the support level with boundaries 1897 — 1941.
Potential profit/risk ratio from current prices when setting targets and fixing risks based on daily timeframe levels may be small (approximately 0.3:1). If the correction completes near the resistance level (2104 — 2148), the potential profit/risk ratio may be insignificant (around 0.8:1).
Short positions will remain relevant as long as the market remains below the nearest resistance level with boundaries 2104 — 2148. If the market successfully settles above this nearest resistance, the trend will reverse to the opposite (bullish).
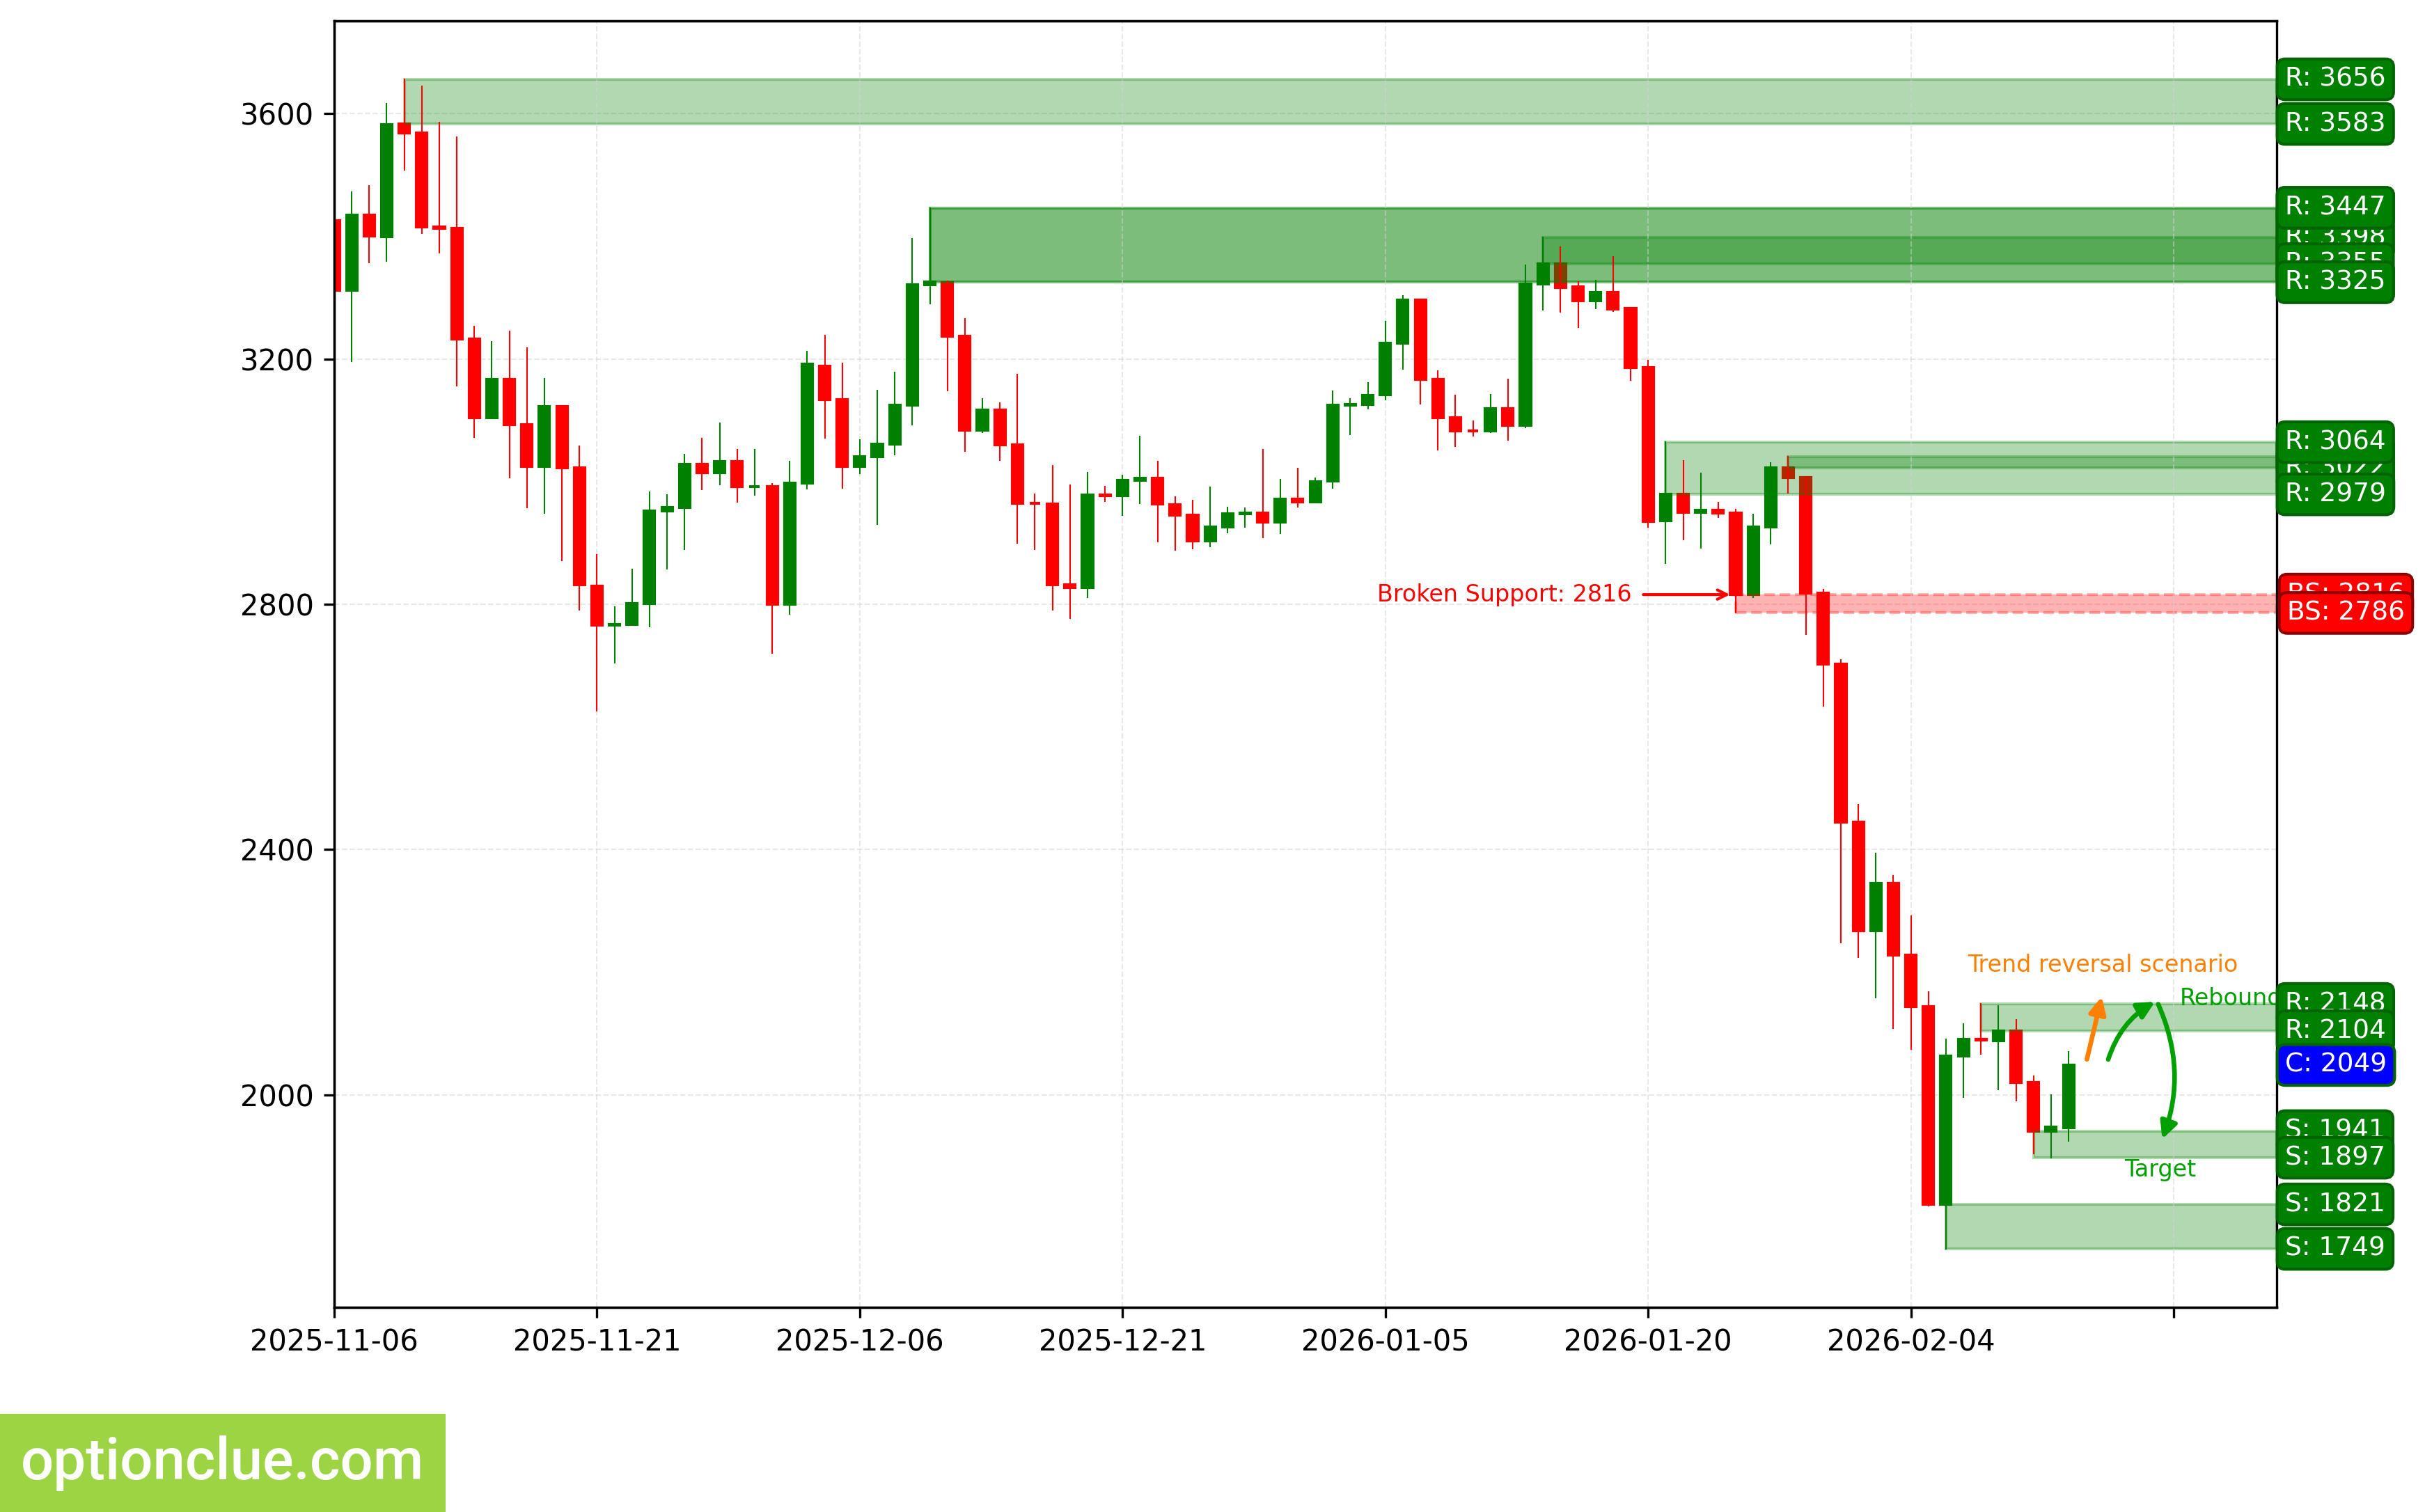
ETH. Technical analysis. D1.
Apple Inc (AAPL)
Bullish trend continues, a corrective wave is developing. An entry point for buying on rebound may form after the current correction completes. The last broken level is resistance (259.17 — 261.95). The breakout occurred 10 candlesticks ago.
Upon resumption of the upside move, the first target will be the resistance level with boundaries 278.13 — 280.91.
Potential profit/risk ratio from current prices when setting targets and fixing risks based on daily timeframe levels may be approximately 2:1. If the correction completes near the support level (252.18 — 255.17), the potential profit/risk ratio may be around 3:1.
Long positions will remain relevant as long as the market is above the nearest daily timeframe support level with boundaries 252.18 — 255.17. If the market successfully settles below this support, the trend will reverse to the opposite (bearish).
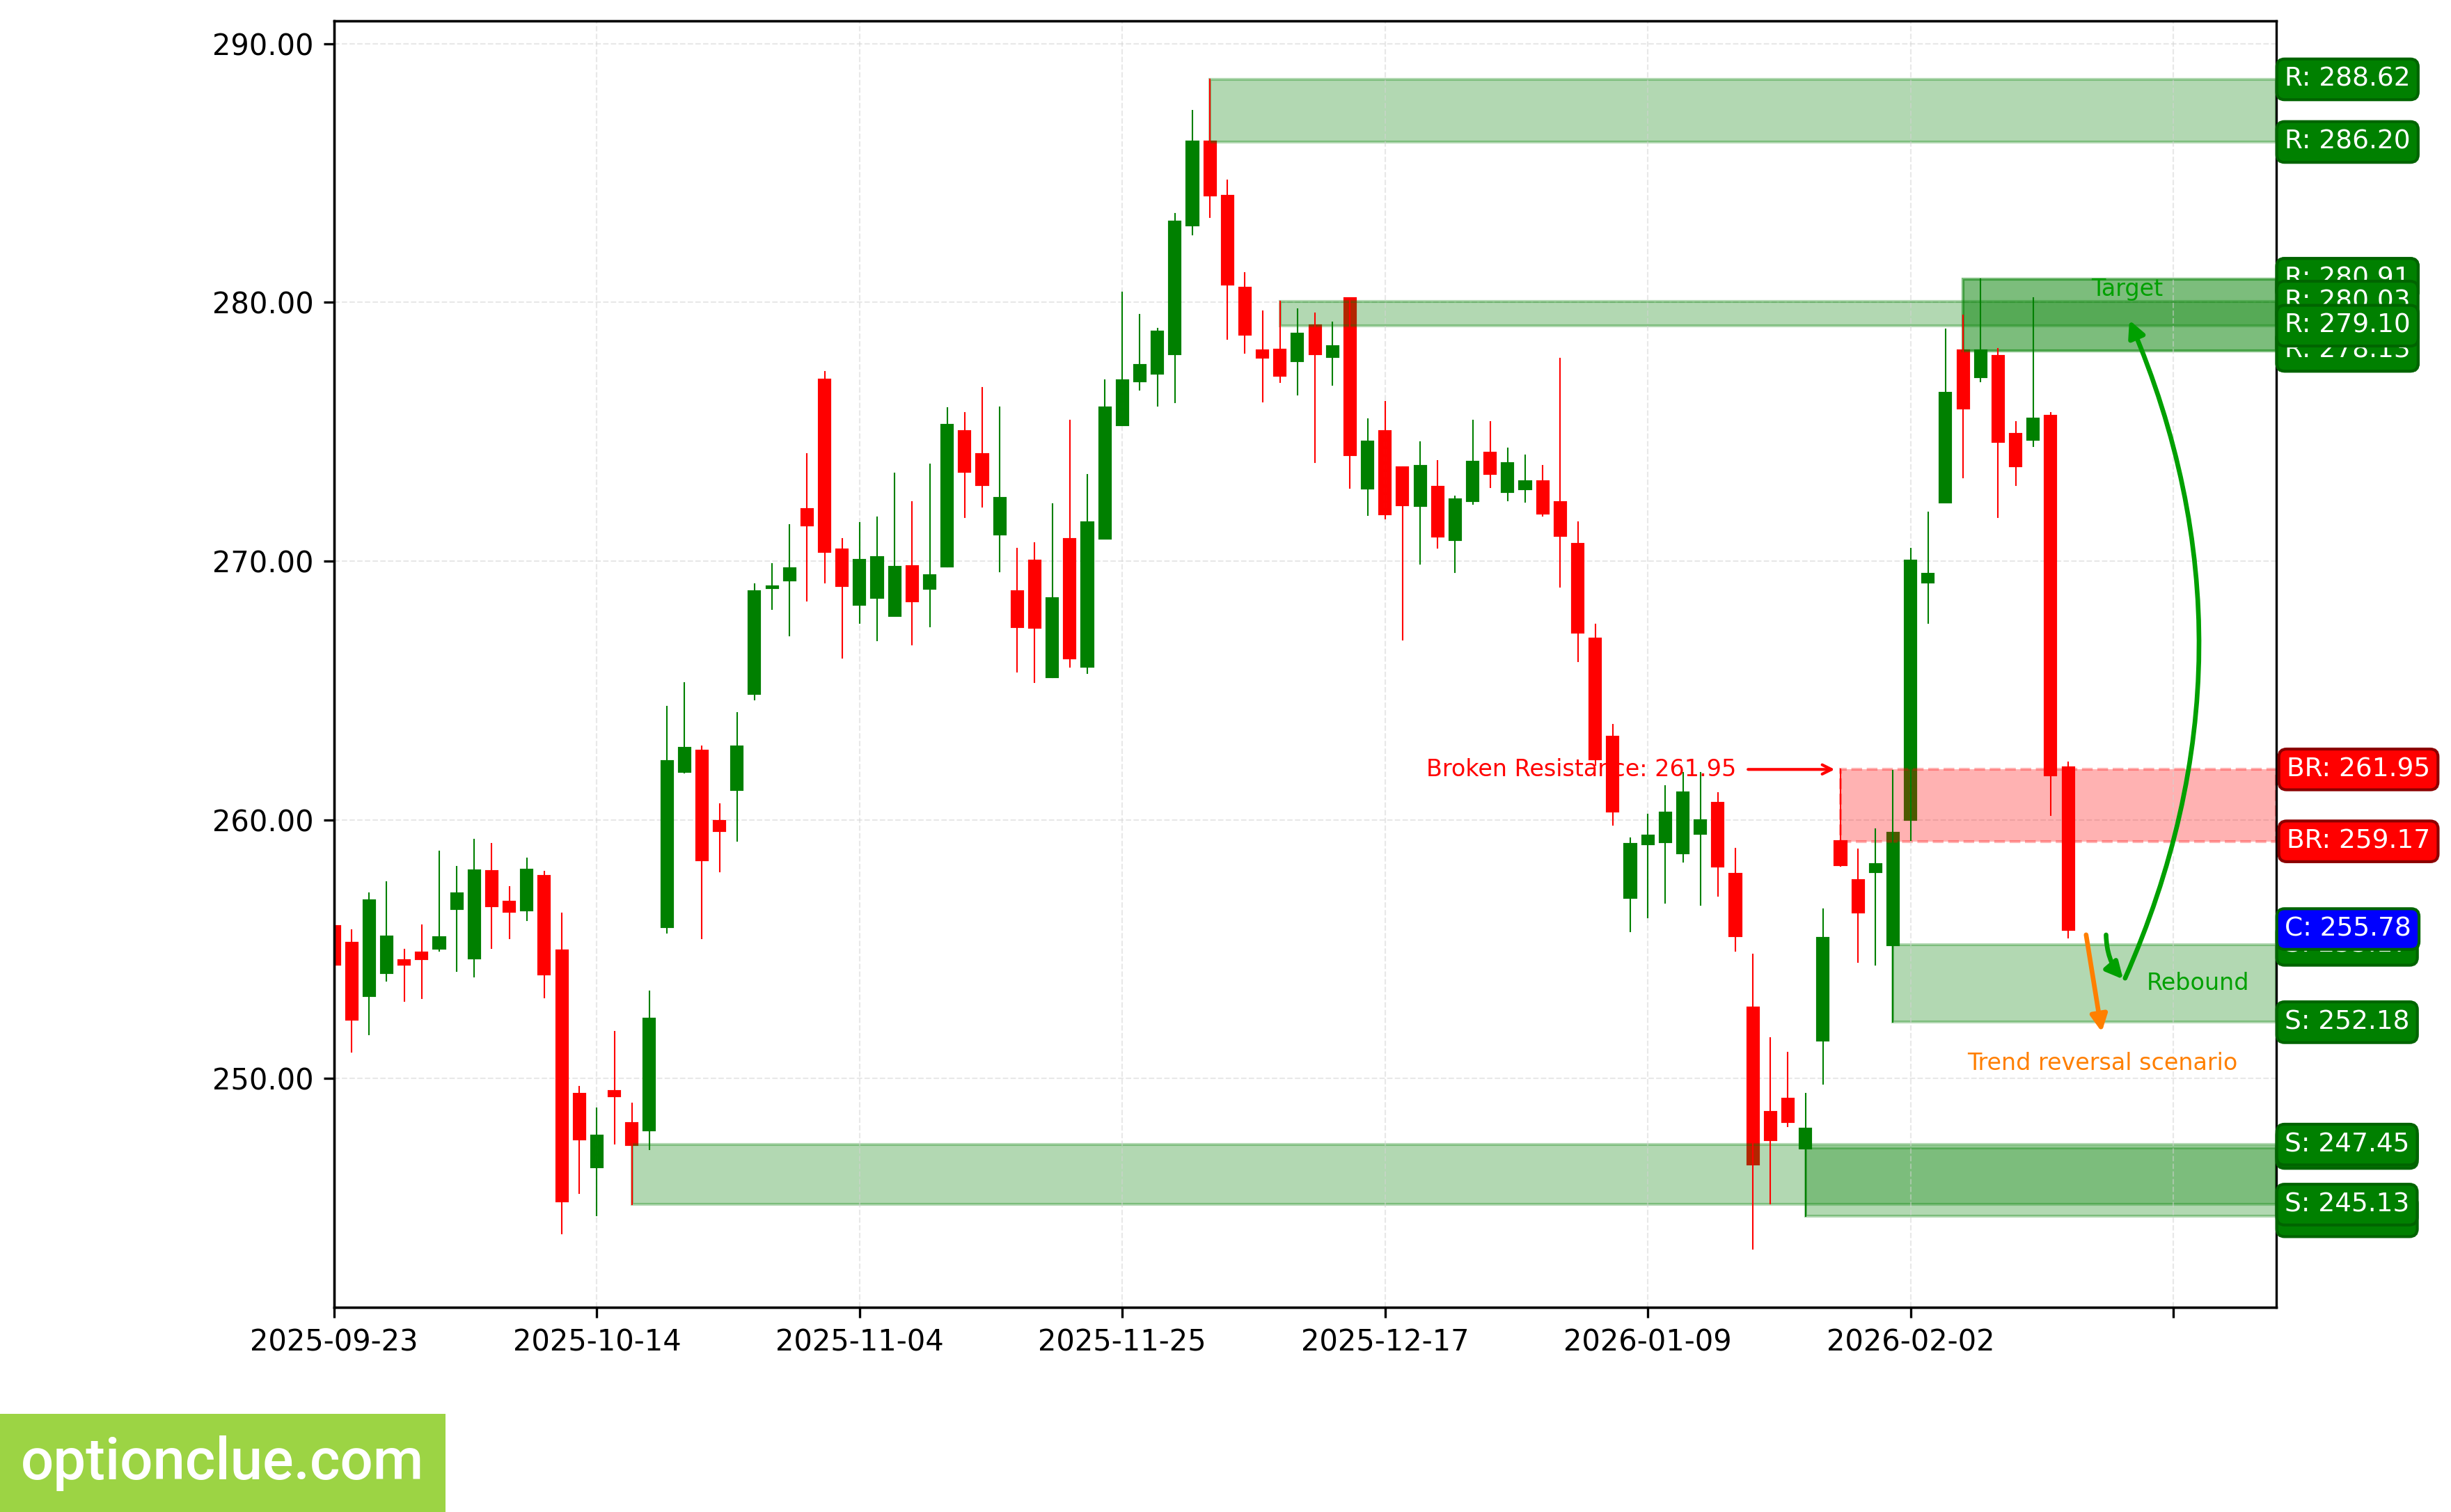
AAPL. Technical analysis. D1.
NVIDIA Corp (NVDA)
Bearish trend continues, a corrective wave is developing. The last broken level is support (177.61 — 178.07). The breakout occurred 8 candlesticks ago.
Intermediate target for the downside move is the support level with boundaries 171.03 — 171.88. In case of successful trend development, a farther target will be at the support level with boundaries 168.41 — 170.29.
Potential profit/risk ratio from current prices when setting targets and fixing risks based on daily timeframe levels may be small (approximately 0.6:1). When using the farther target — also small (around 0.7:1).
Short positions will remain relevant as long as the market remains below the nearest resistance level with boundaries 192.45 — 193.66. If the market successfully settles above this nearest resistance, the trend will reverse to the opposite (bullish).
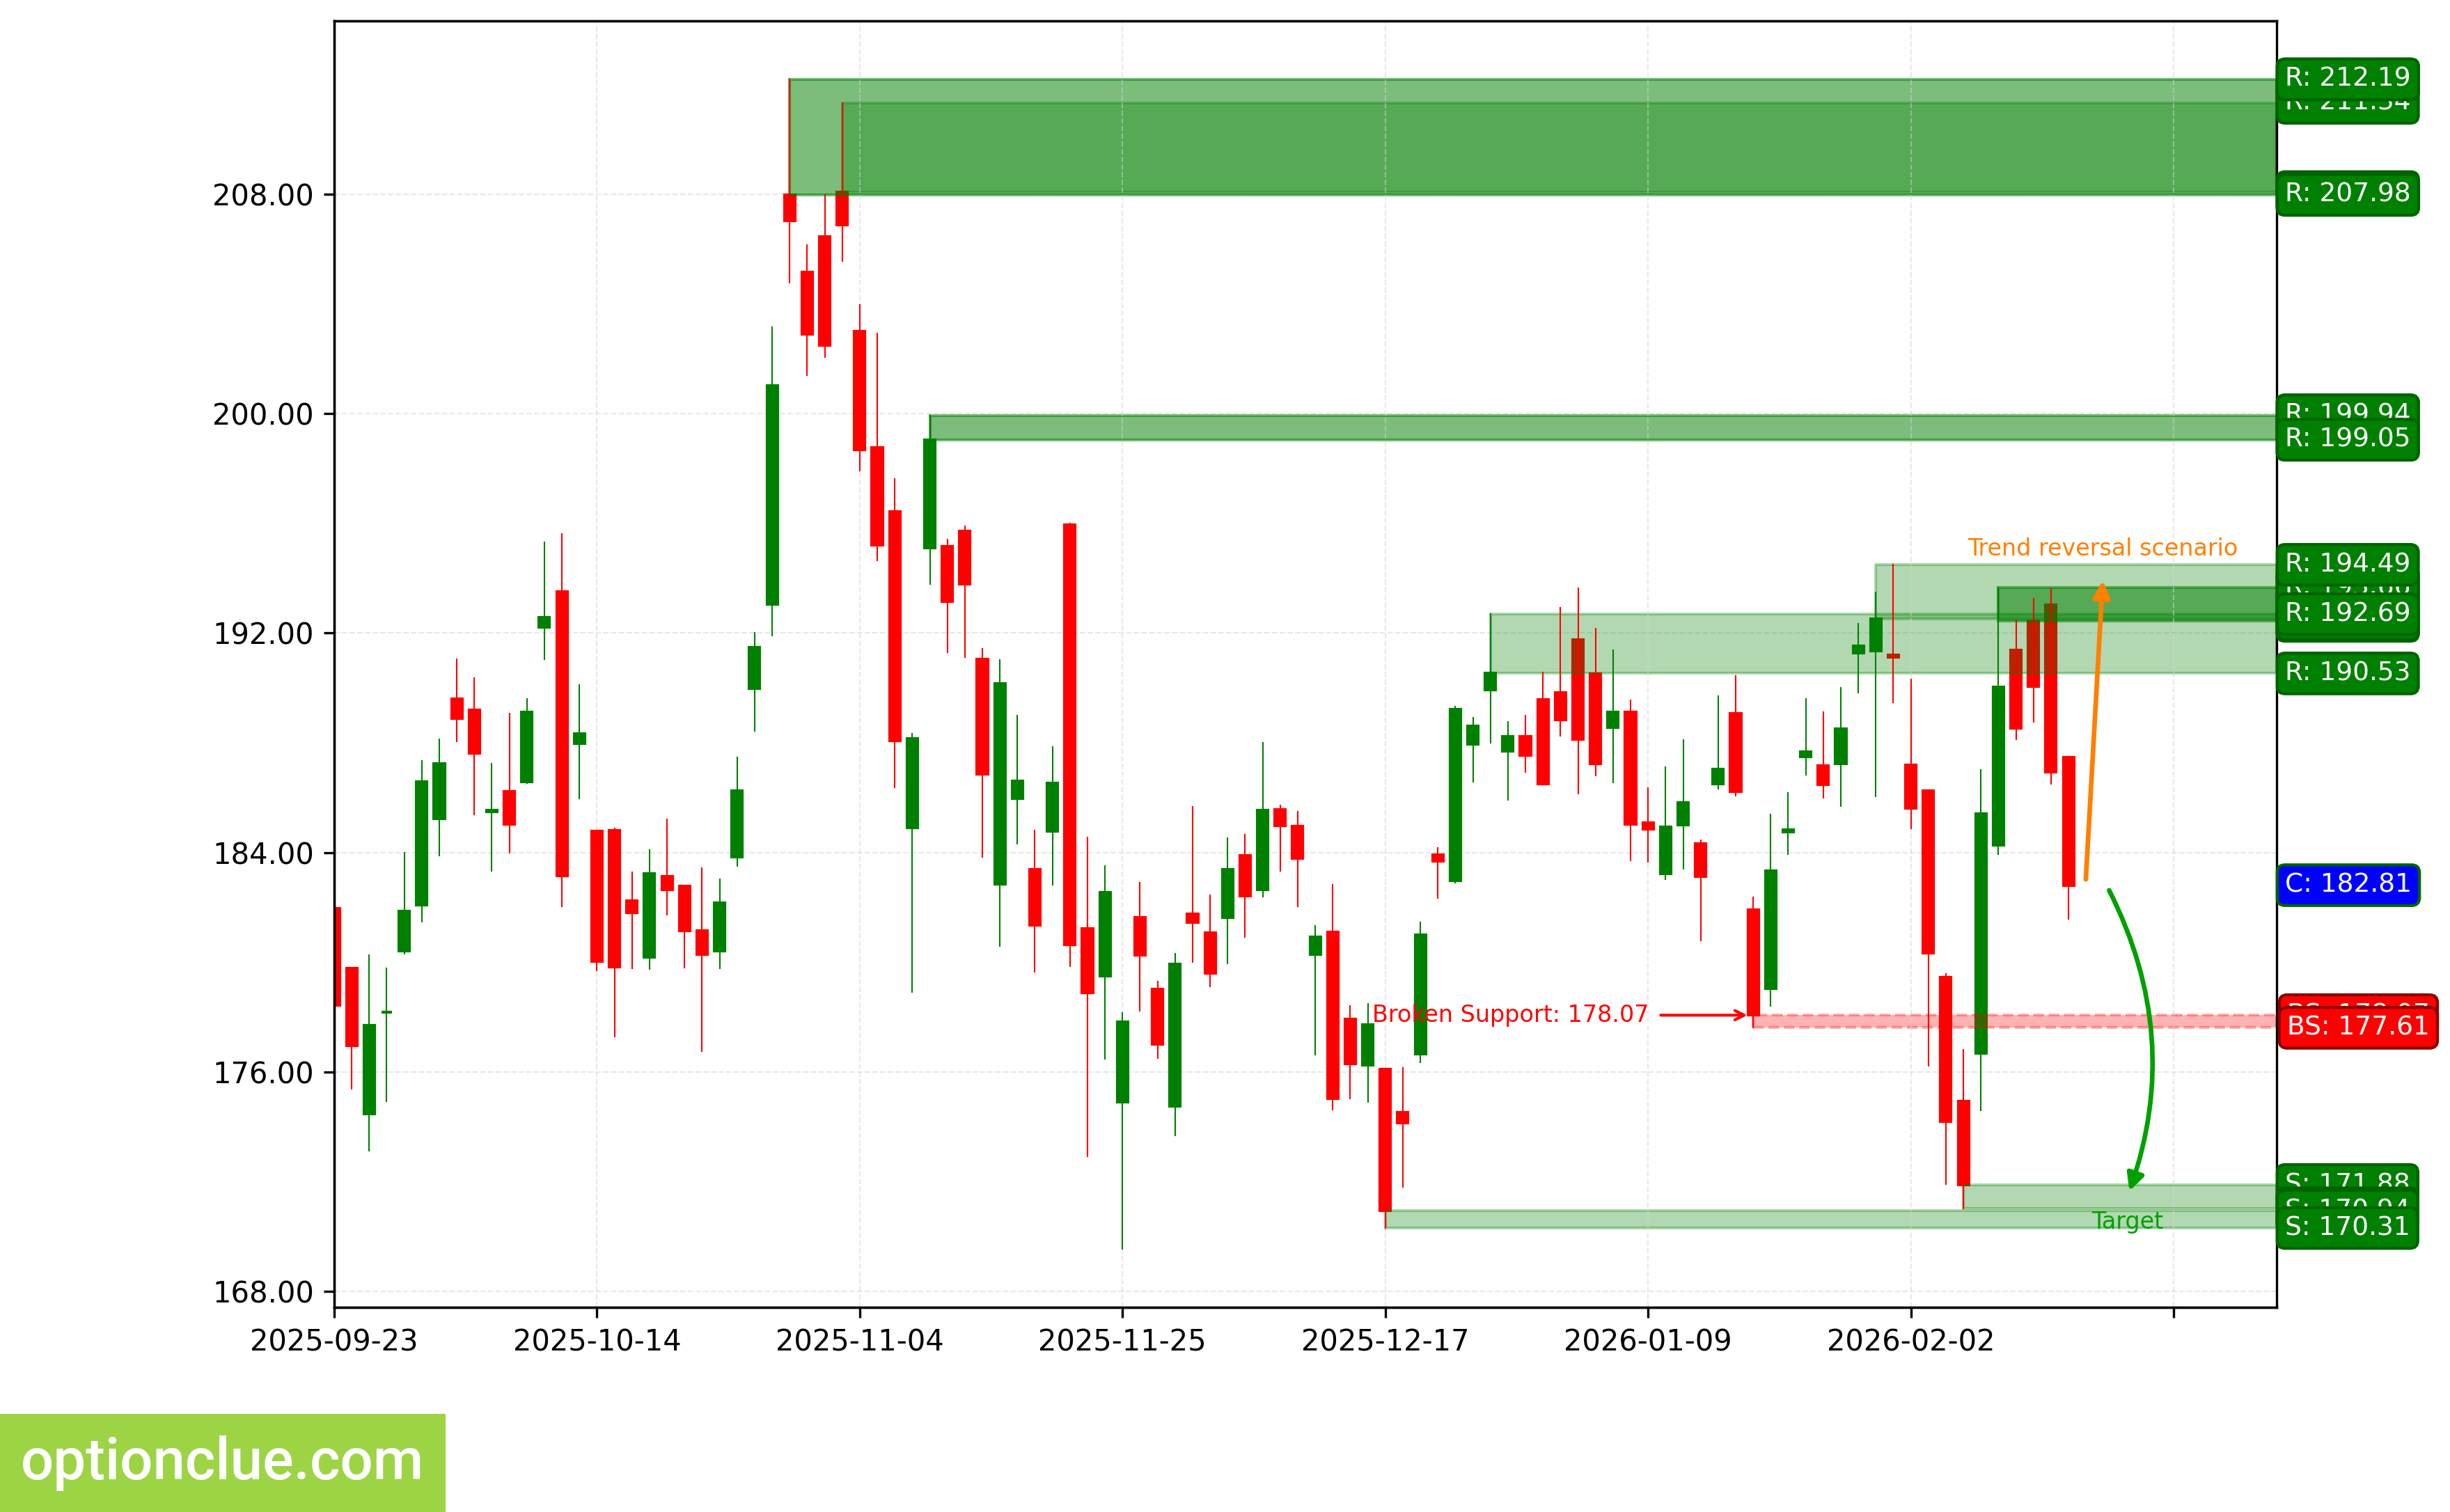
NVDA. Technical analysis. D1.
Tesla Inc (TSLA)
Bearish trend continues, a corrective wave is developing. An entry point for selling on rebound may form after the current correction completes. The last broken level is support (414.50 — 416.56). The breakout occurred 8 candlesticks ago.
Intermediate target for the downside move is the support level with boundaries 387.53 — 397.02.
If the correction completes near the resistance level (430.41 — 439.88), the potential profit/risk ratio may be approximately 1.8:1.
Short positions will remain relevant as long as the market remains below the nearest resistance level with boundaries 430.41 — 439.88. If the market successfully settles above this nearest resistance, the trend will reverse to the opposite (bullish).
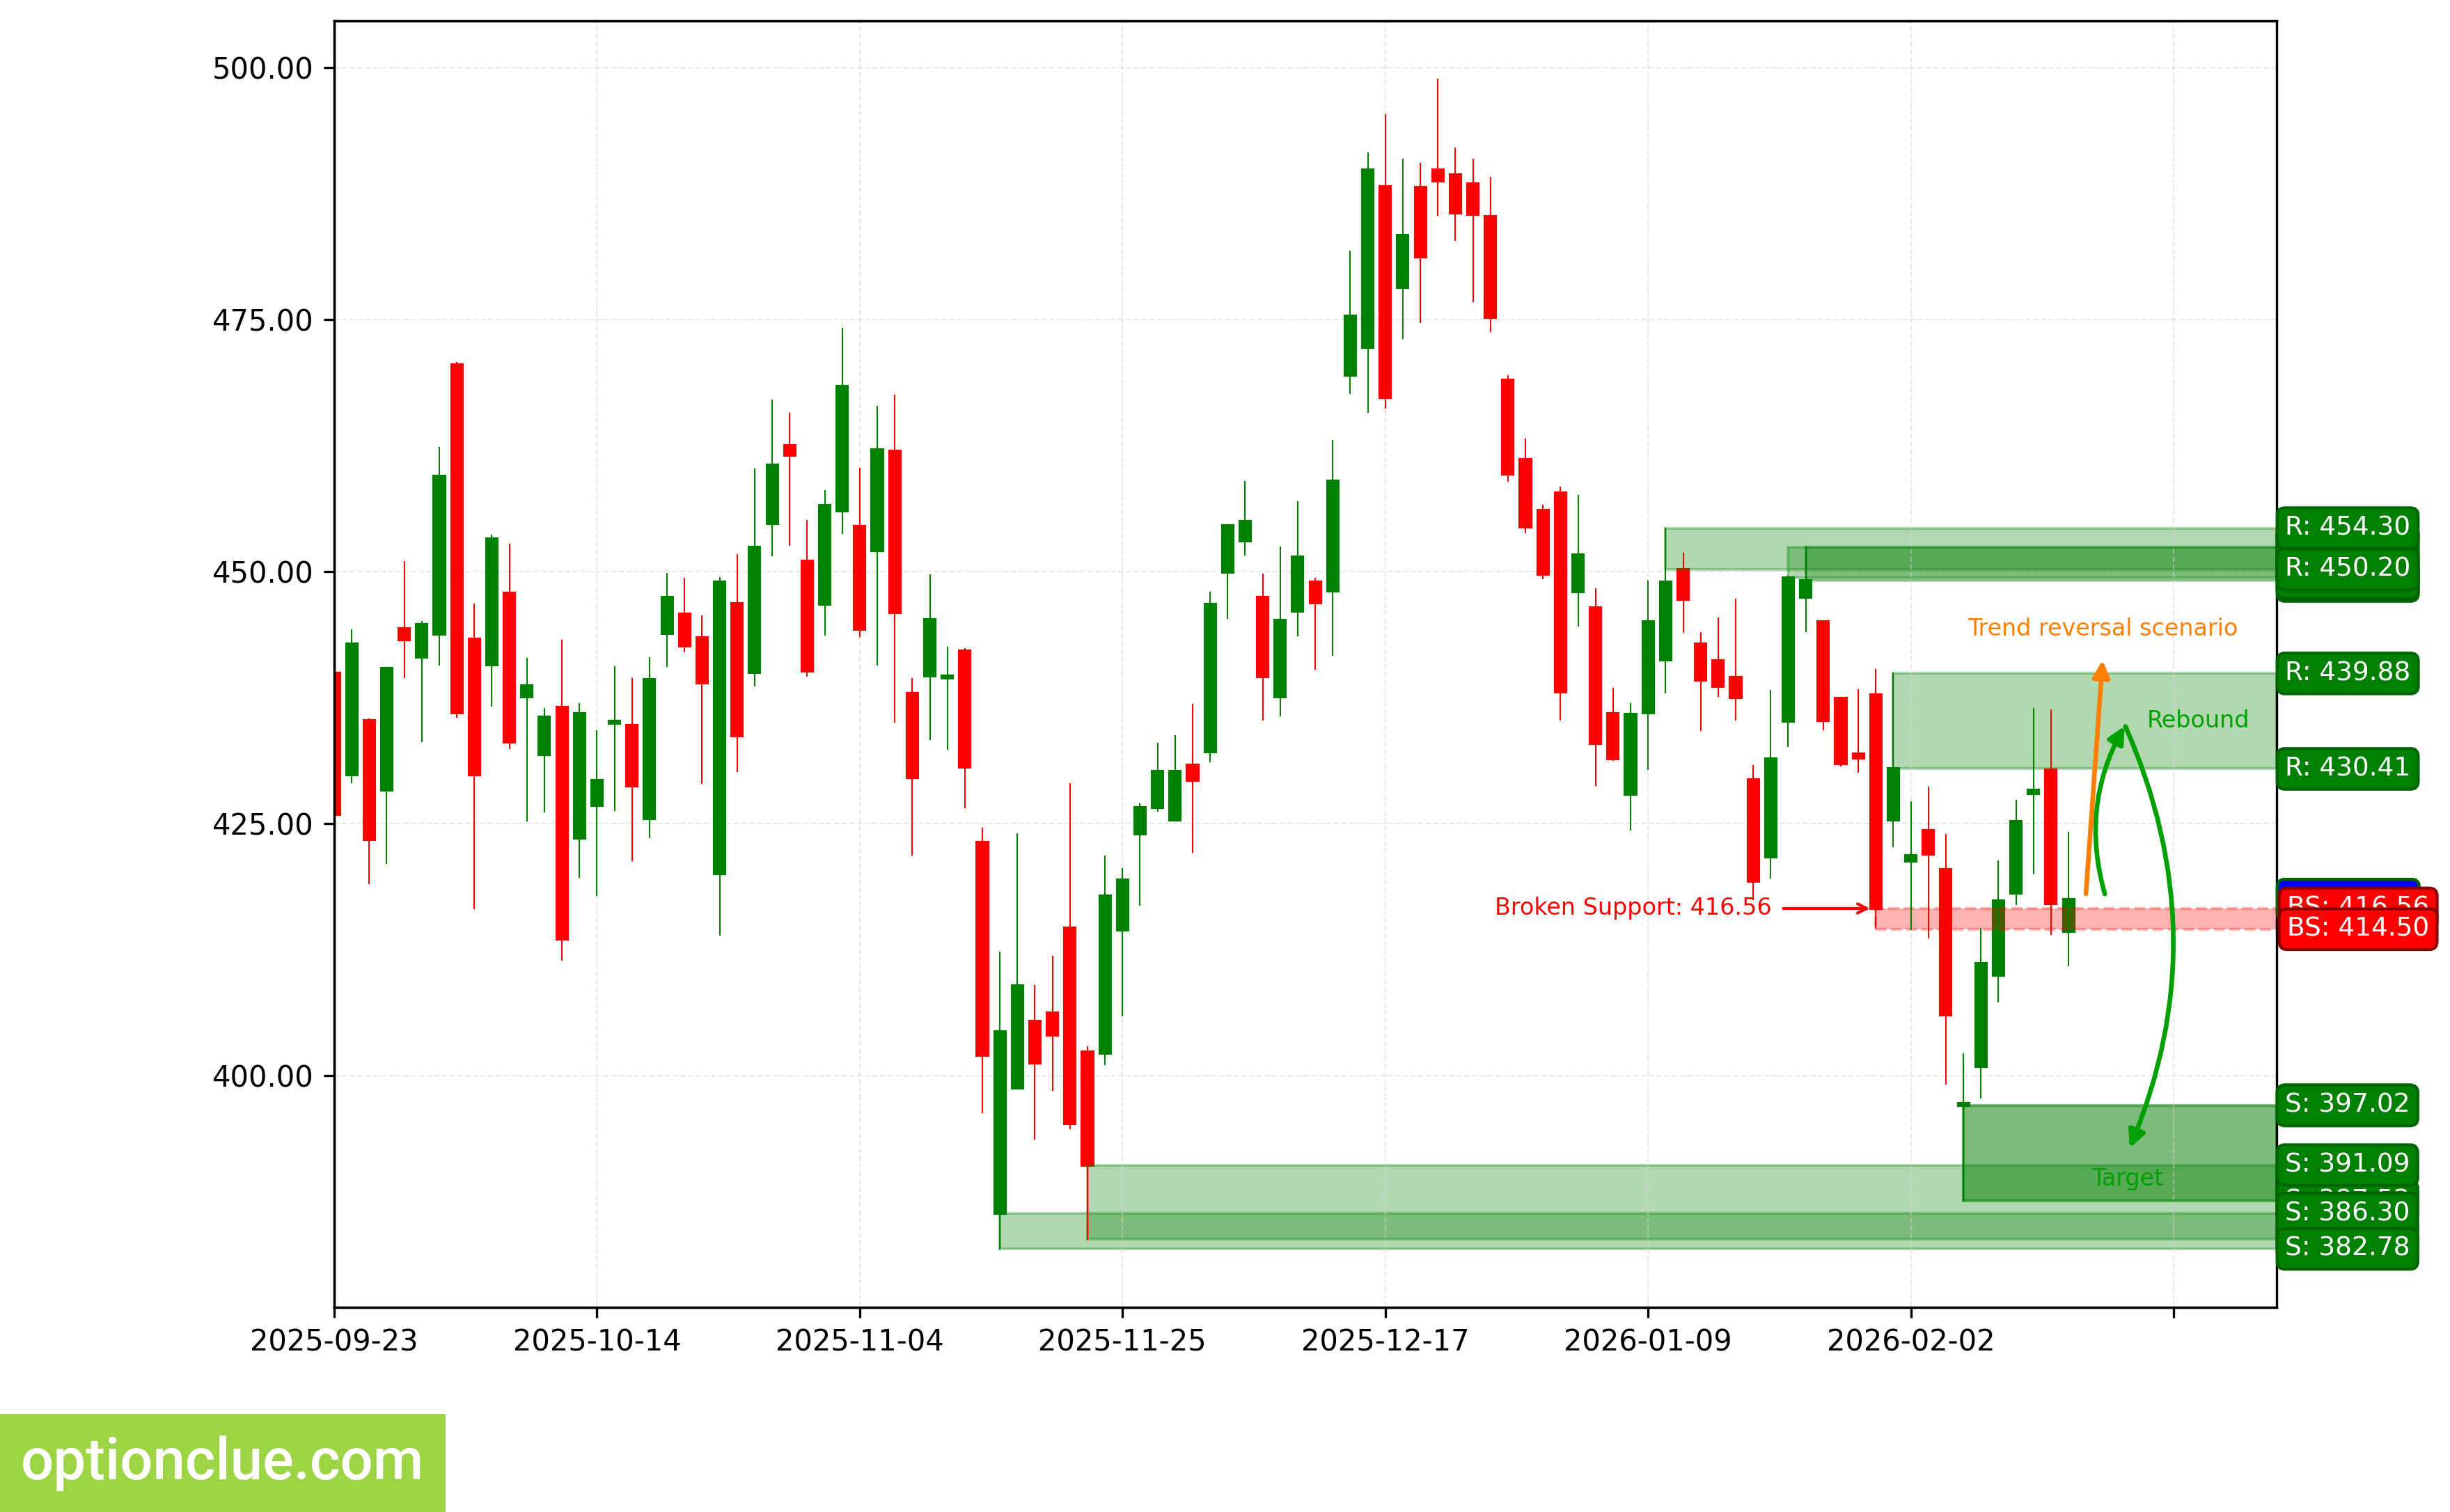
TSLA. Technical analysis. D1.
Summary
From the perspective of medium-term trading, financial instruments with correction close to completion on Daily and/or potentially the most promising profit-to-risk ratios include: EURUSD, USDCAD, AUDUSD, AAPL. Soon they may be worth attention depending on the depth of market correction: BTC, ETH.
The remaining financial instruments on the trading list may also be of interest, but on these markets rebound signals on Daily are likely to appear no earlier than in a week.