We examine key levels for each financial instrument and likely scenario developments.
Key Topics
- Euro (EURUSD)
- British Pound (GBPUSD)
- Swiss Franc (USDCHF)
- Japanese Yen (USDJPY)
- Canadian Dollar (USDCAD)
- Australian Dollar (AUDUSD)
- Bitcoin (BTC)
- Ether (ETH)
- Apple Inc (AAPL)
- NVIDIA Corp (NVDA)
- Tesla Inc (TSLA)
- Summary
Euro (EURUSD)
Bullish trend continues, impulse wave is developing. The last broken level is resistance (1.1666 — 1.1682). Breakout occurred 3 candlesticks ago.
Intermediate target for the upward movement is the resistance level with boundaries 1.1815 — 1.1820.
Potential profit/risk ratio from current prices when setting targets and fixing risks based on daily timeframe levels may be small (approximately 0.4:1). If the correction completes near the support level (1.1615 — 1.1628), the potential profit/risk ratio could be more than 2:1. If the correction completes near the last broken level (1.1666 — 1.1682), the potential profit/risk ratio could be insignificant (around 1.1:1).
Long positions will remain relevant as long as the market is above the nearest support level with boundaries 1.1615 — 1.1628. If the market successfully settles below this support, the trend will reverse to the opposite (bearish).
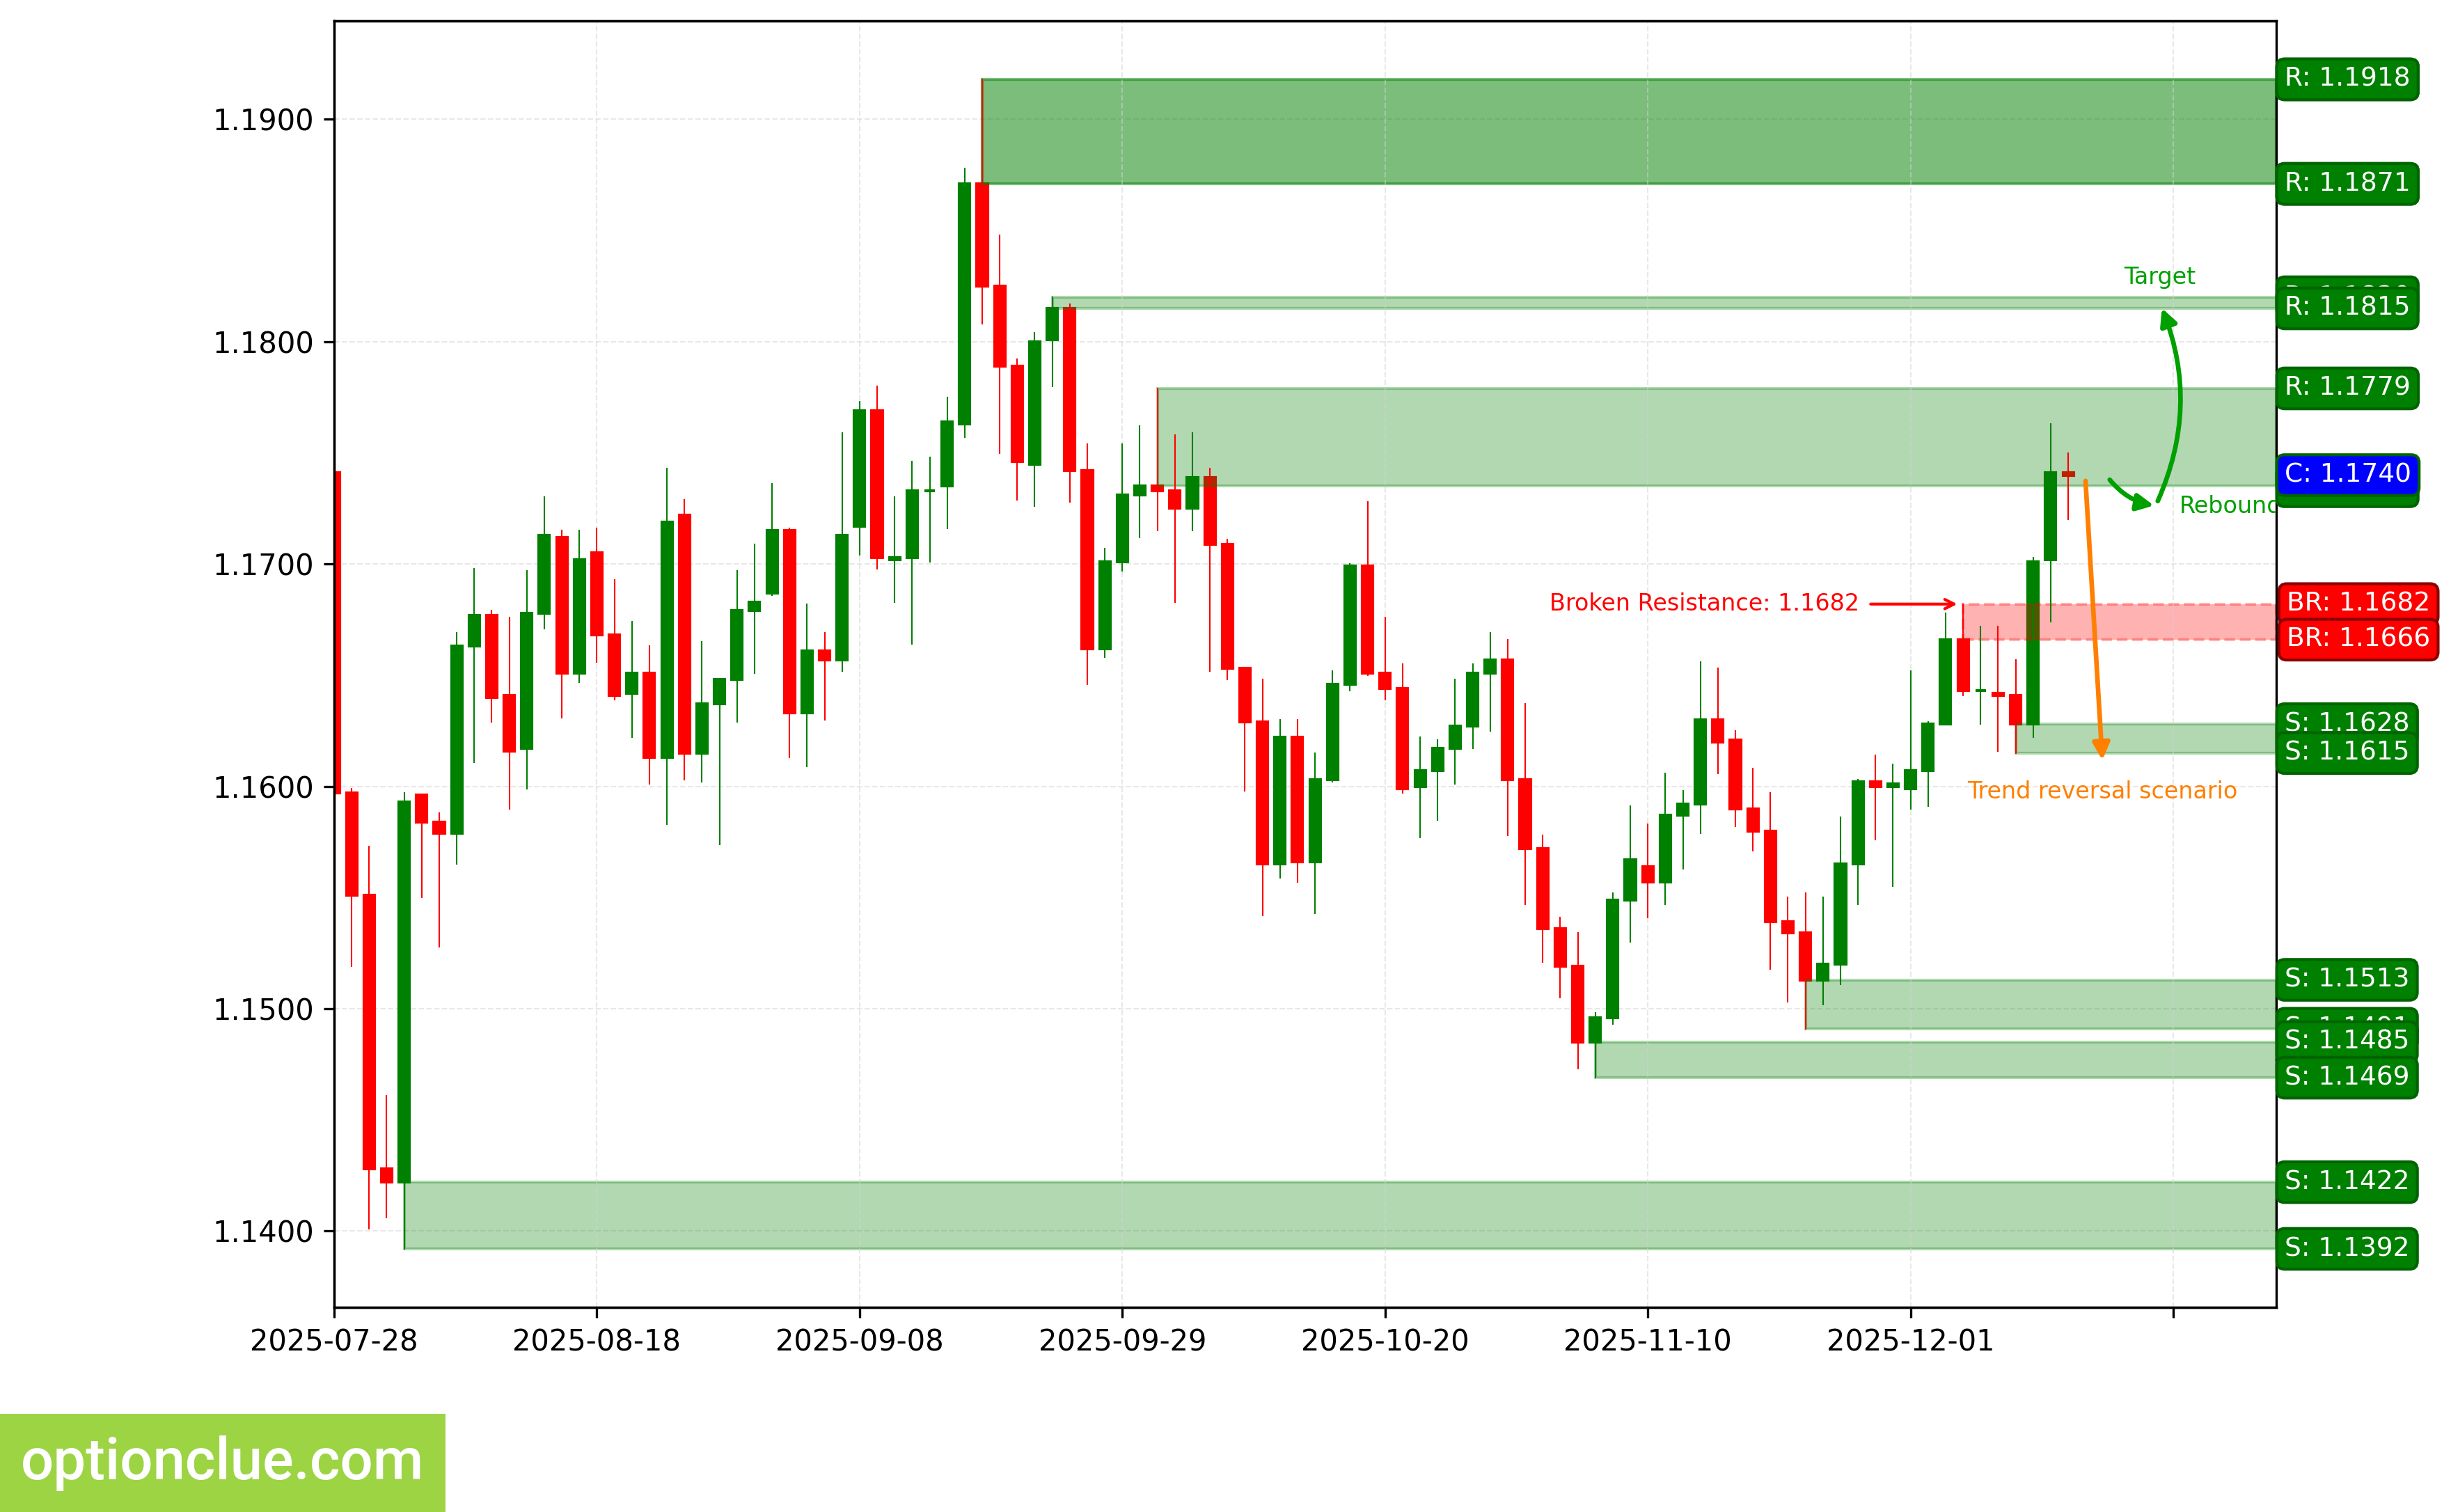
EURUSD. Technical analysis. D1.
British Pound (GBPUSD)
Bullish trend continues, impulse wave is developing.
Intermediate target for the upward movement is the resistance level with boundaries 1.3444 — 1.3471. In case of successful trend development, a further target will be at the resistance level with boundaries 1.3524 — 1.3537.
If the correction completes near the support level (1.3176 — 1.3211), the potential profit/risk ratio could be approximately 2:1. When using the further target — around 3:1.
Long positions will remain relevant as long as the market is above the nearest support level with boundaries 1.3176 — 1.3211. If the market successfully settles below this nearest support, the trend will reverse to the opposite (bearish).
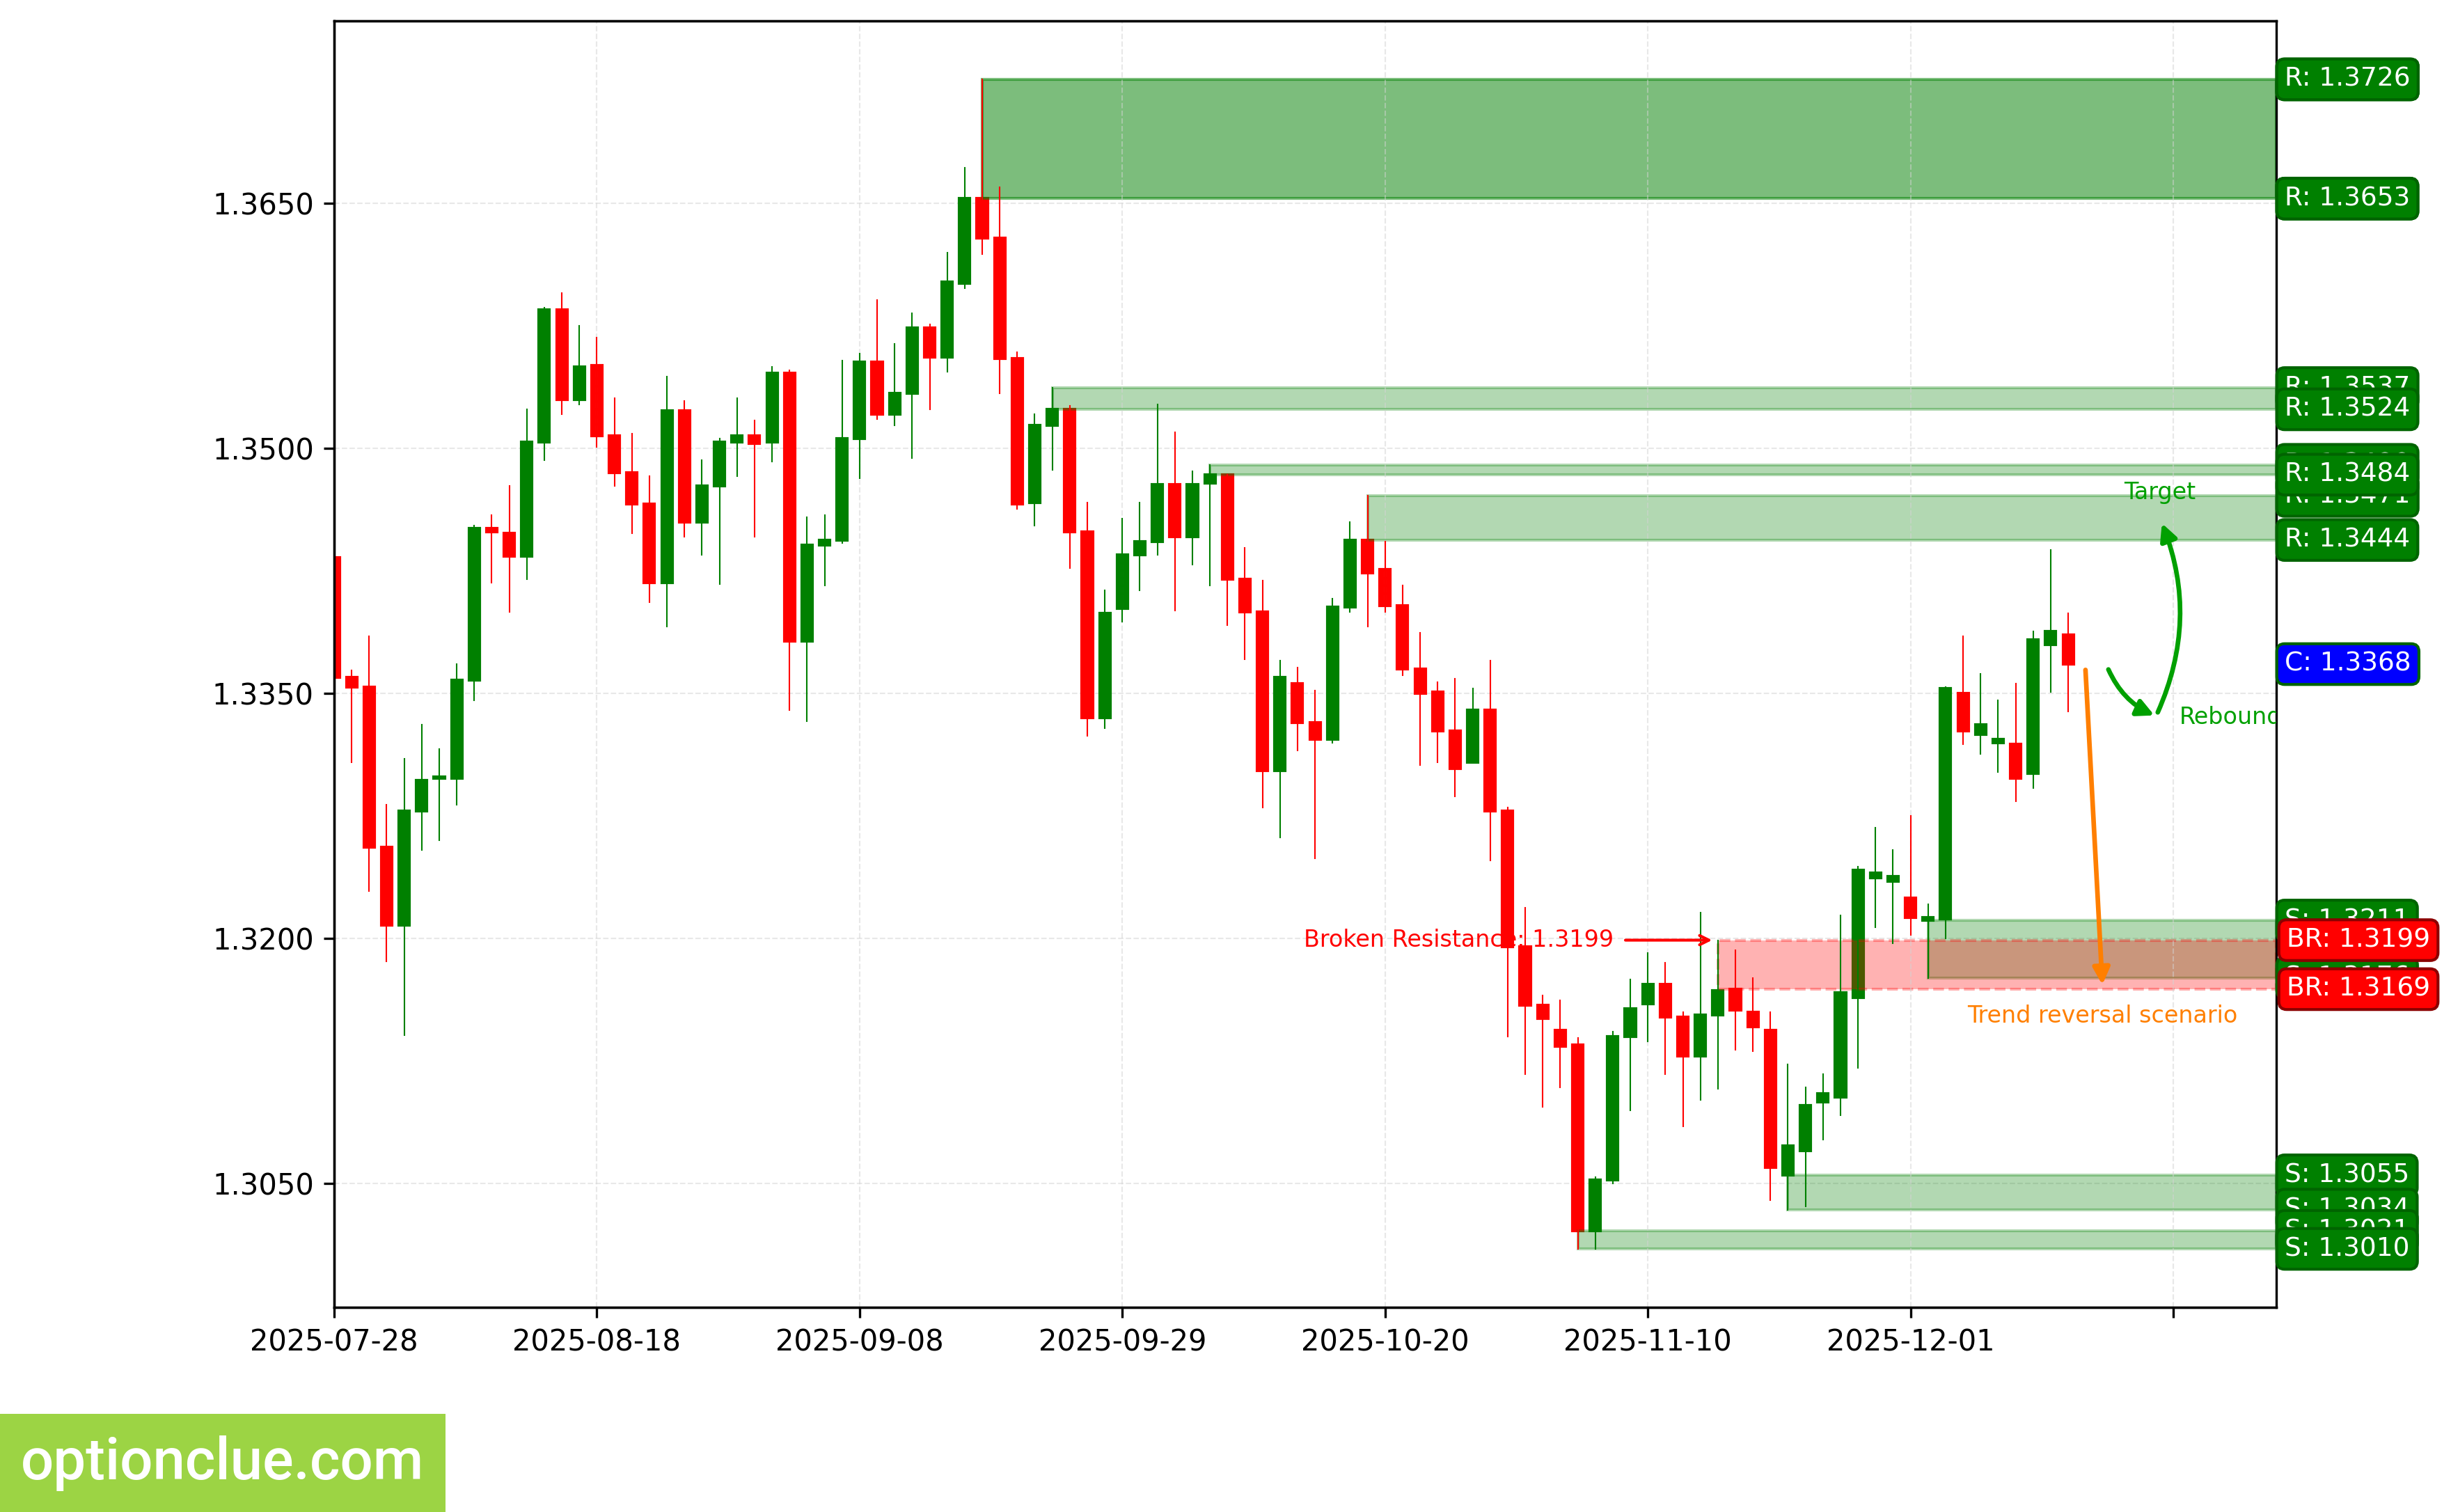
GBPUSD. Technical analysis. D1.
Swiss Franc (USDCHF)
Bearish trend continues, corrective wave is developing. Entry point for selling on rebound may form after completion of the current correction. The last broken level is support (0.7990 — 0.7997). Breakout occurred 2 candlesticks ago.
Intermediate target for the downward movement is the support level with boundaries 0.7876 — 0.7923.
Potential profit/risk ratio from current prices when setting targets and fixing risks based on daily timeframe levels may be small (around 0.2:1). If the correction completes near the resistance level (0.8068 — 0.8085), the potential profit/risk ratio could be approximately 2.4:1. If the correction completes near the last broken level (0.7990 — 0.7997), the potential profit/risk ratio could be small (approximately 0.5:1).
Short positions will remain relevant as long as the market remains below the nearest resistance level with boundaries 0.8068 — 0.8085. If the market successfully settles above this nearest resistance, the trend will reverse to the opposite (bullish).
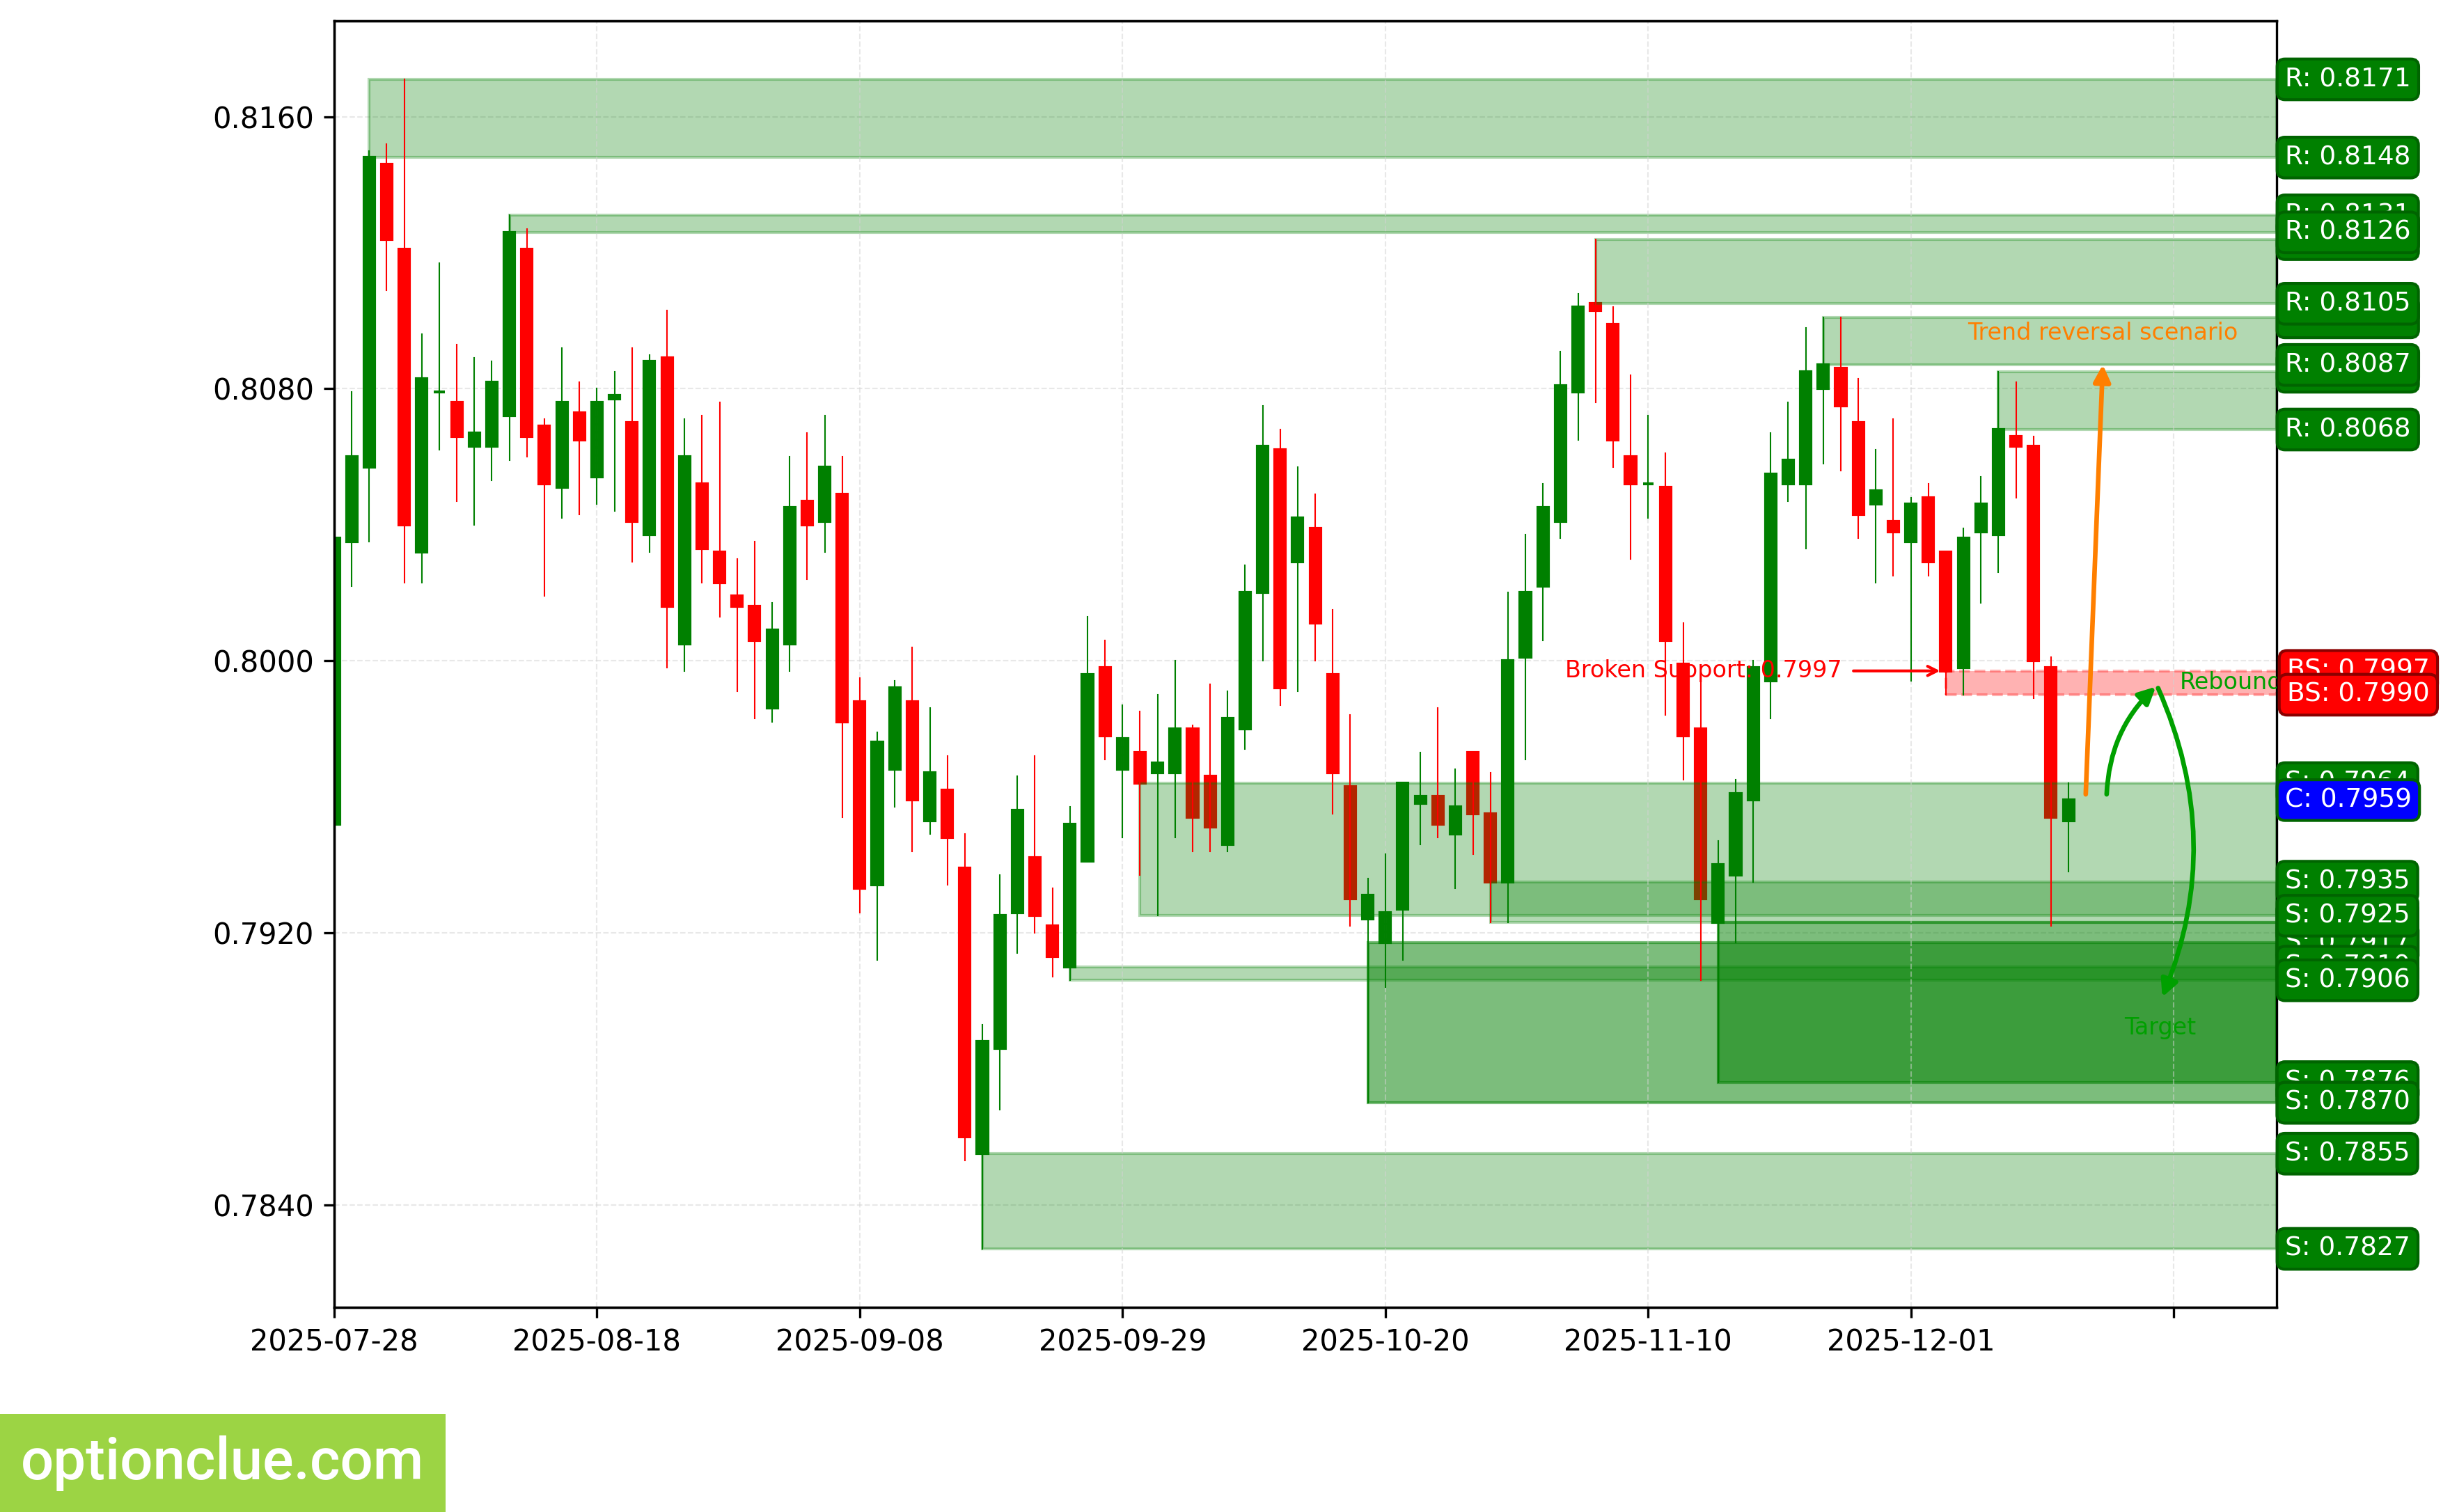
USDCHF. Technical analysis. D1.
Japanese Yen (USDJPY)
Trend has turned bullish when the resistance level (156.29 — 156.74) was broken last week. Breakout occurred 4 candlesticks ago. Corrective wave is developing. Entry point for buying may form after completion of the current correction.
Intermediate target for the upward movement is the resistance level with boundaries 156.82 — 156.95. In case of successful trend development, a further target will be at the resistance level with boundaries 161.69 — 161.85.
If the correction completes near the support level (154.35 — 155.12), the potential profit/risk ratio could be small (approximately 1.3:1). When using the further target — around 4.5:1.
Long positions will remain relevant as long as the market is above the nearest support level with boundaries 154.35 — 155.12. If the market successfully settles below this support, the trend will reverse to the opposite (bearish).
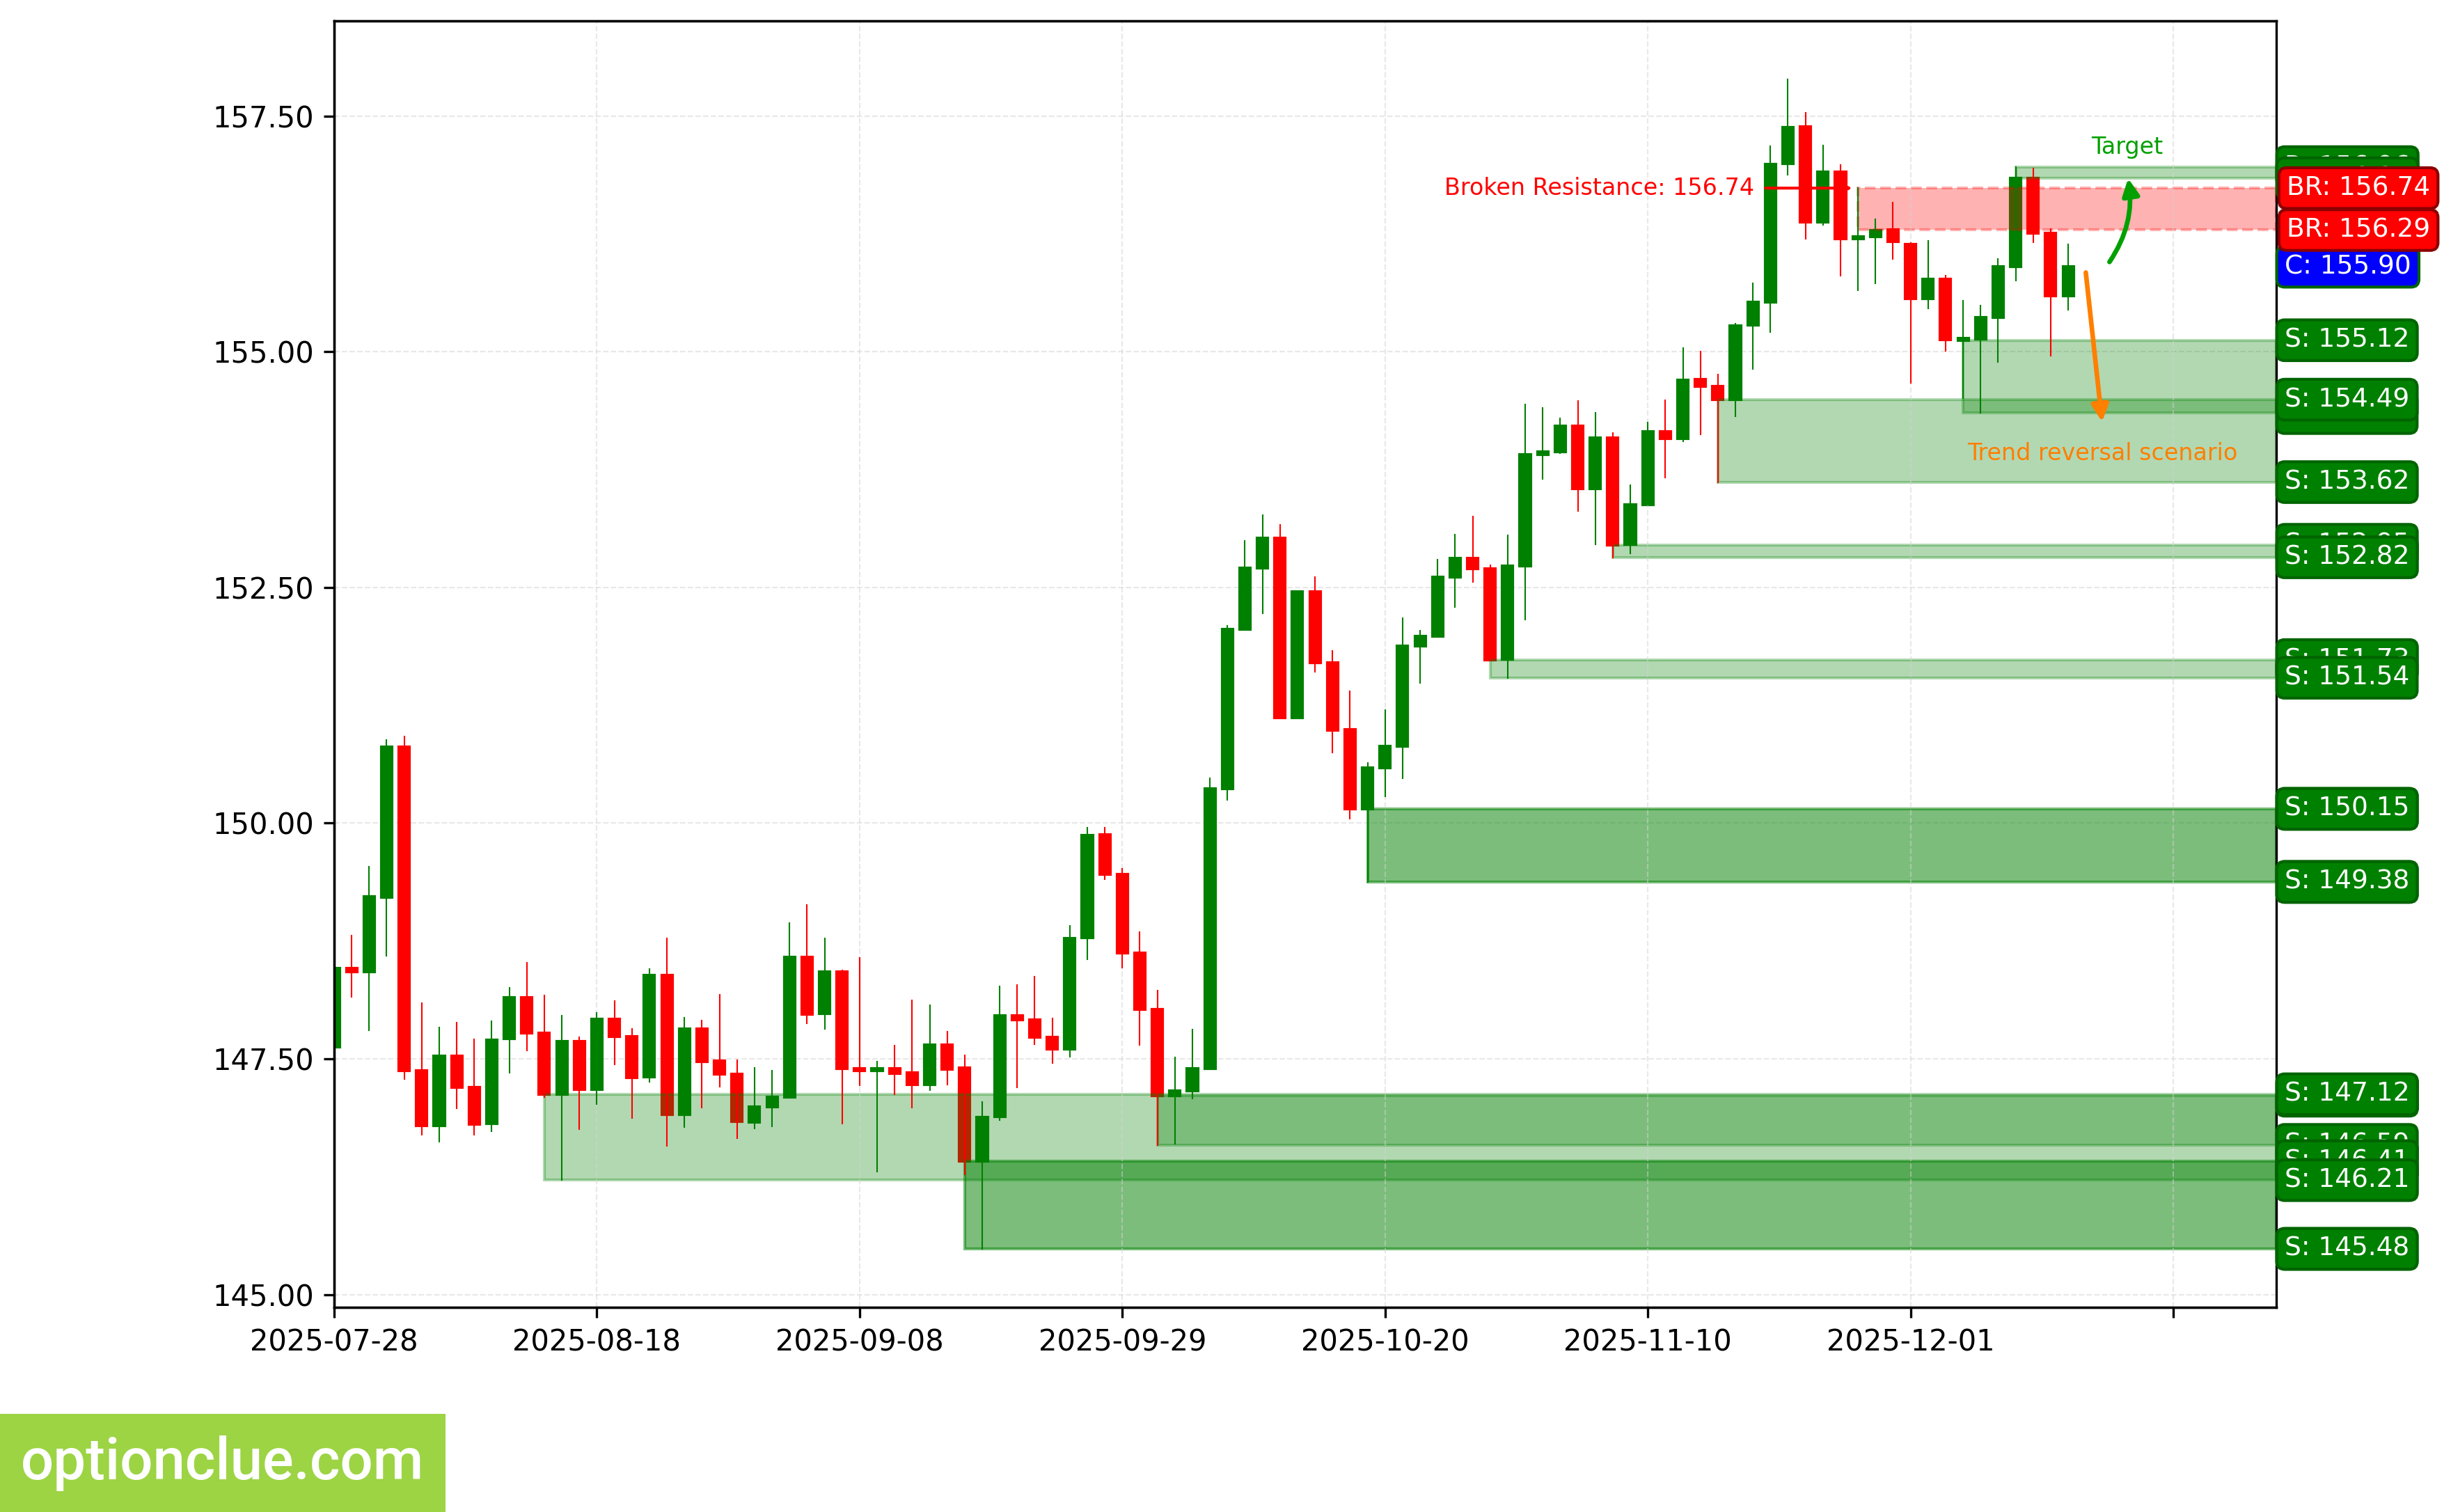
USDJPY. Technical analysis. D1.
Canadian Dollar (USDCAD)
Bearish trend continues, impulse wave is developing.
Intermediate target for the downward movement is the support level with boundaries 1.3723 — 1.3738. In case of successful trend development, a further target will be at the support level with boundaries 1.3573 — 1.3590.
If the correction completes near the resistance level (1.3858 — 1.3871), the potential profit/risk ratio could be approximately 1.5:1. When using the further target — around 3.3:1.
Short positions will remain relevant as long as the market remains below the nearest resistance level with boundaries 1.3858 — 1.3871. If the market successfully settles above this nearest resistance, the trend will reverse to the opposite (bullish).
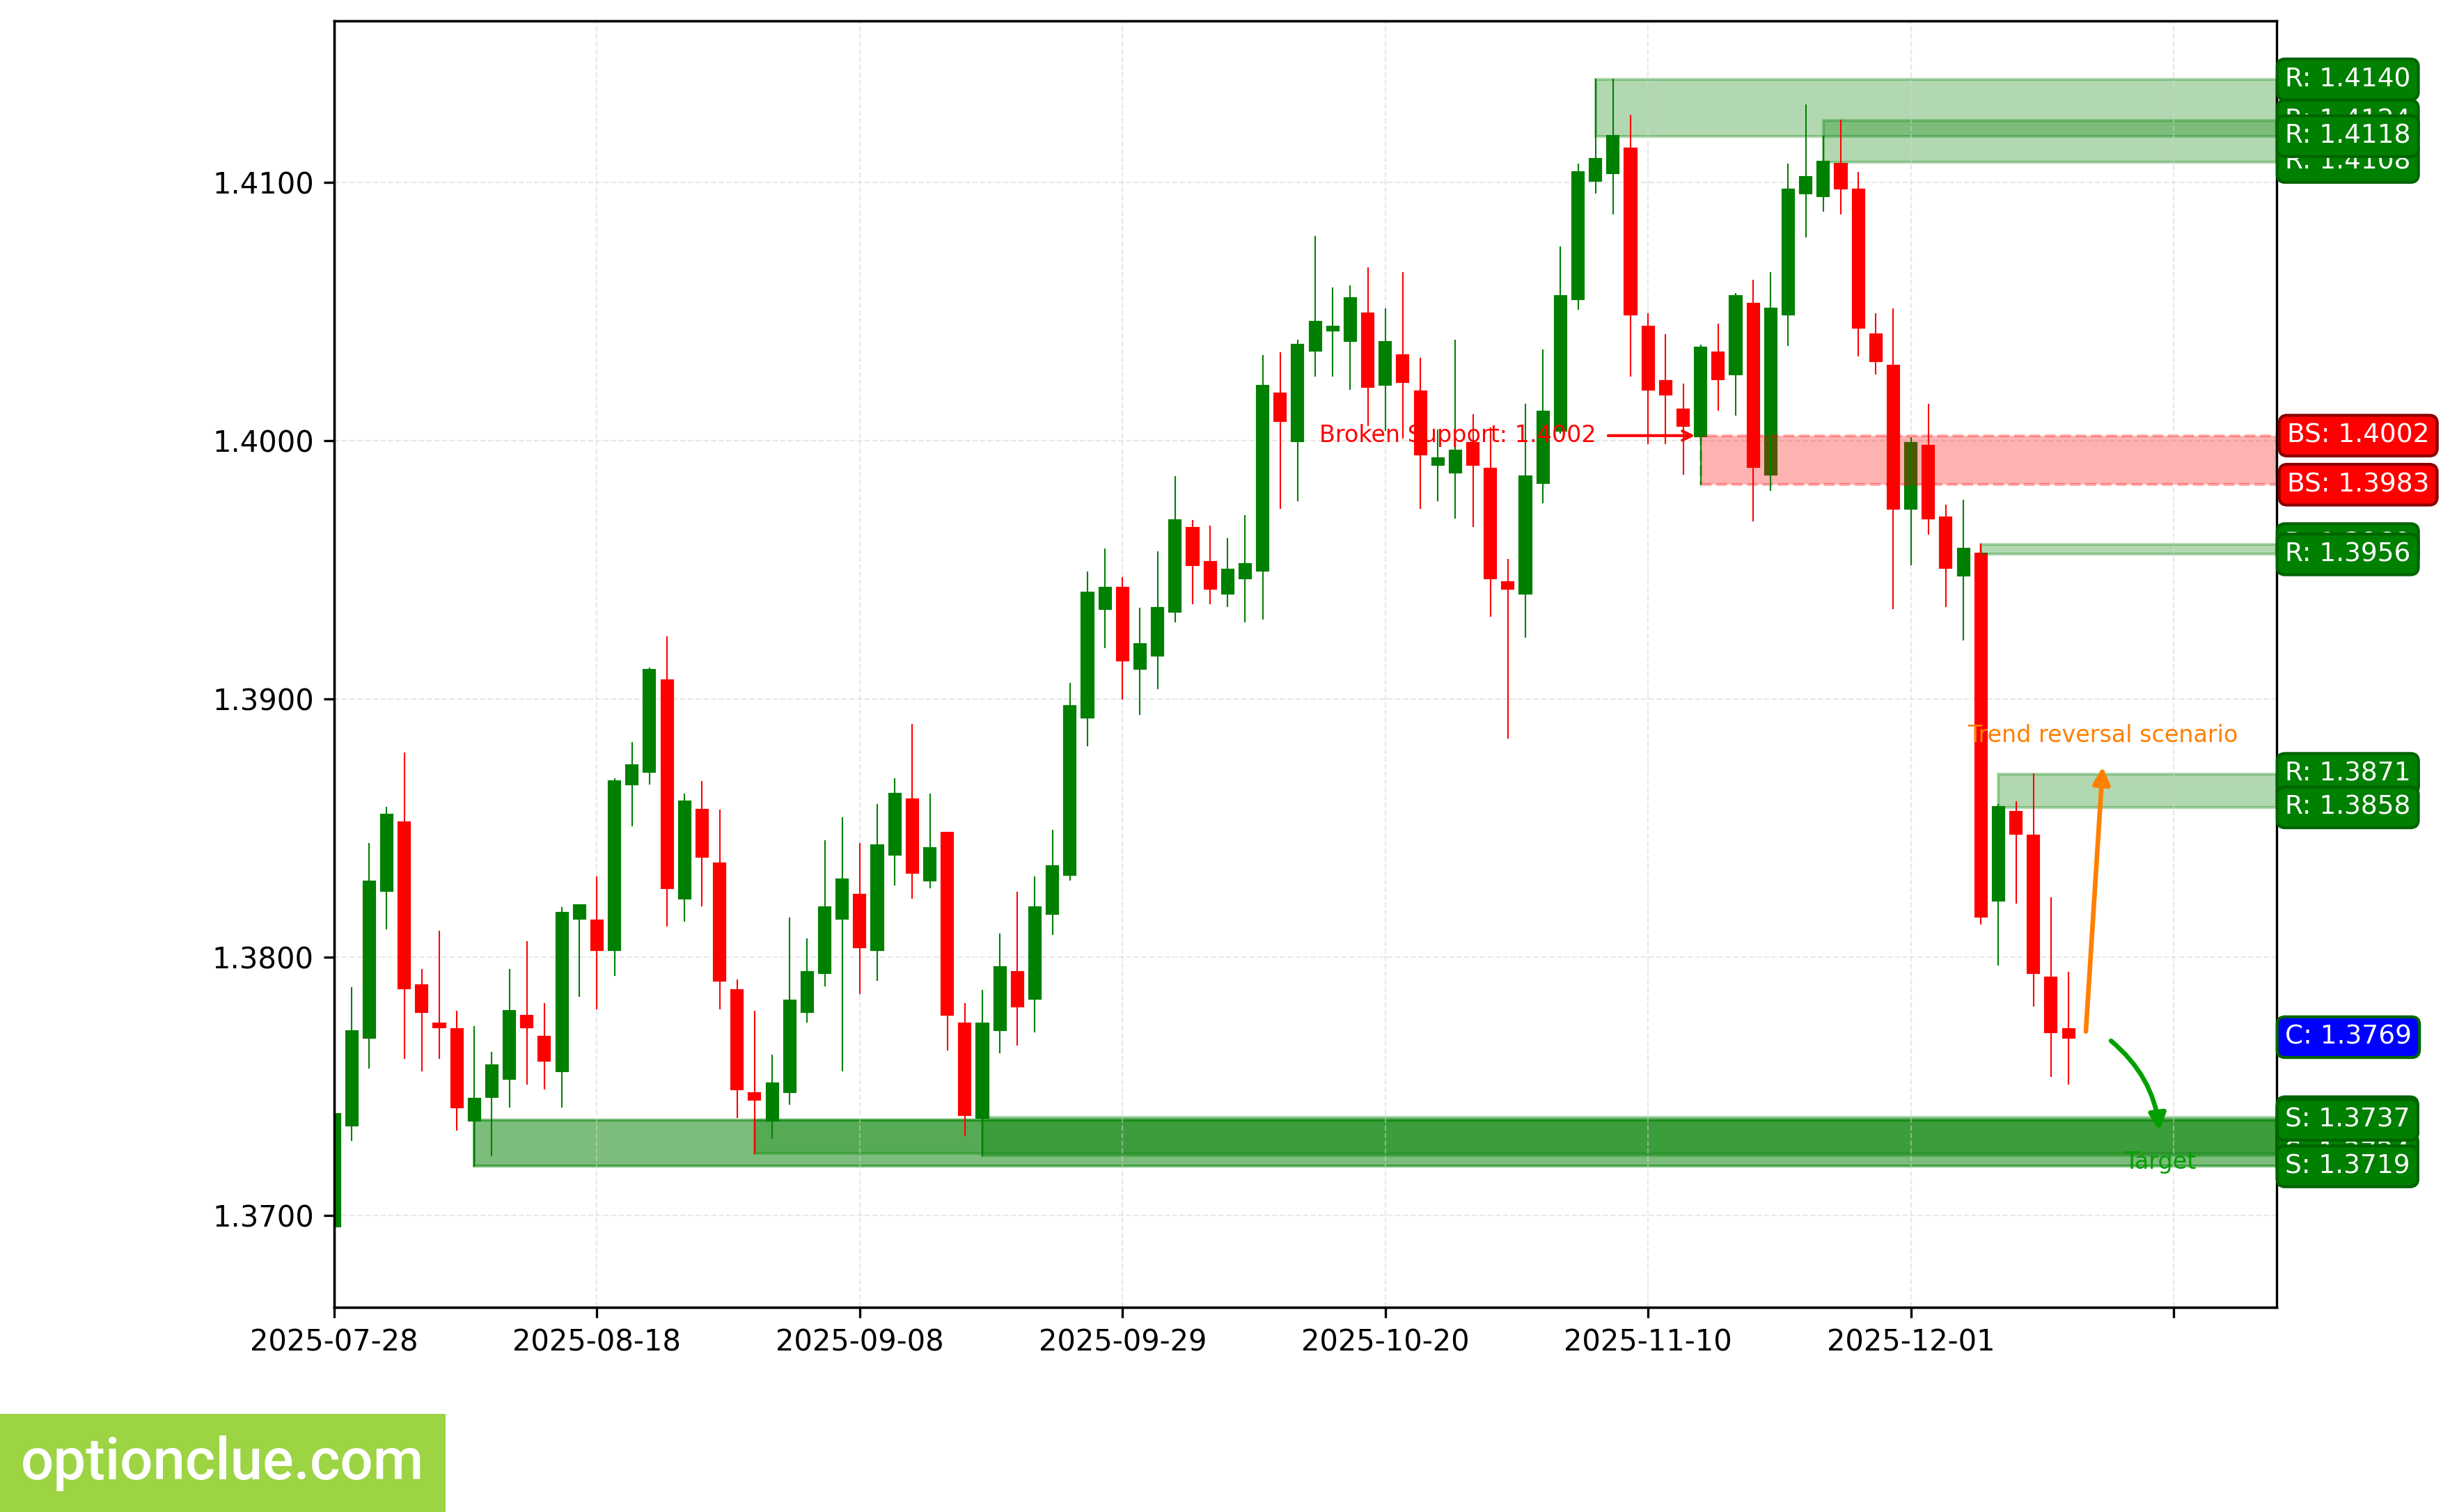
USDCAD. Technical analysis. D1.
Australian Dollar (AUDUSD)
Bullish trend continues, impulse wave is developing. The last broken level is resistance (0.6536 — 0.6580). Breakout occurred 8 candlesticks ago.
Intermediate target for the upward movement is the resistance level with boundaries 0.6676 — 0.6685.
Potential profit/risk ratio from current prices when setting targets and fixing risks based on daily timeframe levels may be less than 0.1:1. If the correction completes near the support level (0.6419 — 0.6439), the potential profit/risk ratio could be around 4:1. If the correction completes near the last broken level (0.6536 — 0.6580), the potential profit/risk ratio could be small (approximately 0.6:1).
Long positions will remain relevant as long as the market is above the nearest support level with boundaries 0.6419 — 0.6439. If the market successfully settles below this nearest support, the trend will reverse to the opposite (bearish).
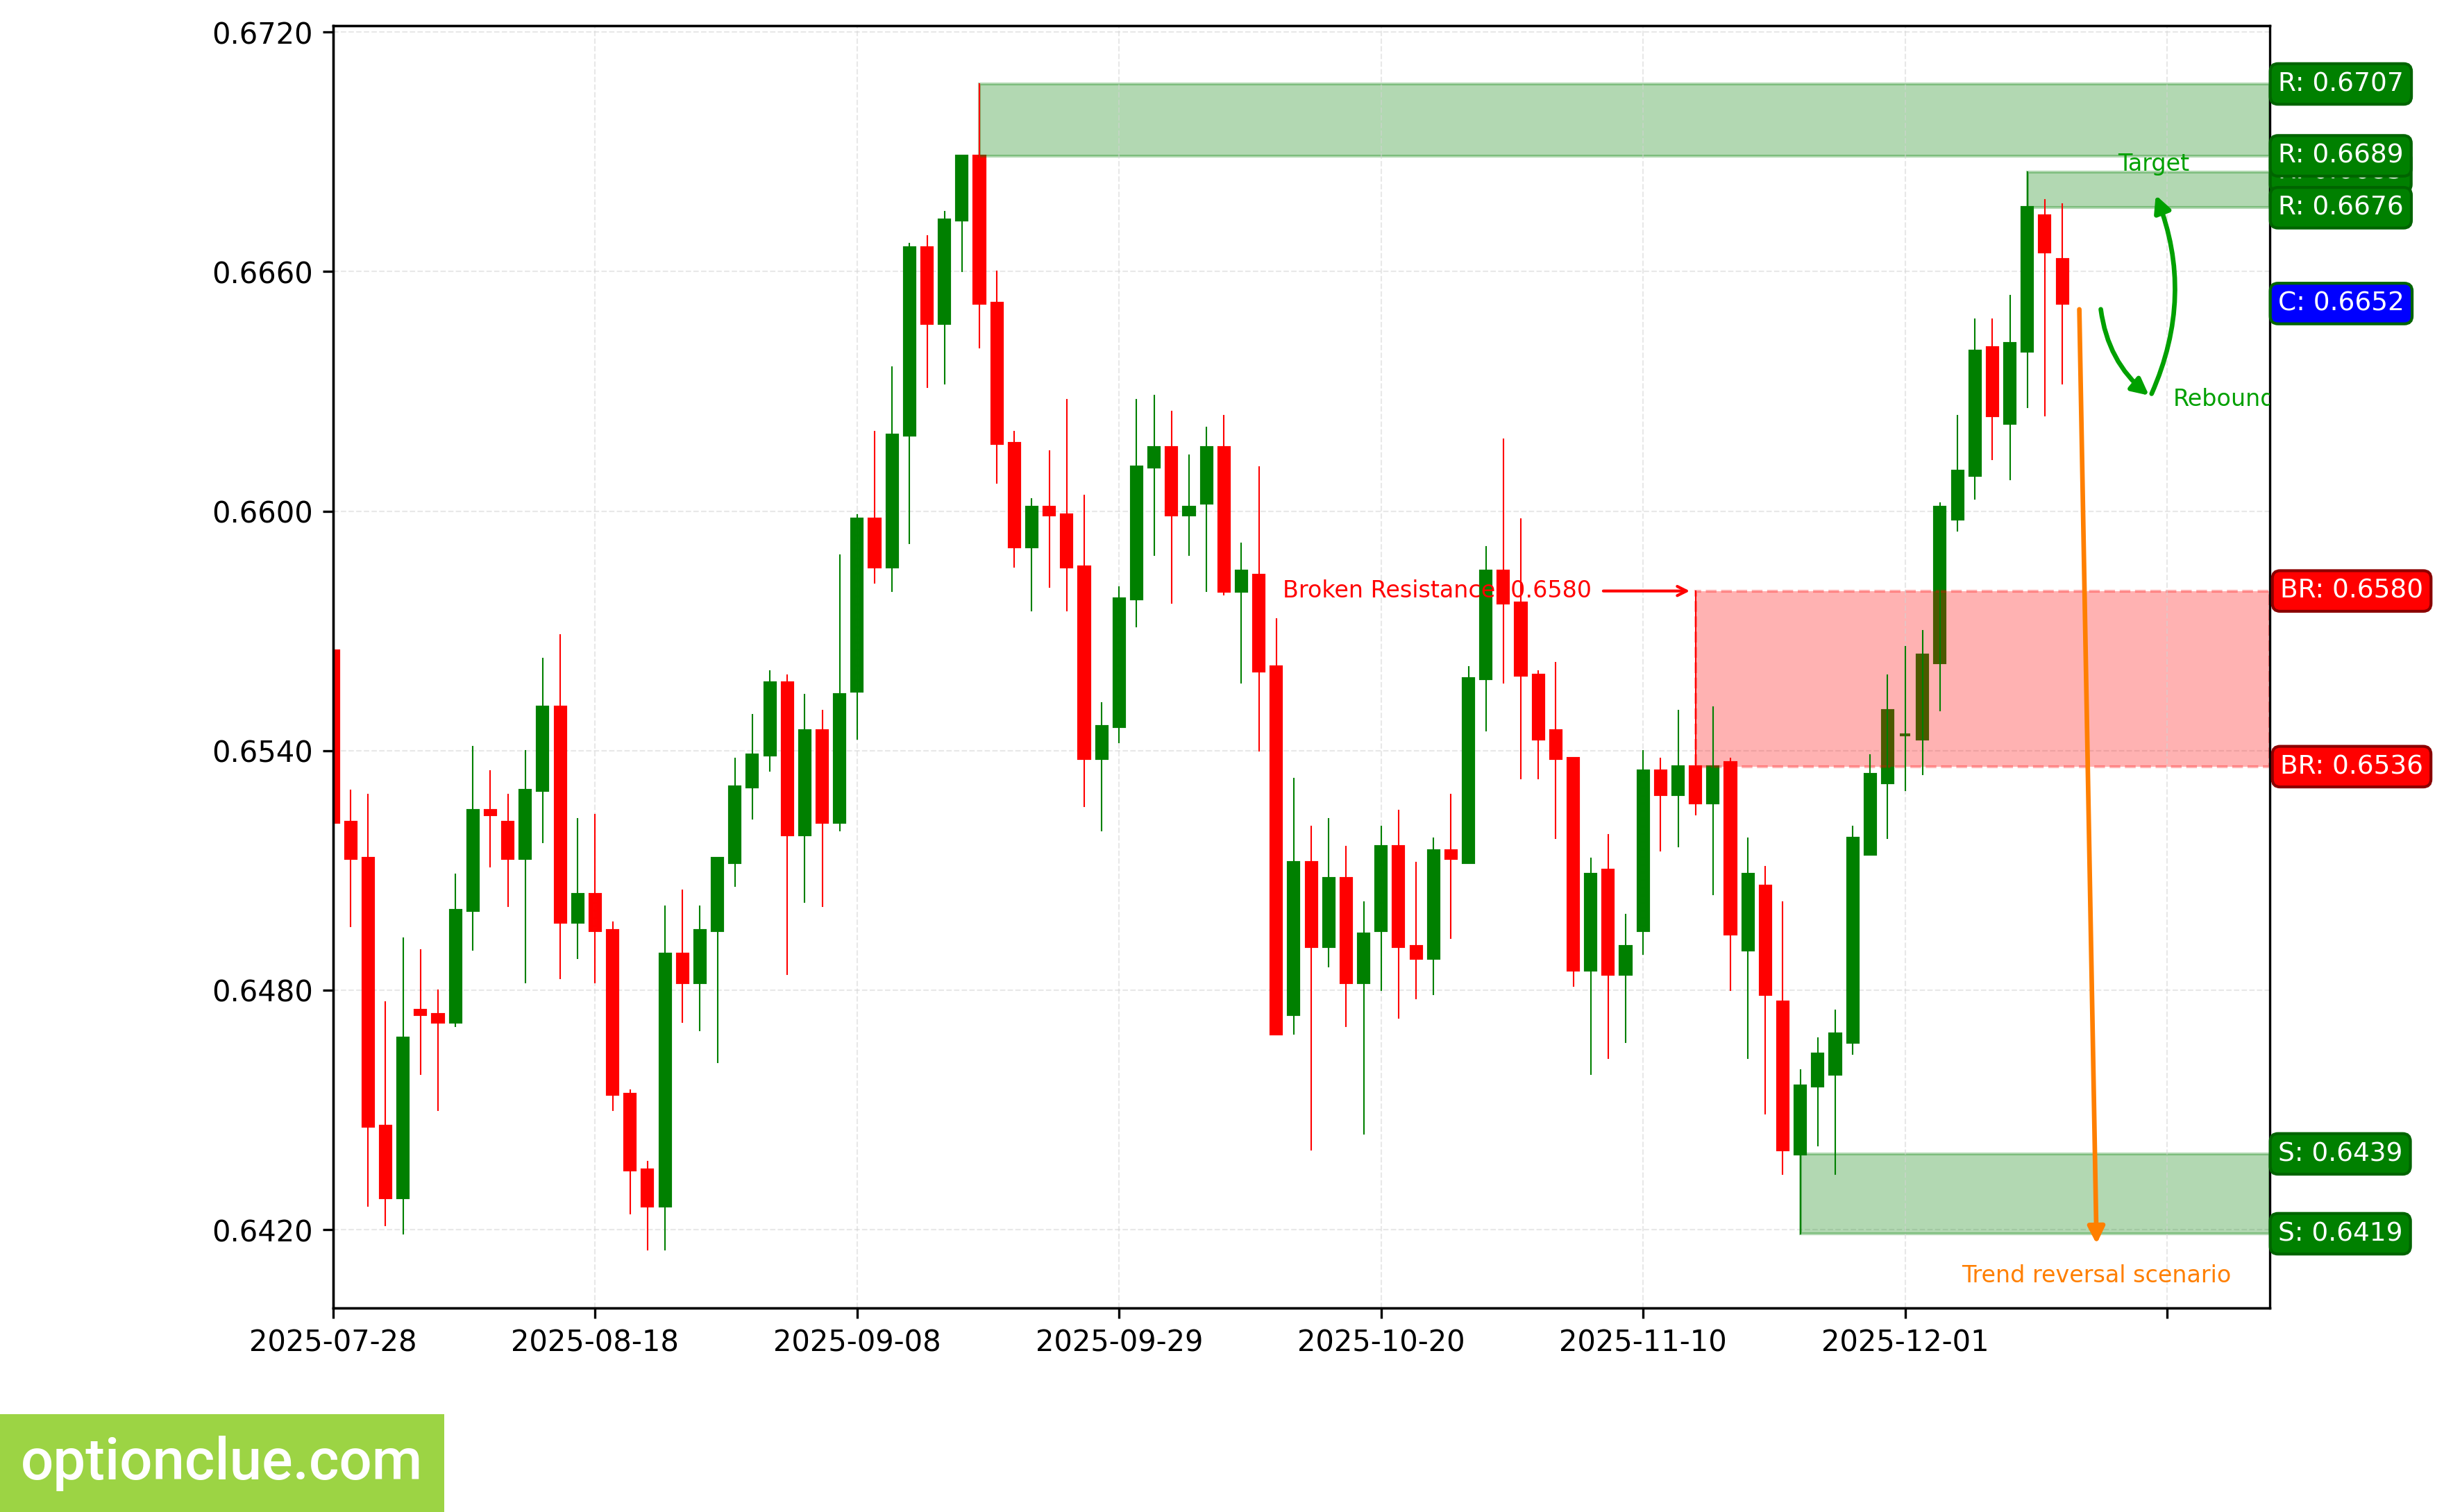
AUDUSD. Technical analysis. D1.
Bitcoin (BTC)
Bullish trend continues, corrective wave is developing. Entry point for buying on rebound may form after completion of the current correction. The last broken level is resistance (91285 — 92969). Breakout occurred 11 candlesticks ago.
Intermediate target for the upward movement is the resistance level with boundaries 93528 — 94061. In case of successful trend development, a further target will be at the resistance level with boundaries 105997 — 107428.
If the correction completes near the support level (87799 — 89272), the potential profit/risk ratio could be small (around 1.2:1). When using the further target — around 4:1.
Long positions will remain relevant as long as the market is above the nearest support level with boundaries 87799 — 89272. If the market successfully settles below this nearest support, the trend will reverse to the opposite (bearish).
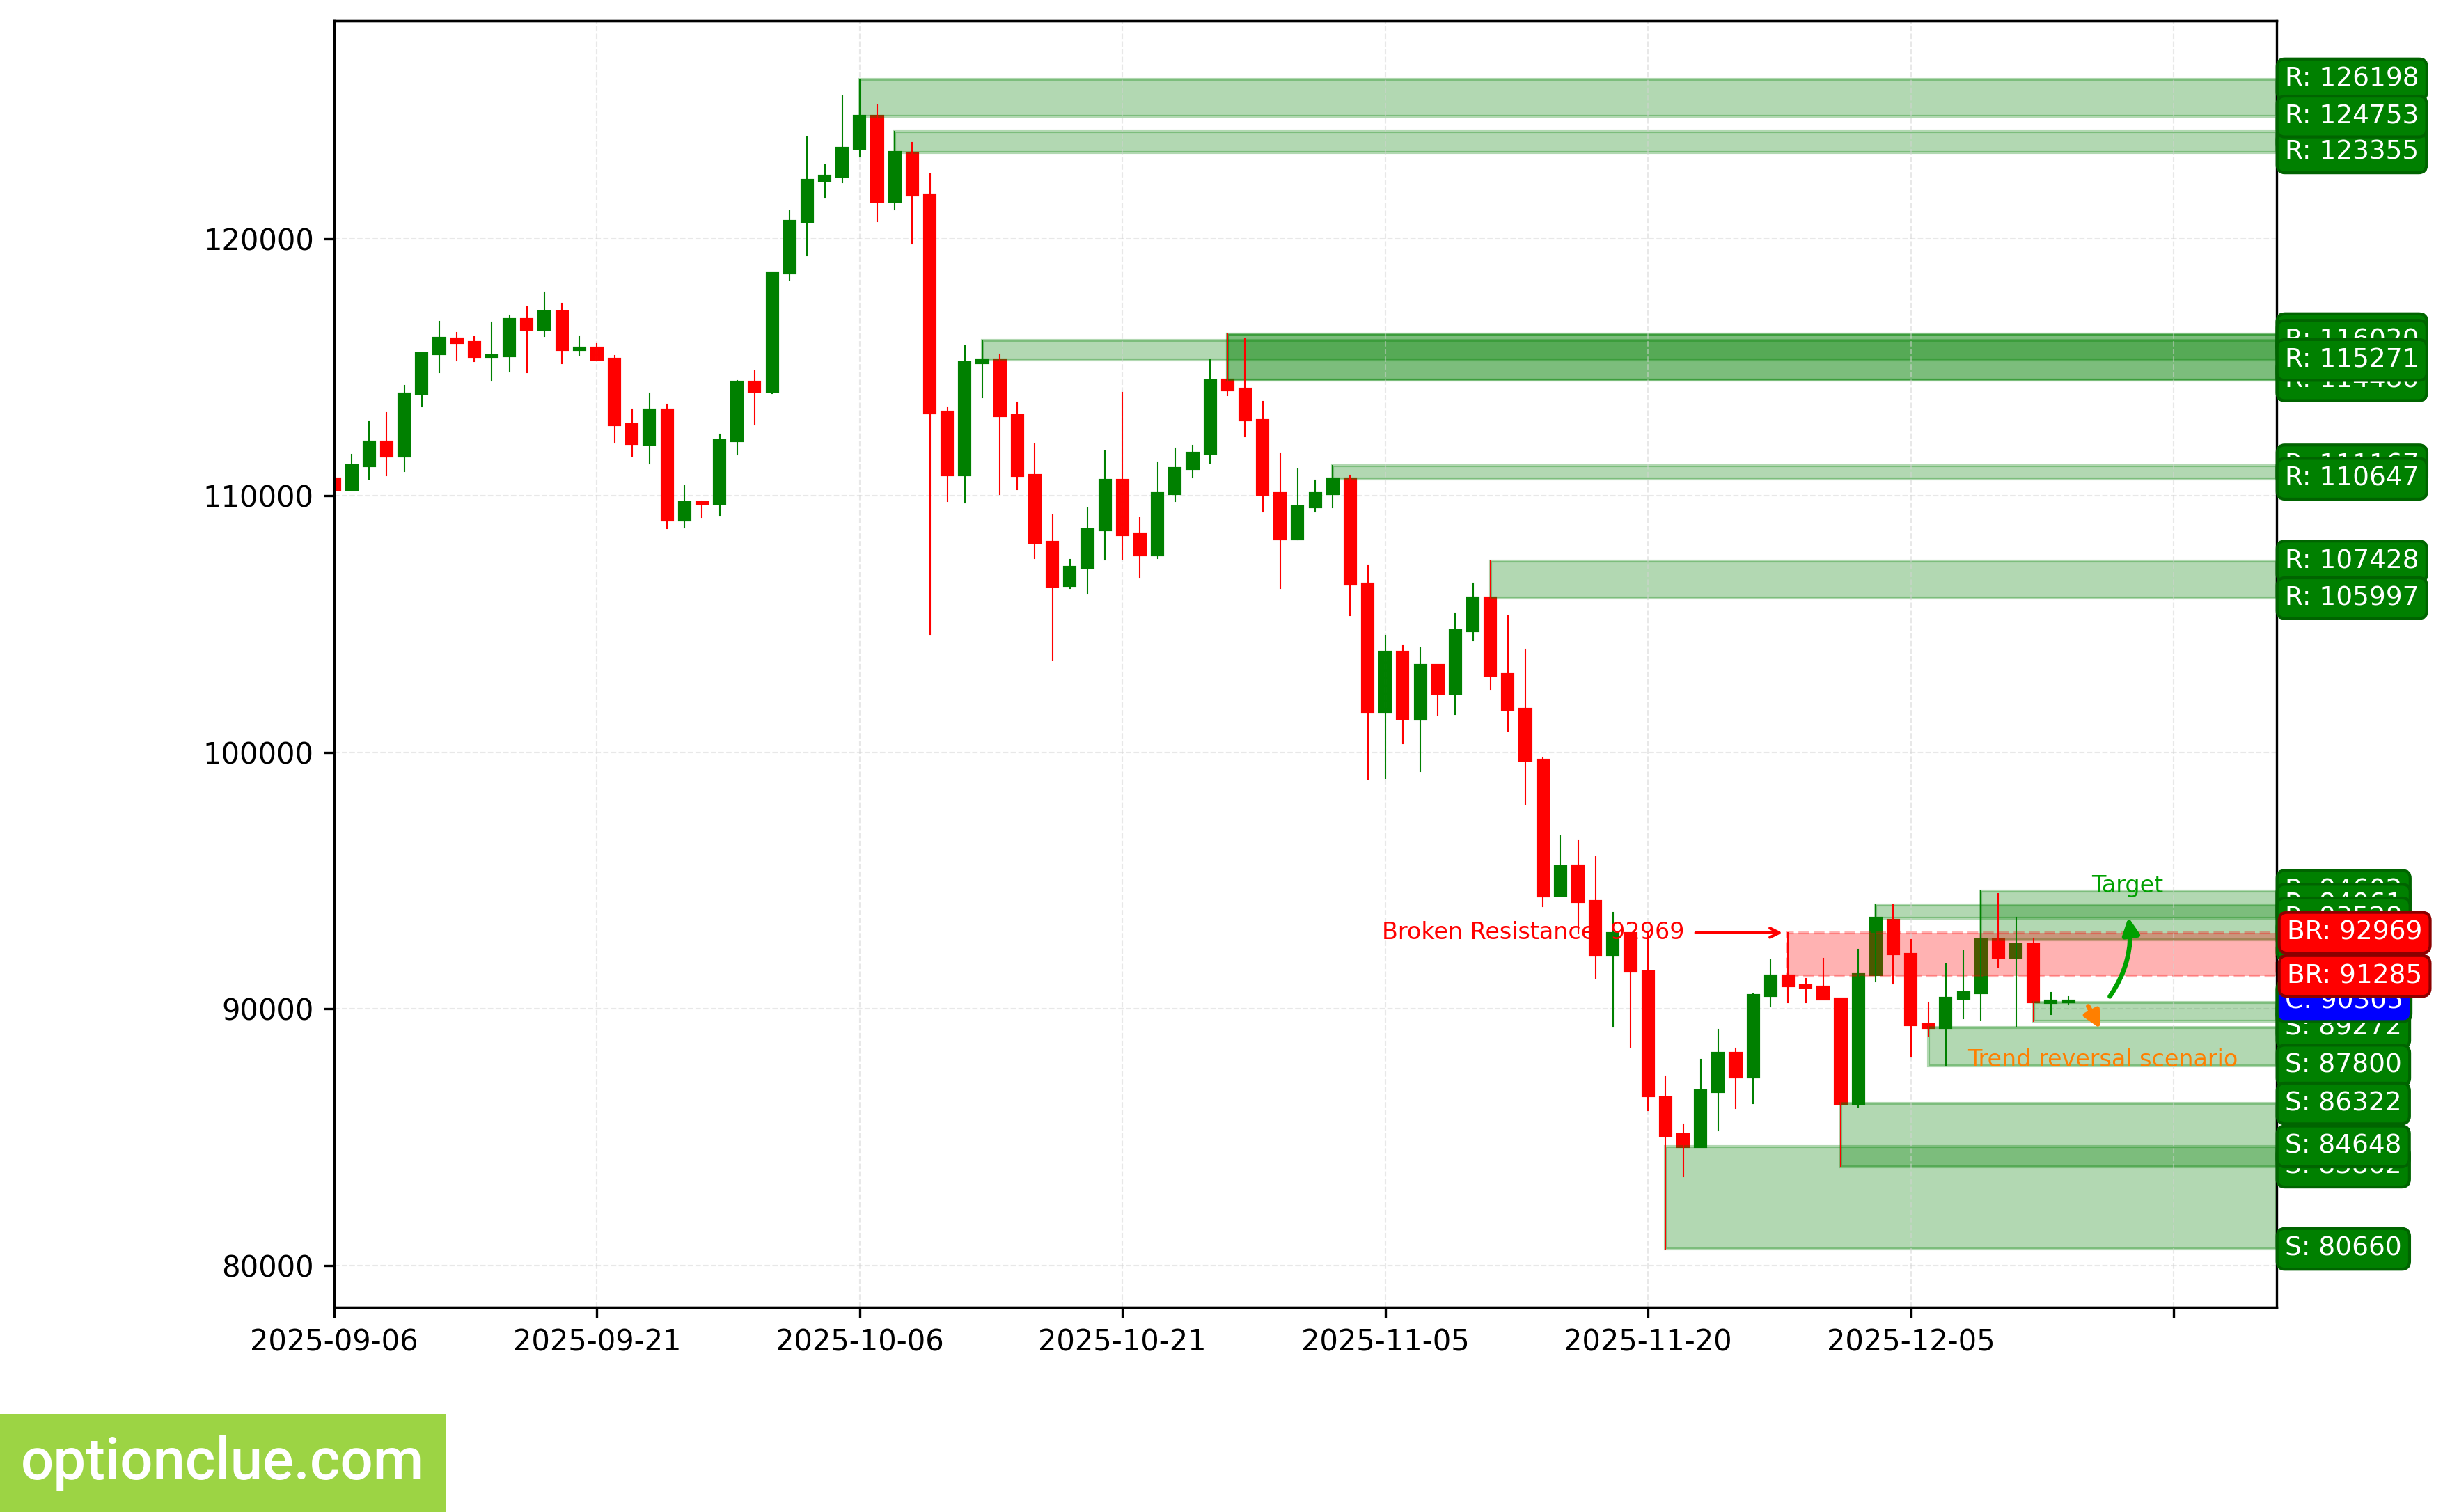
BTC. Technical analysis. D1.
Ether (ETH)
Bullish trend continues, corrective wave is developing. Entry point for buying on rebound may form after completion of the current correction. The last broken level is resistance (3192 — 3239). Breakout occurred 5 candlesticks ago.
Upon resumption of the upward movement, the first target will be the resistance level with boundaries 3325 — 3447. In case of successful trend development, a further target will be at the resistance level with boundaries 3912 — 3915.
If the correction completes near the support level (2931 — 3024), the potential profit/risk ratio could be around 1.5:1. When using the further target — around 4:1.
Long positions will remain relevant as long as the market is above the nearest support level with boundaries 2931 — 3024. If the market successfully settles below this nearest support, the trend will reverse to the opposite (bearish).
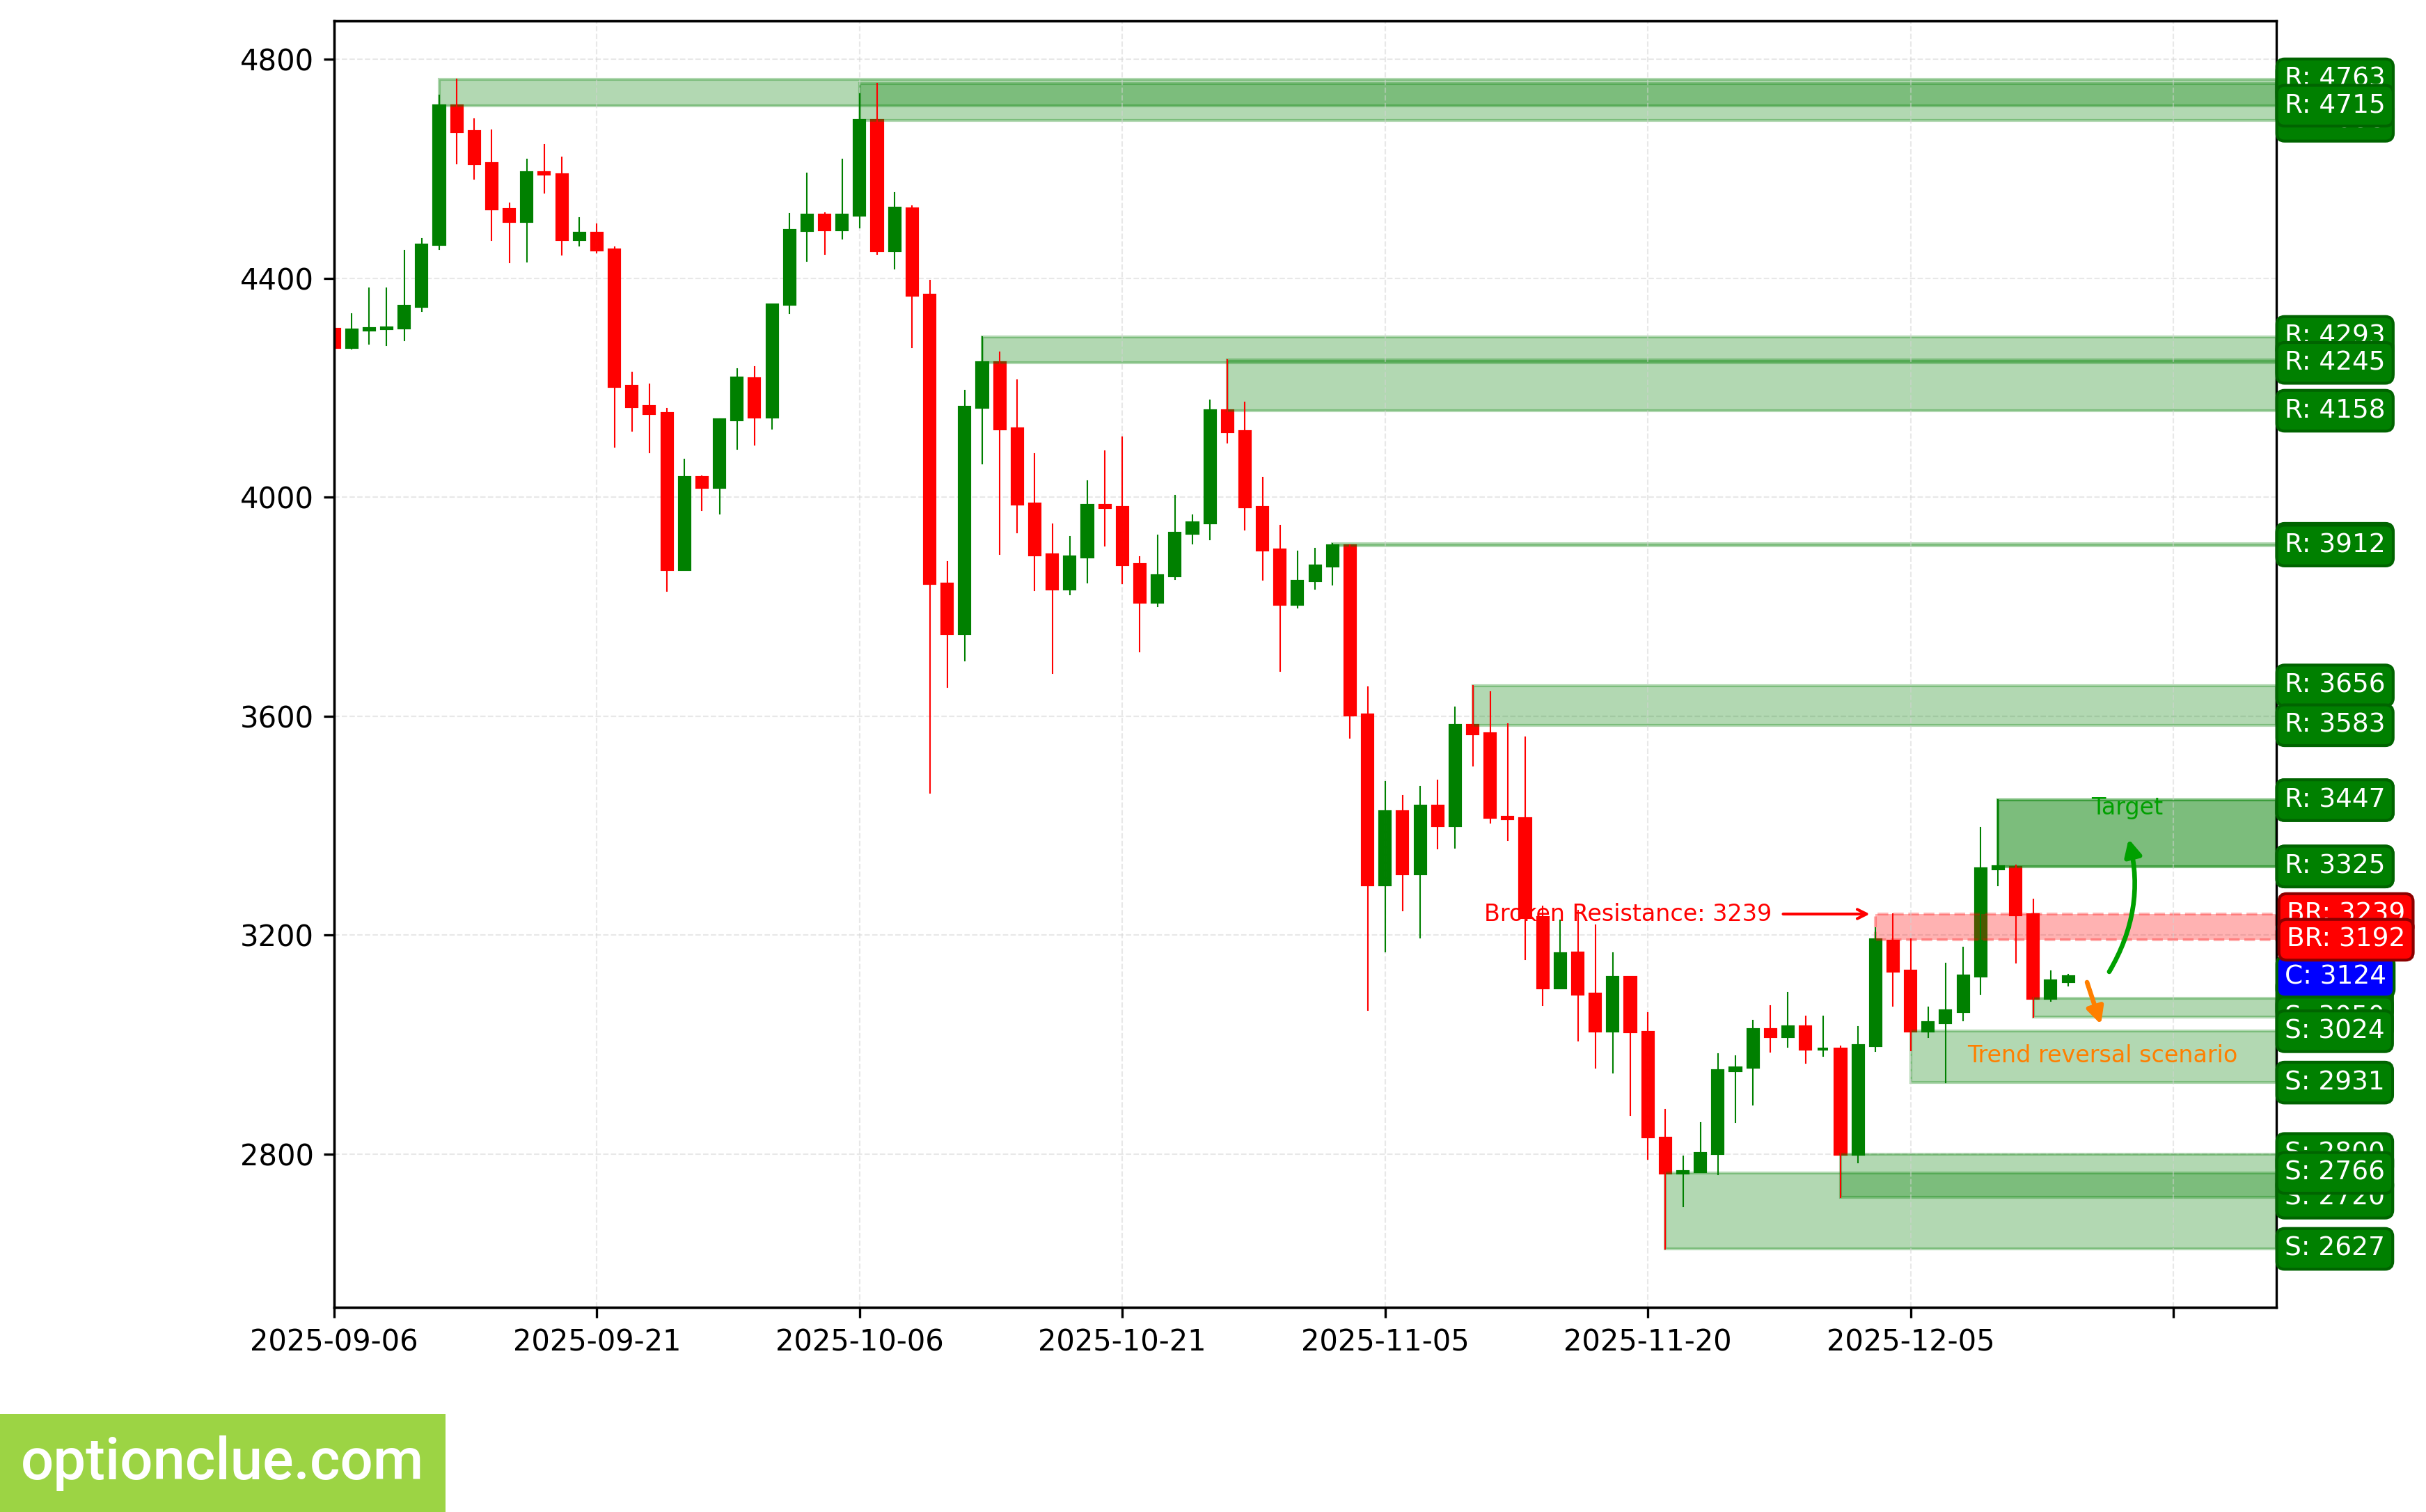
ETH. Technical analysis. D1.
Apple Inc (AAPL)
Bullish trend continues, corrective wave is developing. Entry point for buying on rebound may form after completion of the current correction. The last broken level is resistance (275.25 — 276.70). Breakout occurred 13 candlesticks ago.
Upon resumption of the upward movement, the first target will be the resistance level with boundaries 286.20 — 288.62.
If the correction completes near the support level (265.32 — 265.53), the potential profit/risk ratio could be around 4:1. If the correction completes near the last broken level (275.25 — 276.70), the potential profit/risk ratio could be insignificant (around 0.7:1).
Long positions will remain relevant as long as the market is above the nearest support level with boundaries 265.32 — 265.53. If the market successfully settles below this nearest support, the trend will reverse to the opposite (bearish).
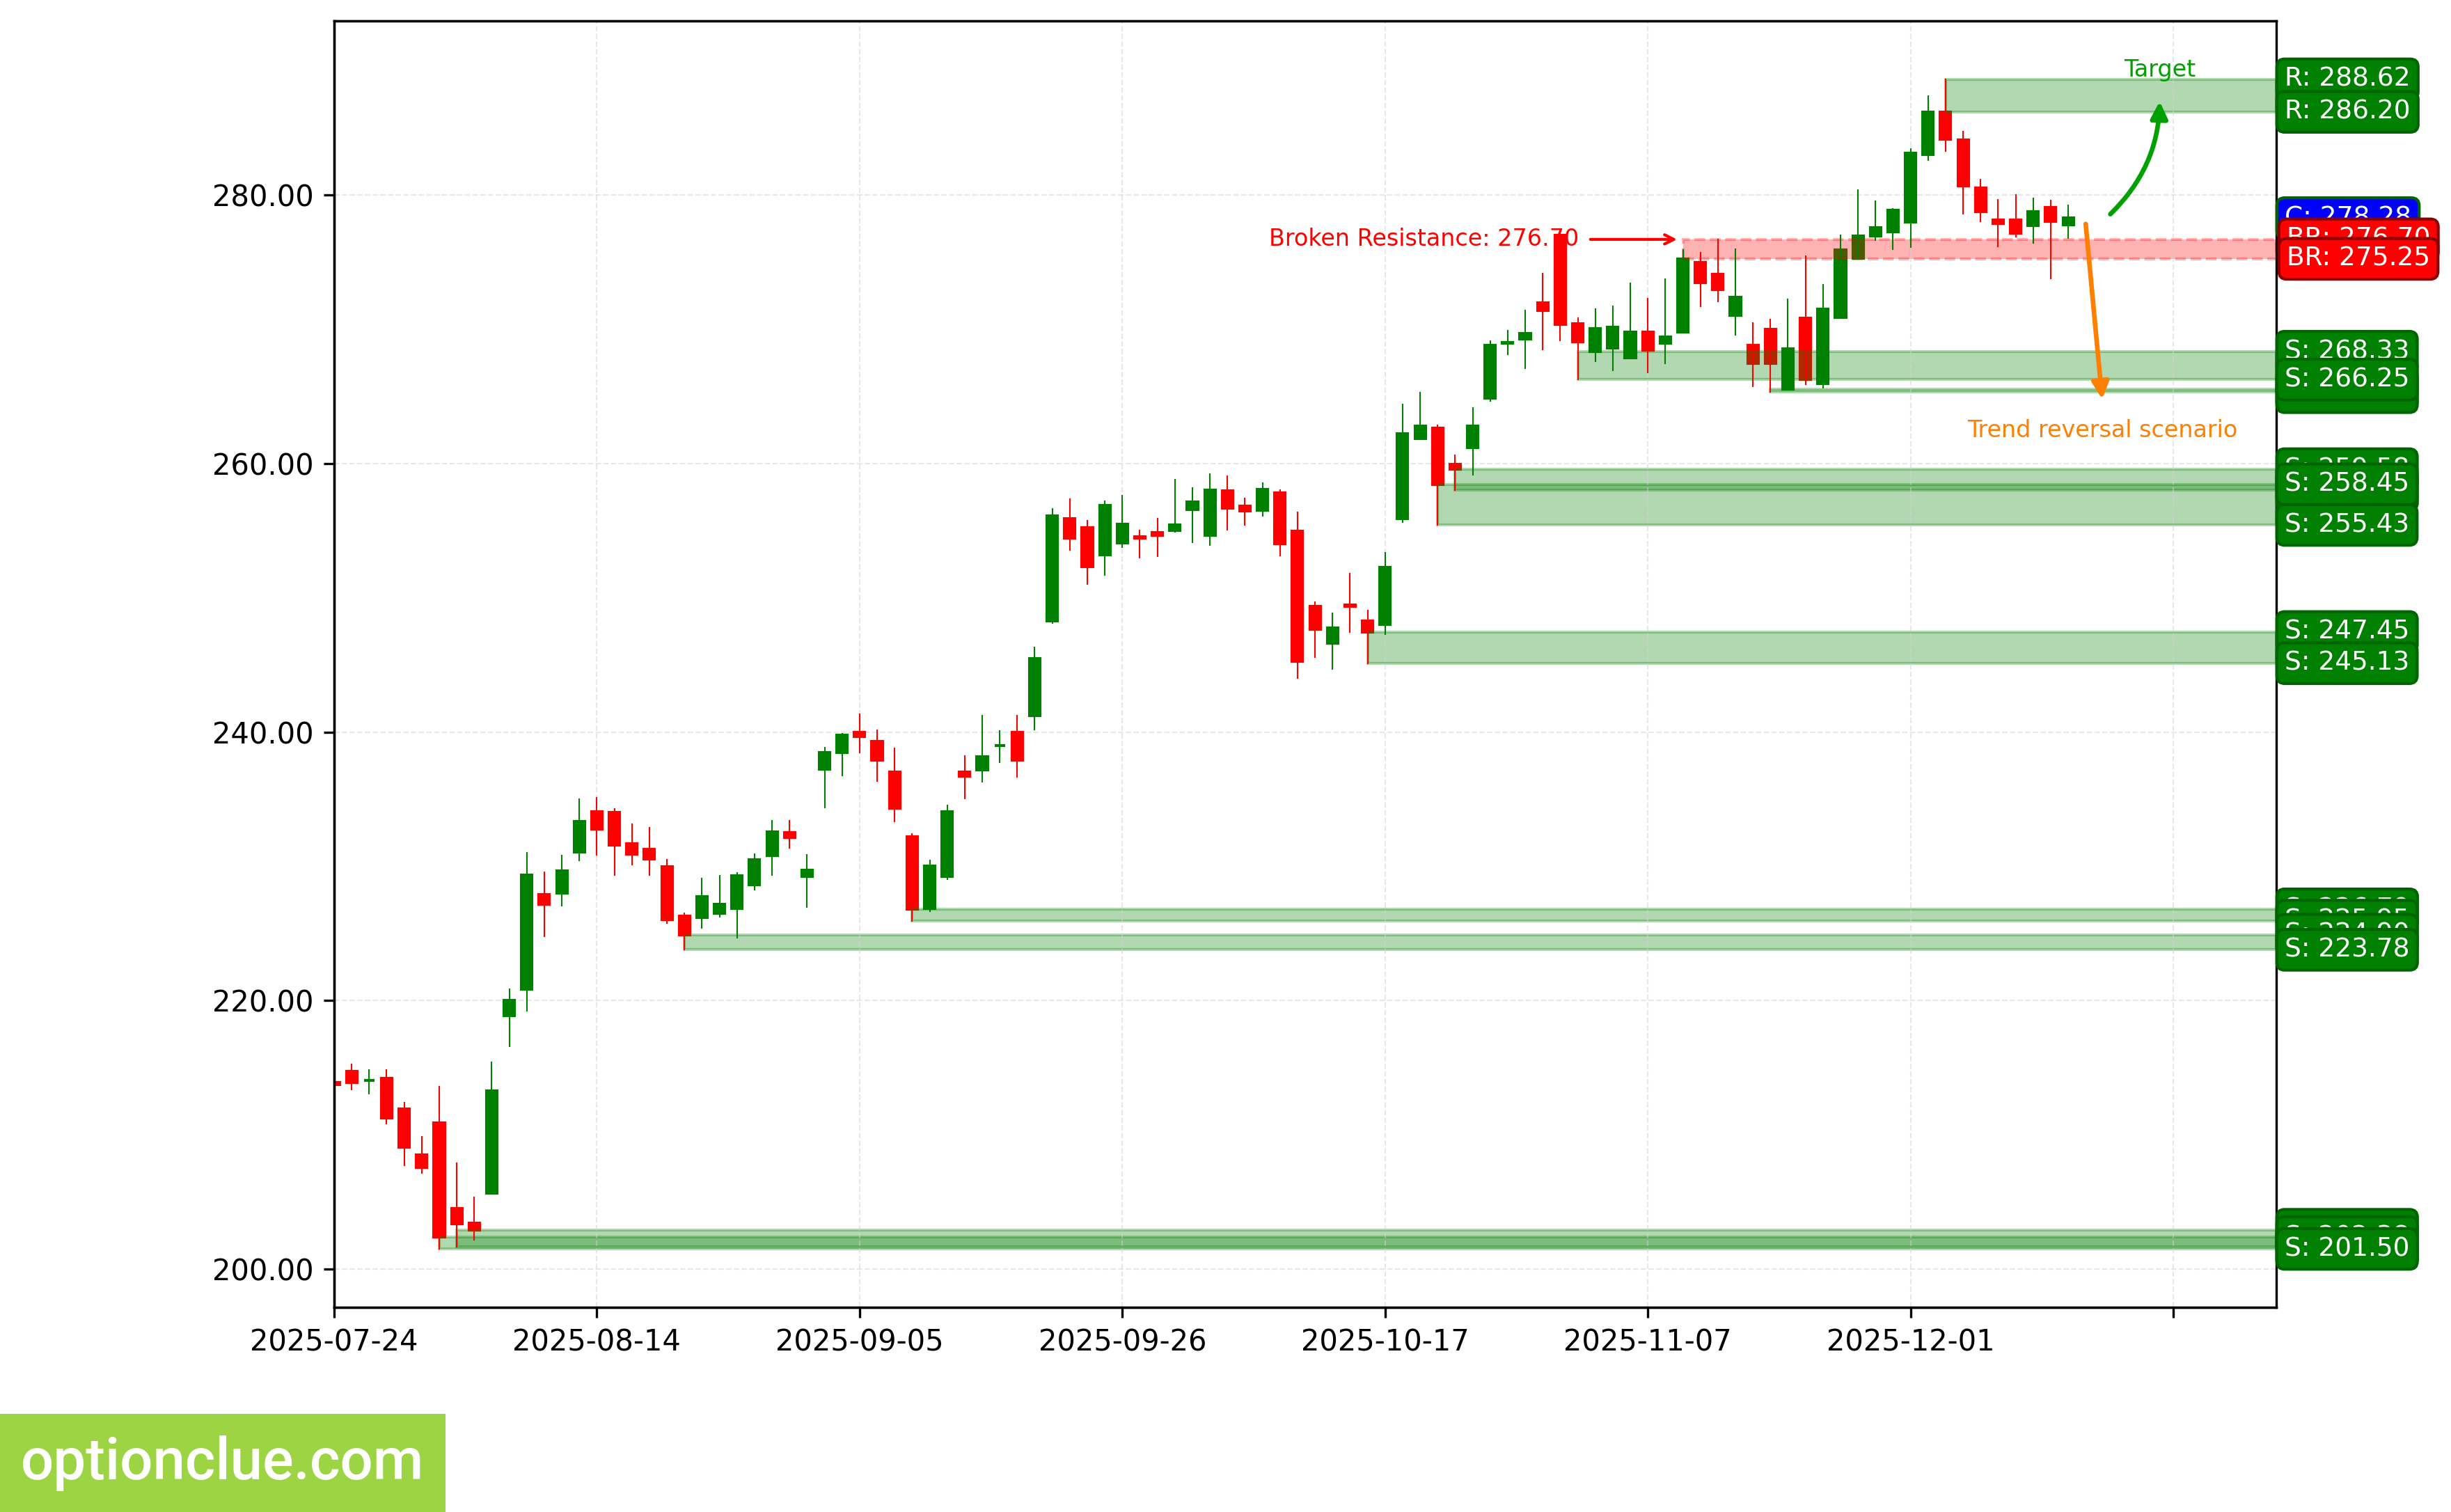
AAPL. Technical analysis. D1.
NVIDIA Corp (NVDA)
Bearish trend continues, impulse wave is developing. The last broken level is support (179.65 — 181.36). Breakout occurred 15 candlesticks ago.
Intermediate target for the downward movement is the support level with boundaries 173.13 — 174.48. In case of successful trend development, a further target will be at the support level with boundaries 164.07 — 167.02.
If the next correction completes near the resistance level (185.56 — 188.00), the potential profit/risk ratio could be approximately 1.7:1. When using the further target — around 2.8:1. If the correction completes near the last broken level (179.65 — 181.36), the potential profit/risk ratio could be small (approximately 0.4:1). When selecting the further target — around 1:1.
Short positions will remain relevant as long as the market remains below the nearest resistance level with boundaries 185.56 — 188.00. If the market successfully settles above this nearest resistance, the trend will reverse to the opposite (bullish).
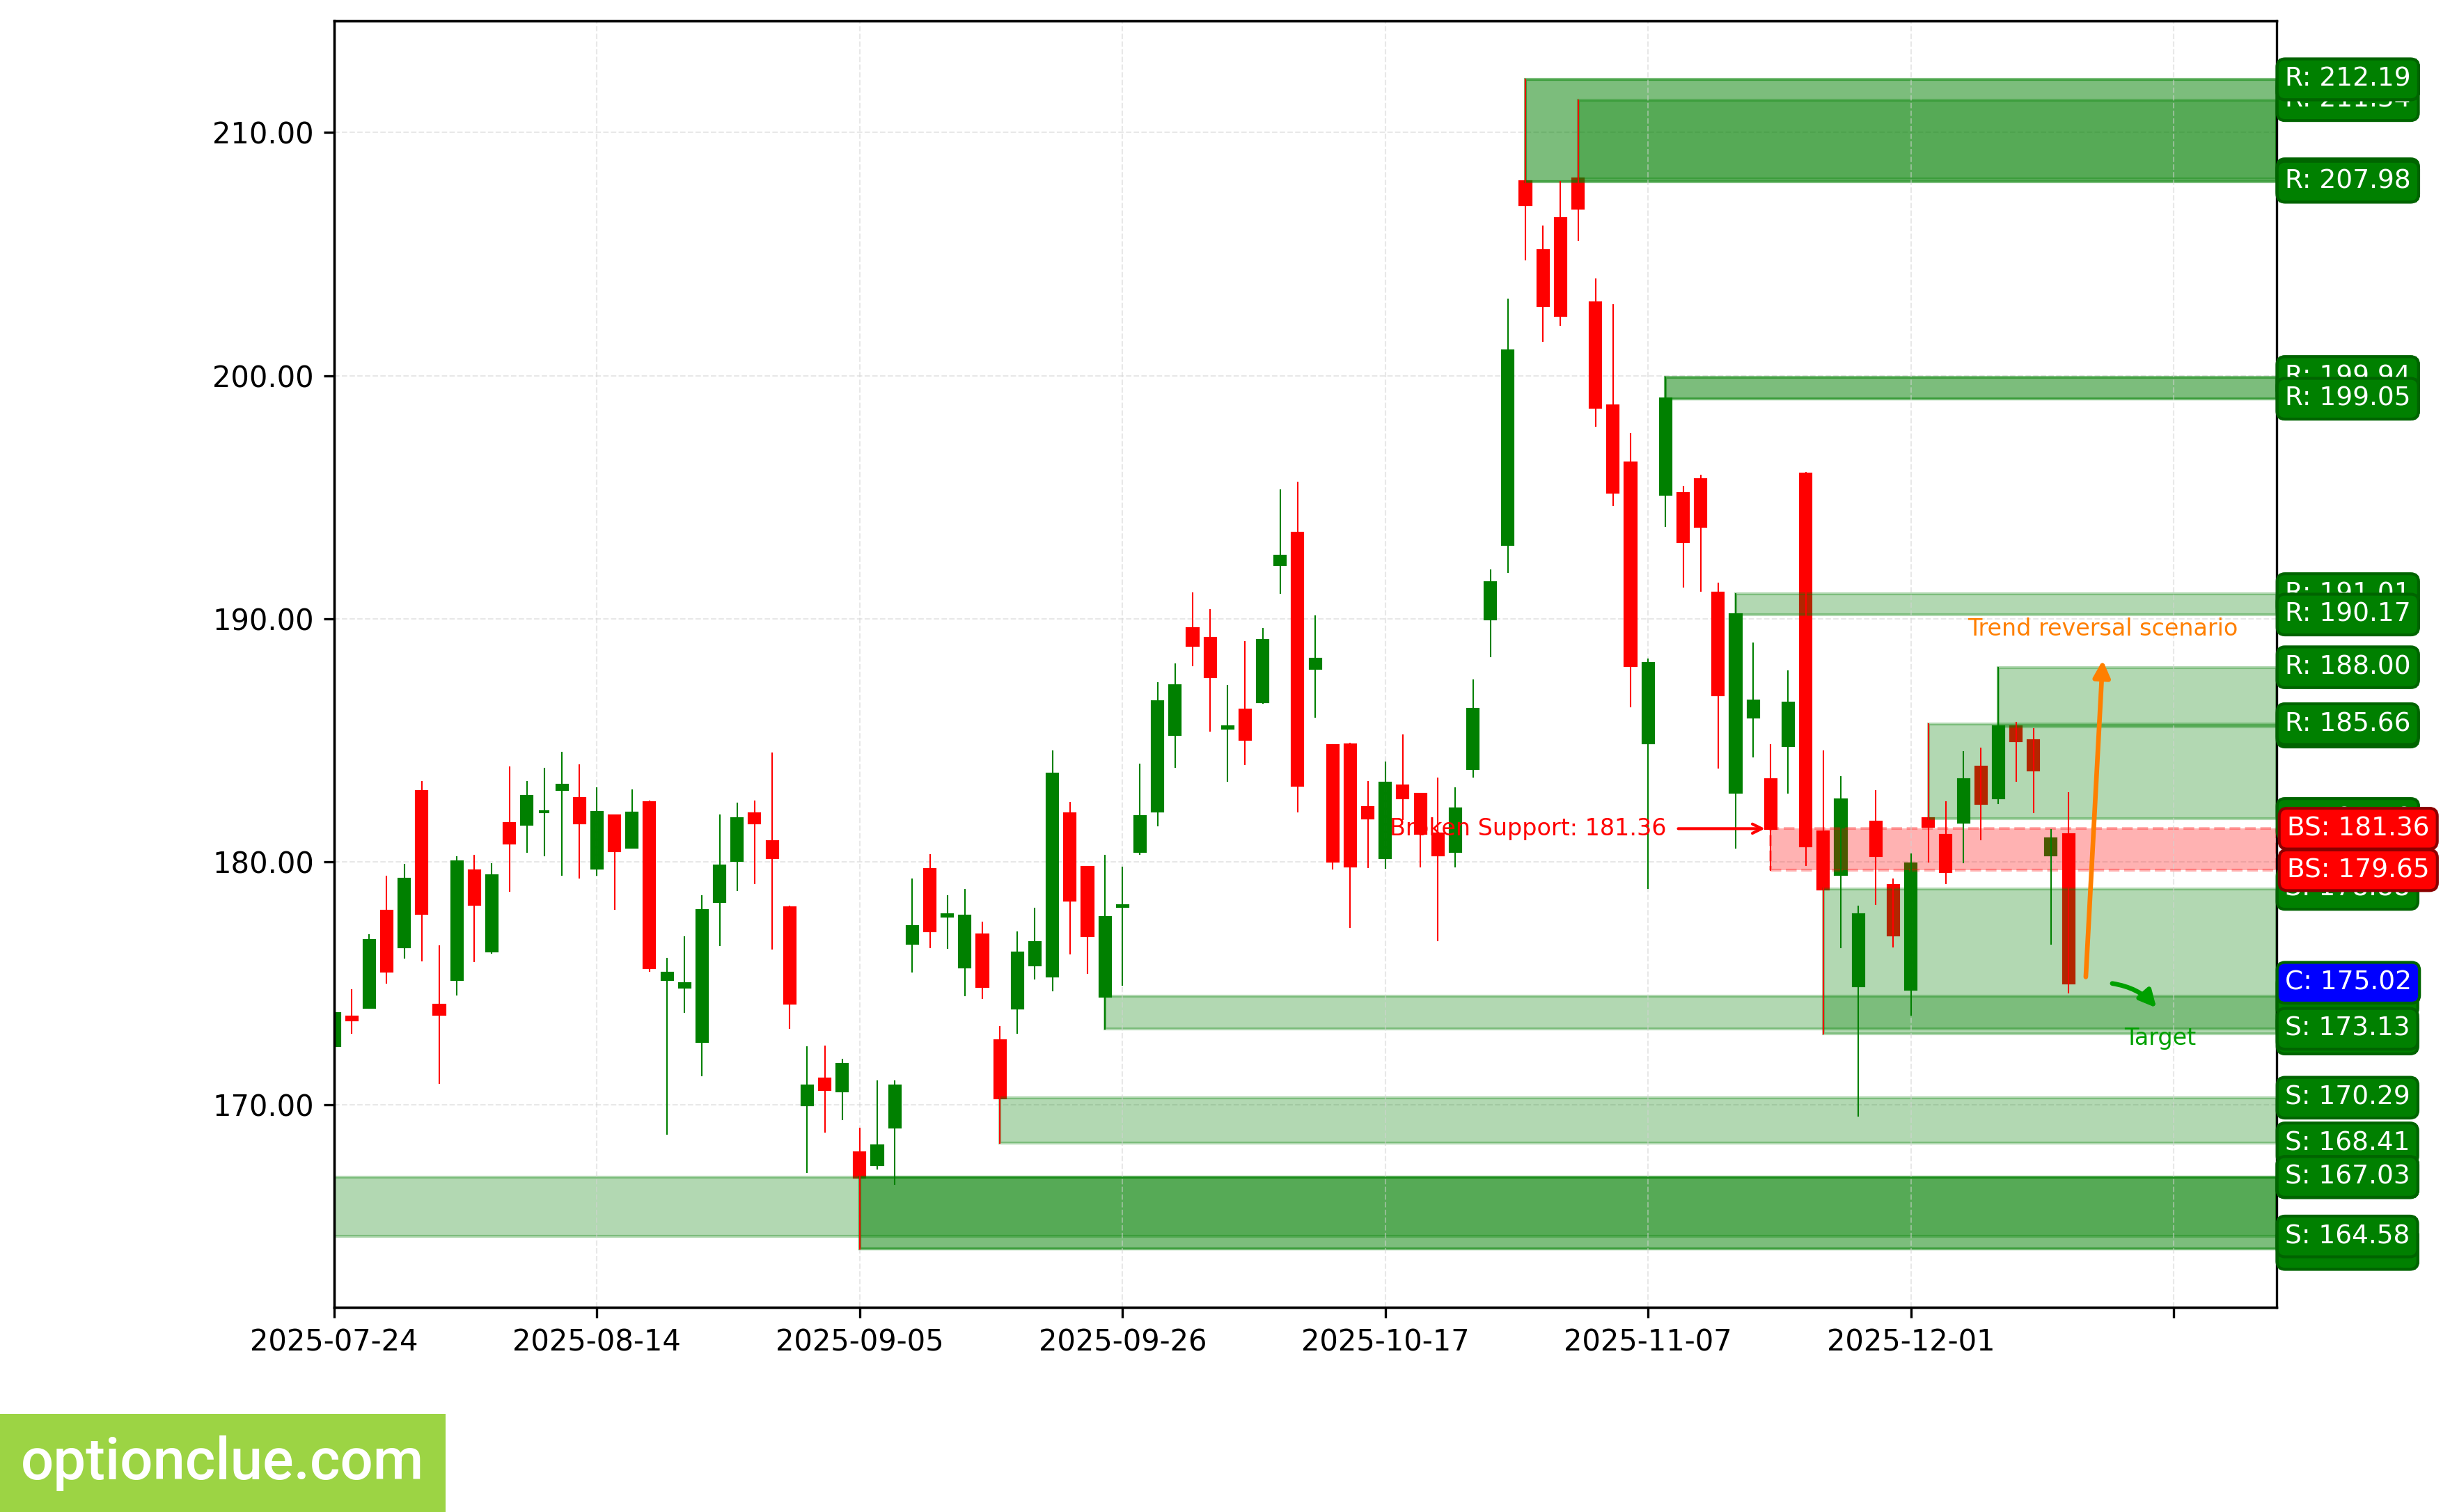
NVDA. Technical analysis. D1.
Tesla Inc (TSLA)
Bullish trend continues, impulse wave is developing. The last broken level is resistance (442.15 — 442.49). Breakout occurred 8 candlesticks ago.
Intermediate target for the upward movement is the resistance level with boundaries 462.07 — 467.45.
If the correction completes near the support level (435.25 — 437.54), the potential profit/risk ratio could be approximately 1.6:1. If the correction completes near the last broken level (442.15 — 442.49), the potential profit/risk ratio could be insignificant (around 0.9:1).
Long positions will remain relevant as long as the market is above the nearest support level with boundaries 435.25 — 437.54. If the market successfully settles below this nearest support, the trend will reverse to the opposite (bearish).
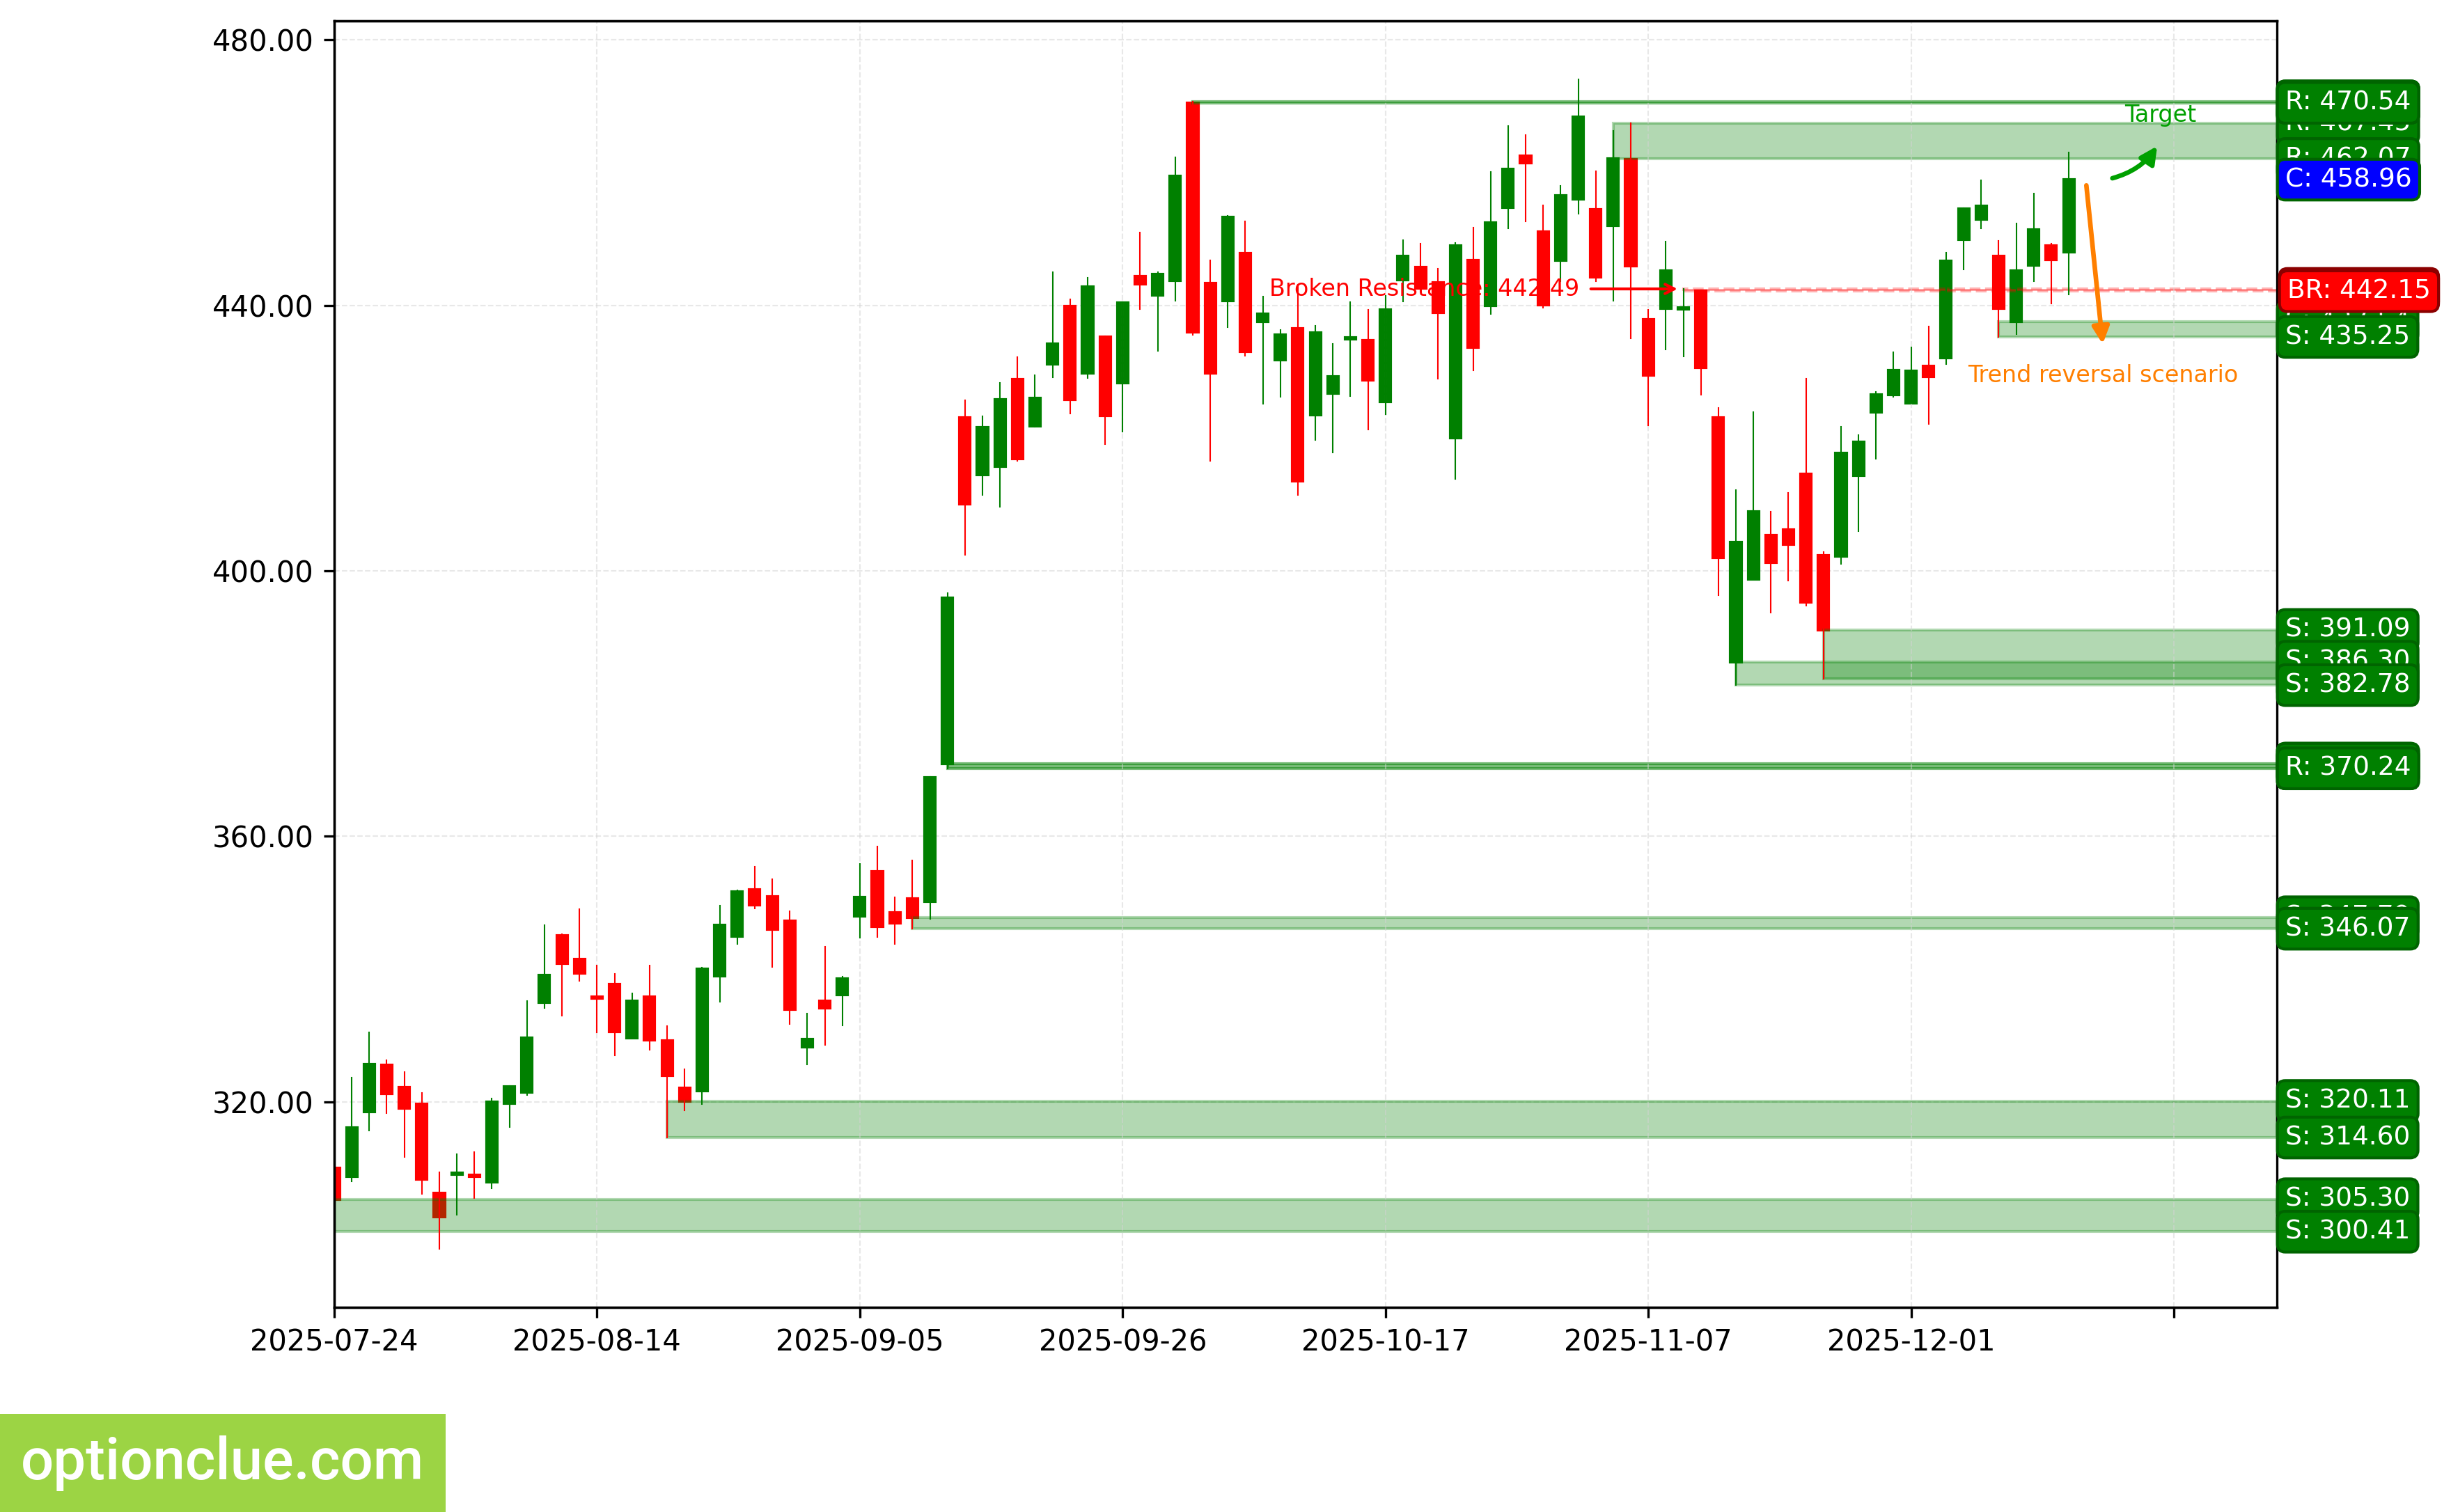
TSLA. Technical analysis. D1.
Summary
From the perspective of medium-term trading, financial instruments with correction close to completion on Daily and/or potentially the most promising profit-to-risk ratios include: BTC, ETH, USDJPY.
The remaining instruments on the trading list may also be of interest, but on these markets, Daily rebound signals are likely to appear no earlier than in a week.