
Analyzing the current market situation using technical analysis, focusing on key horizontal levels and the most liquid financial instruments.
Key Topics
- Euro (EURUSD)
- British Pound (GBPUSD)
- Swiss Franc (USDCHF)
- Japanese Yen (USDJPY)
- Canadian Dollar (USDCAD)
- Australian Dollar (AUDUSD)
- New Zealand Dollar (NZDUSD)
- Bitcoin (BTC)
- Ether (ETH)
- Apple Inc (AAPL)
- NVIDIA Corp (NVDA)
- Tesla Inc (TSLA)
- Summary
Euro (EURUSD)
The market remains in a bullish trend. Two days ago, a correction ended and a buy entry point on a rebound formed; an impulse wave is developing.
The intermediate target for the upward movement is the resistance level with boundaries at 1.1762 – 1.1779. If the market successfully holds above it, this will open the way for the price to move toward the more distant resistance level with boundaries at 1.1805 – 1.1829.
Long positions will remain relevant as long as the market stays above the nearest support level with boundaries at 1.1606 – 1.1638.
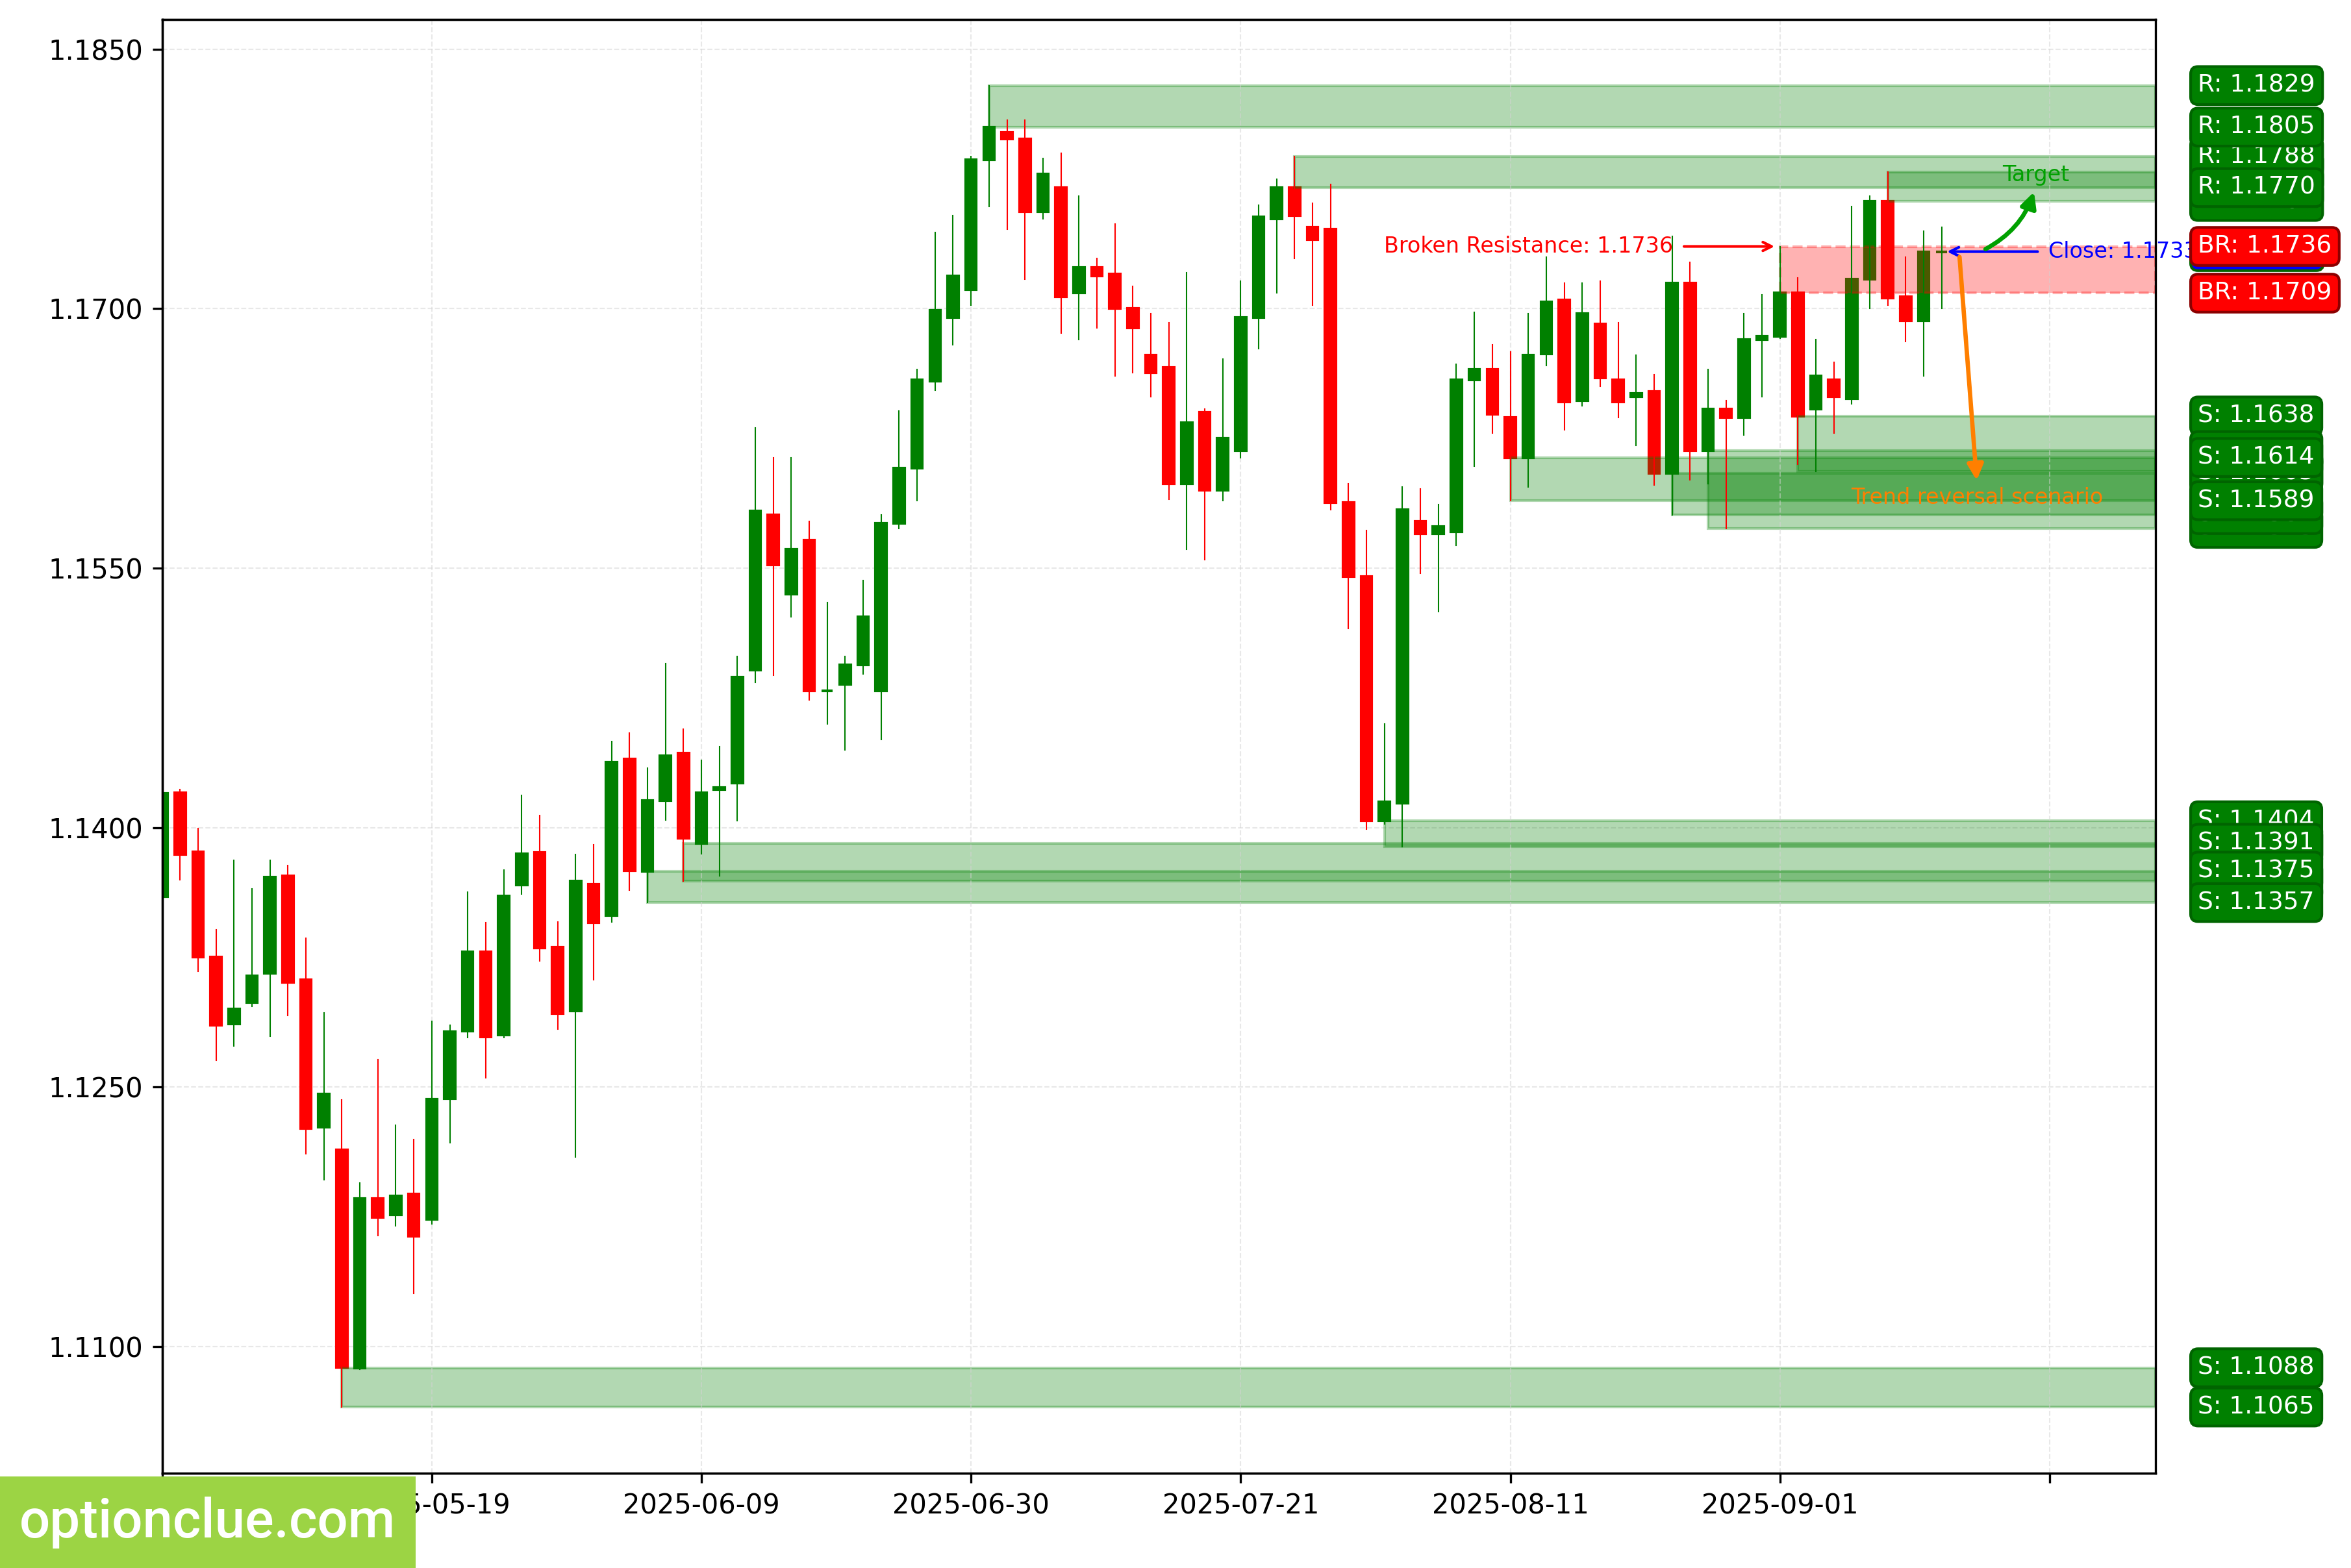
EURUSD. Technical analysis. D1.
British Pound (GBPUSD)
The trend has changed to bullish. The last level broken was resistance (1.3543 – 1.3549).
The breakout occurred two days ago, and a corrective wave is developing. A buy entry point on a rebound will appear after the correction ends.
When the upward movement resumes, the first target will be the resistance with boundaries at 1.3575 – 1.3594. If the trend develops successfully, a more distant target will be at the resistance level with boundaries at 1.3656 – 1.3681.
If the correction ends near the last broken level (1.3543 – 1.3549), the potential reward/risk ratio will be around 0.4. If the market corrects deeper—to the support level—the potential reward/risk ratio will be around 1.5.
Long positions will remain relevant as long as the market stays above the nearest support level with boundaries at 1.3491 – 1.3524.
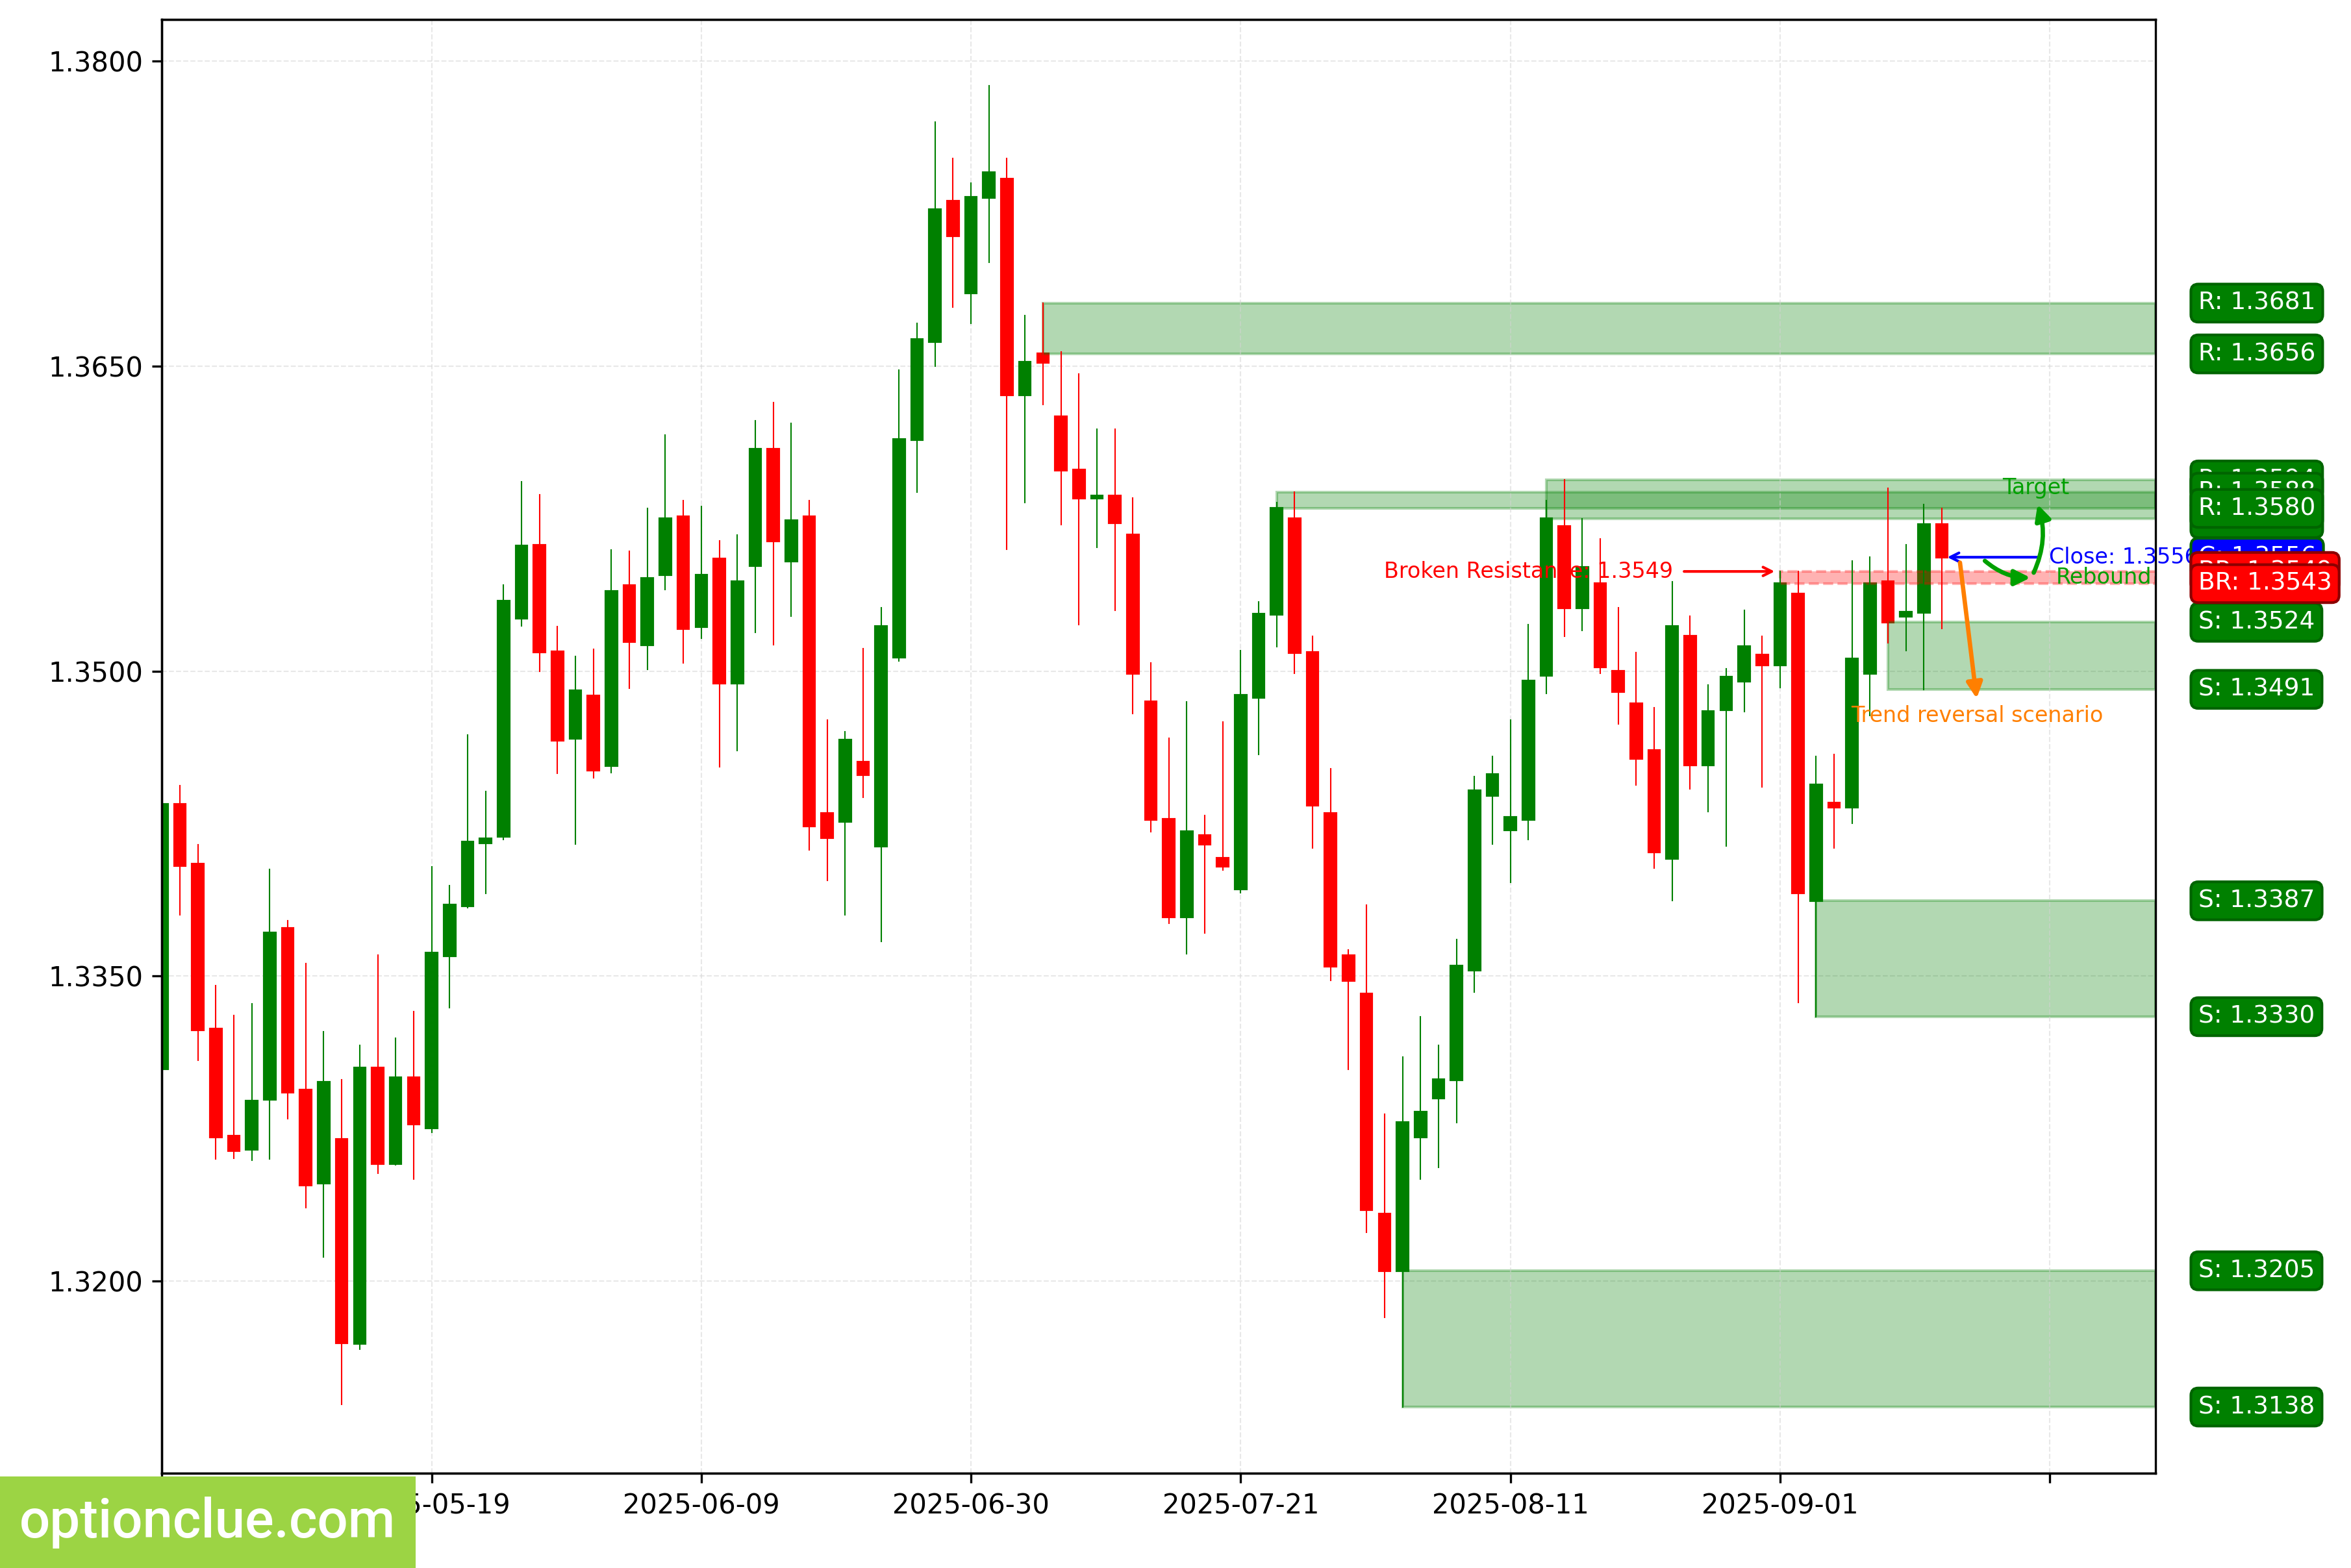
GBPUSD. Technical analysis. D1.
Swiss Franc (USDCHF)
The bearish trend continues; two days ago, a correction ended and a sell entry point on a rebound formed. An impulse wave is developing.
The nearest target for the downward movement is the support level with boundaries at 0.7912 – 0.7929. If the market successfully holds below this support, it will open the way for the price to move toward target #2—the support level with boundaries at 0.7869 – 0.7910.
Short positions will remain relevant as long as the market stays below the nearest resistance level with boundaries at 0.8053 – 0.8072.
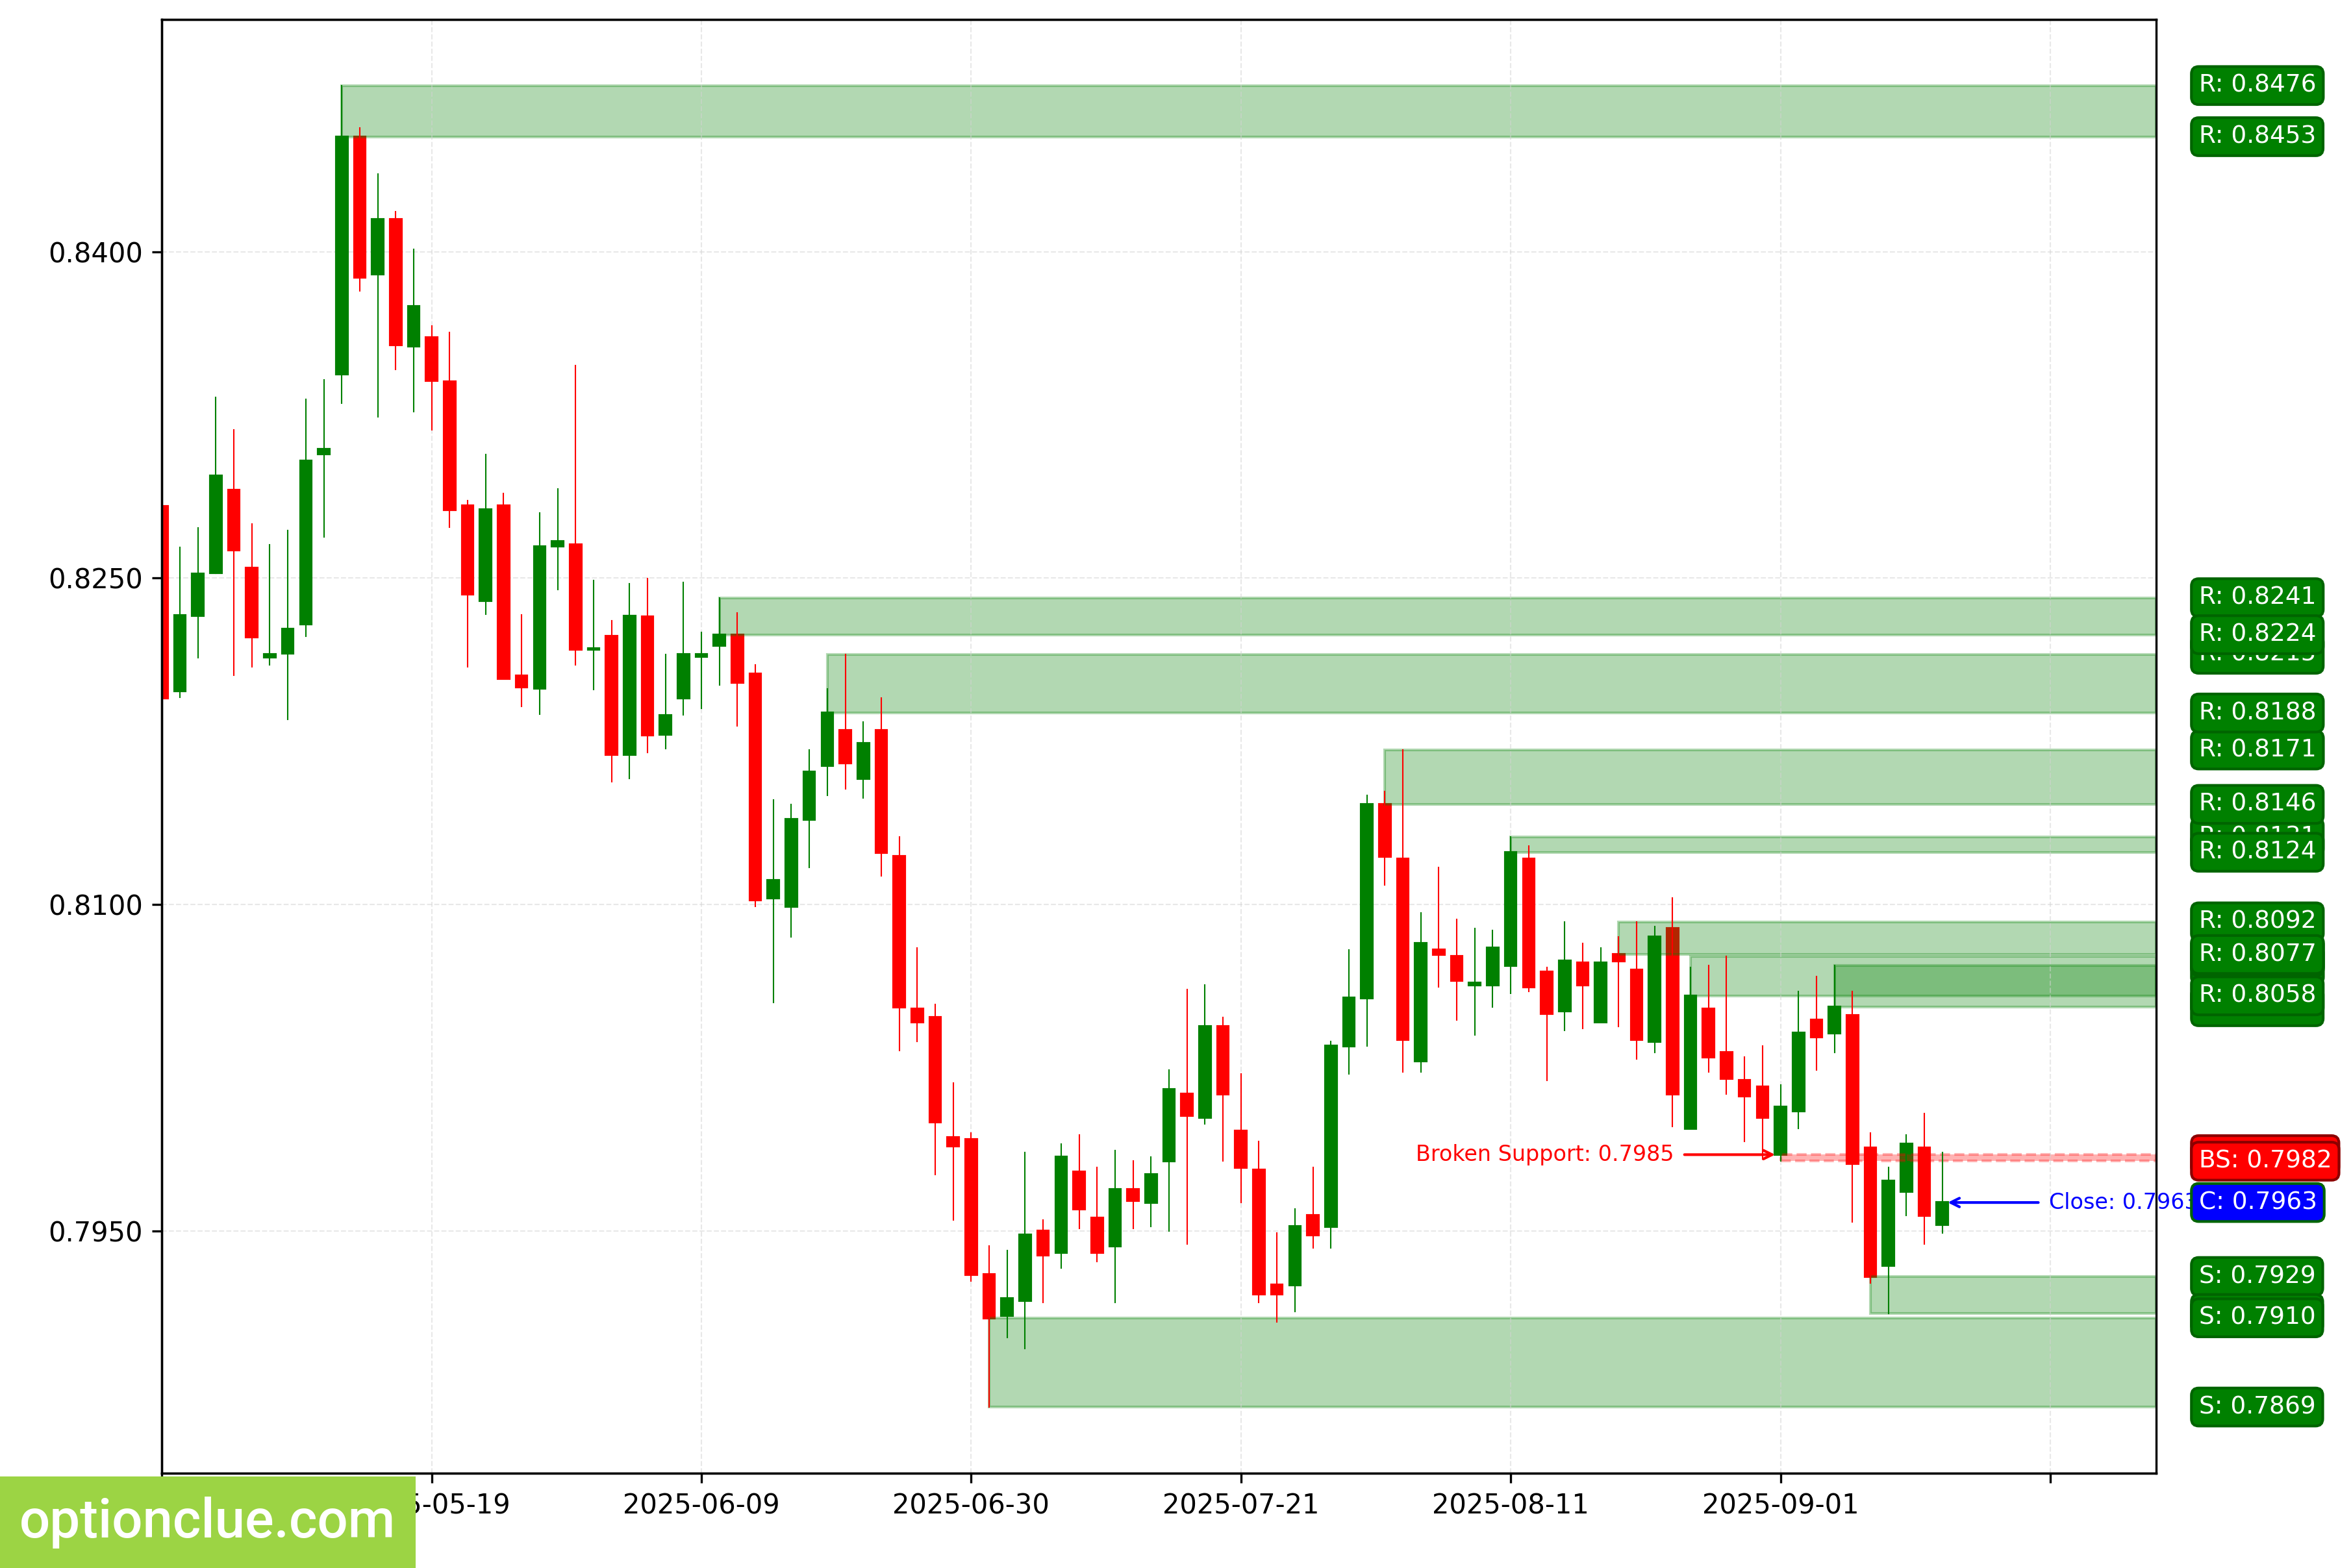
USDCHF. Technical analysis. D1.
Japanese Yen (USDJPY)
On the daily timeframe, the market is in a bullish trend; a correction has ended, a buy entry point on a rebound has formed, and an impulse wave is developing. The intermediate target for the upward movement is the resistance level with boundaries at 148.04 – 148.57.
If the market successfully holds above this resistance, it will open the way for the price to move toward target #2—the resistance level with boundaries at 148.48 – 149.13. Long positions will remain relevant as long as the market stays above the nearest daily timeframe support level with boundaries at 146.29 – 147.20.
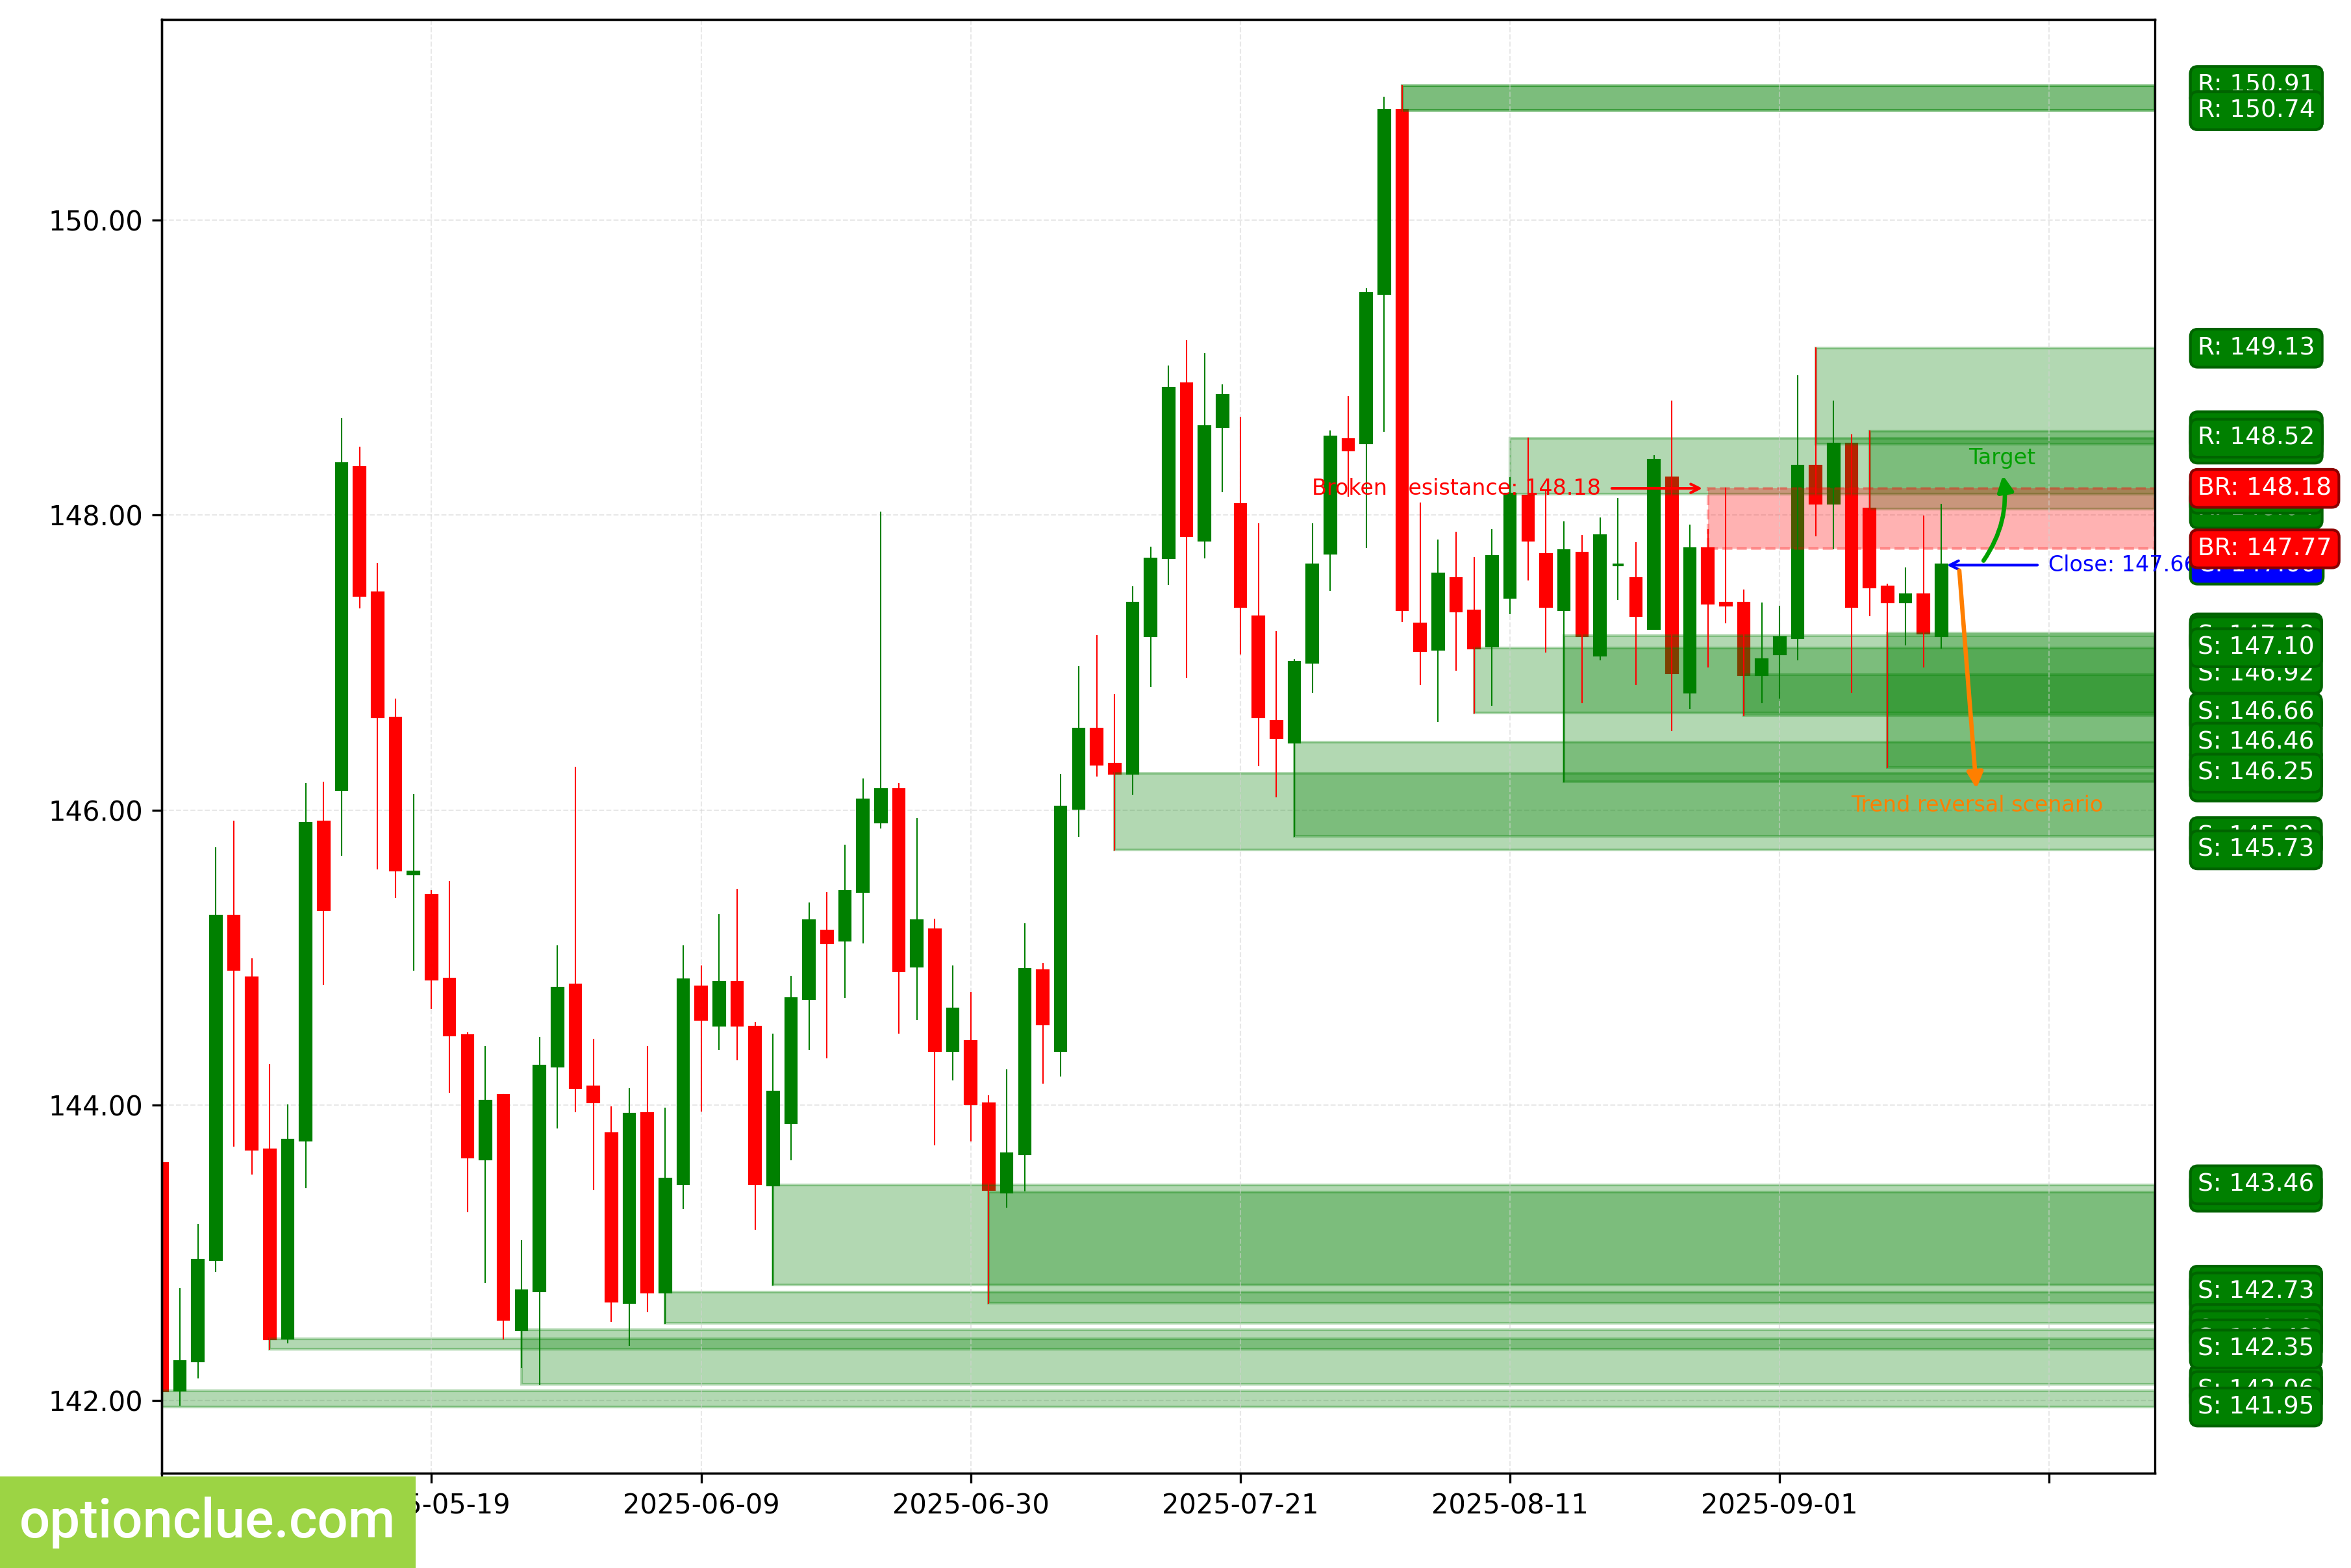
USDJPY. Technical analysis. D1.
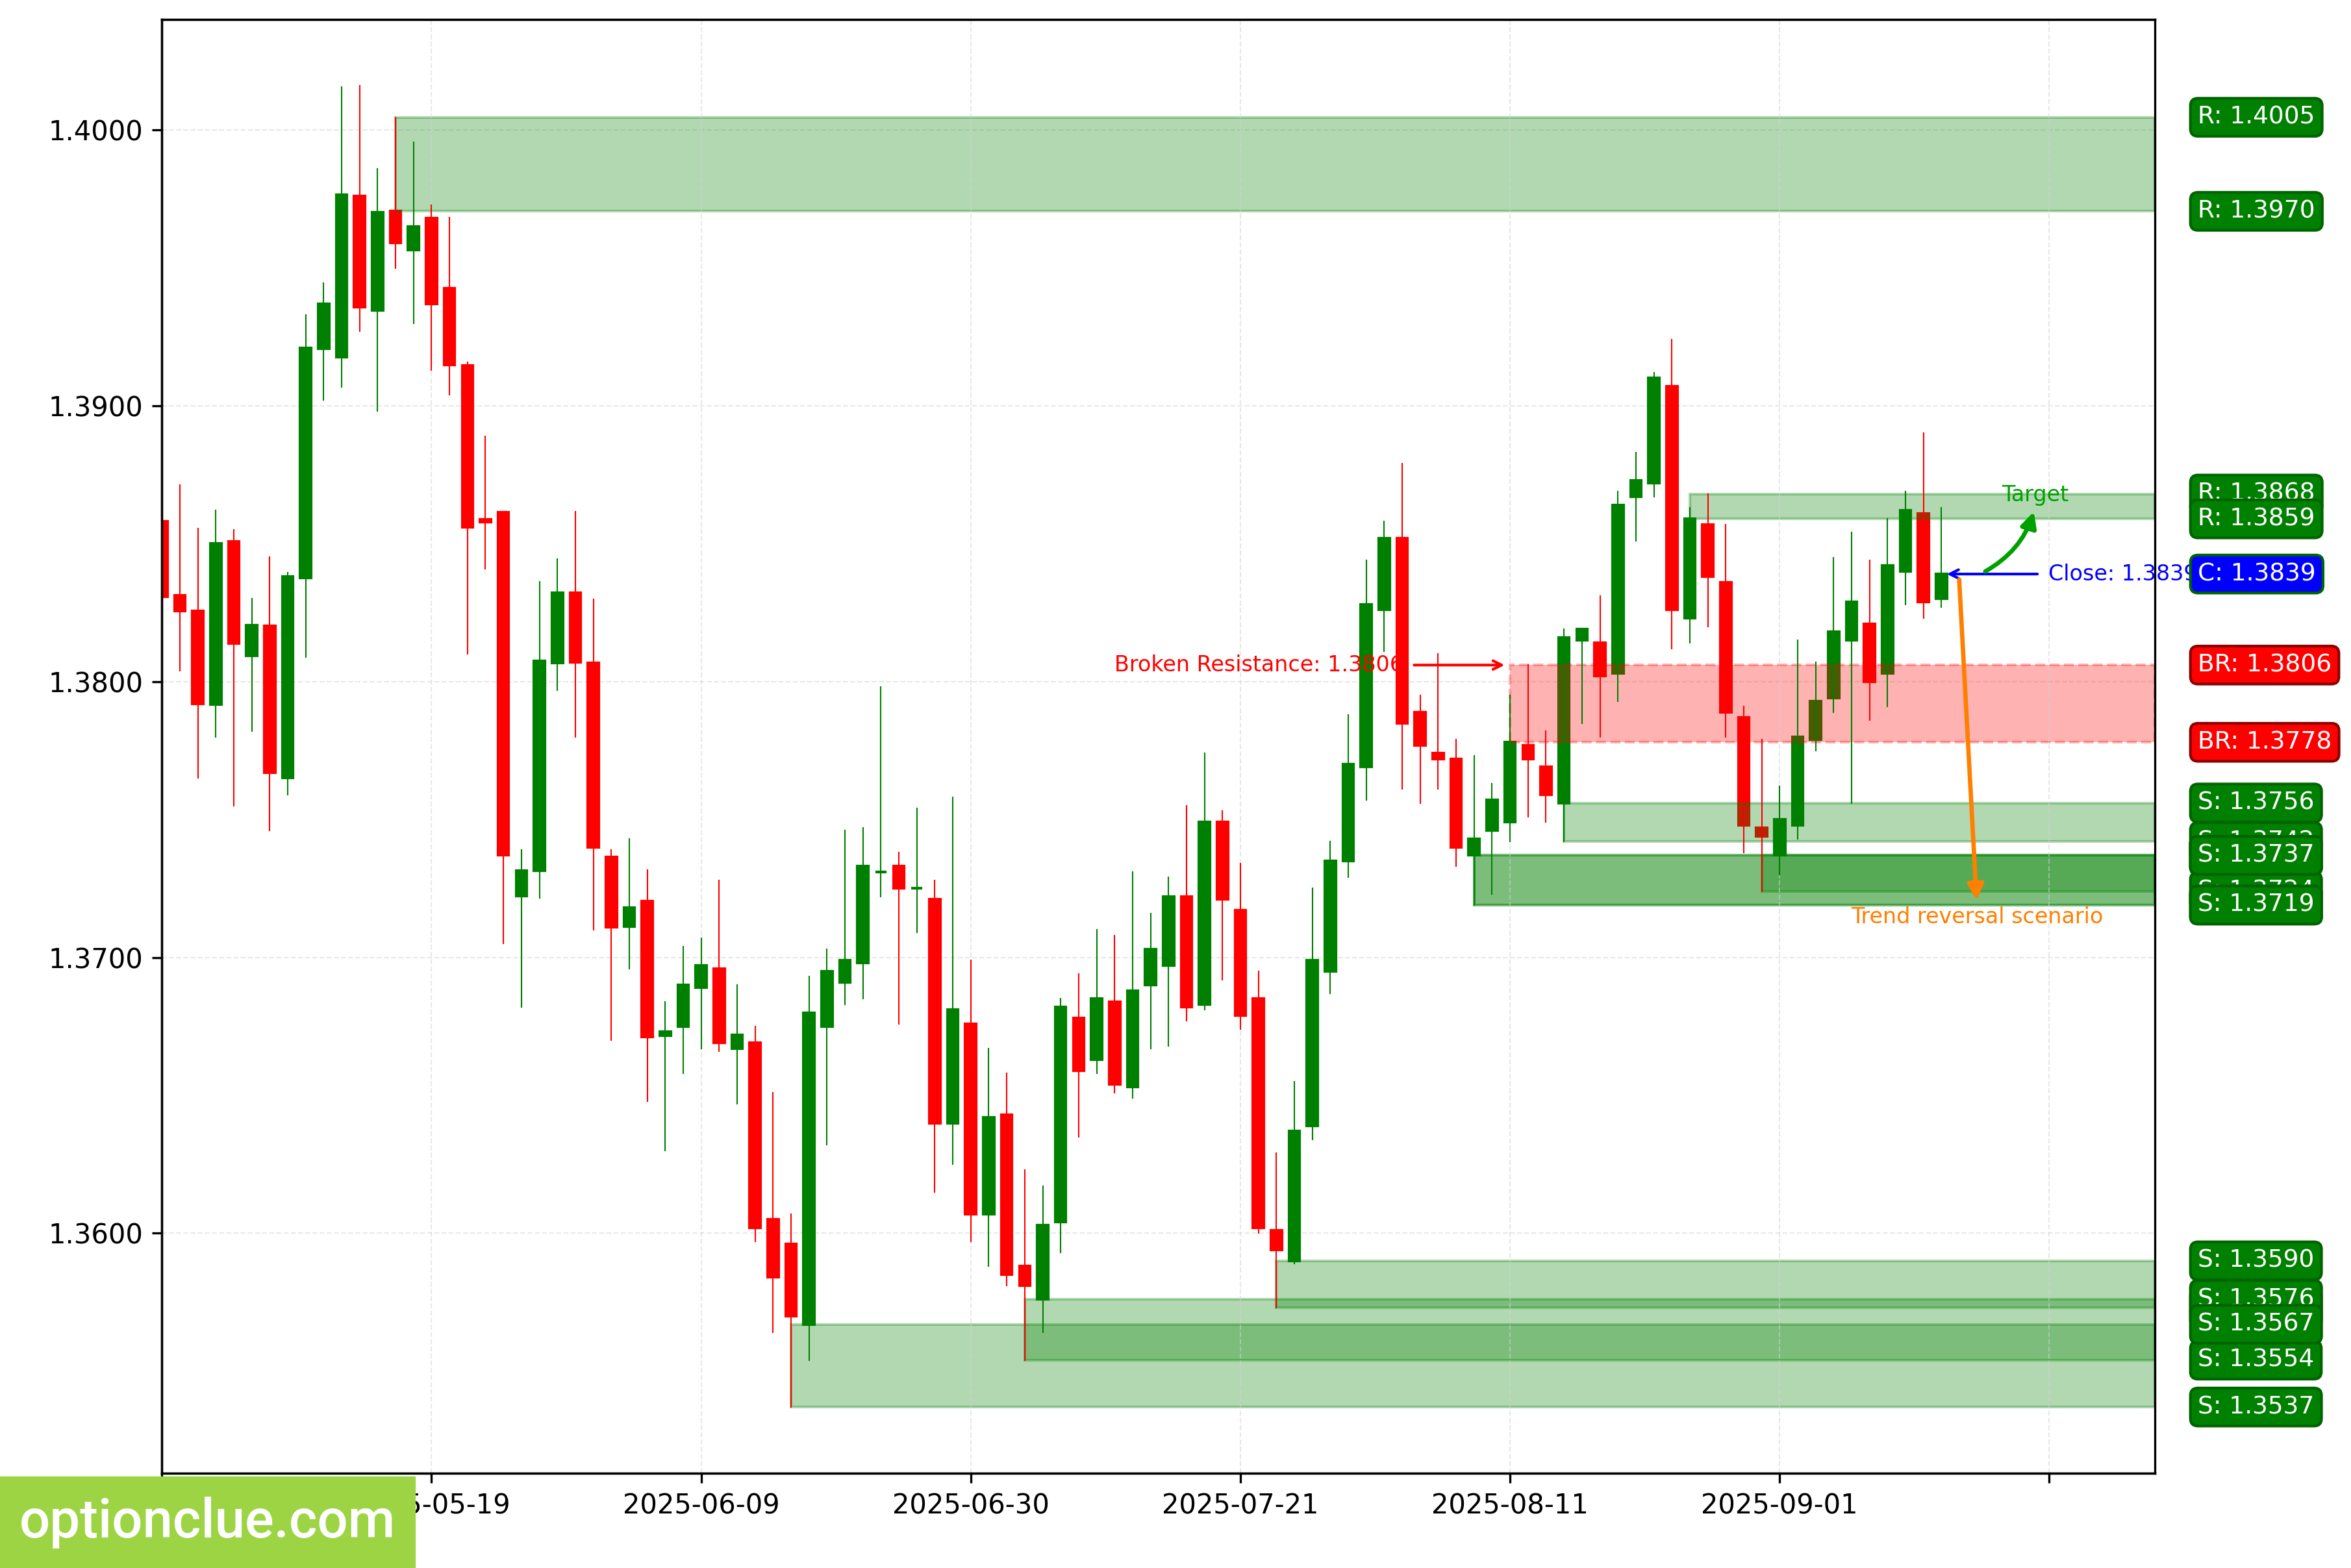
Canadian Dollar (USDCAD)
The market remains in a bullish trend; yesterday, a correction ended, a buy entry point on a rebound formed, and an impulse wave is developing.
The intermediate target for the upward movement is the resistance level with boundaries at 1.3859 – 1.3868. If the market successfully holds above this resistance, it will open the way for the price to move toward target #2—the resistance level with boundaries at 1.3971 – 1.4005.
Long positions will remain relevant as long as the market stays above the nearest daily timeframe support level with boundaries at 1.3724 – 1.3737.
USDCAD. Technical analysis. D1.
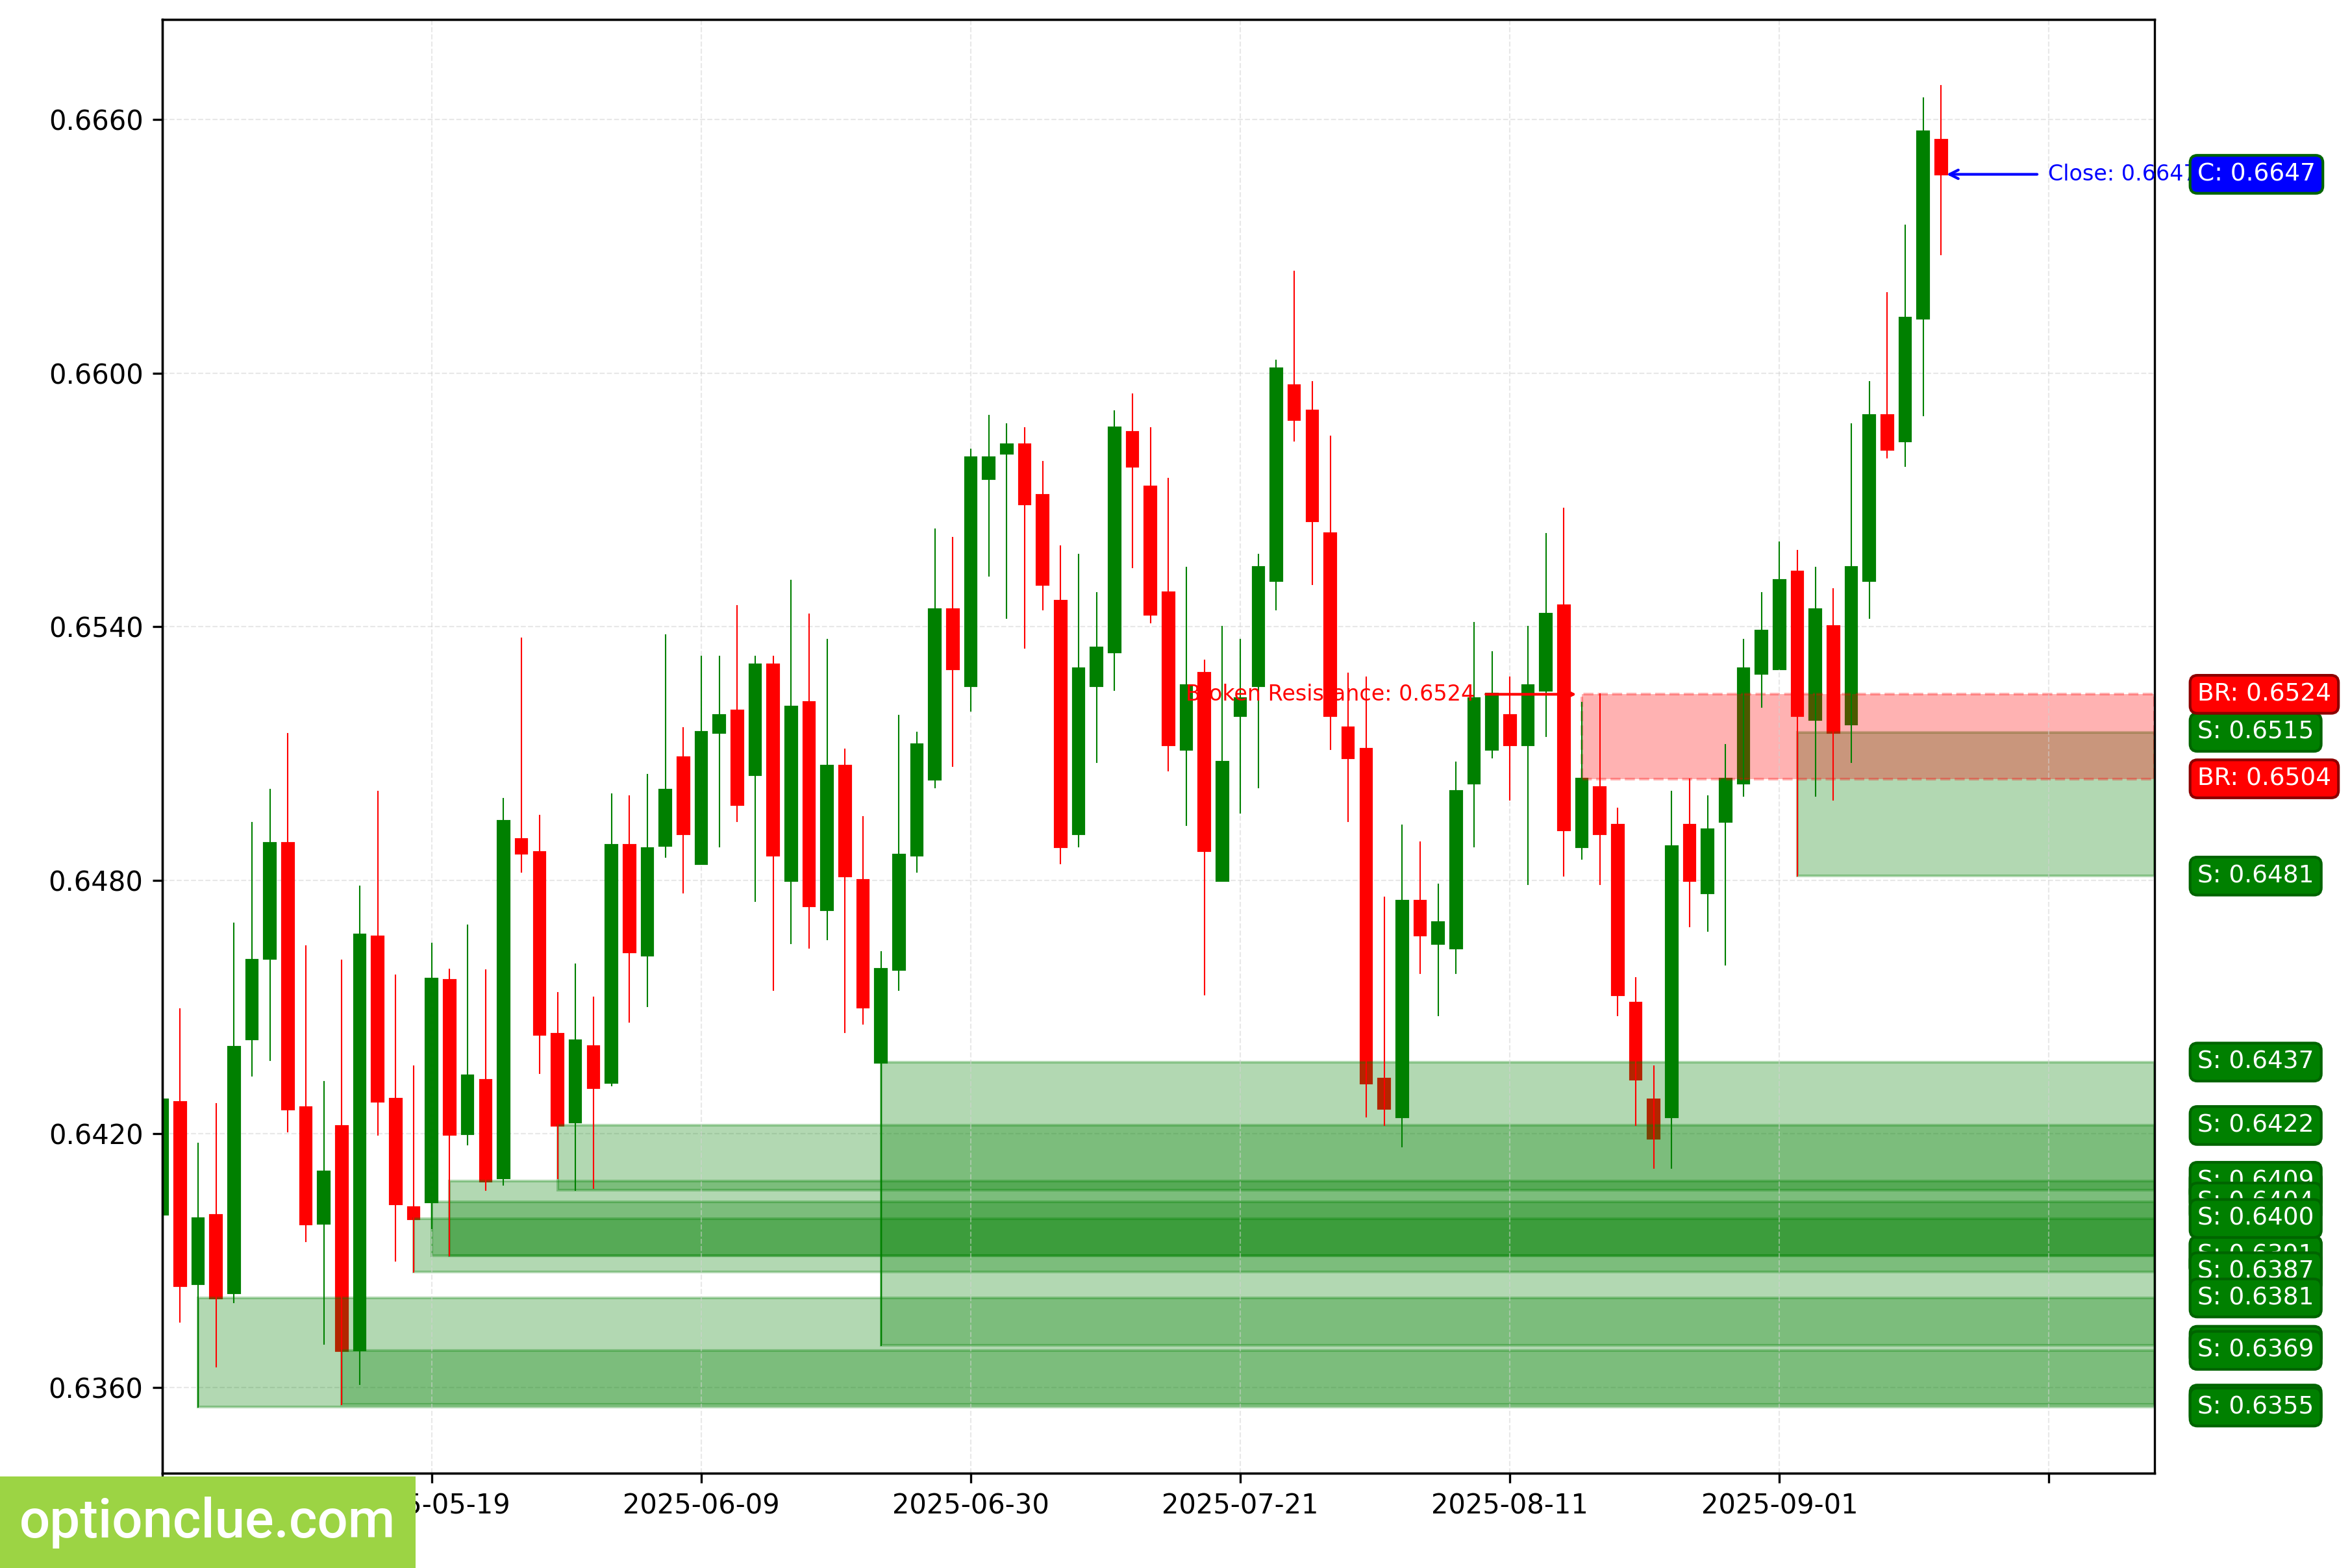
Australian Dollar (AUDUSD)
The trend remains bullish; last week, another resistance level was broken, and an active impulse wave is developing. The intermediate target for the upward movement is the resistance level with boundaries at 0.6677 – 0.6688.
If the market successfully holds above this resistance, it will open the way for the price to move toward target #2—the resistance level with boundaries at 0.6750 – 0.6759. Long positions remain relevant as long as the market is above the support level with boundaries at 0.6481 – 0.6515.
AUDUSD. Technical analysis. D1.
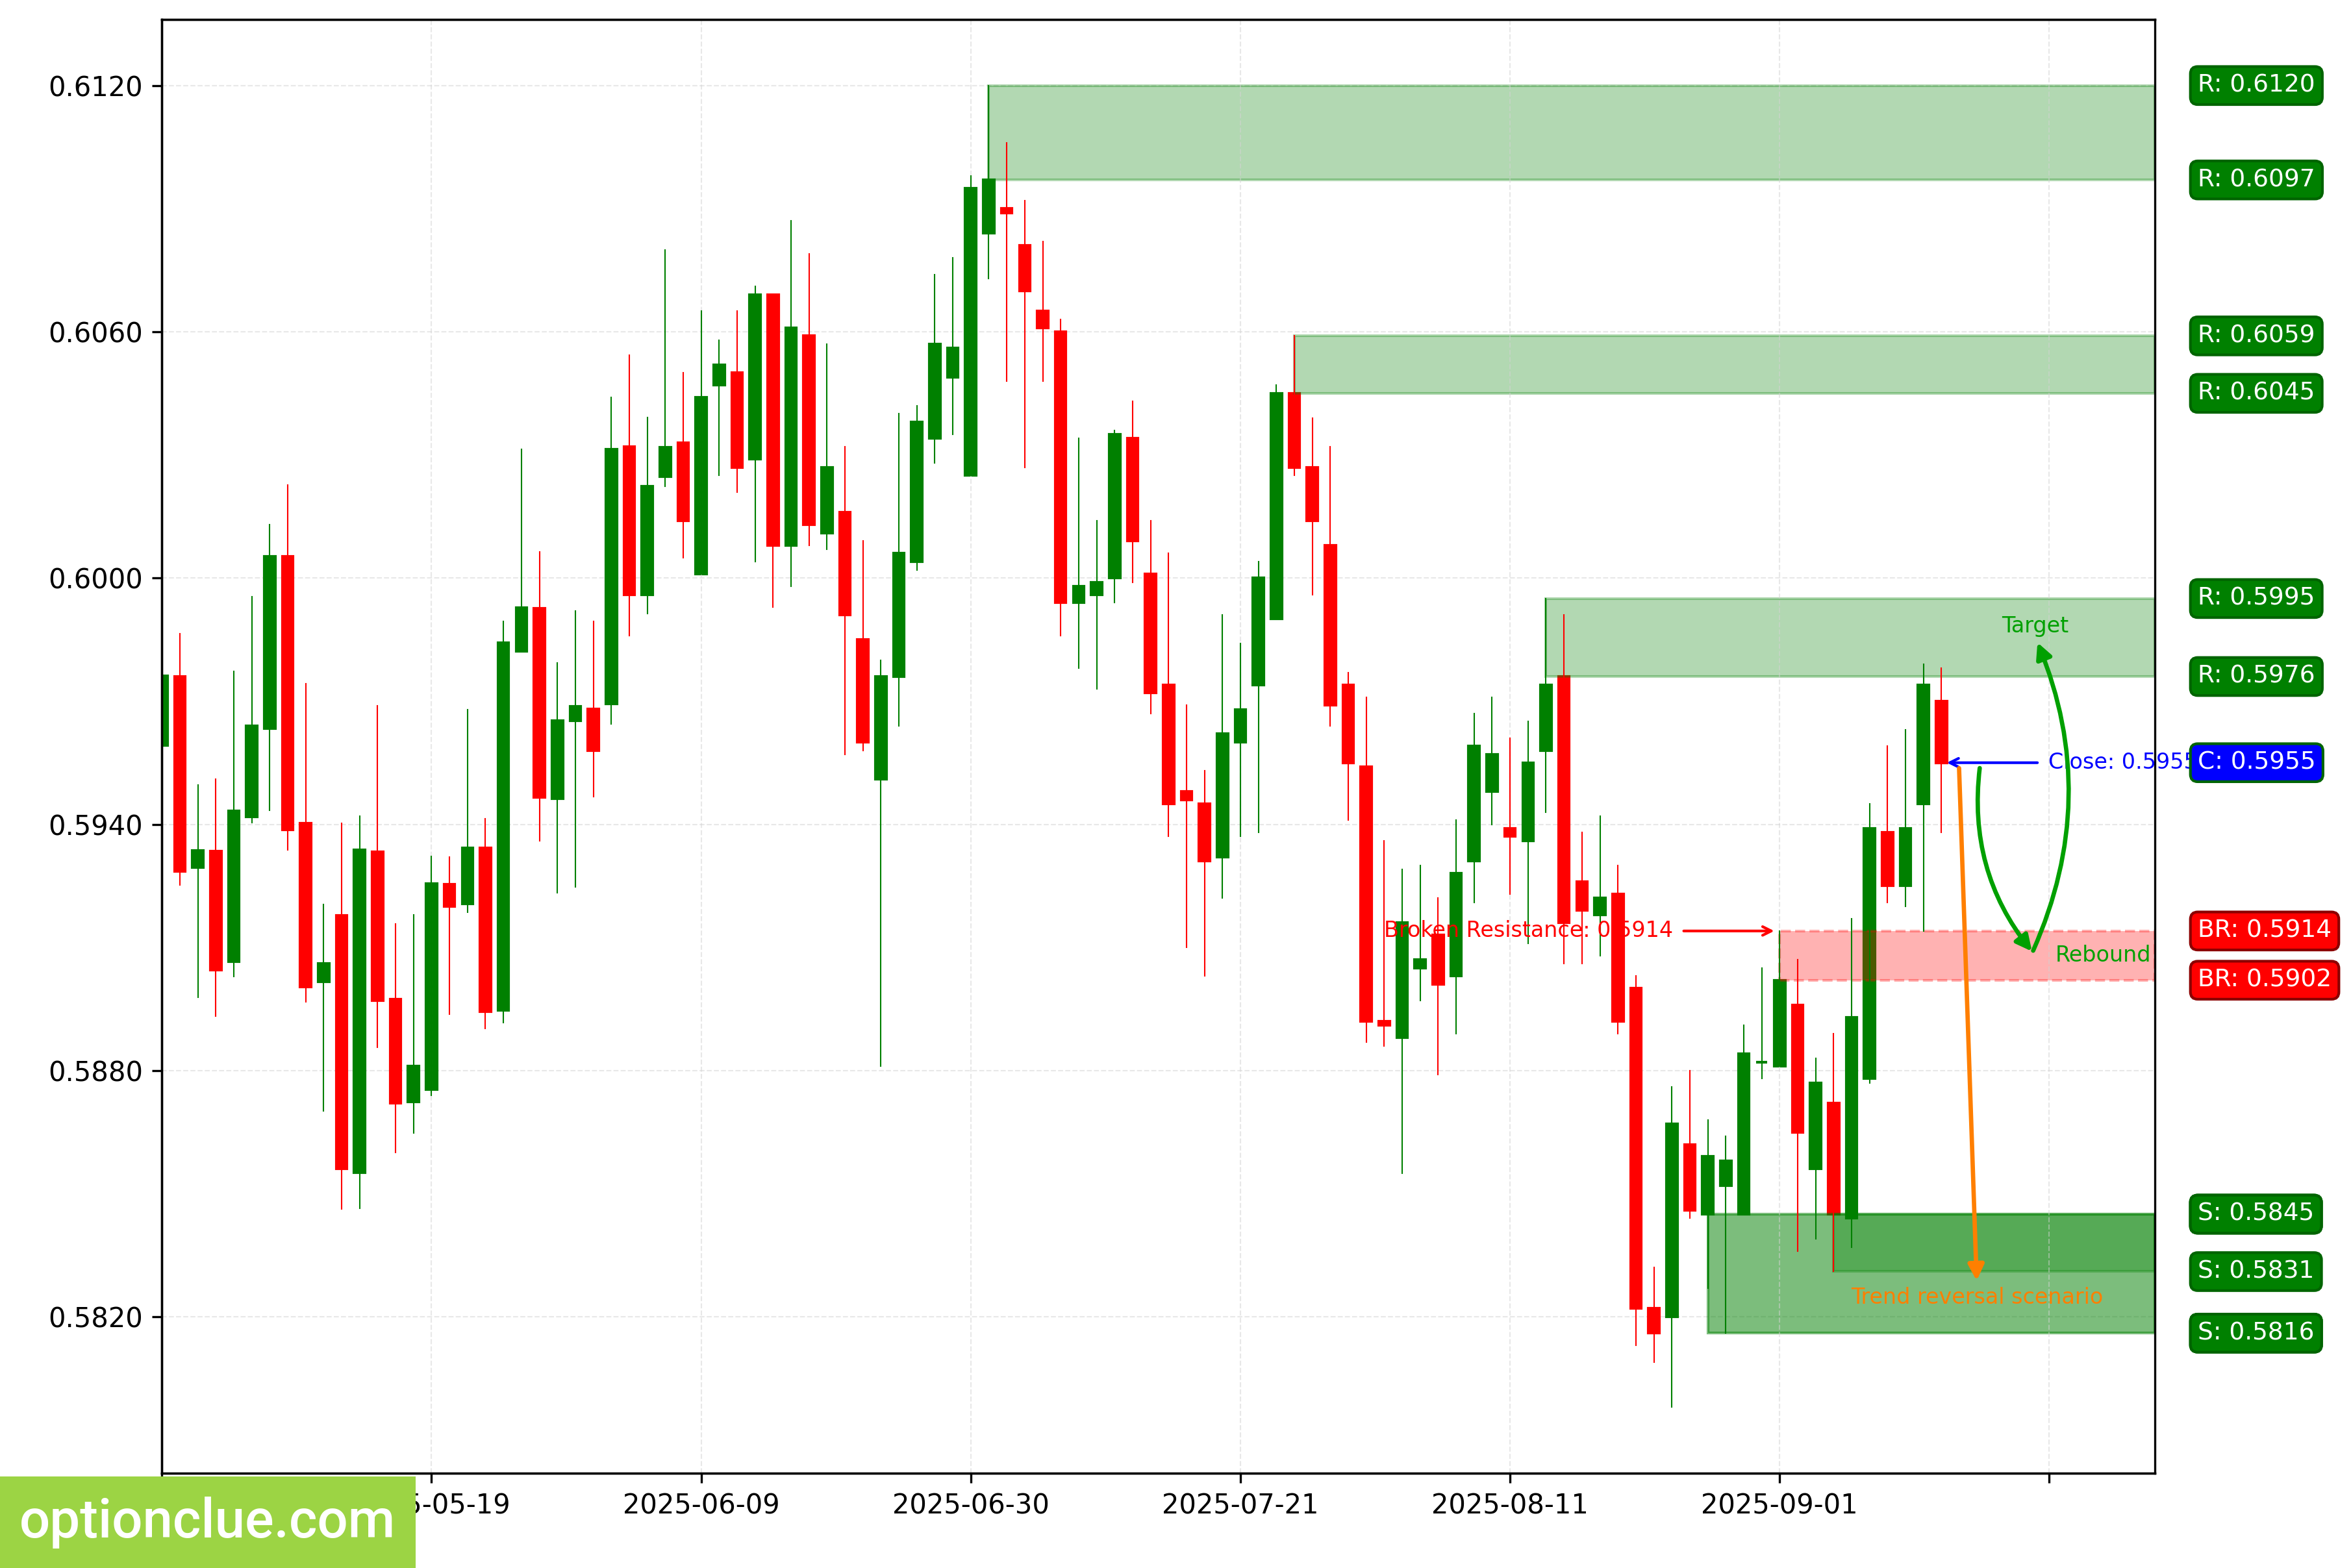
New Zealand Dollar (NZDUSD)
The trend has changed to bullish as the resistance level (0.5902 – 0.5914) was broken.
The breakout occurred 5 days ago. After that, 3 days ago, a correction ended and a buy entry point on a rebound formed; the market then reached the nearest target and is now correcting.
The intermediate target for the upward movement is the resistance level with boundaries at 0.5976 – 0.5995. If the market corrects to the last broken level (0.5902 – 0.5914), the potential reward/risk ratio on the Daily chart will be around 0.8.
If the market successfully holds above the nearest resistance, it will open the way for the price to move toward target #2—the resistance level with boundaries at 0.6045 – 0.6059. Long positions will remain relevant as long as the market stays above the nearest support level with boundaries at 0.5831 – 0.5845.
NZDUSD. Technical analysis. D1.
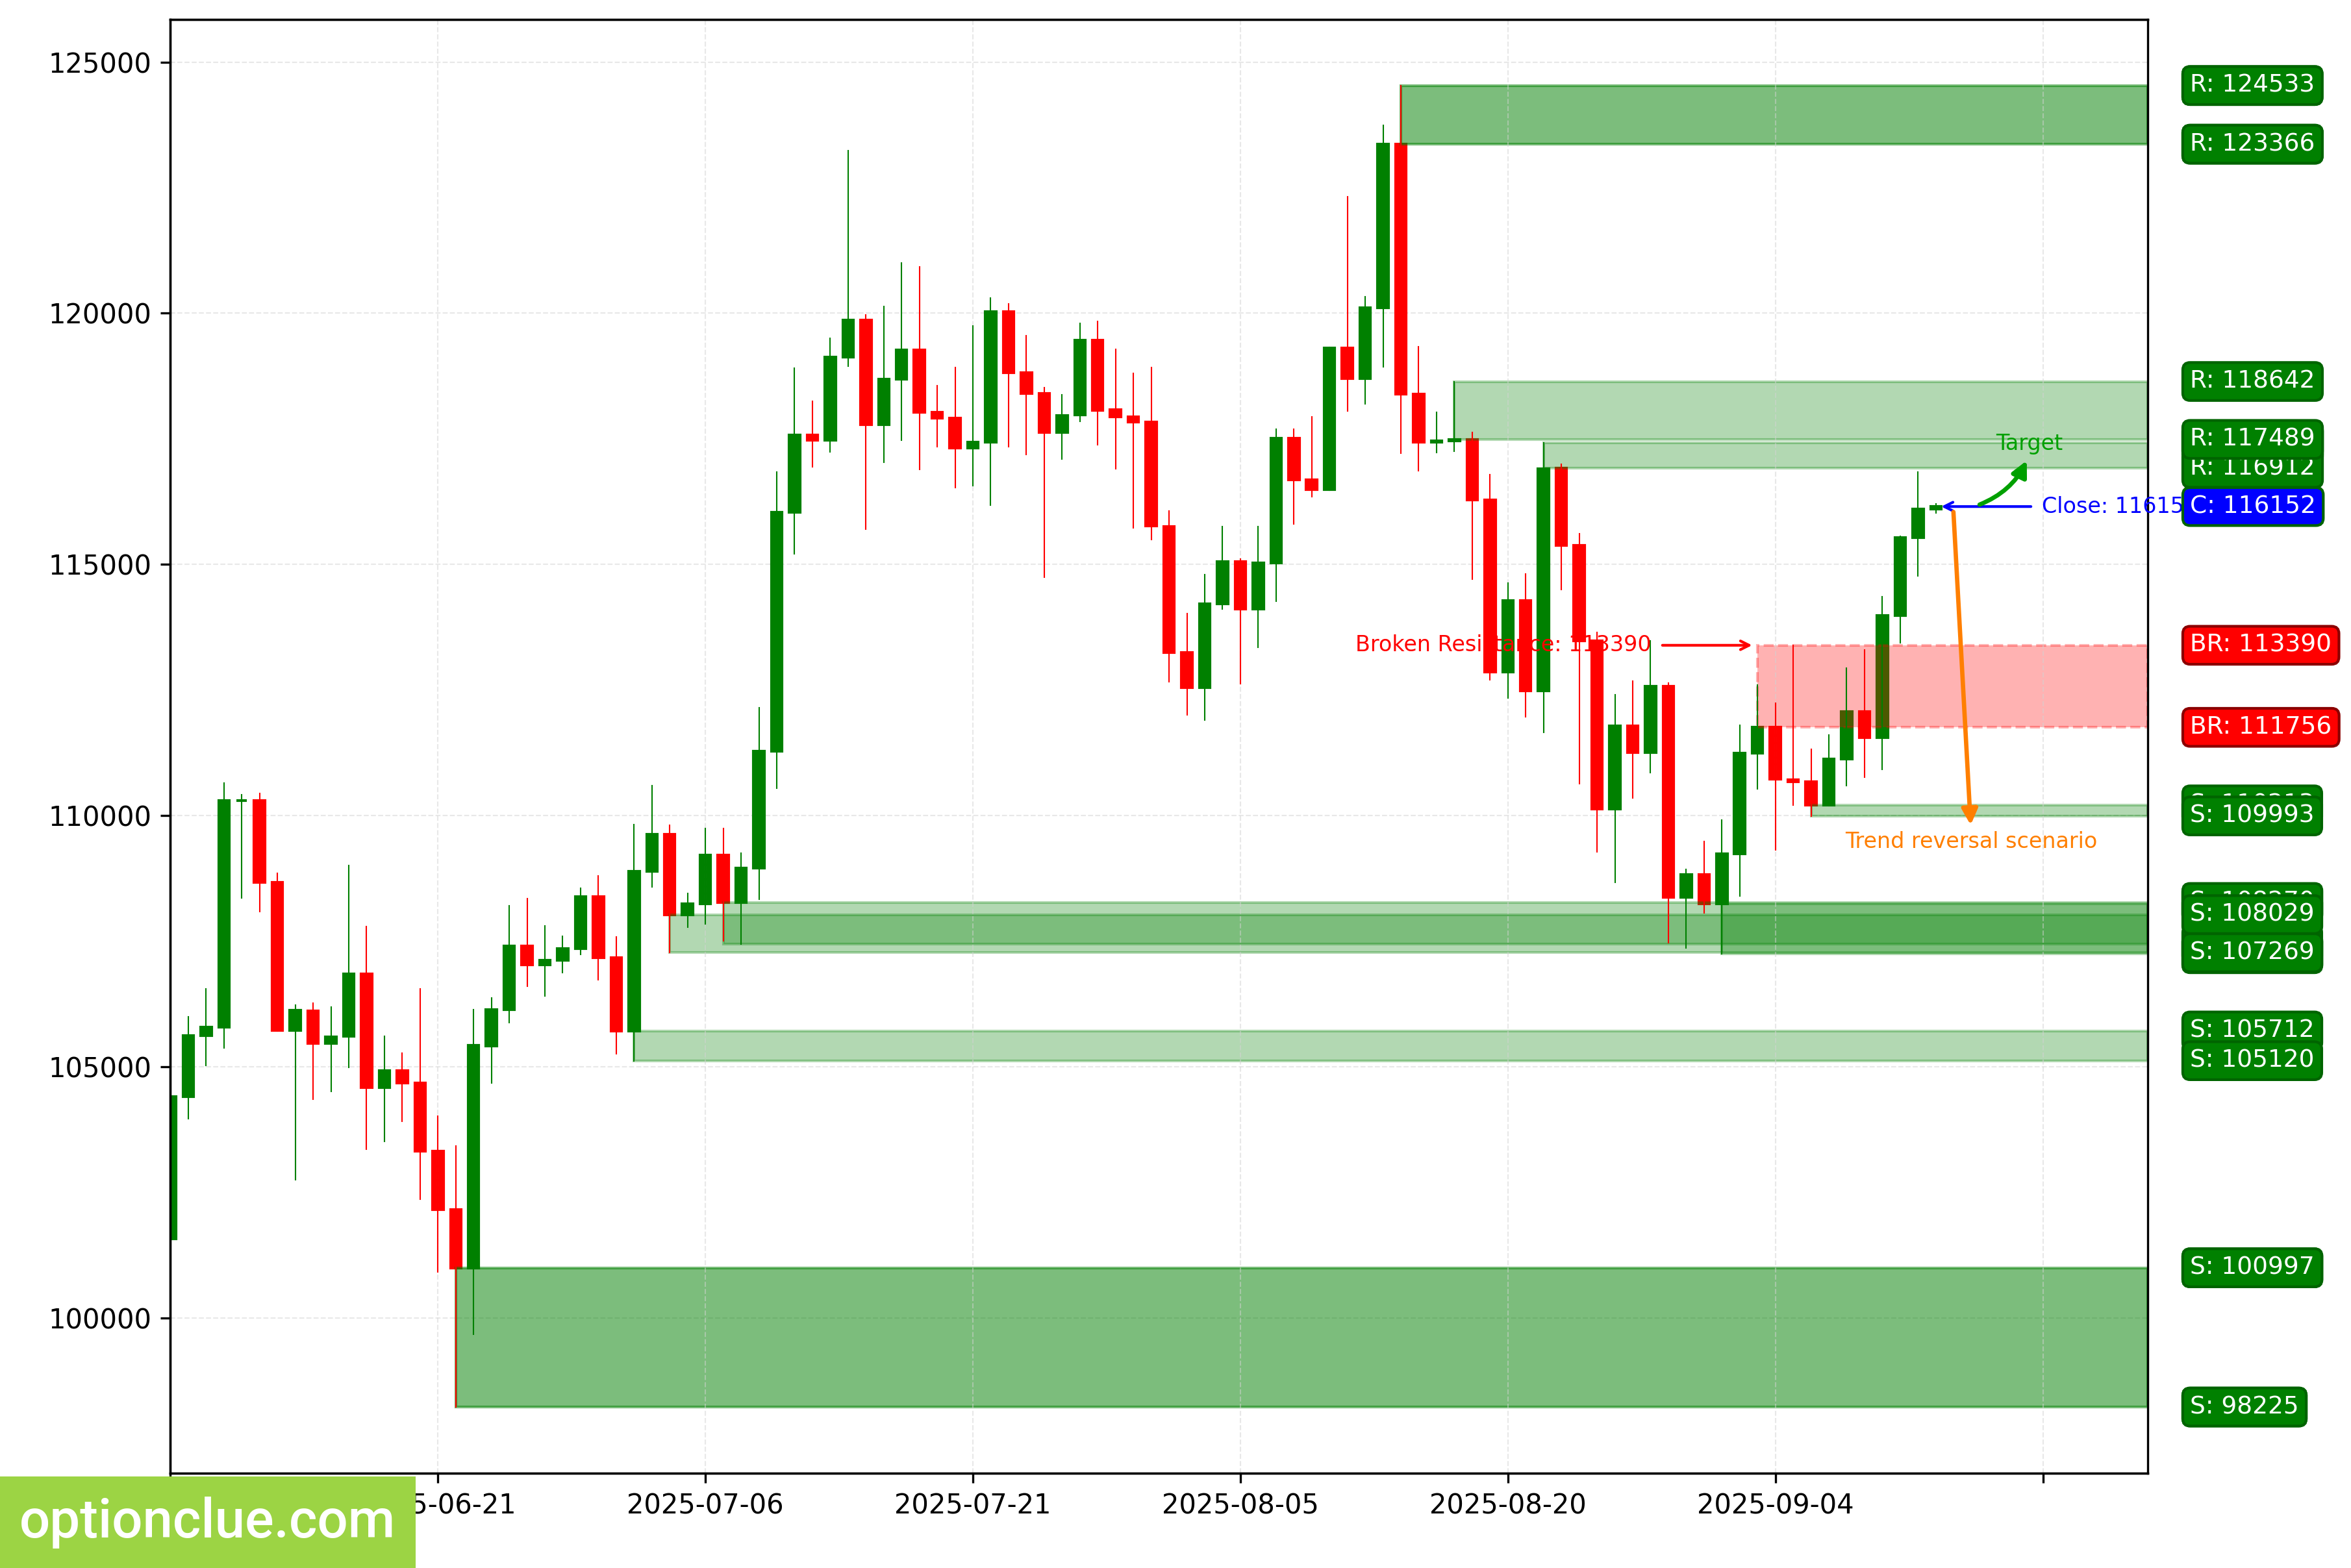
Bitcoin (BTC)
The trend has changed to bullish.
The last level broken was resistance (111756 – 113390). The breakout occurred 4 days ago; an impulse wave is developing.
A buy entry point on a rebound will appear after a correction forms. The first target is the resistance level with boundaries at 116912 – 117417.
If the trend develops successfully, a more distant target will be near the next resistance with boundaries at 117489 – 118642. Long positions will remain relevant as long as the market stays above the nearest support level with boundaries at 109993 – 110213.
BTC. Technical analysis. D1.
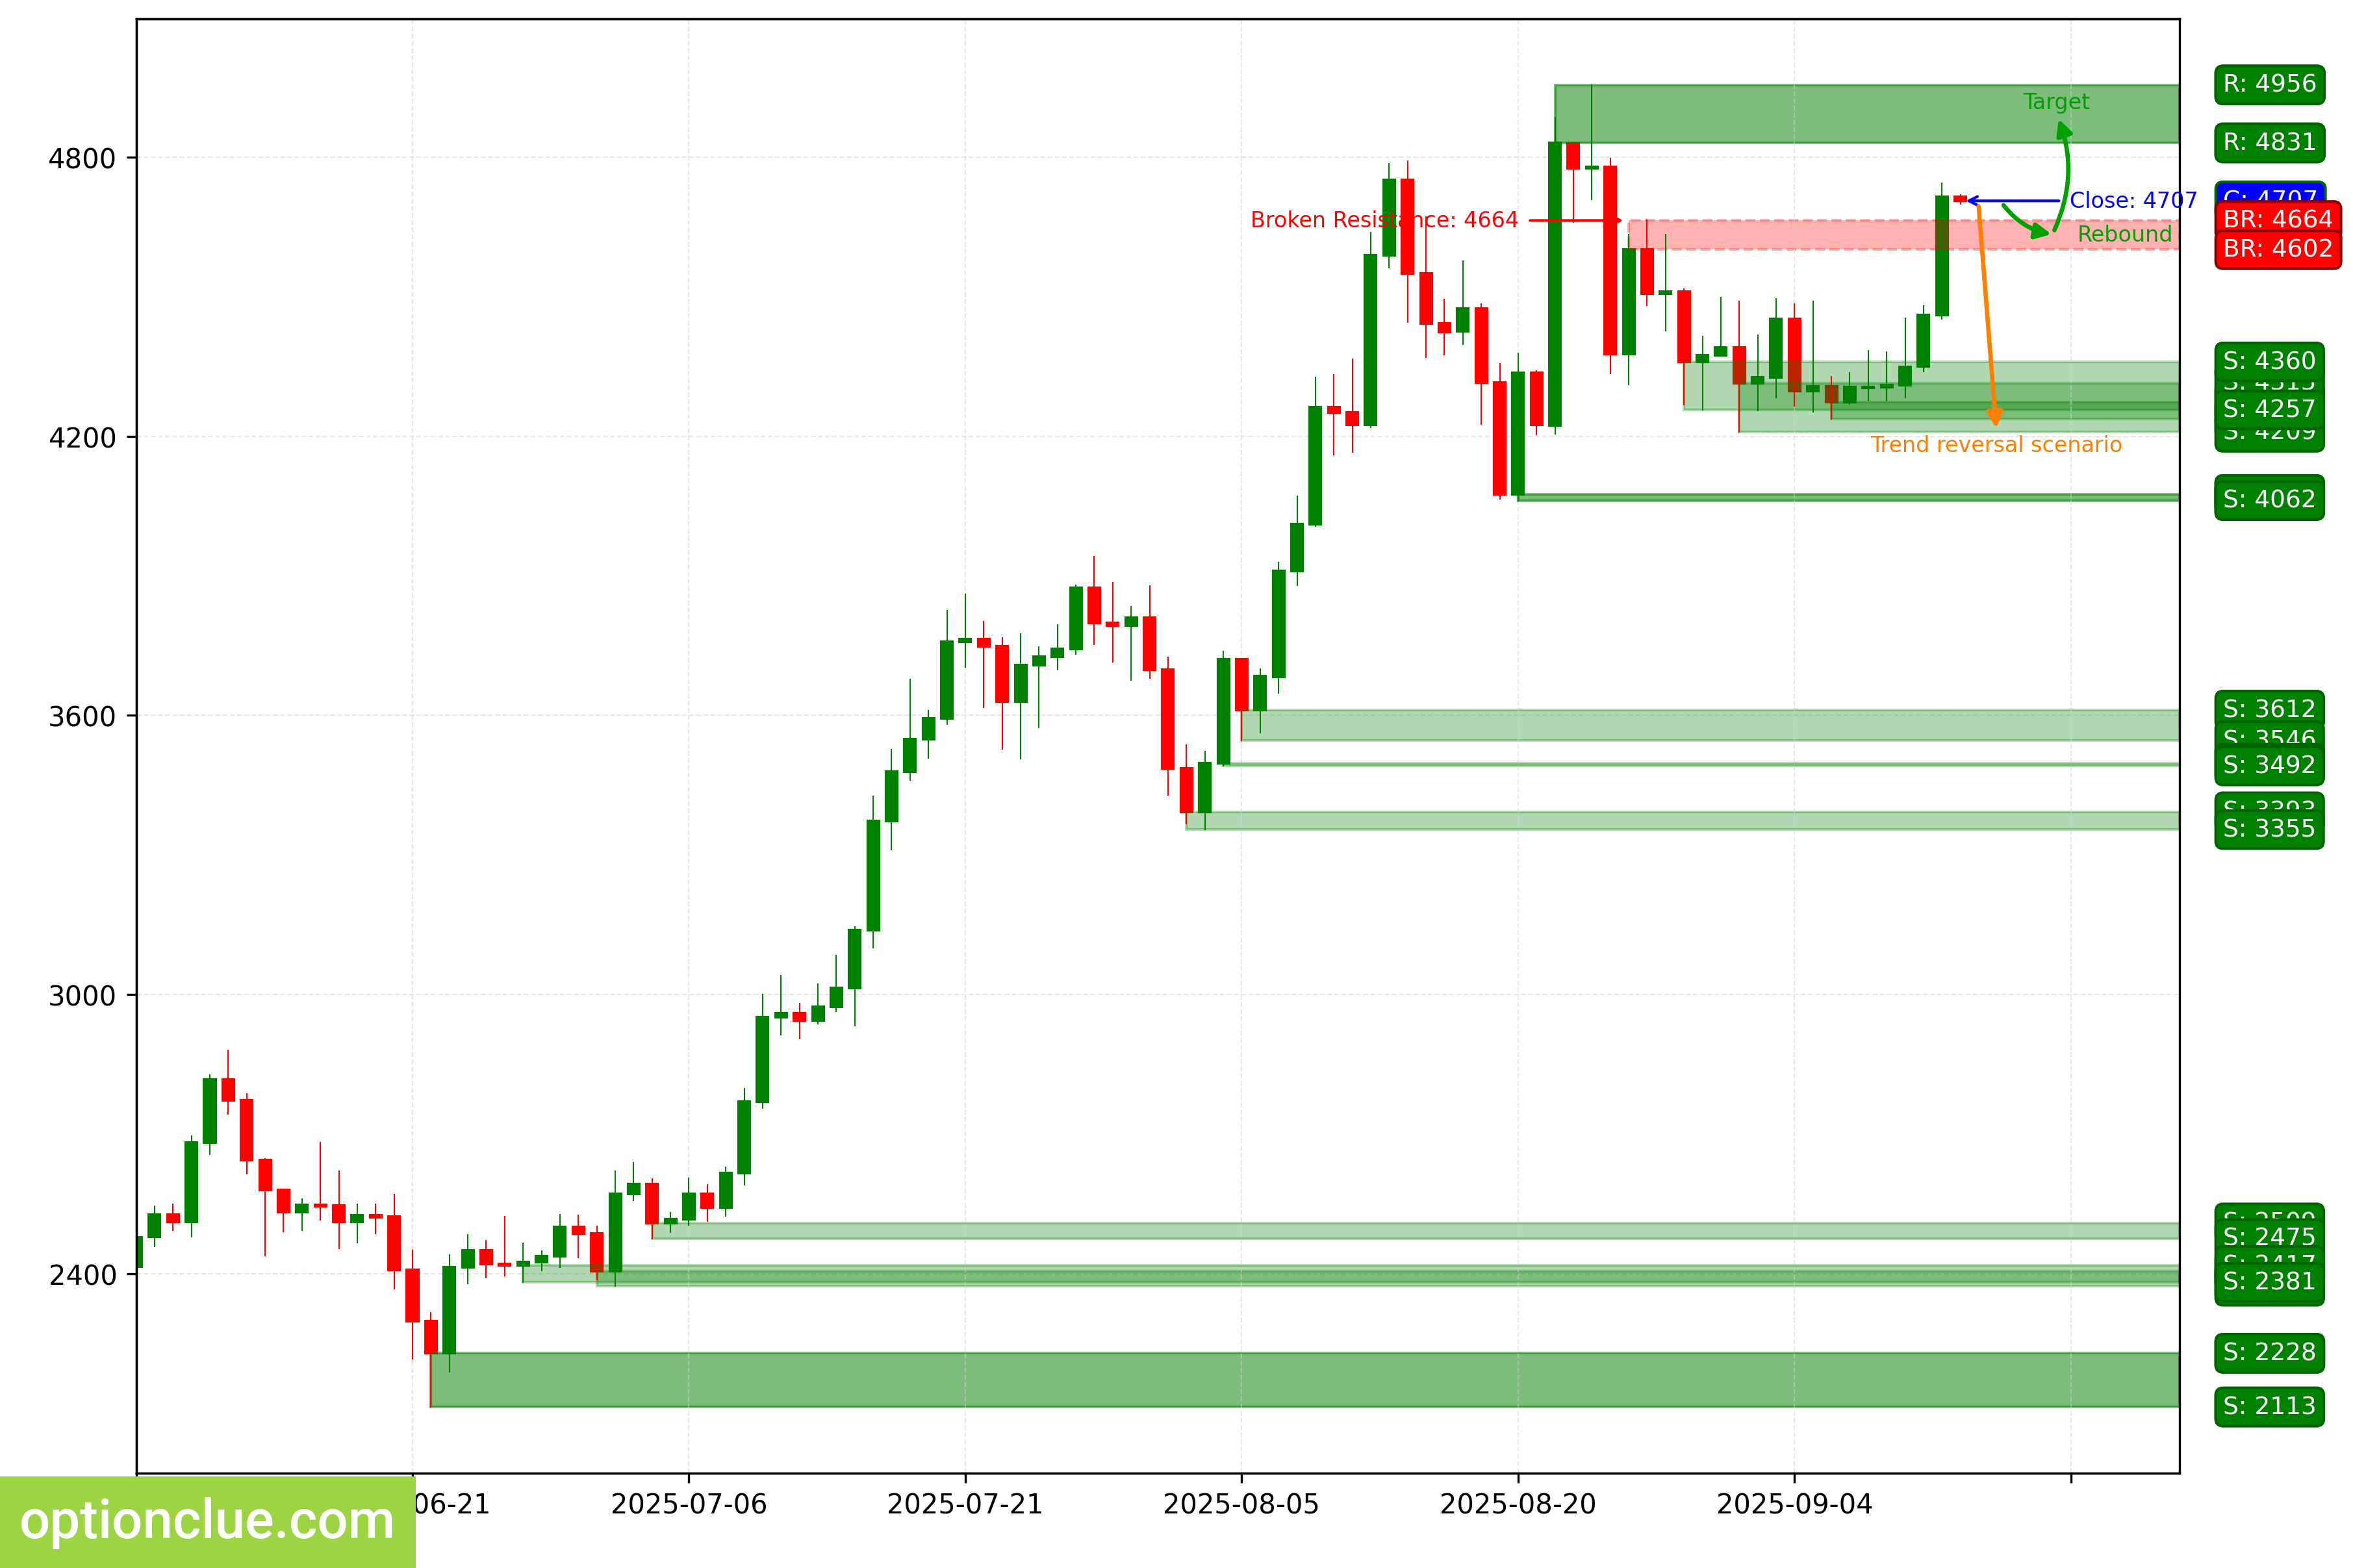
Ether (ETH)
The market remains in a bullish trend; another impulse wave is developing.
A buy entry point on a rebound will appear after a correction forms on the daily timeframe. The first target will be the resistance level with boundaries at 4831 – 4956.
Long positions will remain relevant as long as the market stays above the nearest daily timeframe support level with boundaries at 4237 – 4274.
ETH. Technical analysis. D1.
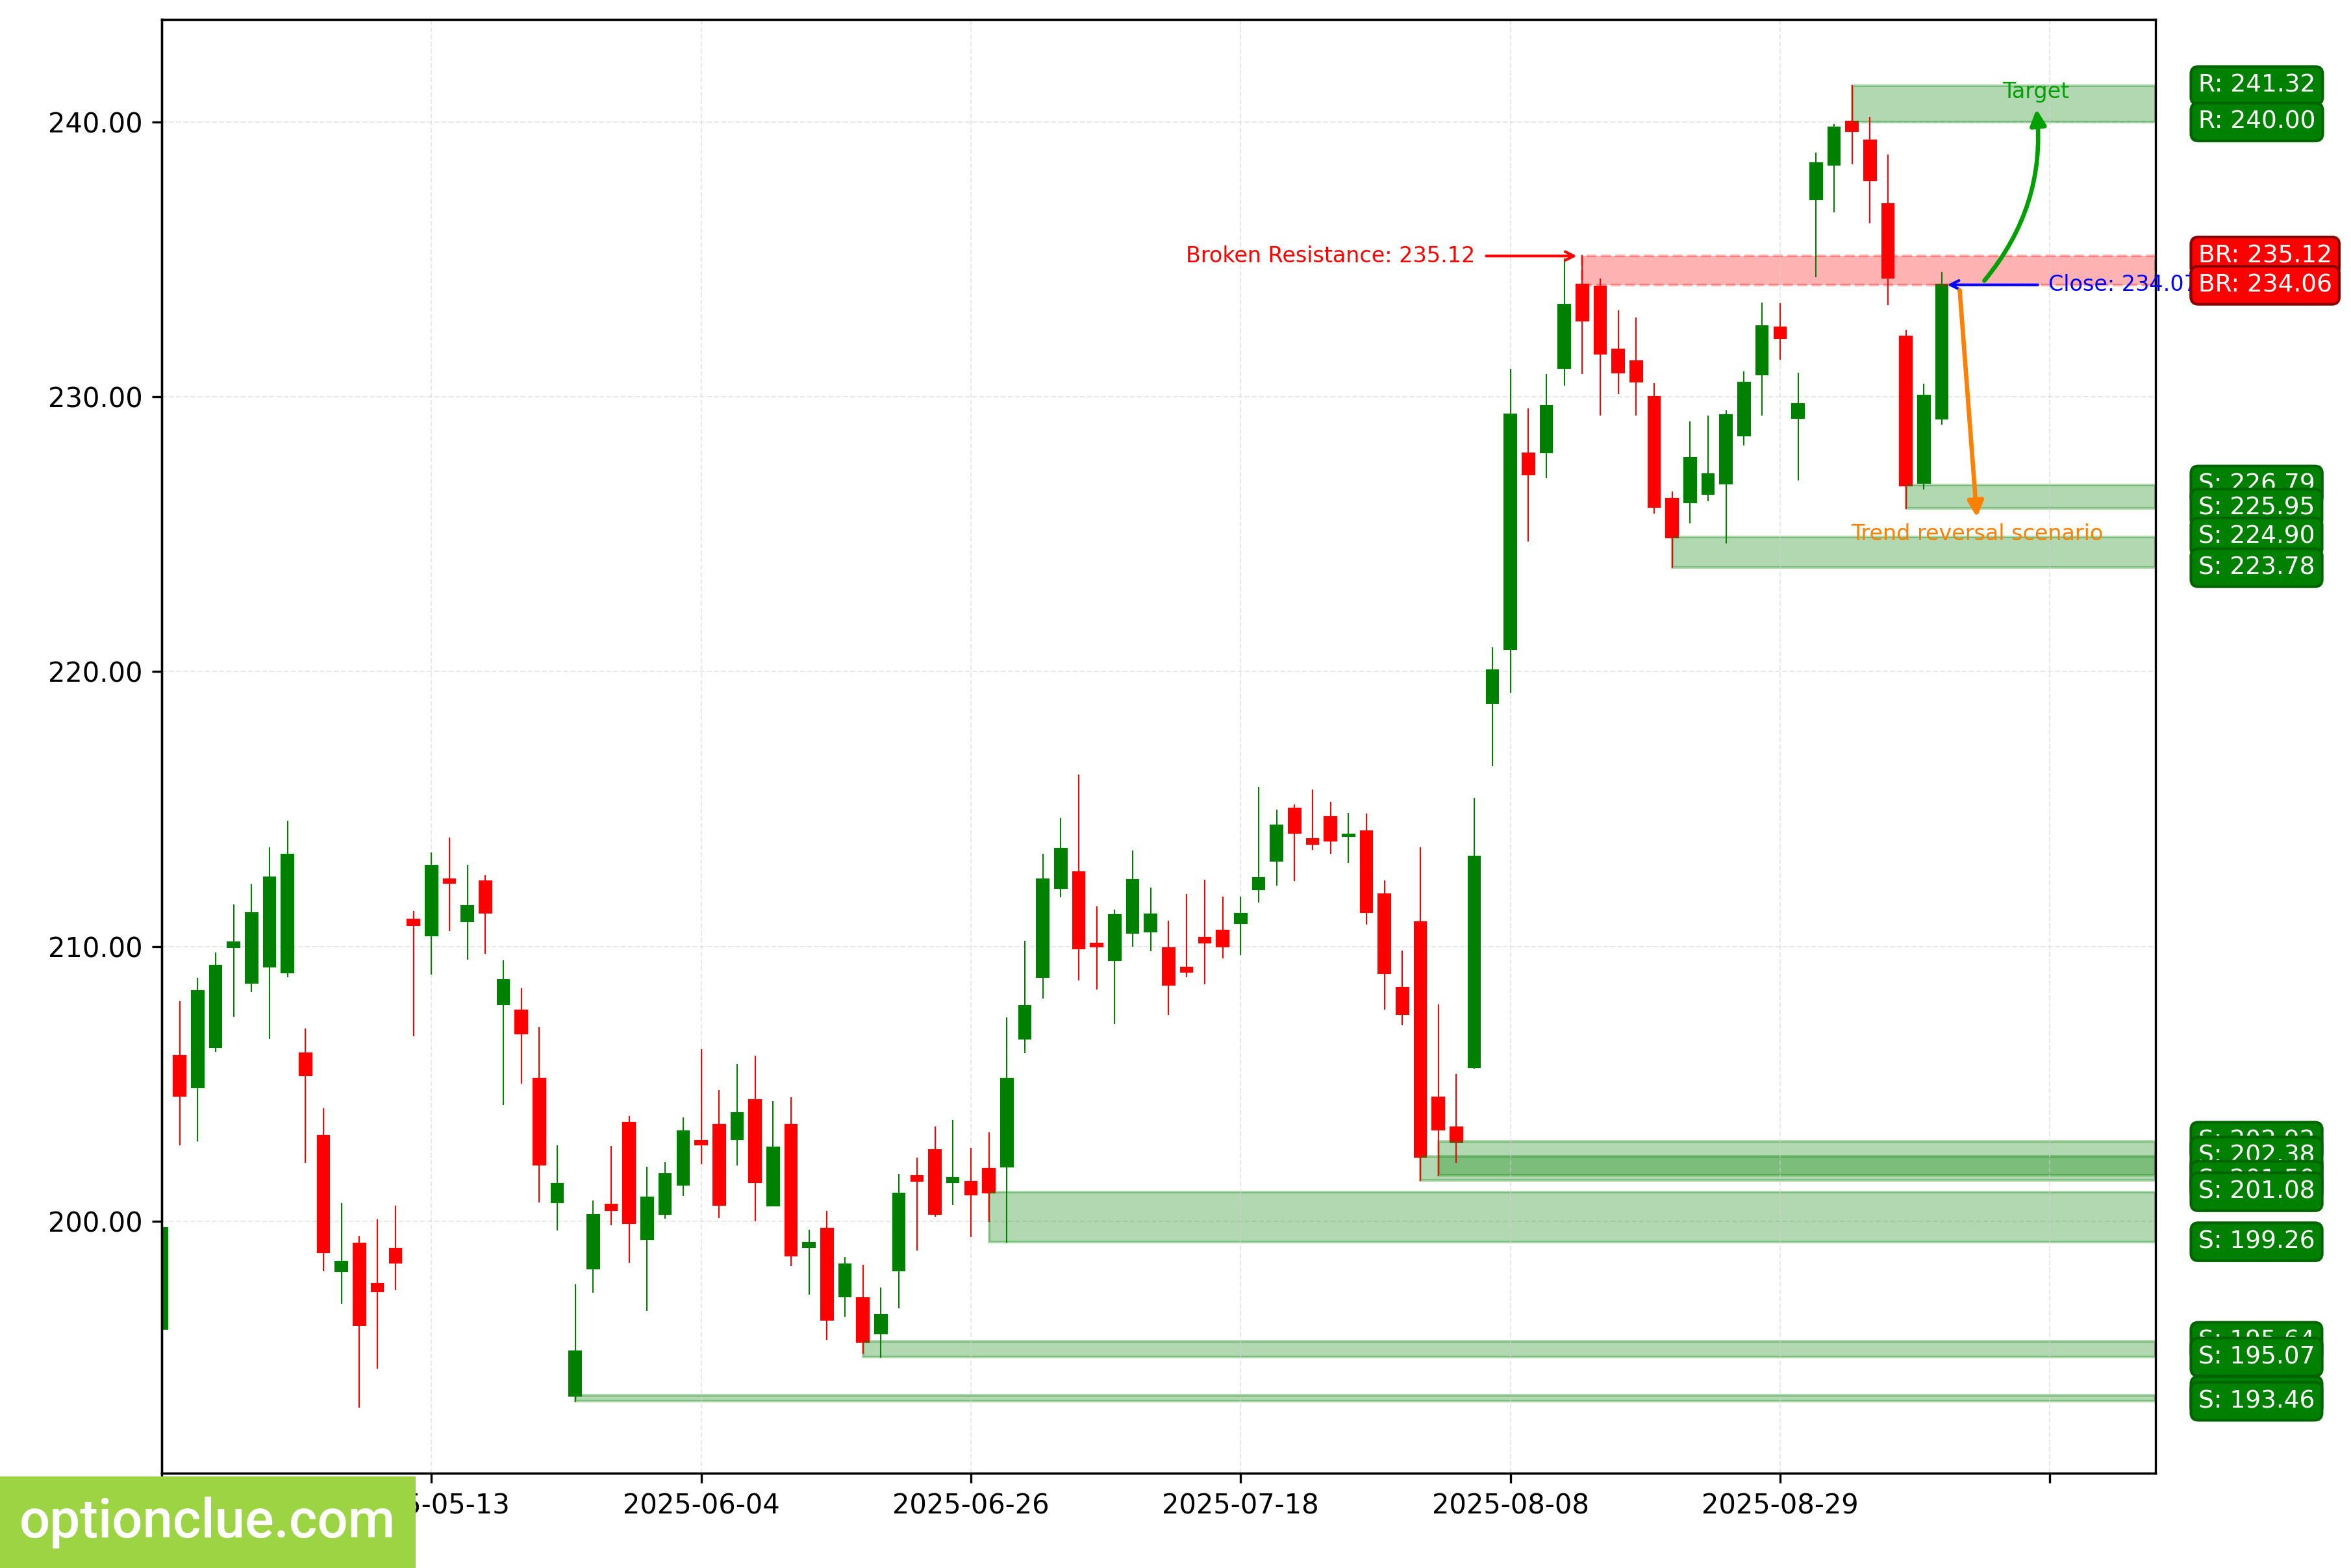
Apple Inc (AAPL)
The market remains in a bullish trend; two days ago, a correction ended, a buy entry point on a rebound formed, and an impulse wave is developing. The intermediate target for the upward movement is the resistance level with boundaries at 240.00 – 241.32.
Long positions will remain relevant as long as the market stays above the nearest support level with boundaries at 225.95 – 226.79.
AAPL. Technical analysis. D1.
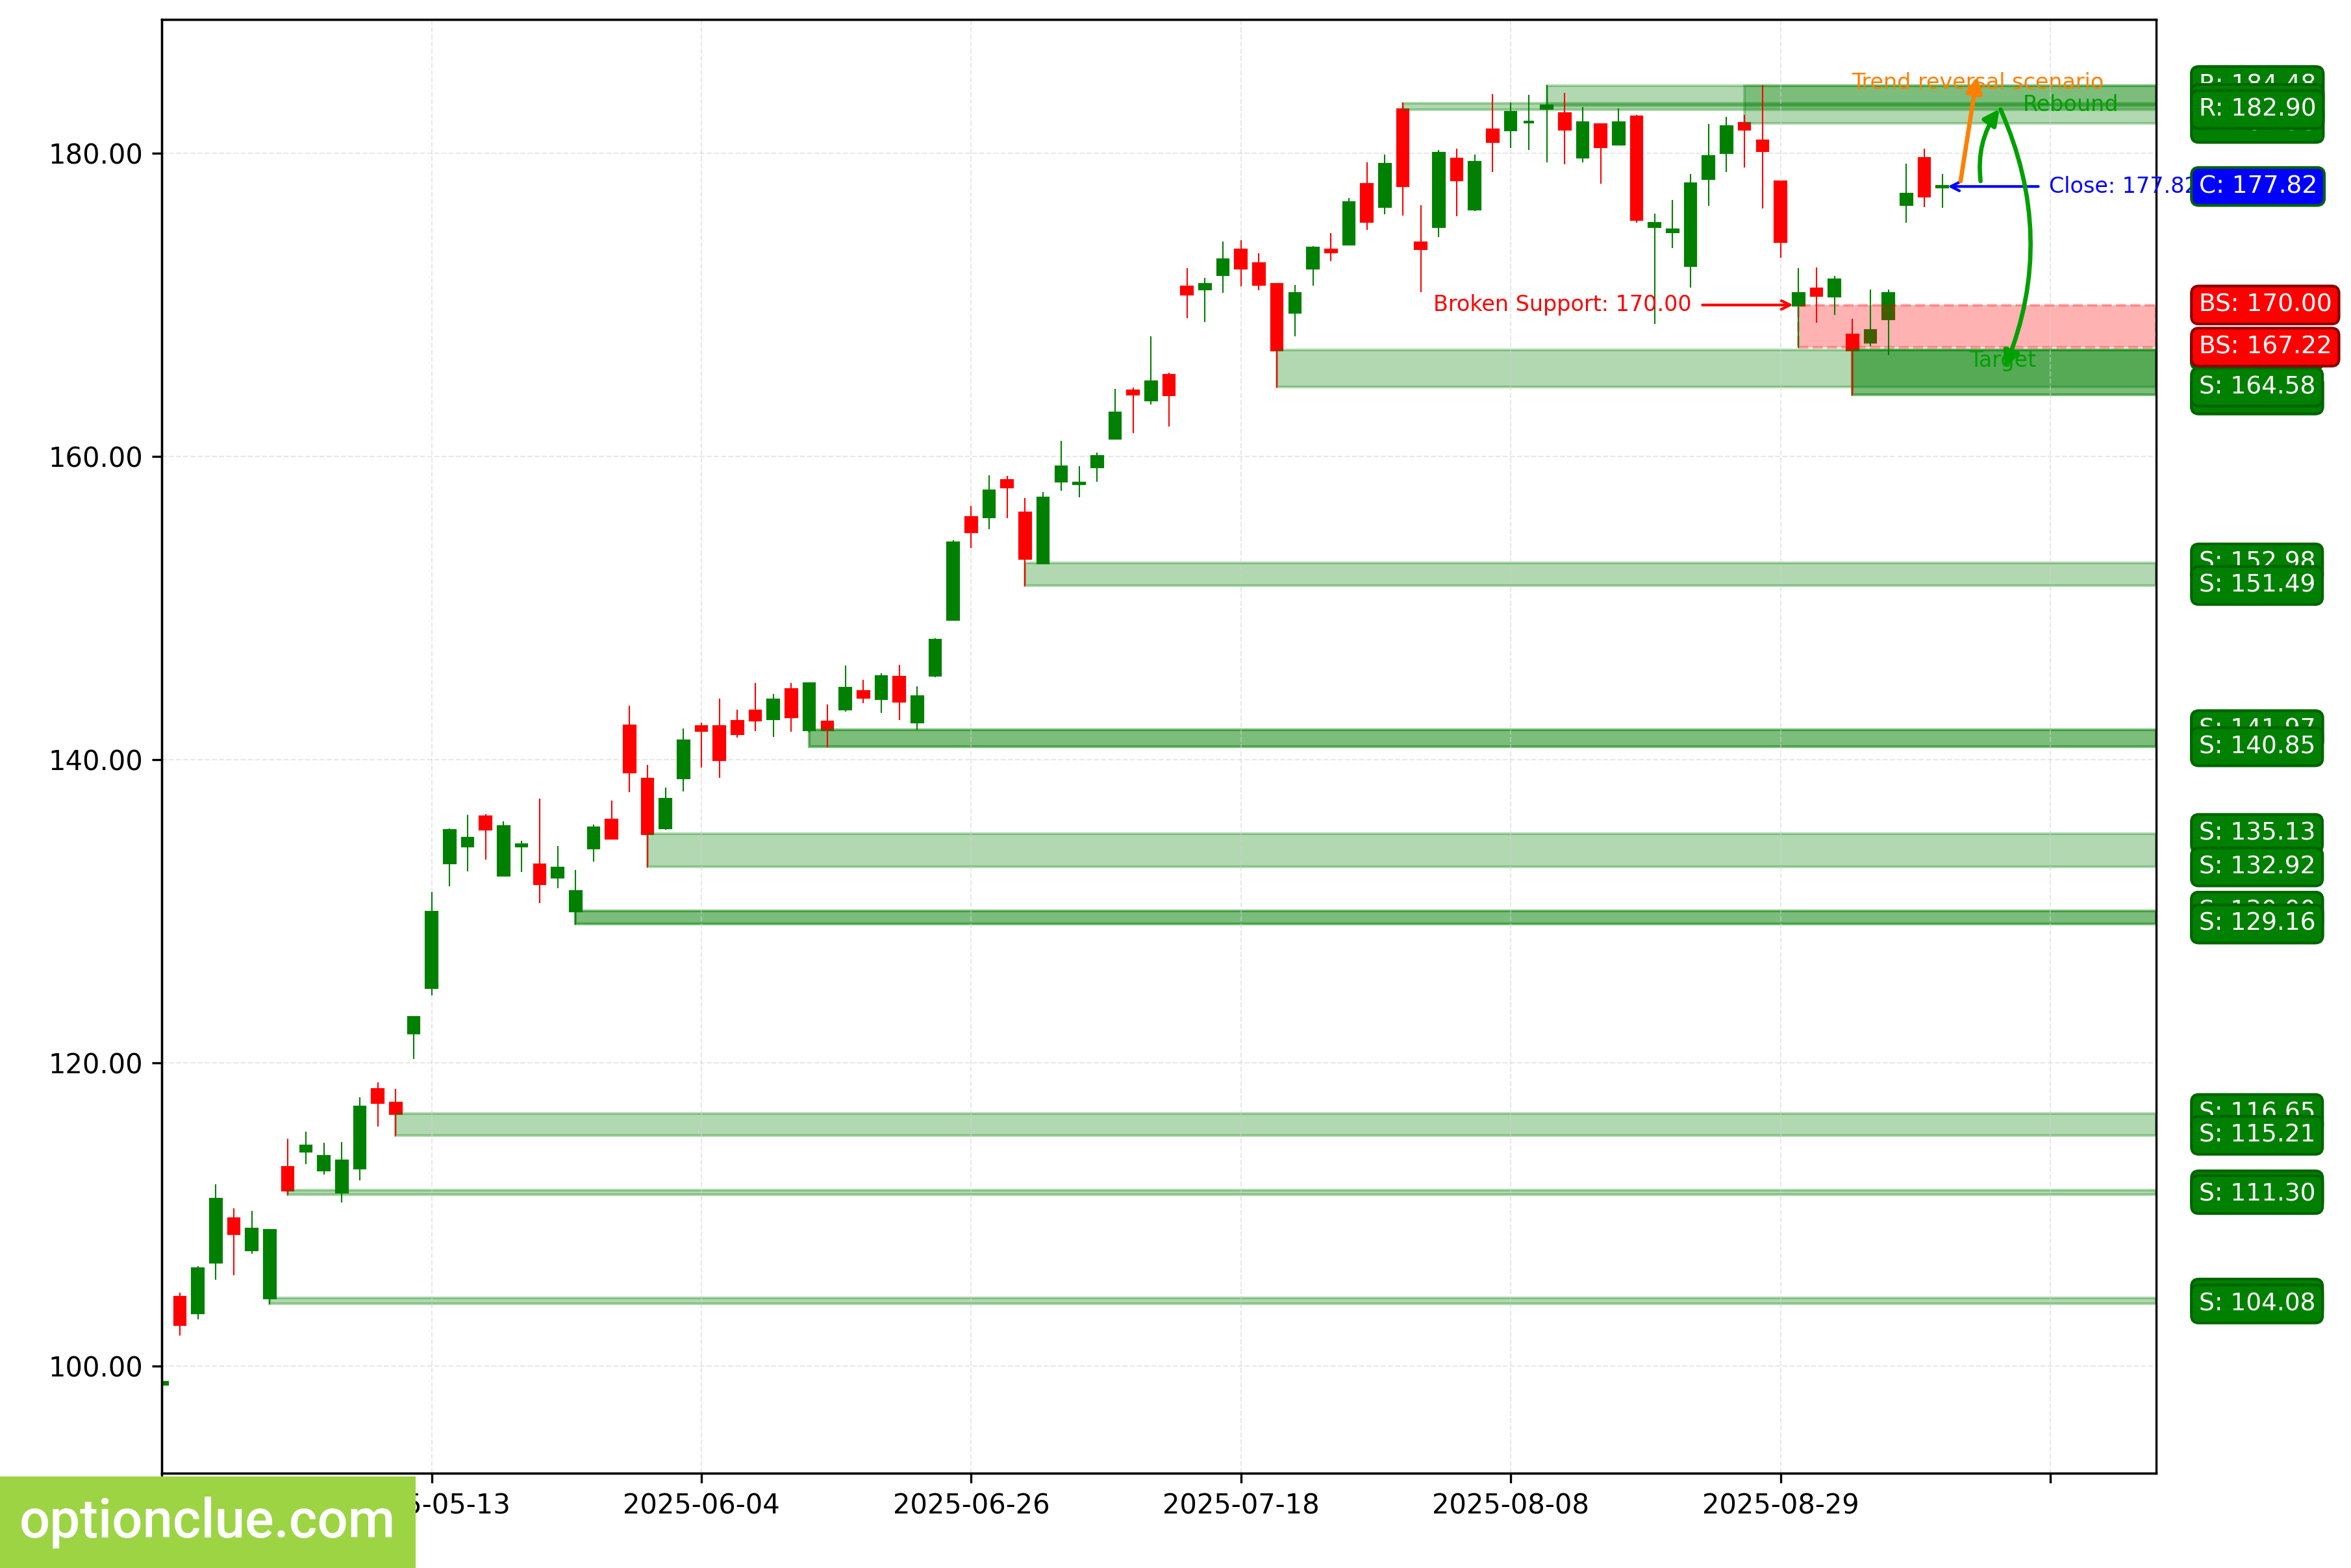
NVIDIA Corp (NVDA)
The market remains in a bearish trend; two days ago, a correction ended, a sell entry point on a rebound formed, and an impulse wave is developing. The intermediate target for the downward movement is the support level with boundaries at 164.07 – 167.02.
If the market corrects deeper—to the resistance level area (181.98 – 184.47)—then the potential reward/risk ratio on the daily timeframe could be around 5 or higher. If the trend develops successfully, a more distant target will be at the support level with boundaries at 151.49 – 152.98.
Short positions will remain relevant as long as the market stays below the resistance level of 181.98 – 184.47.
NVDA. Technical analysis. D1.
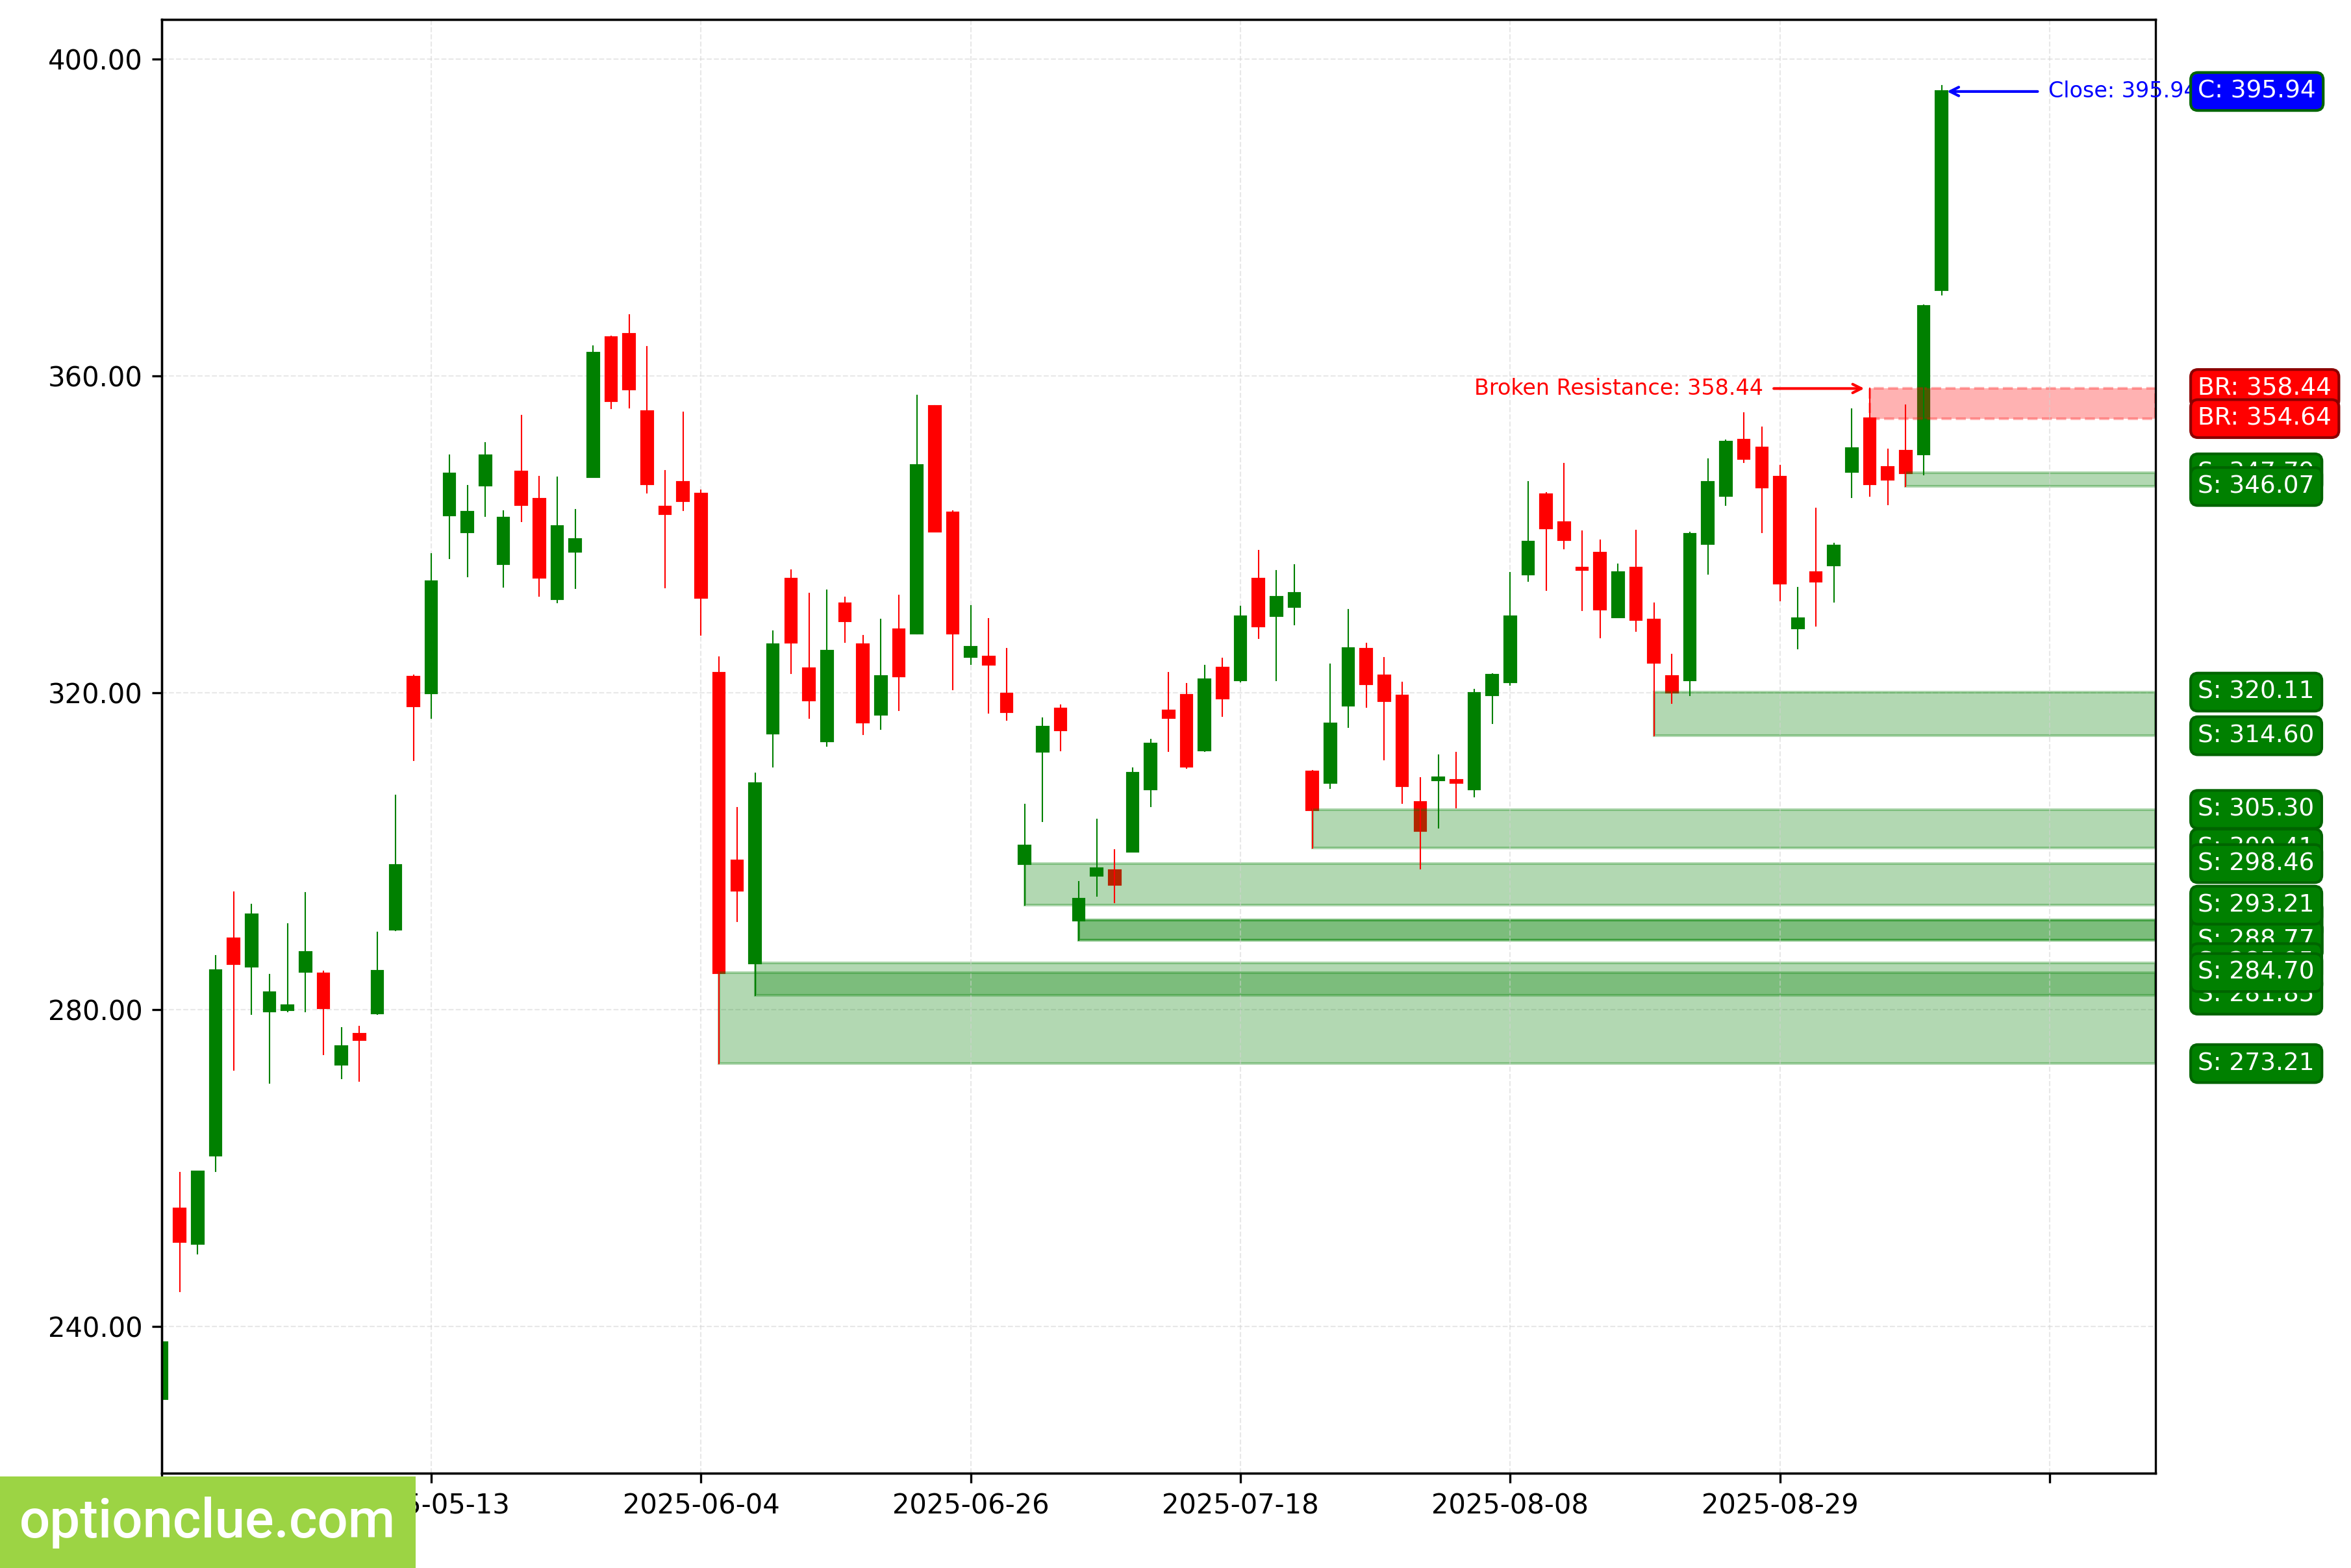
Tesla Inc (TSLA)
The trend is bullish; another impulse wave is developing. A buy entry point on a rebound will appear after a correction forms.
The first target is the resistance with boundaries at 410.78 – 419.99. If the trend develops successfully, a more distant target will be at the resistance level with boundaries at 465.16 – 465.33.
Buy signals will remain relevant as long as the market stays above the nearest daily timeframe support level with boundaries at 346.07 – 347.79.
TSLA. Technical analysis. D1.
Summary
In the medium term, only USDJPY demonstrates a favorable risk-to-reward ratio and a correction nearing completion on the daily timeframe. The other assets may be worth watching, depending on the depth of the market correction.