
We examine the most important levels on key financial instruments and likely scenarios for further developments.
Key Topics
- Euro (EURUSD)
- British Pound (GBPUSD)
- Swiss Franc (USDCHF)
- Japanese Yen (USDJPY)
- Canadian Dollar (USDCAD)
- Australian Dollar (AUDUSD)
- Bitcoin (BTC)
- Ether (ETH)
- Apple Inc (AAPL)
- NVIDIA Corp (NVDA)
- Tesla Inc (TSLA)
- Summary
Euro (EURUSD)
The bullish trend continues, the correction has recently completed, an impulse wave is developing. The last broken level is resistance (1.1590 — 1.1627). The breakout occurred 4 candlesticks ago.
The intermediate target for the upward movement is the resistance level with boundaries 1.1769 — 1.1796. If the trend develops successfully, the farther target will be at the resistance level with boundaries 1.1895 — 1.1929.
The potential profit/risk ratio from current prices when setting targets and fixing risks at daily timeframe levels may be small (approximately 0.1:1). Using the farther target — also small (approximately 0.5:1).
Long positions will remain relevant as long as the market is above the nearest support level with boundaries 1.1471 — 1.1521. If the market successfully closes below this support, the trend will reverse to the opposite (bearish).
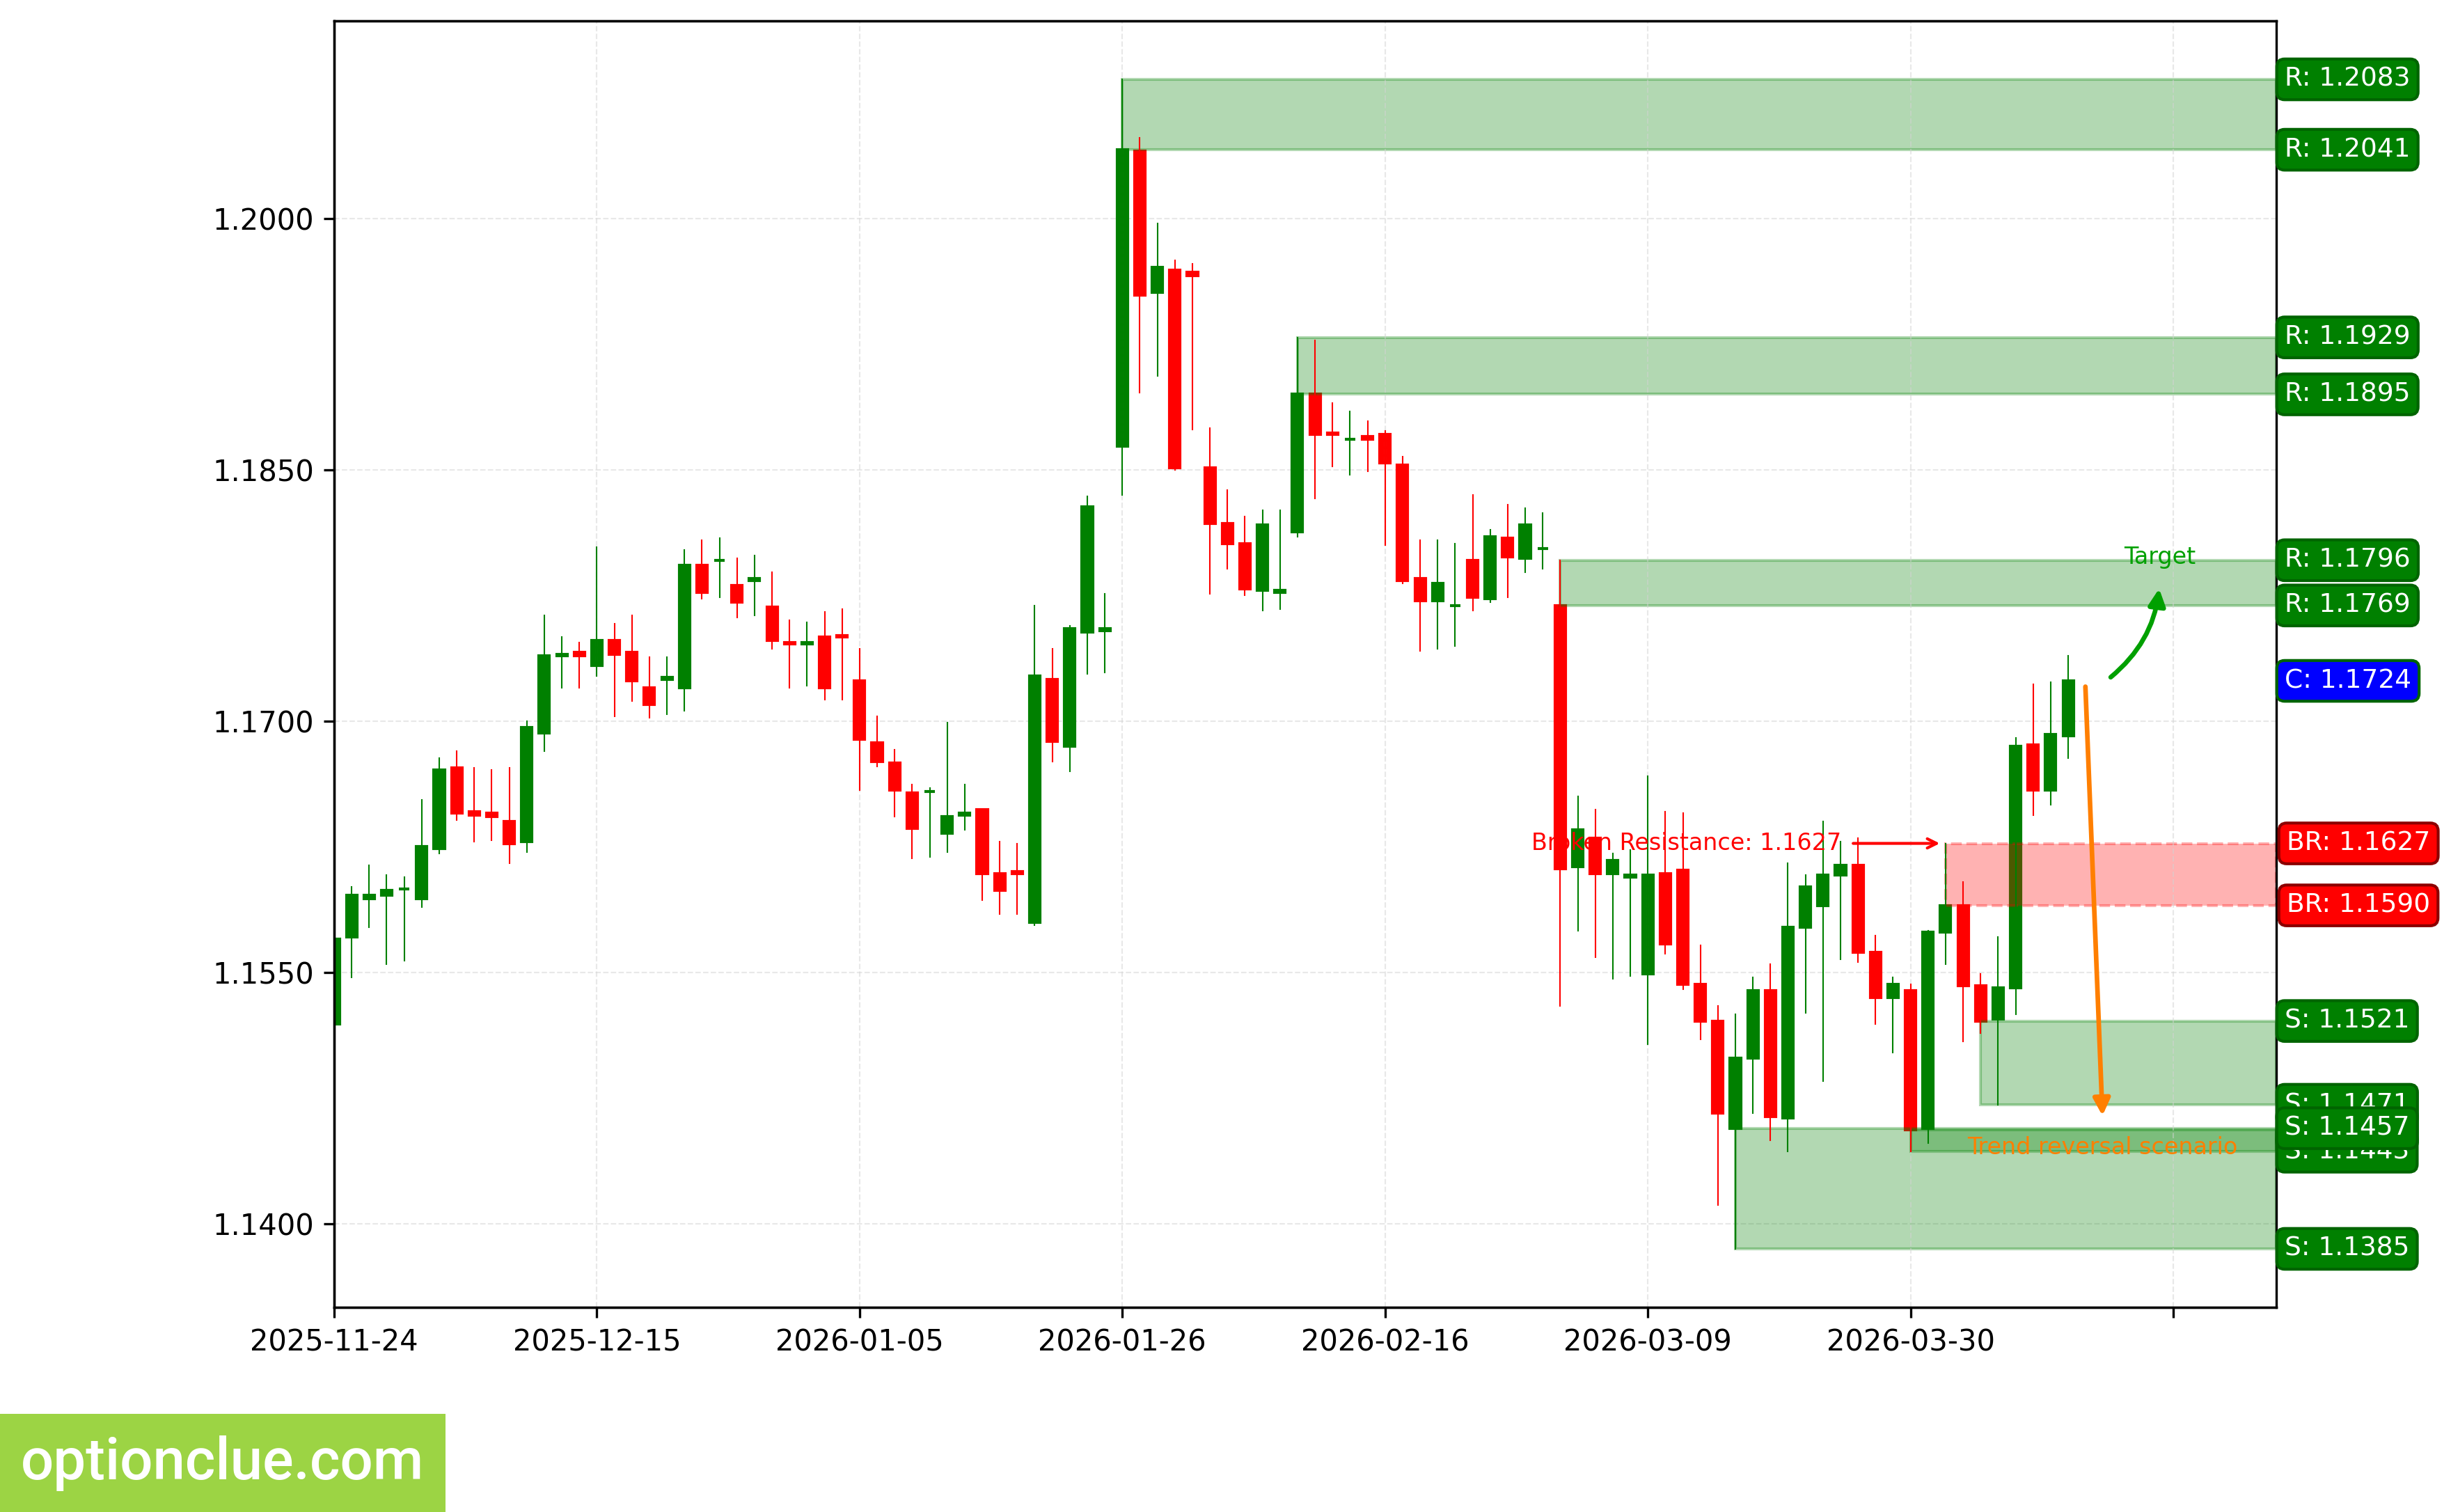
EURUSD. Technical analysis. D1.
British Pound (GBPUSD)
The trend has turned bullish, when the resistance level (1.3302 — 1.3347) was broken 4 candlesticks ago. An impulse wave is developing.
The intermediate target for the upward movement is the resistance level with boundaries 1.3653 — 1.3662. If the trend develops successfully, the farther target will be at the resistance level with boundaries 1.3827 — 1.3868.
The potential profit/risk ratio from current prices when setting targets and fixing risks at daily timeframe levels may be small (approximately 0.5:1). Using the farther target — also small (around 0.9:1). If the next correction completes near the support level (1.3156 — 1.3196), the potential profit/risk ratio may be approximately 3.4:1. Using the farther target — around 4.7:1. If the correction completes near the last broken level (1.3302 — 1.3347), the potential profit/risk ratio may be around 1.1:1. For the farther target — approximately 1.7:1.
Long positions will remain relevant as long as the market is above the nearest support level with boundaries 1.3156 — 1.3196. If the market successfully closes below this nearest support, the trend will reverse to the opposite (bearish).
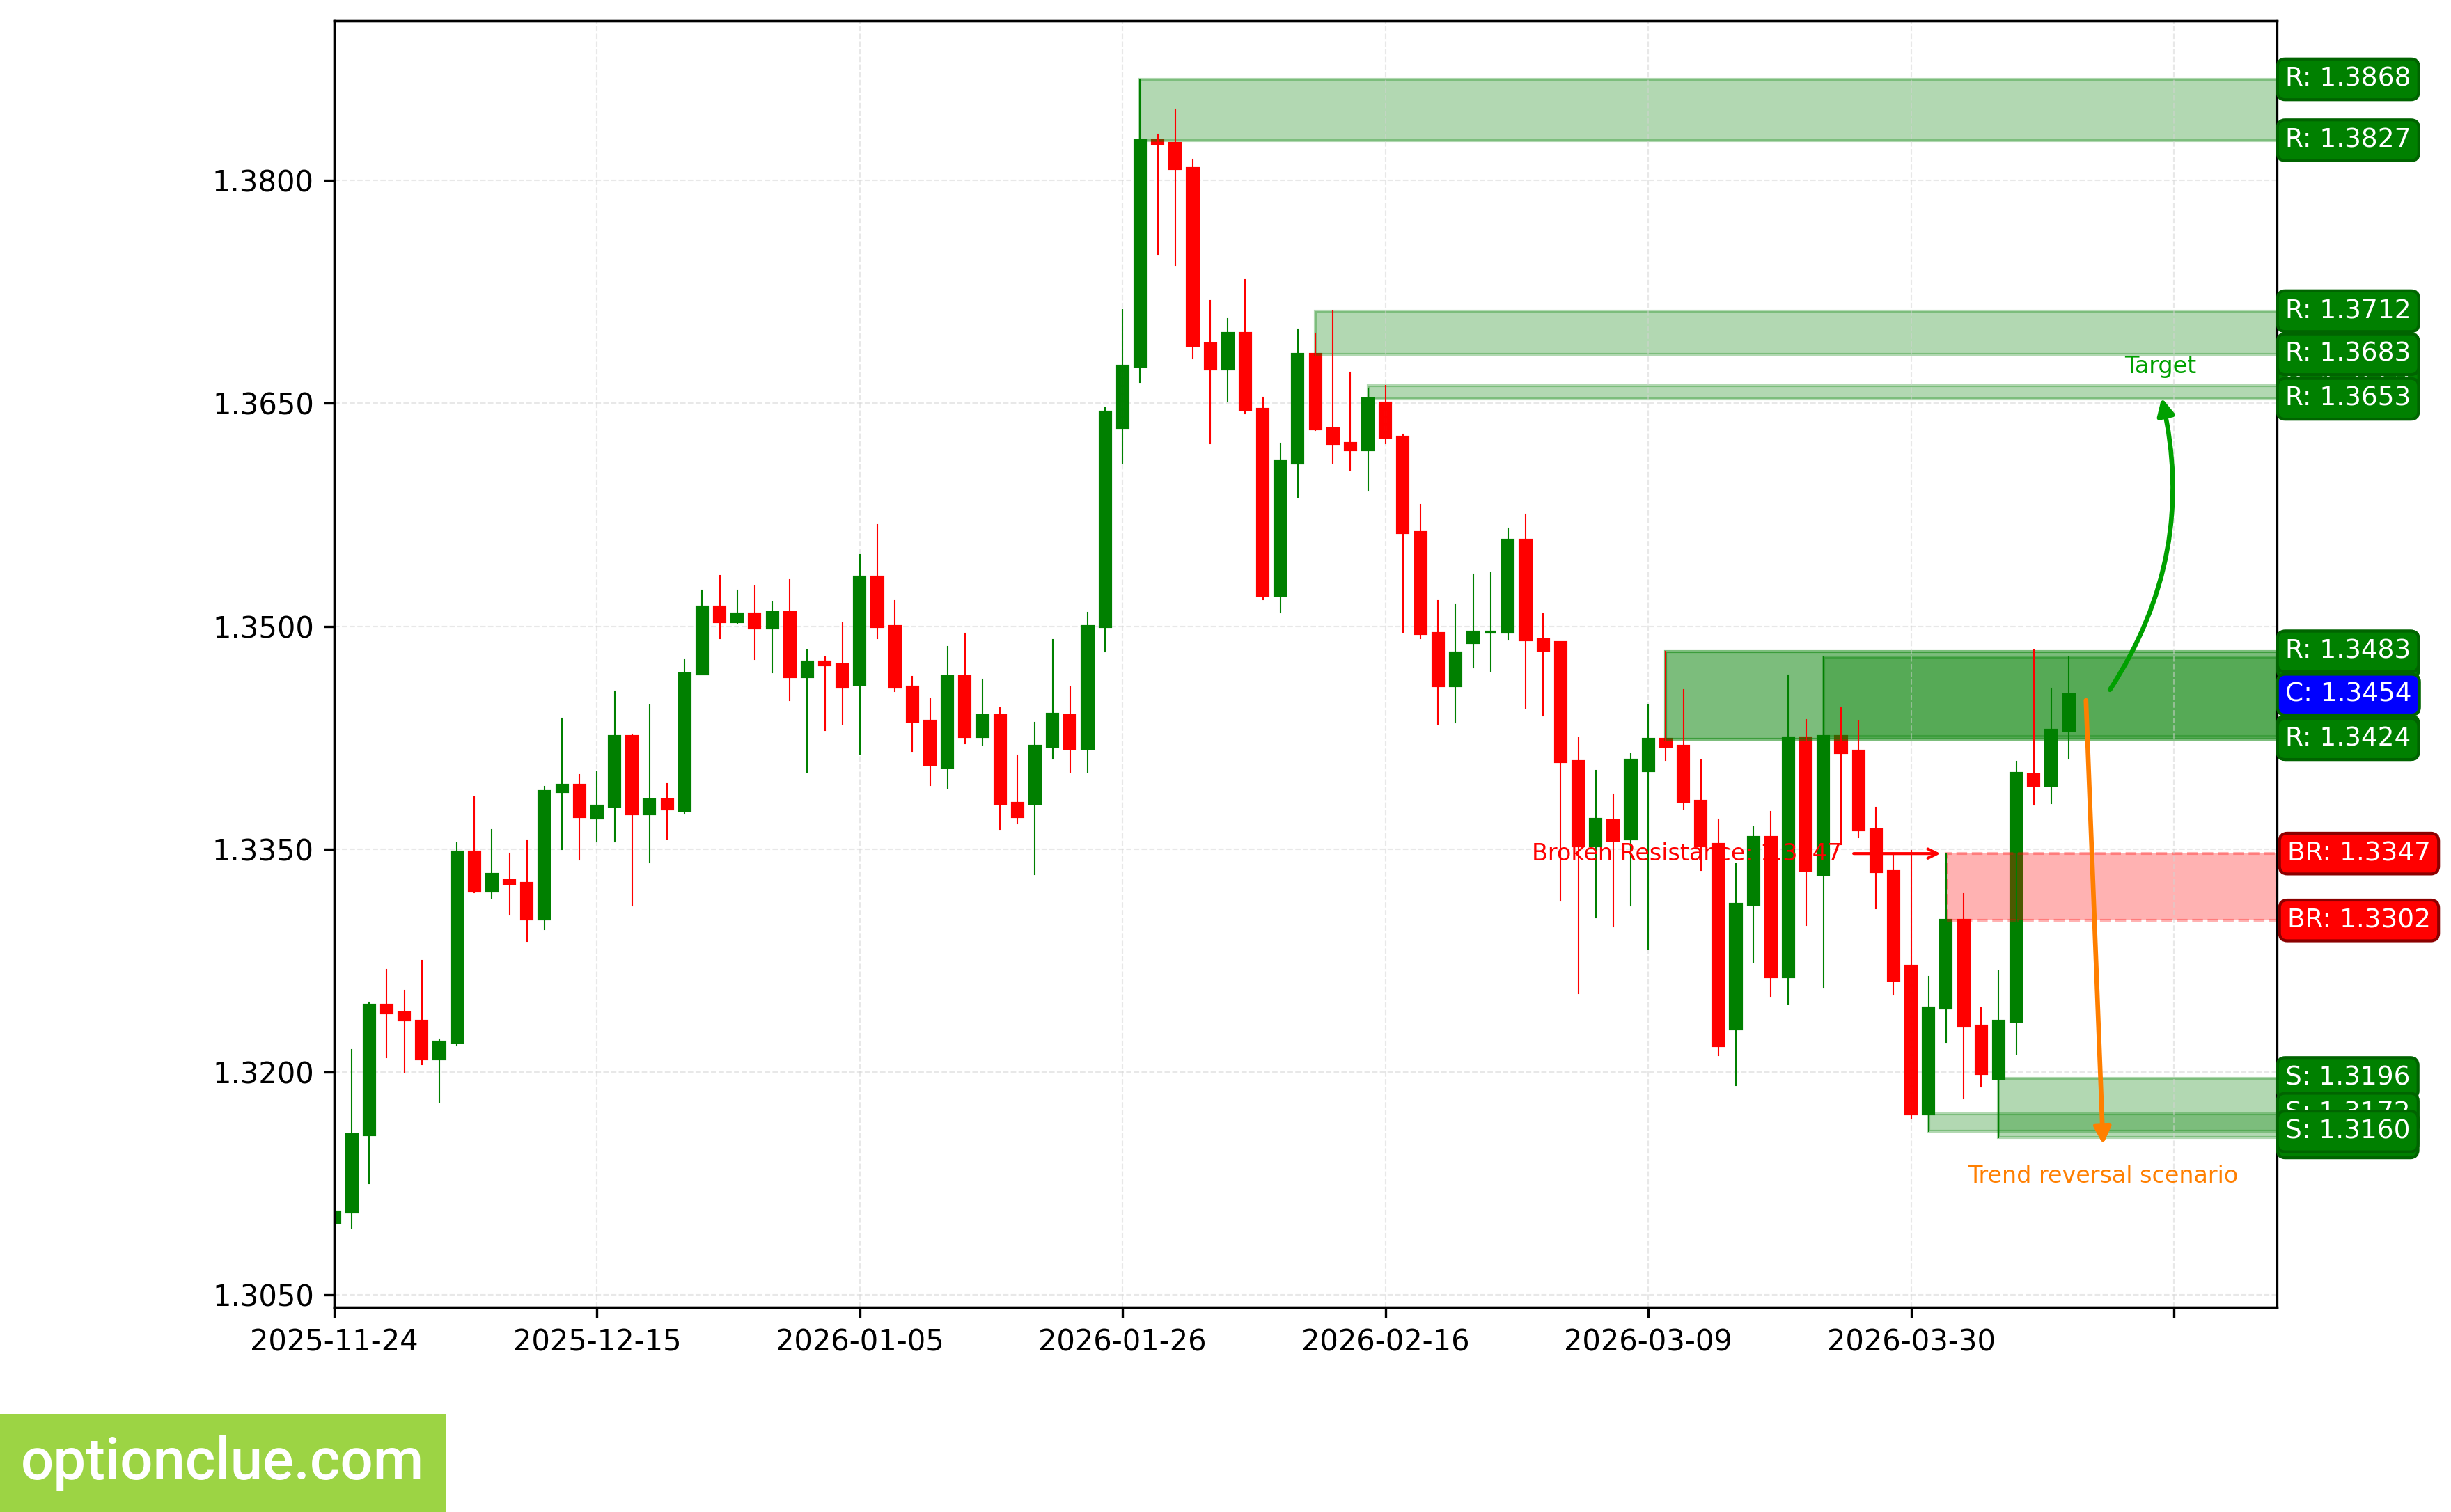
GBPUSD. Technical analysis. D1.
Swiss Franc (USDCHF)
The bullish trend continues, a corrective wave is developing. An entry point for buying on rebound may form after the current correction completes. The last broken level is resistance (0.7933 — 0.7957). The breakout occurred 11 candlesticks ago.
The intermediate target for the upward movement is the resistance level with boundaries 0.7995 — 0.8042. If the trend develops successfully, the farther target will be at the resistance level with boundaries 0.8087 — 0.8101.
If the correction completes near the support level (0.7832 — 0.7861), the potential profit/risk ratio may be around 1.7:1. Using the farther target — around 2.8:1.
Long positions will remain relevant as long as the market is above the nearest support level with boundaries 0.7832 — 0.7861. If the market successfully closes below this support, the trend will reverse to the opposite (bearish).
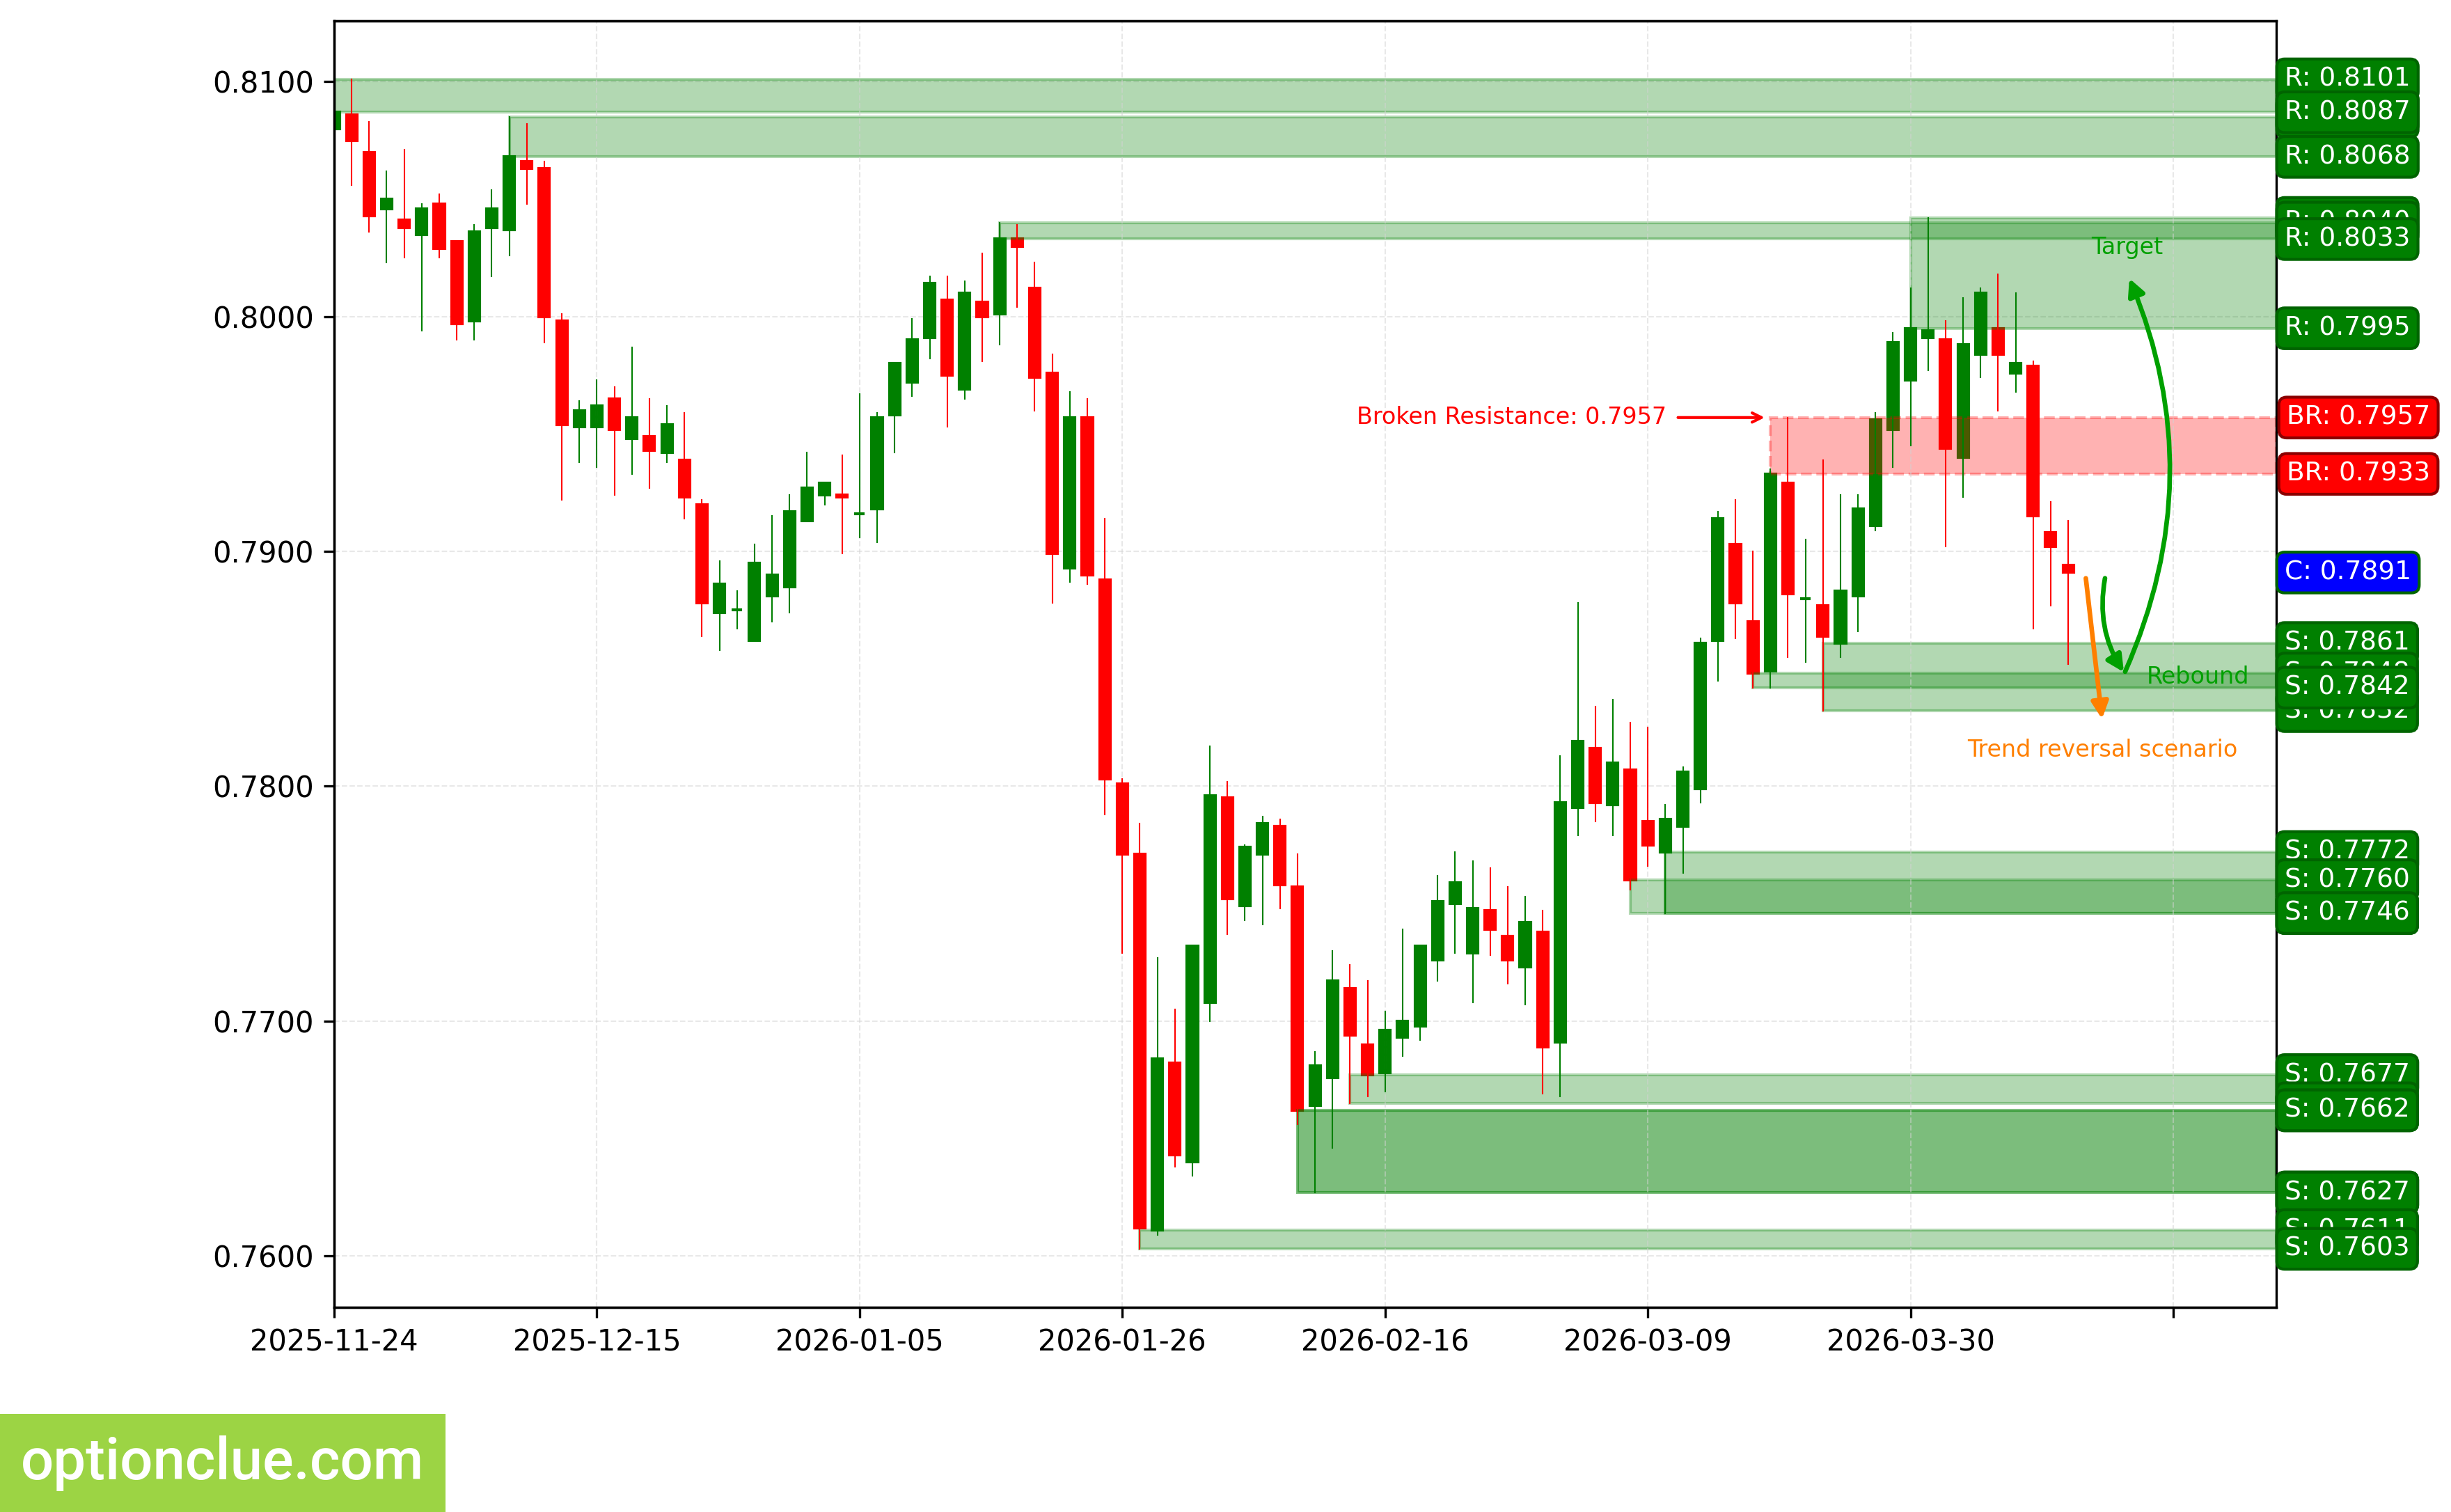
USDCHF. Technical analysis. D1.
Japanese Yen (USDJPY)
The bullish trend continues, 2 candlesticks ago the correction likely completed, an impulse wave is developing. The last broken level is resistance (159.74 — 159.89). The breakout occurred 11 candlesticks ago.
The intermediate target for the upward movement is the resistance level with boundaries 160.27 — 160.46.
The potential profit/risk ratio from current prices when setting targets and fixing risks at daily timeframe levels may be small (approximately 0.4:1).
Long positions will remain relevant as long as the market remains above the nearest support level with boundaries 157.90 — 158.66. If the market successfully closes below this support, the trend will reverse to the opposite (bearish).
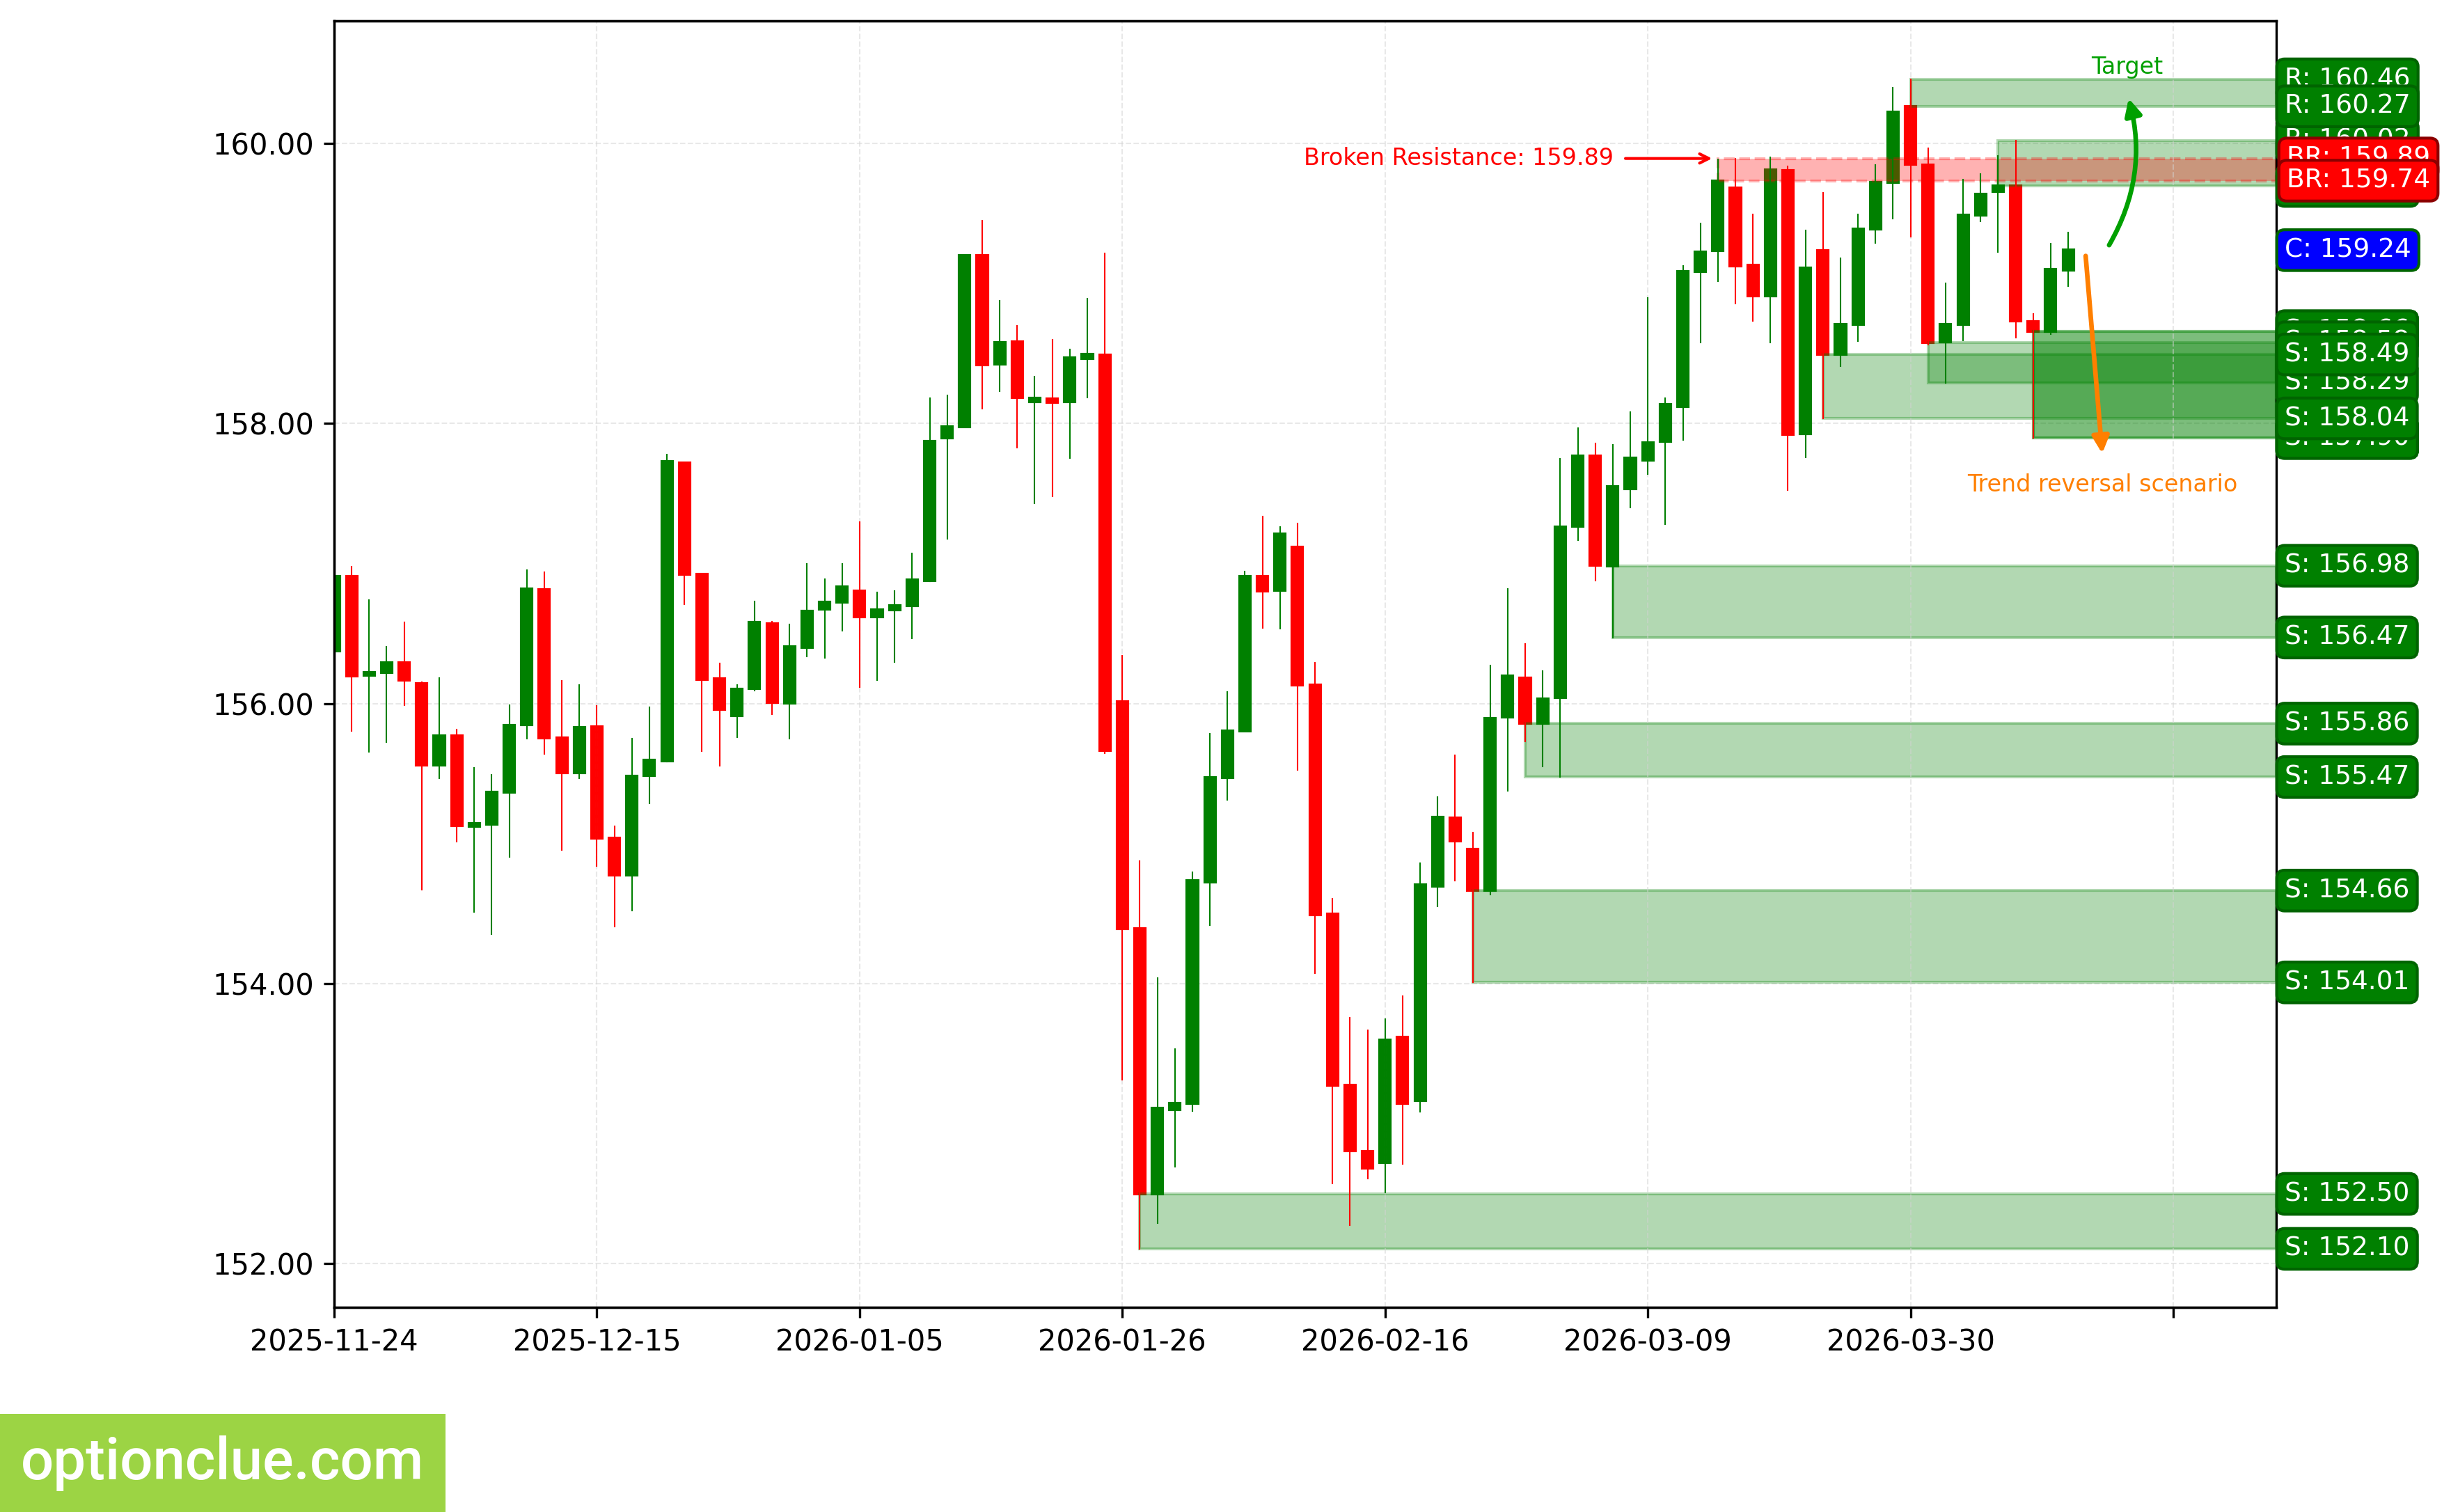
USDJPY. Technical analysis. D1.
Canadian Dollar (USDCAD)
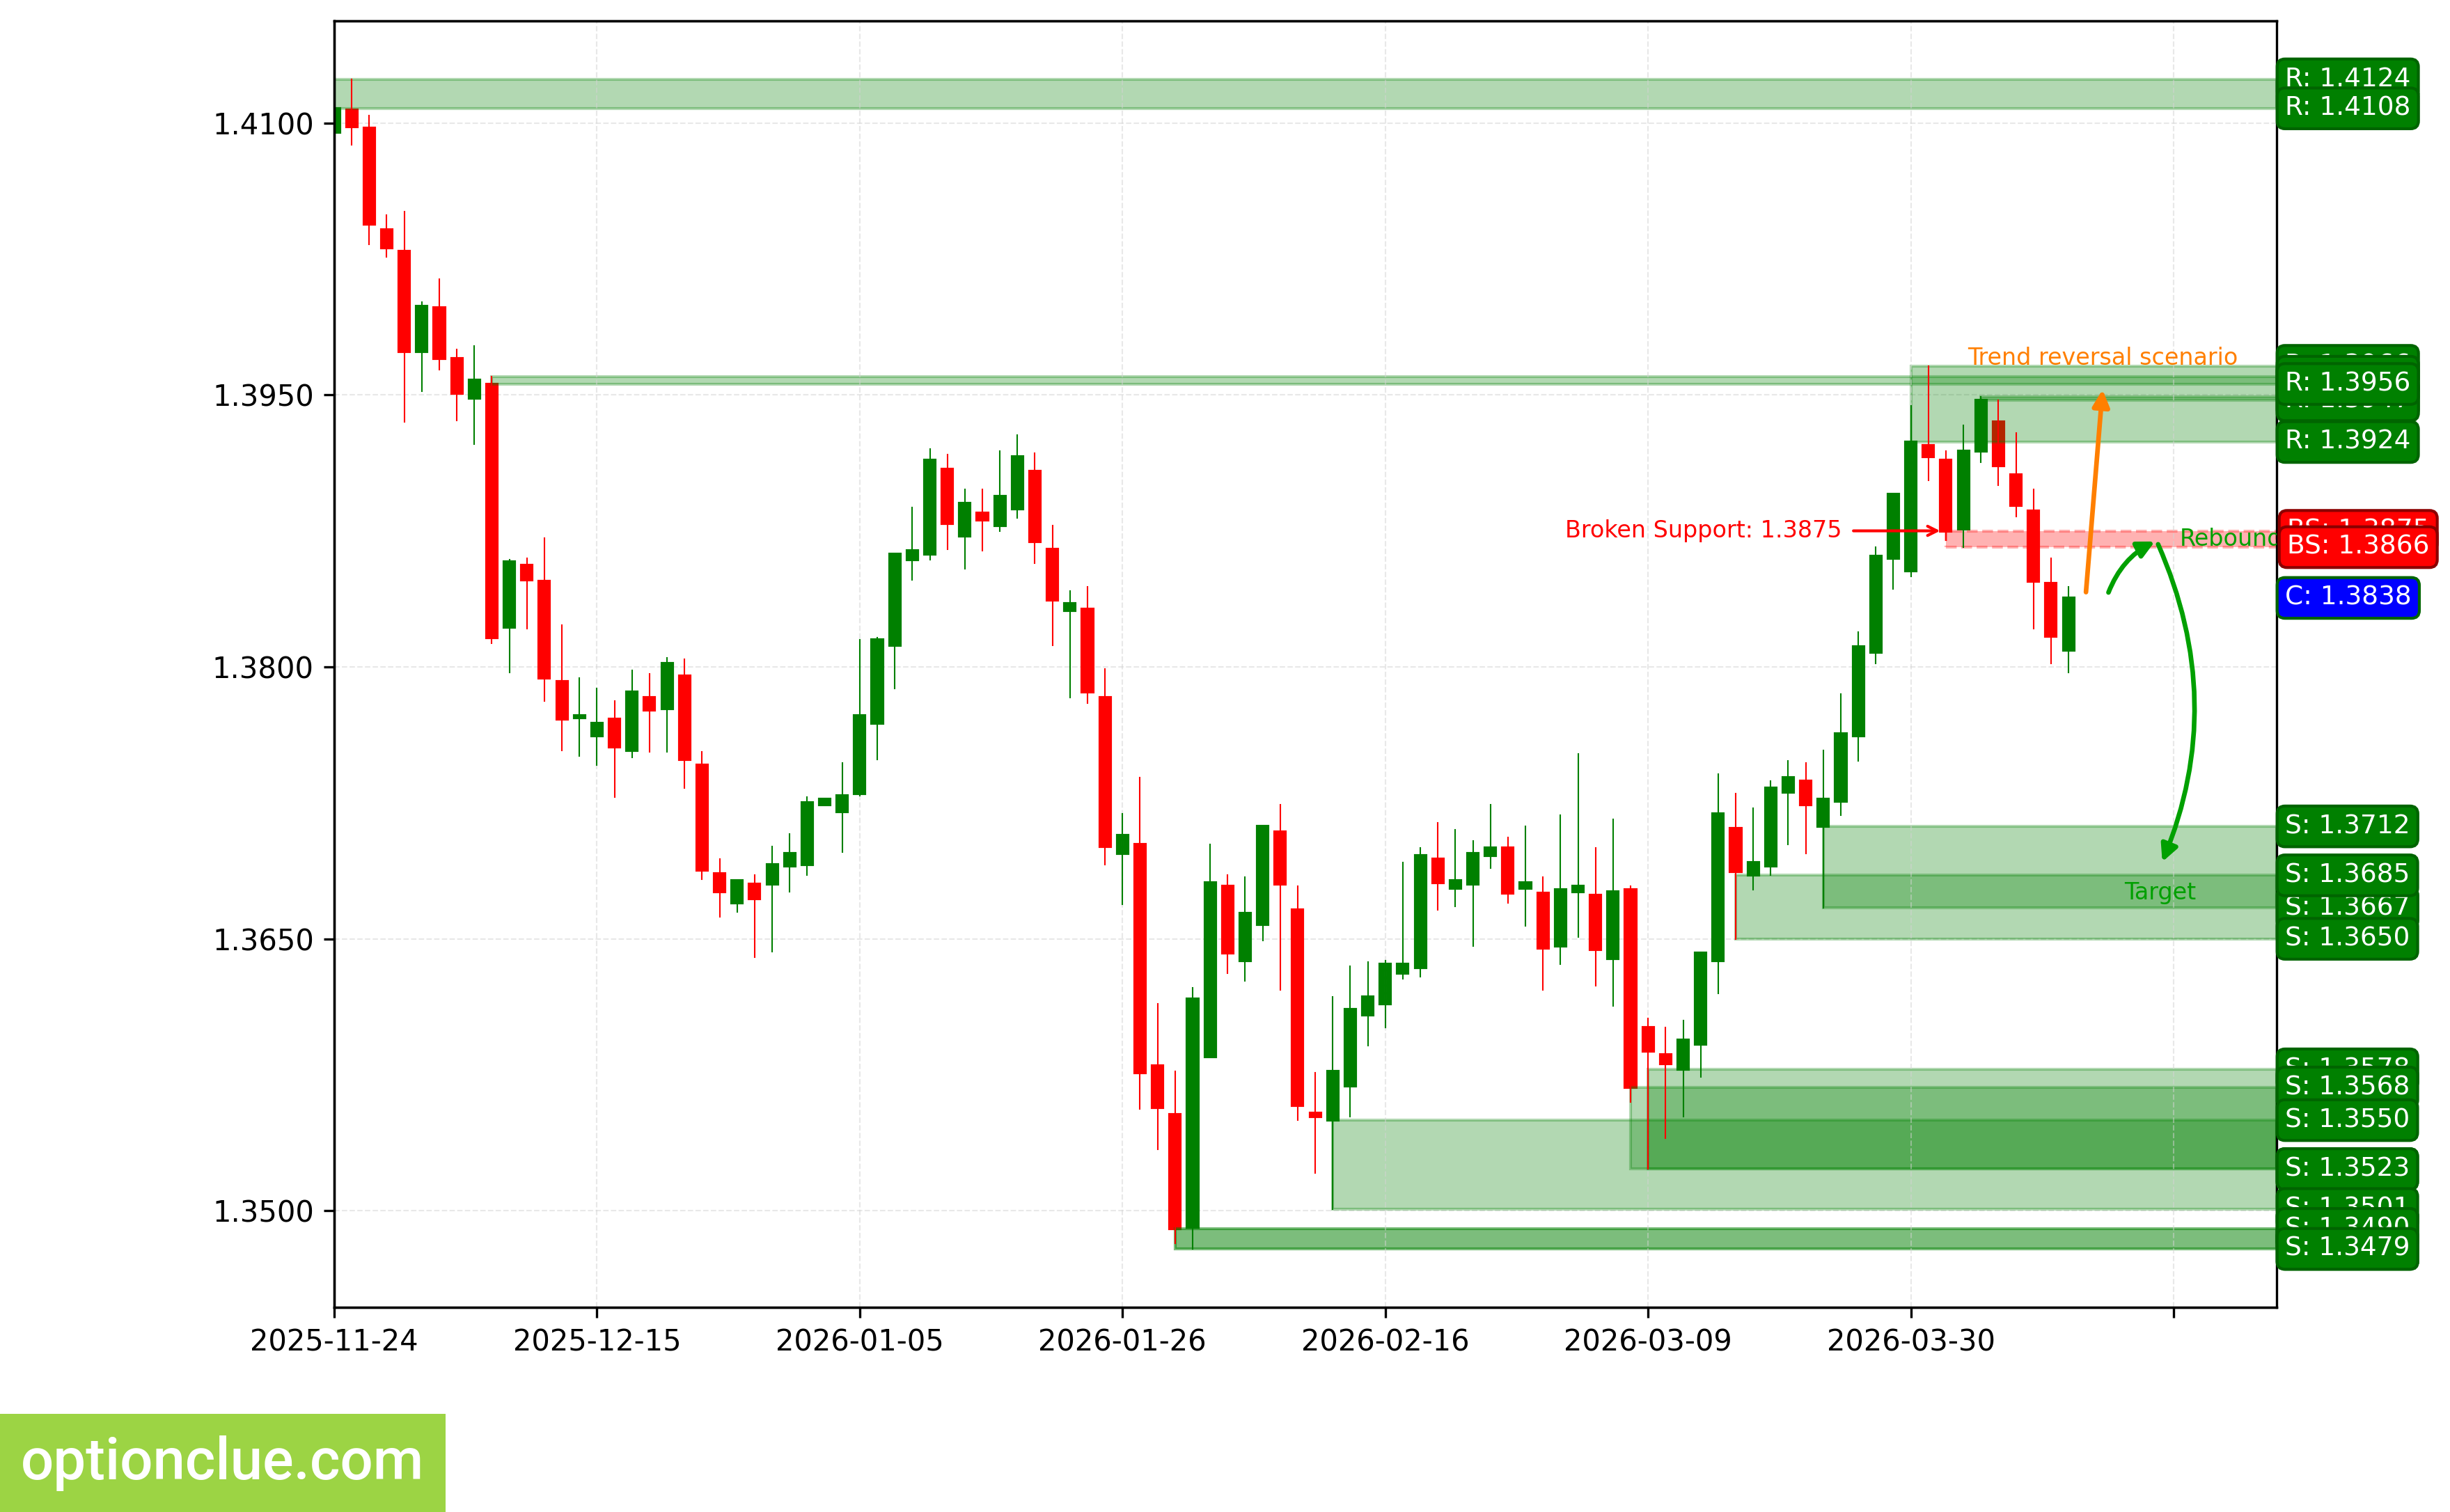
The trend has turned bearish 3 candlesticks ago, when the support level (1.3866 — 1.3875) was broken. A corrective wave is developing. An entry point for selling on rebound may form after the current correction completes.
The intermediate target for the downward movement is the support level with boundaries 1.3667 — 1.3712. If the trend develops successfully, the farther target will be at the support level with boundaries 1.3523 — 1.3578.
The potential profit/risk ratio from current prices when setting targets and fixing risks at daily timeframe levels may be small (approximately 0.7:1). Using the farther target — approximately 1.4:1. If the correction completes near the resistance level (1.3947 — 1.3949), the potential profit/risk ratio may be around 3.2:1. For the farther target — around 4.9:1. If the correction completes near the last broken level (1.3866 — 1.3875), the potential profit/risk ratio may be around 1:1. Using the farther target — approximately 1.9:1.
Short positions will remain relevant as long as the market remains below the nearest resistance level with boundaries 1.3947 — 1.3949. If the market successfully closes above this nearest resistance, the trend will reverse to the opposite (bullish).
USDCAD. Technical analysis. D1.
Australian Dollar (AUDUSD)
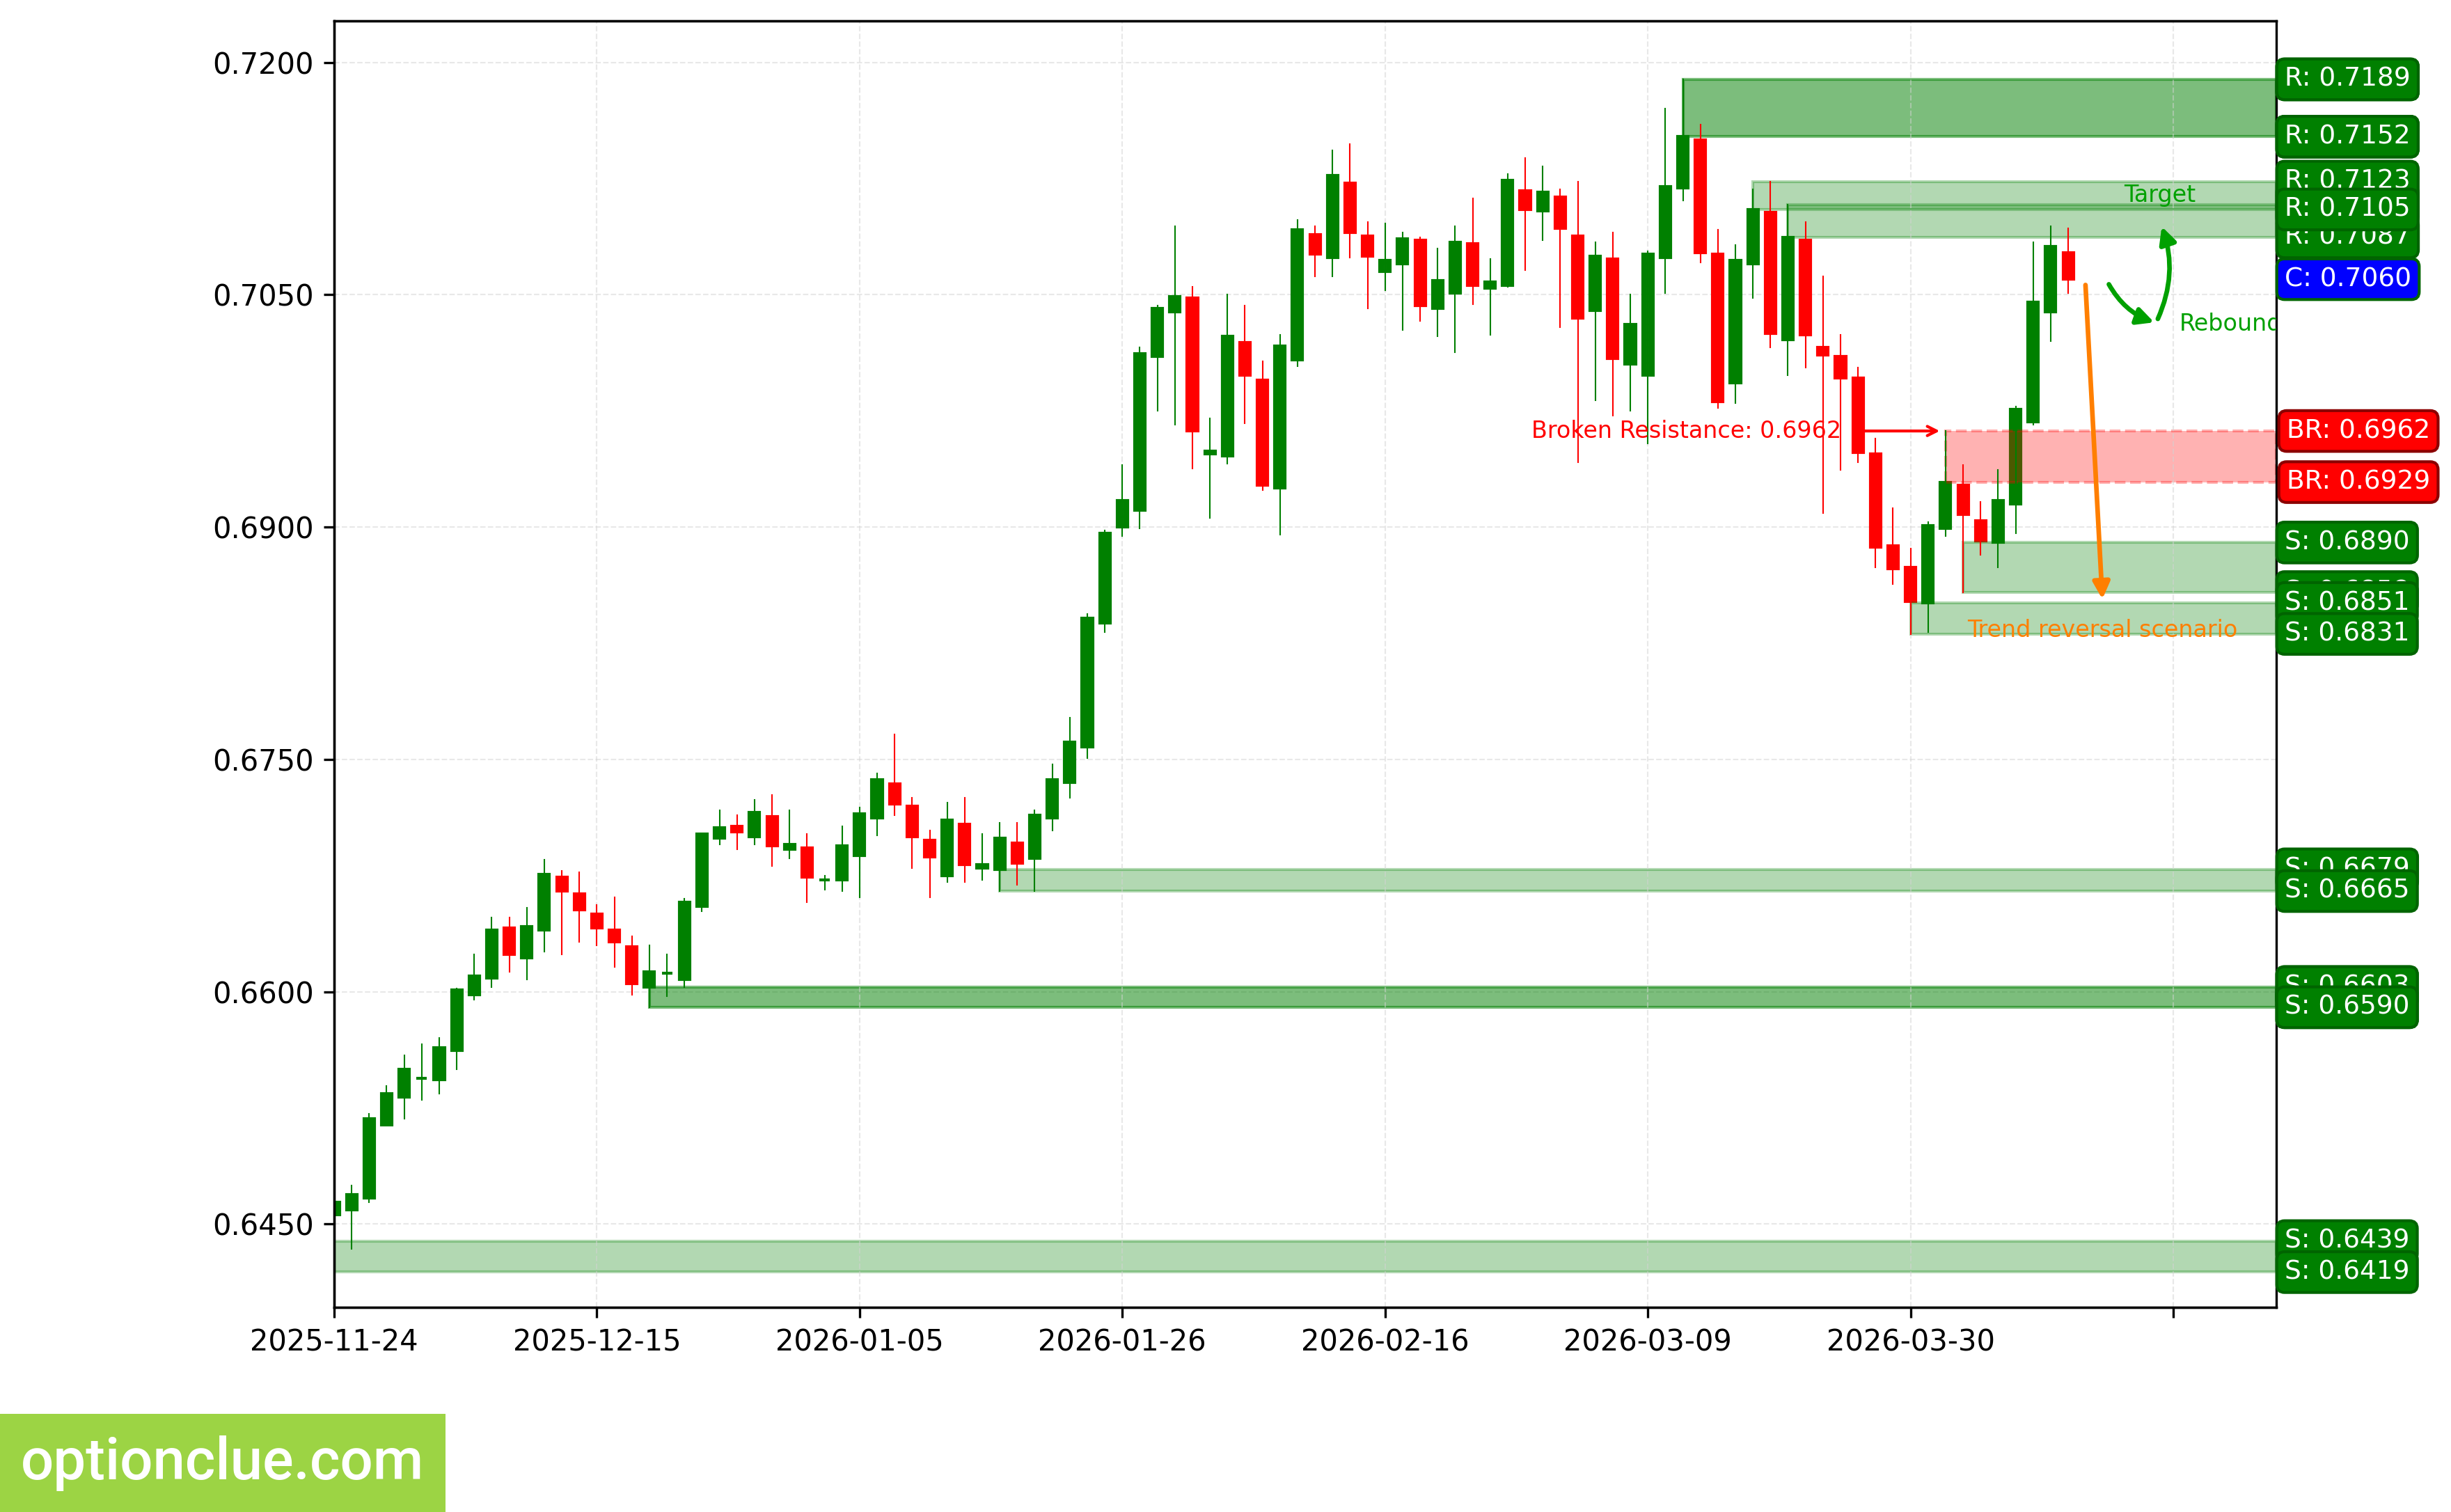
The trend has turned bullish, when the resistance level (0.6929 — 0.6962) was broken 4 candlesticks ago. A corrective wave is developing. An entry point for buying on rebound may form after the current correction completes.
The intermediate target for the upward movement is the resistance level with boundaries 0.7087 — 0.7108.
The potential profit/risk ratio from current prices when setting targets and fixing risks at daily timeframe levels may be small (approximately 0.1:1). If the correction completes near the support level (0.6858 — 0.6890), the potential profit/risk ratio may be approximately 2:1. If the correction completes near the last broken level (0.6929 — 0.6962), the potential profit/risk ratio may be insignificant (around 0.9:1).
Long positions will remain relevant as long as the market is above the nearest support level with boundaries 0.6858 — 0.6890. If the market successfully closes below this support, the trend will reverse to the opposite (bearish).
AUDUSD. Technical analysis. D1.
Bitcoin (BTC)
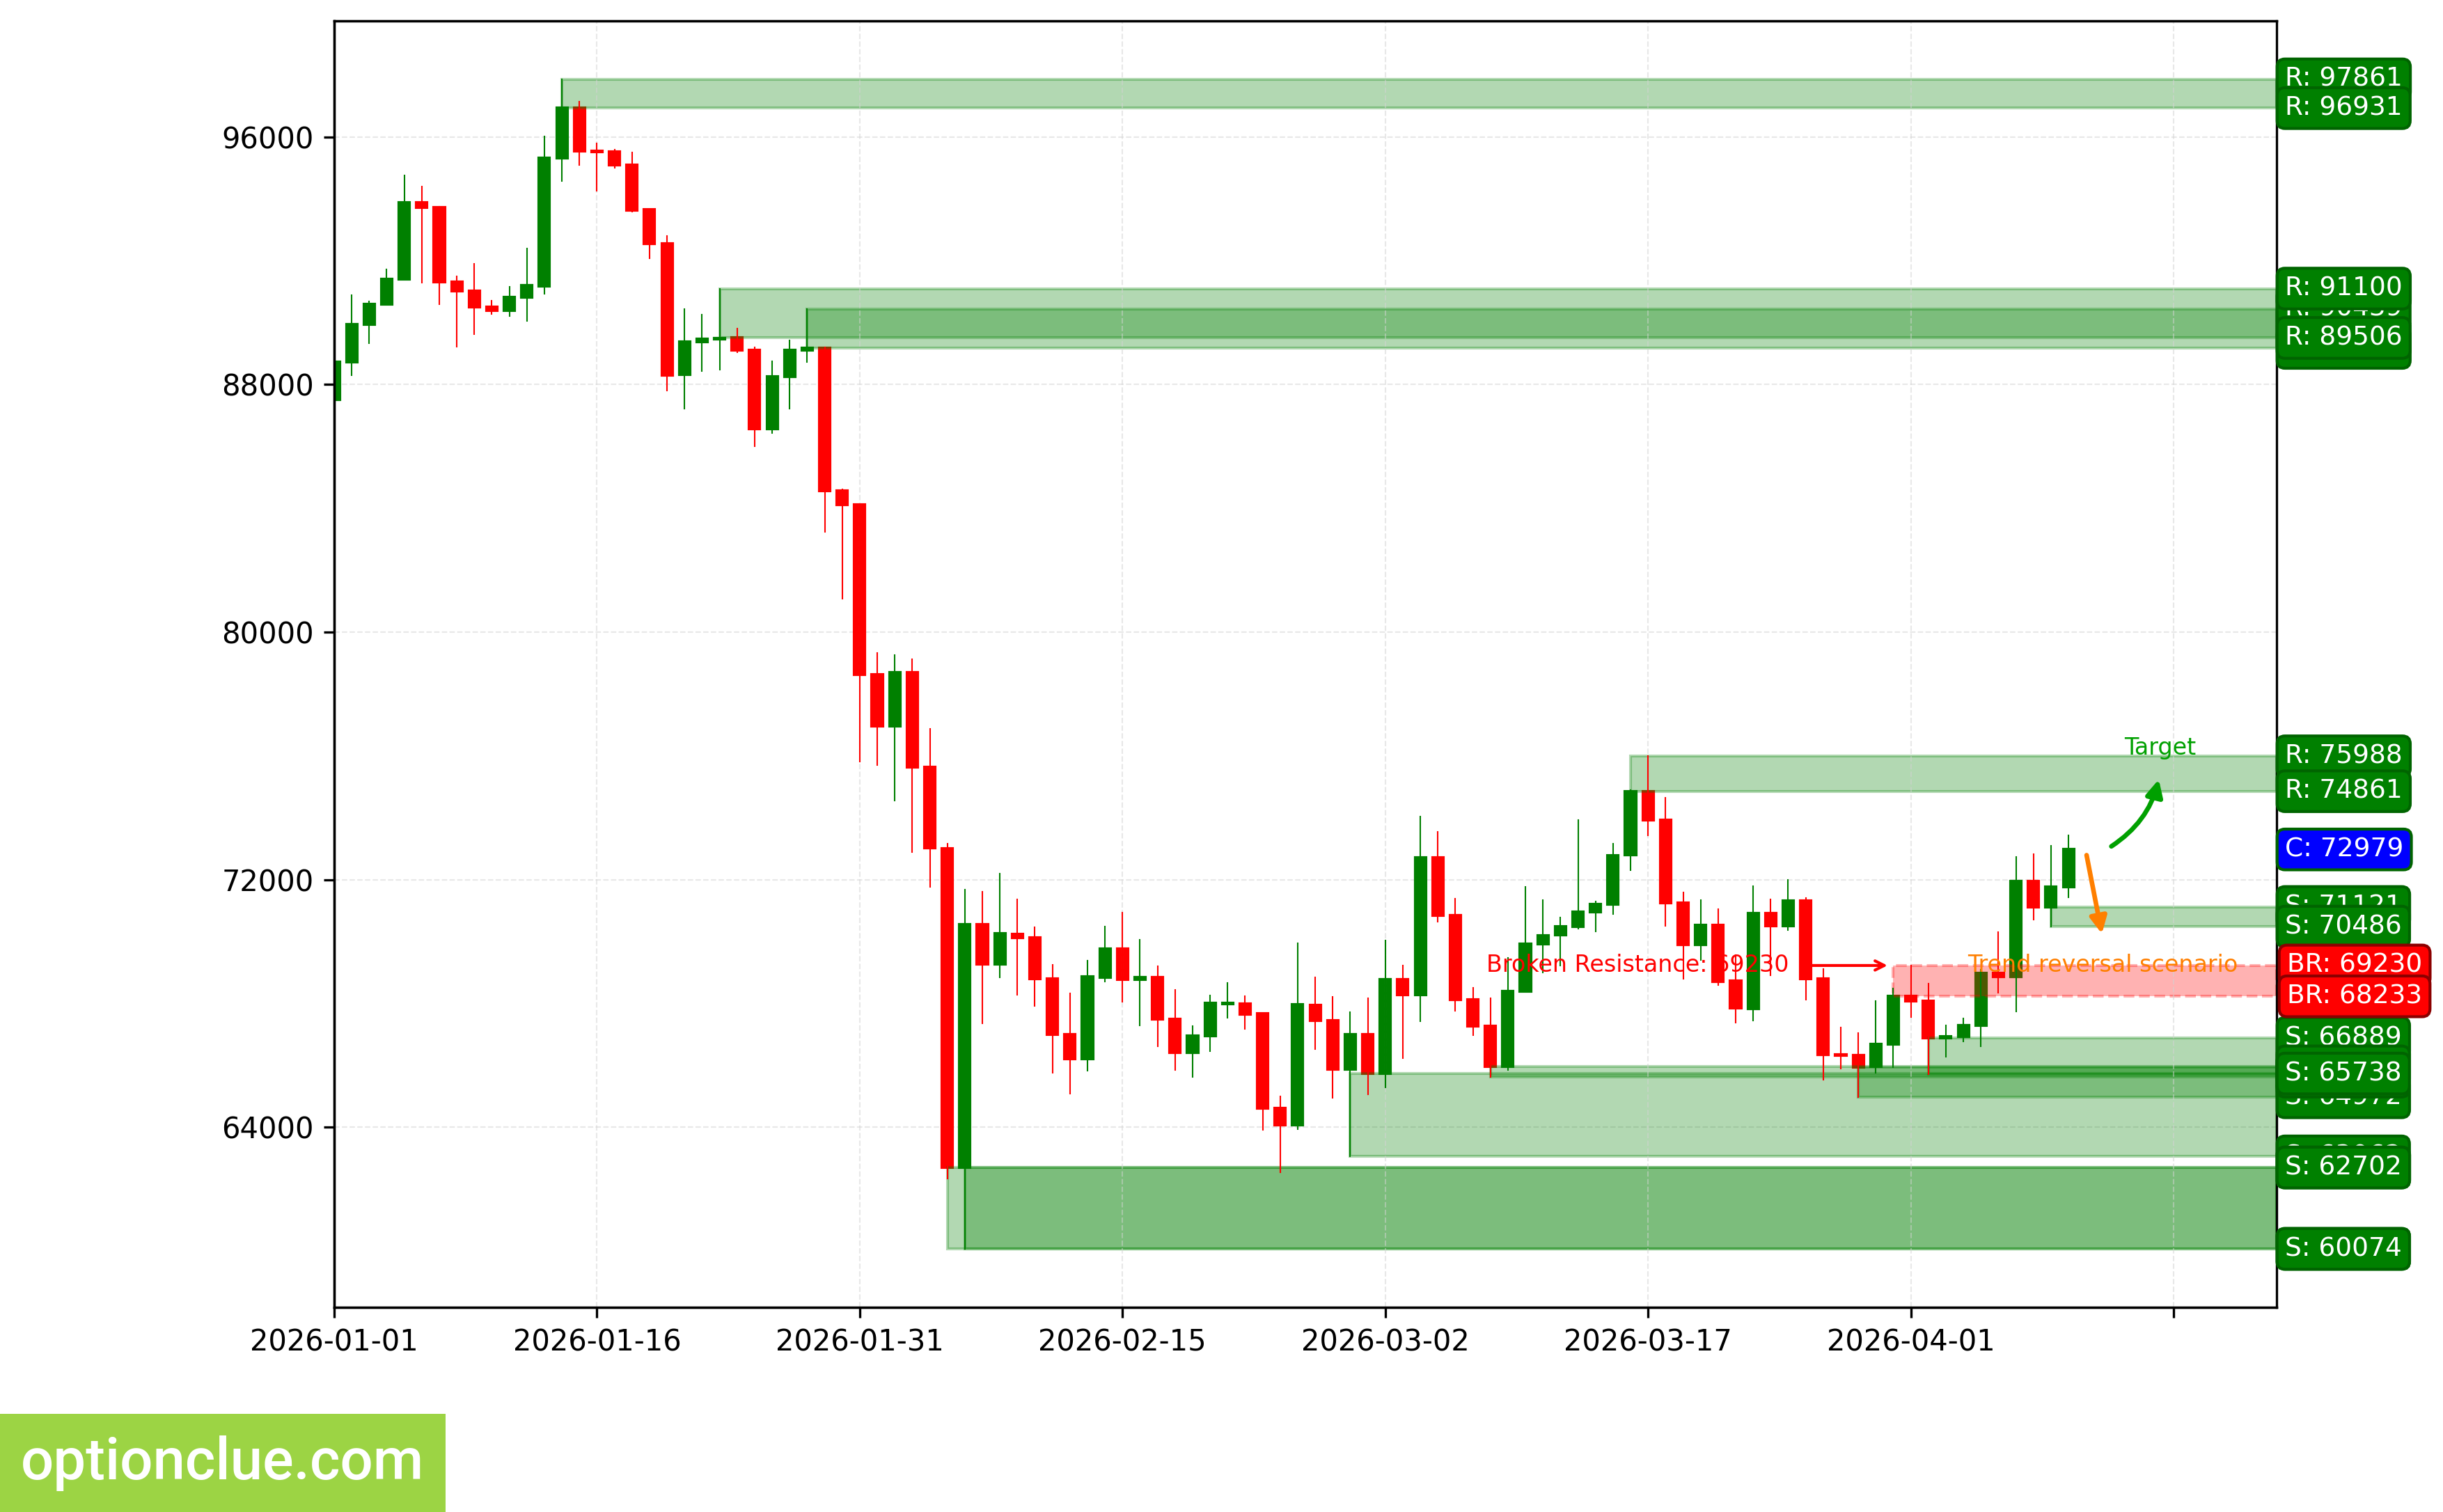
The trend has turned bullish, when the resistance level (68233 — 69230) was broken. The breakout occurred 4 candlesticks ago. An impulse wave is developing.
The intermediate target for the upward movement is the resistance level with boundaries 74861 — 75988. If the trend develops successfully, the farther target will be at the resistance level with boundaries 89185 — 90439.
The potential profit/risk ratio from current prices when setting targets and fixing risks at daily timeframe levels may be small (around 0.4:1). Using the farther target — approximately 3:1. If the new correction completes near the support level (70486 — 71121), the potential profit/risk ratio may be around 1.6:1. Using the farther target — around 7:1.
Long positions will remain relevant as long as the market remains above the nearest support level with boundaries 70486 — 71121. If the market successfully closes below this support, the trend will reverse to the opposite (bearish).
BTC. Technical analysis. D1.
Ether (ETH)
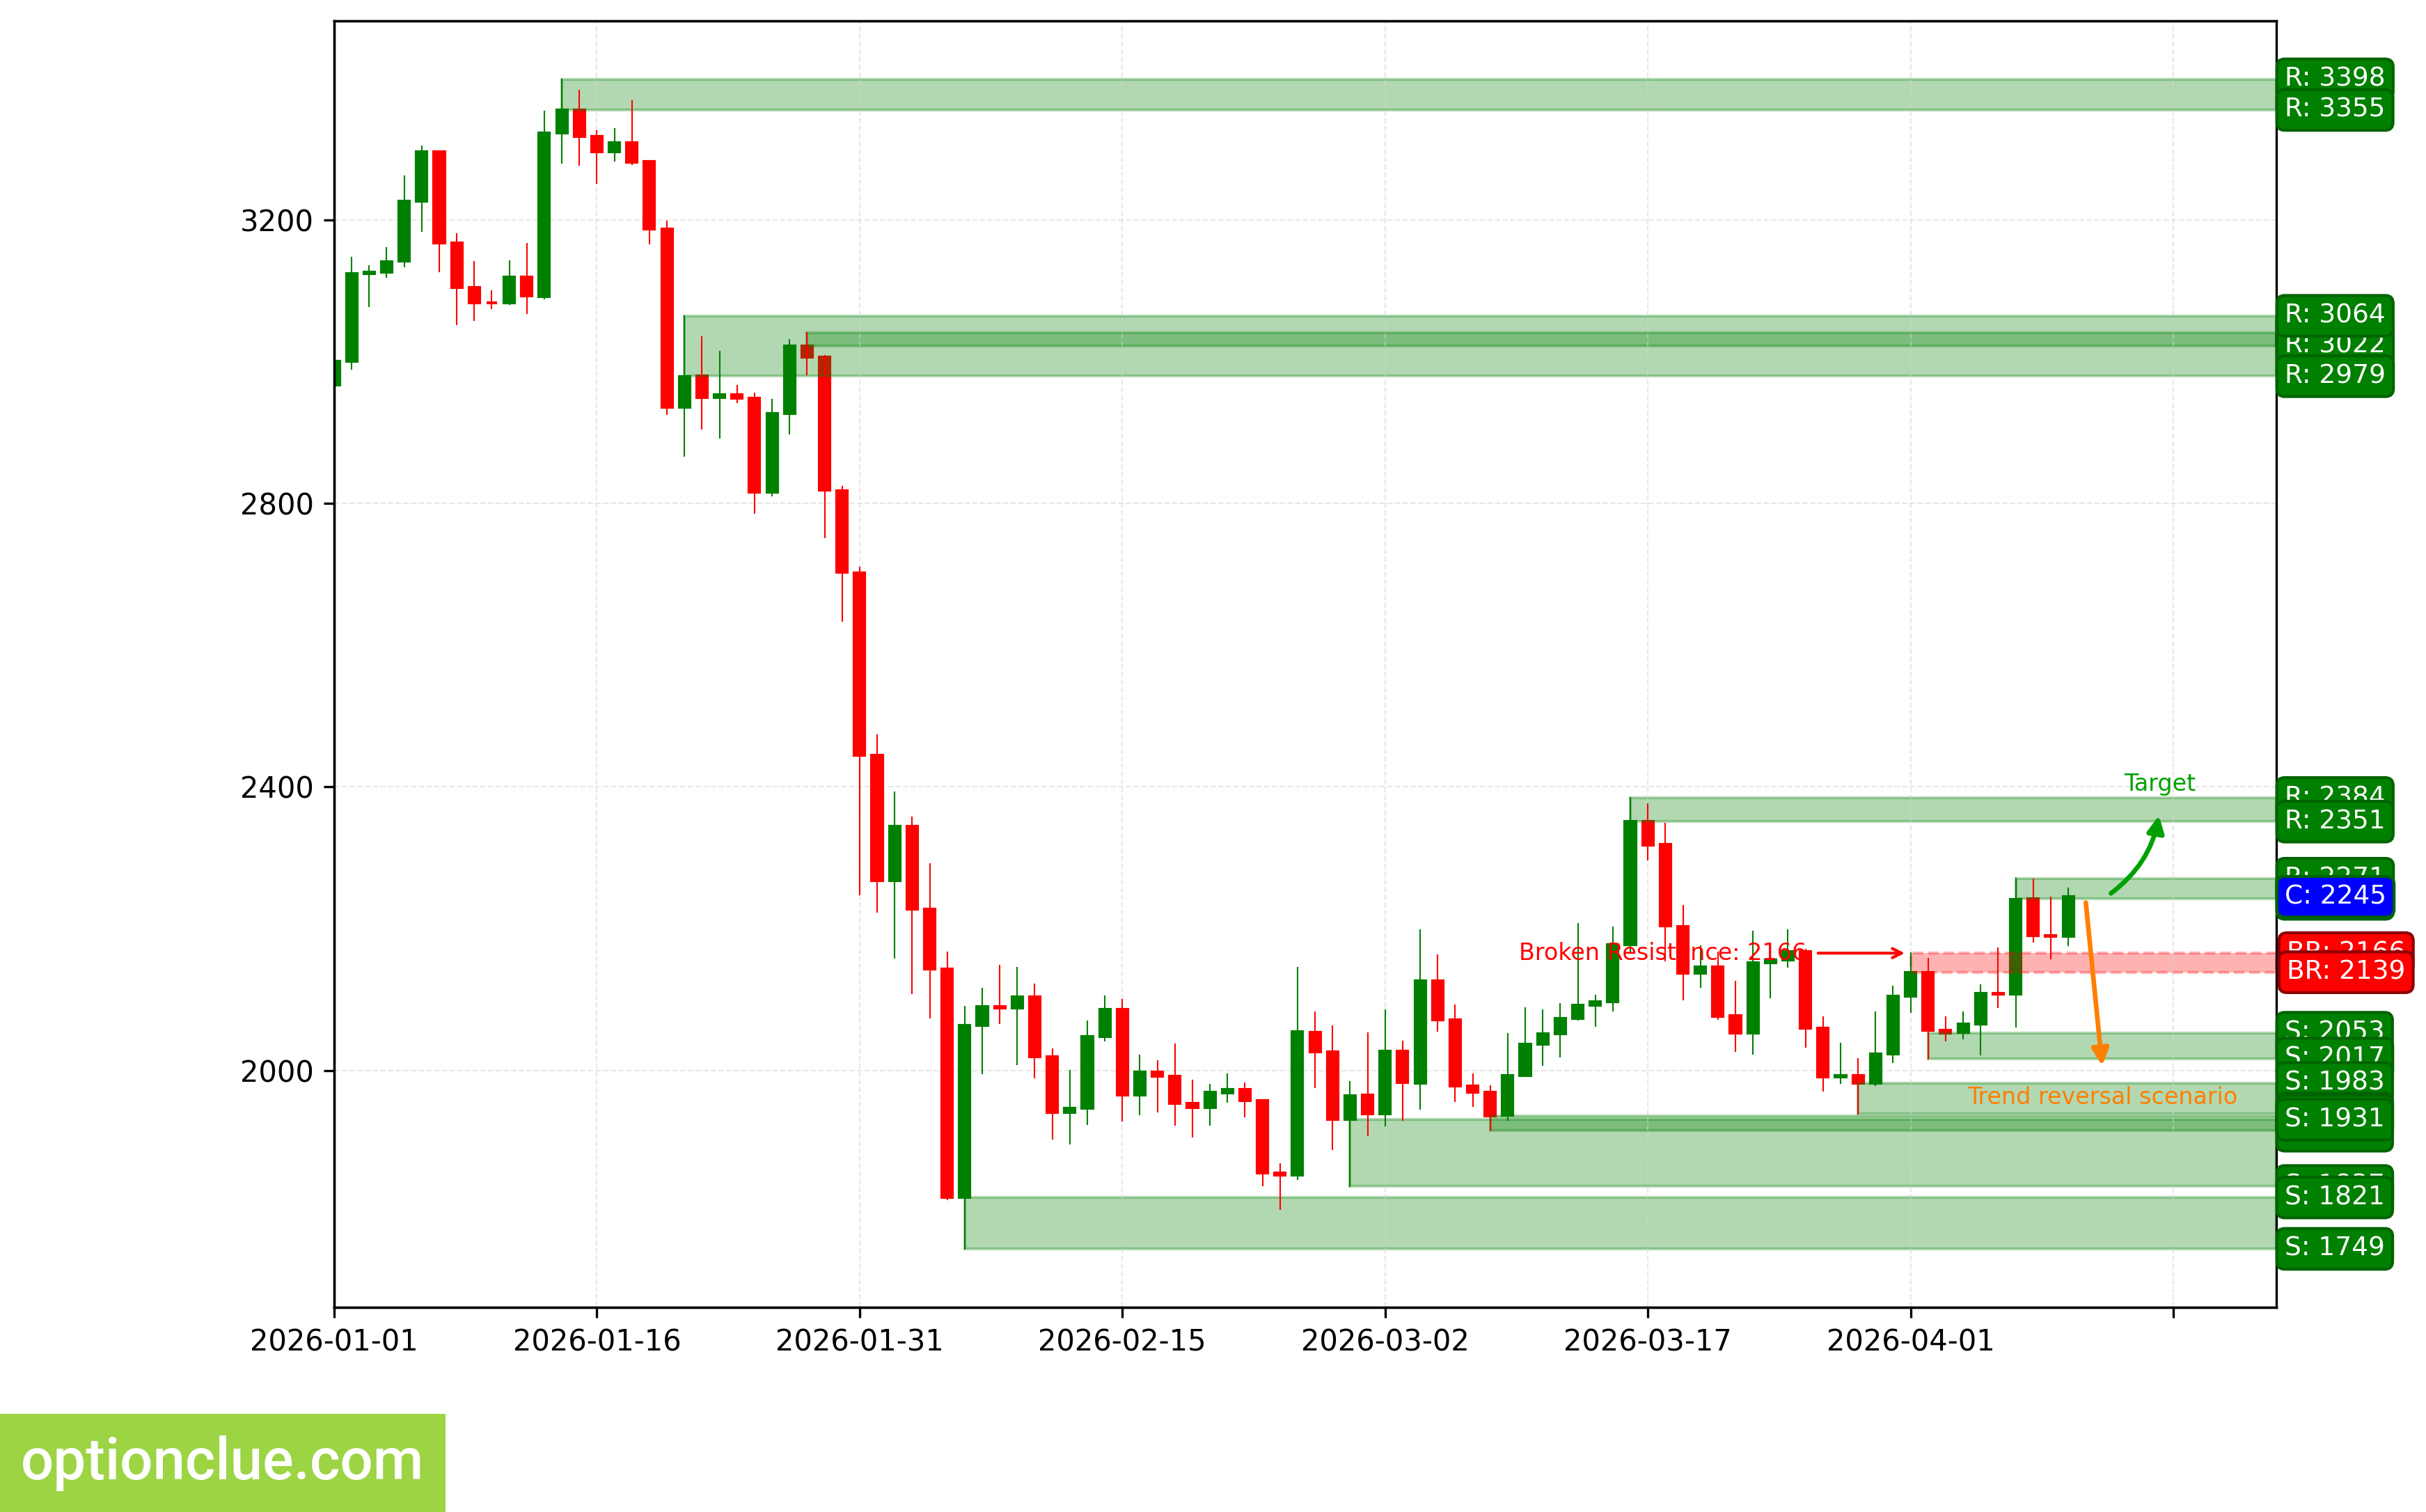
The trend has turned bullish, when the resistance level (2139 — 2166) was broken last week. The breakout occurred 4 candlesticks ago. A corrective wave is developing.
The intermediate target for the upward movement is the resistance level with boundaries 2351 — 2384. If the trend develops successfully, the farther target will be at the resistance level with boundaries 3022 — 3041.
If the correction completes near the support level (2017 — 2053), the potential profit/risk ratio may be around 2.7:1. Using the farther target — around 8.6:1. If the correction completes near the last broken level (2139 — 2166), the potential profit/risk ratio may be insignificant (around 0.9:1). Using the farther target — around 3.8:1.
Long positions will remain relevant as long as the market is above the nearest support level with boundaries 2017 — 2053. If the market successfully closes below this nearest support, the trend will reverse to the opposite (bearish).
ETH. Technical analysis. D1.
Apple Inc (AAPL)
The trend has turned bullish, when the resistance level (254.10 — 257.00) was broken 5 candlesticks ago. 3 candlesticks ago the correction completed, an impulse wave is developing.
The intermediate target for the upward movement is the resistance level with boundaries 261.09 — 262.48. If the trend develops successfully, the farther target will be at the resistance level with boundaries 274.95 — 276.11.
From current prices, the profit/risk ratio when setting targets and fixing risks at daily timeframe levels may be insignificant (less than 0.1:1). Using the farther target — also small (approximately 0.7:1).
Long positions will remain relevant as long as the market remains above the nearest support level with boundaries 245.70 — 253.50. If the market successfully closes below this support, the trend will reverse to the opposite (bearish).
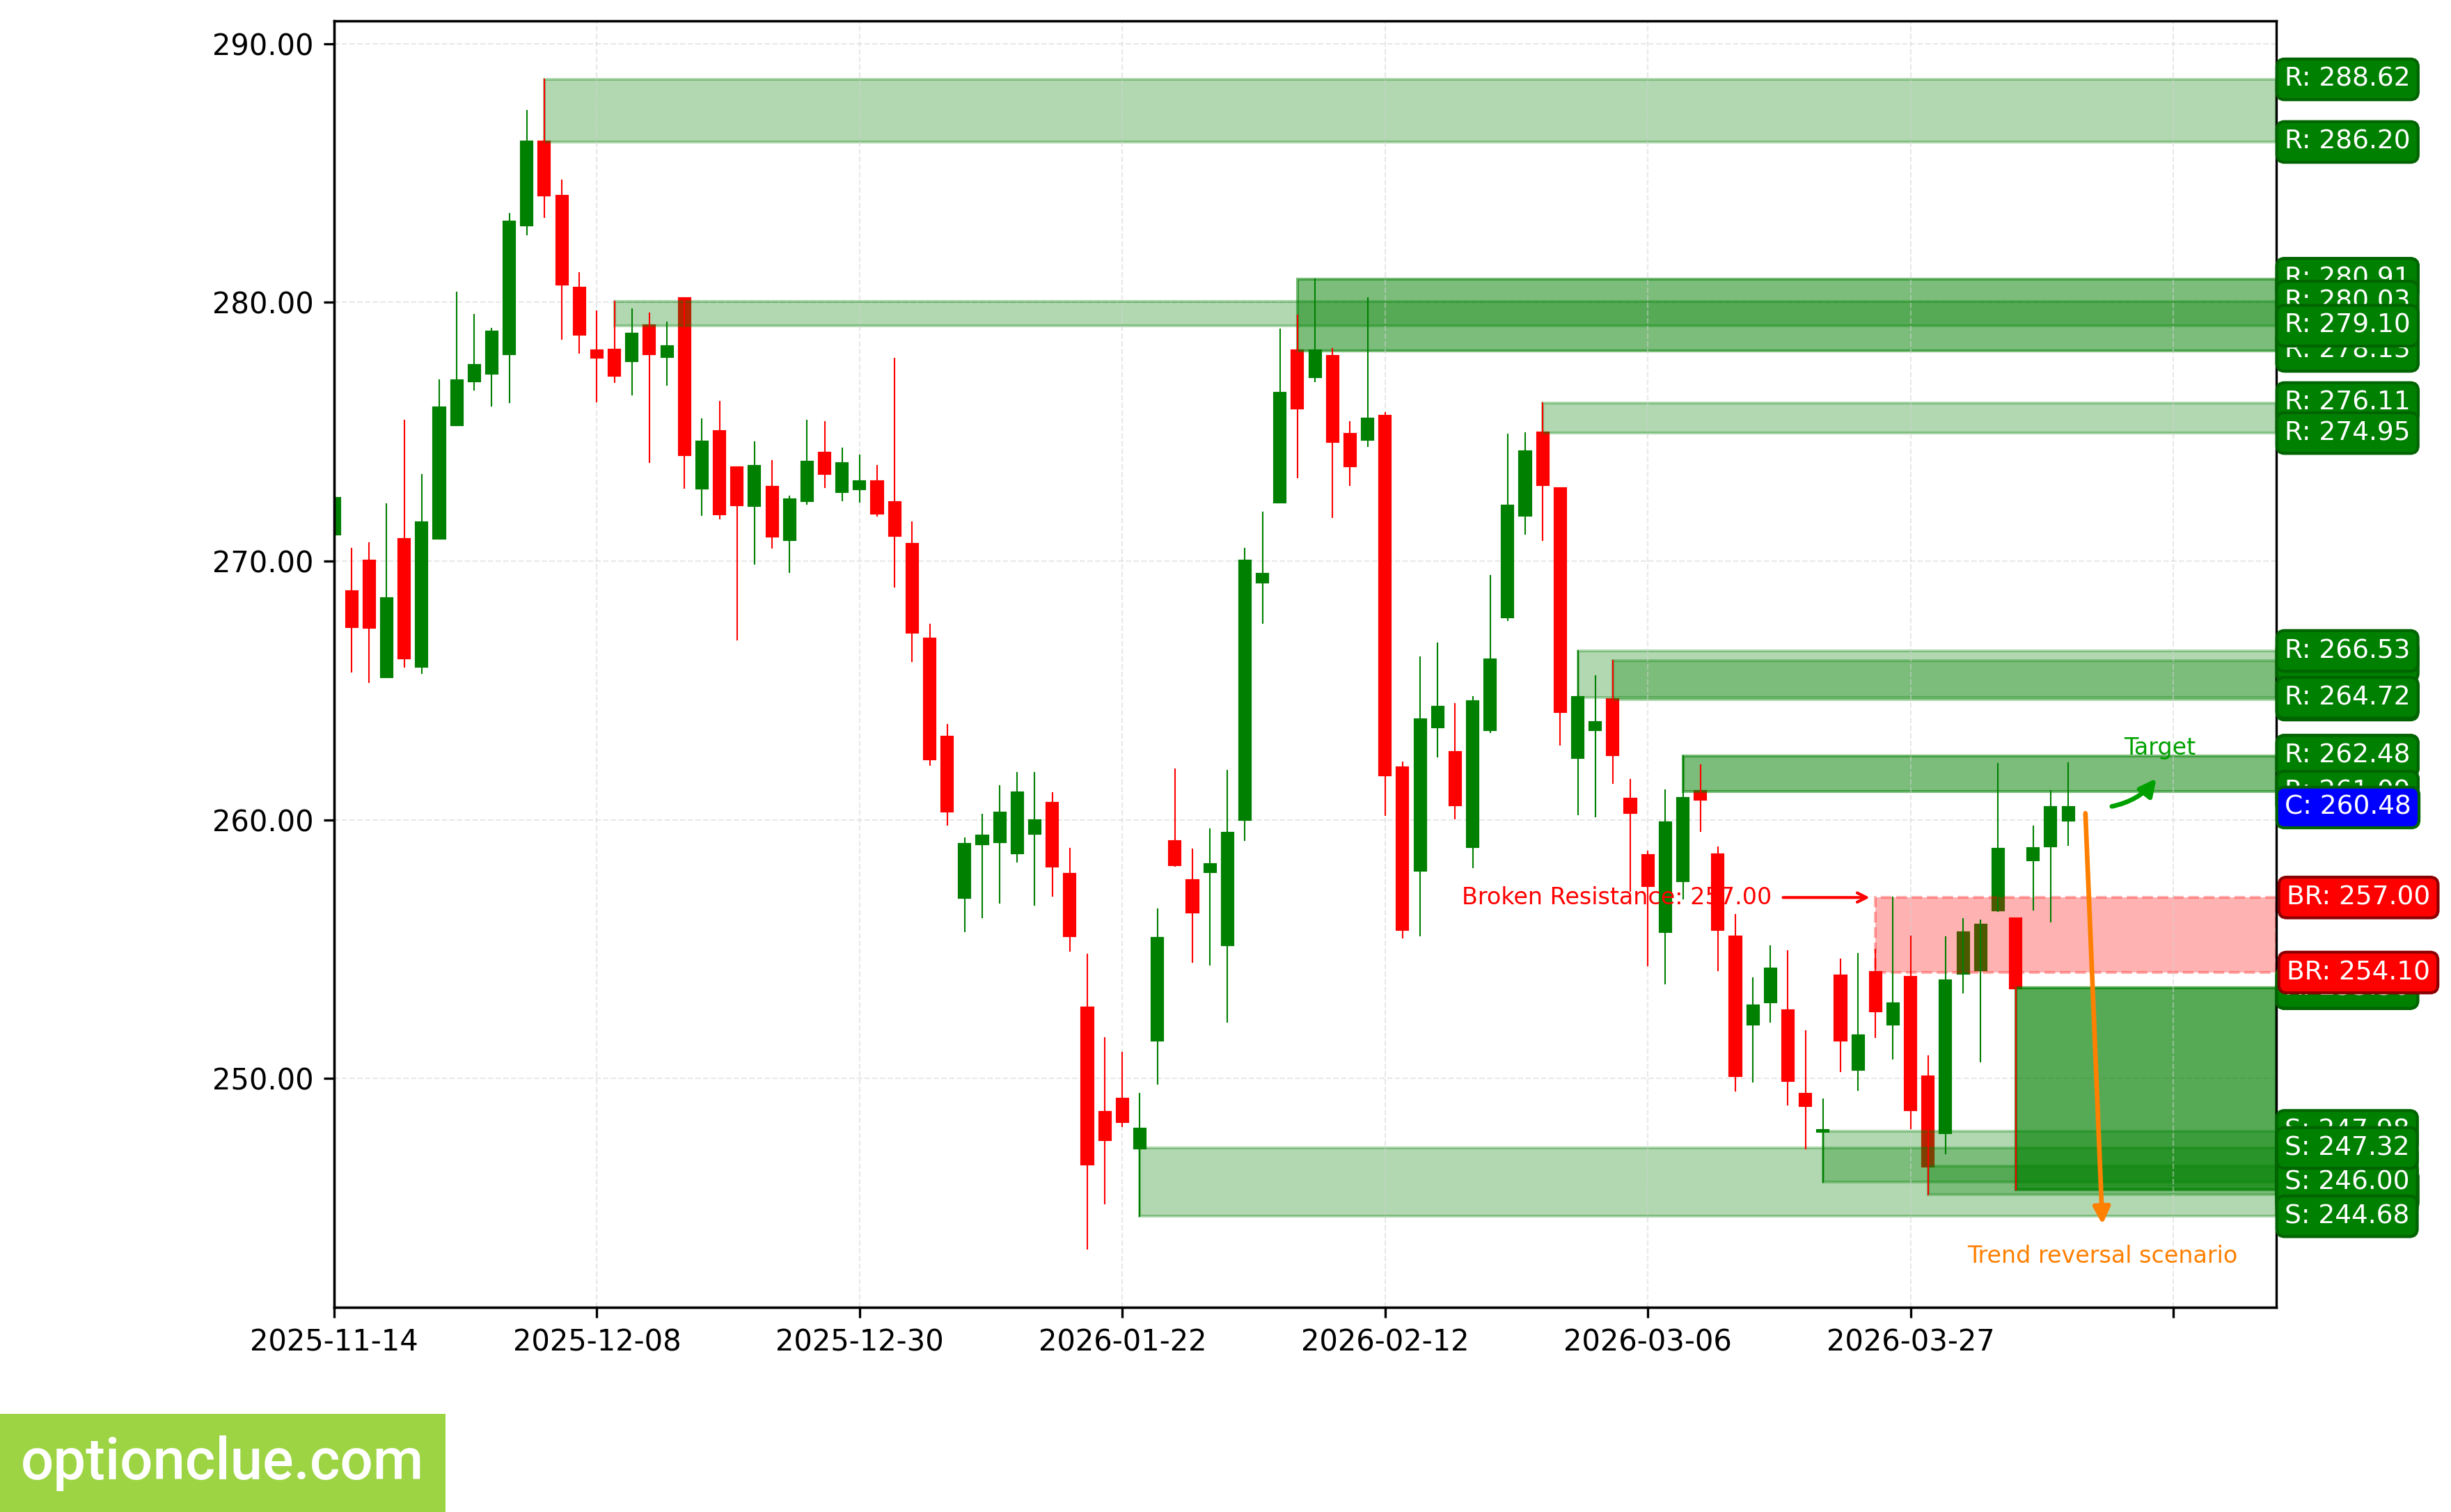
AAPL. Technical analysis. D1.
NVIDIA Corp (NVDA)
The trend has turned bullish, when the resistance level (178.68 — 181.22) was broken 3 candlesticks ago. Price bounced from the support zone (180.30 — 181.84), an impulse wave is developing.
The intermediate target for the upward movement is the resistance level with boundaries 195.56 — 197.63. If the trend develops successfully, the farther target will be at the resistance level with boundaries 208.08 — 211.34.
If the next correction completes near the support level (180.30 — 181.84), the potential profit/risk ratio may be approximately 2.4:1. Using the farther target — around 4.4:1.
Long positions will remain relevant as long as the market remains above the nearest support level with boundaries 180.30 — 181.84. If the market successfully closes below this support, the trend will reverse to the opposite (bearish).
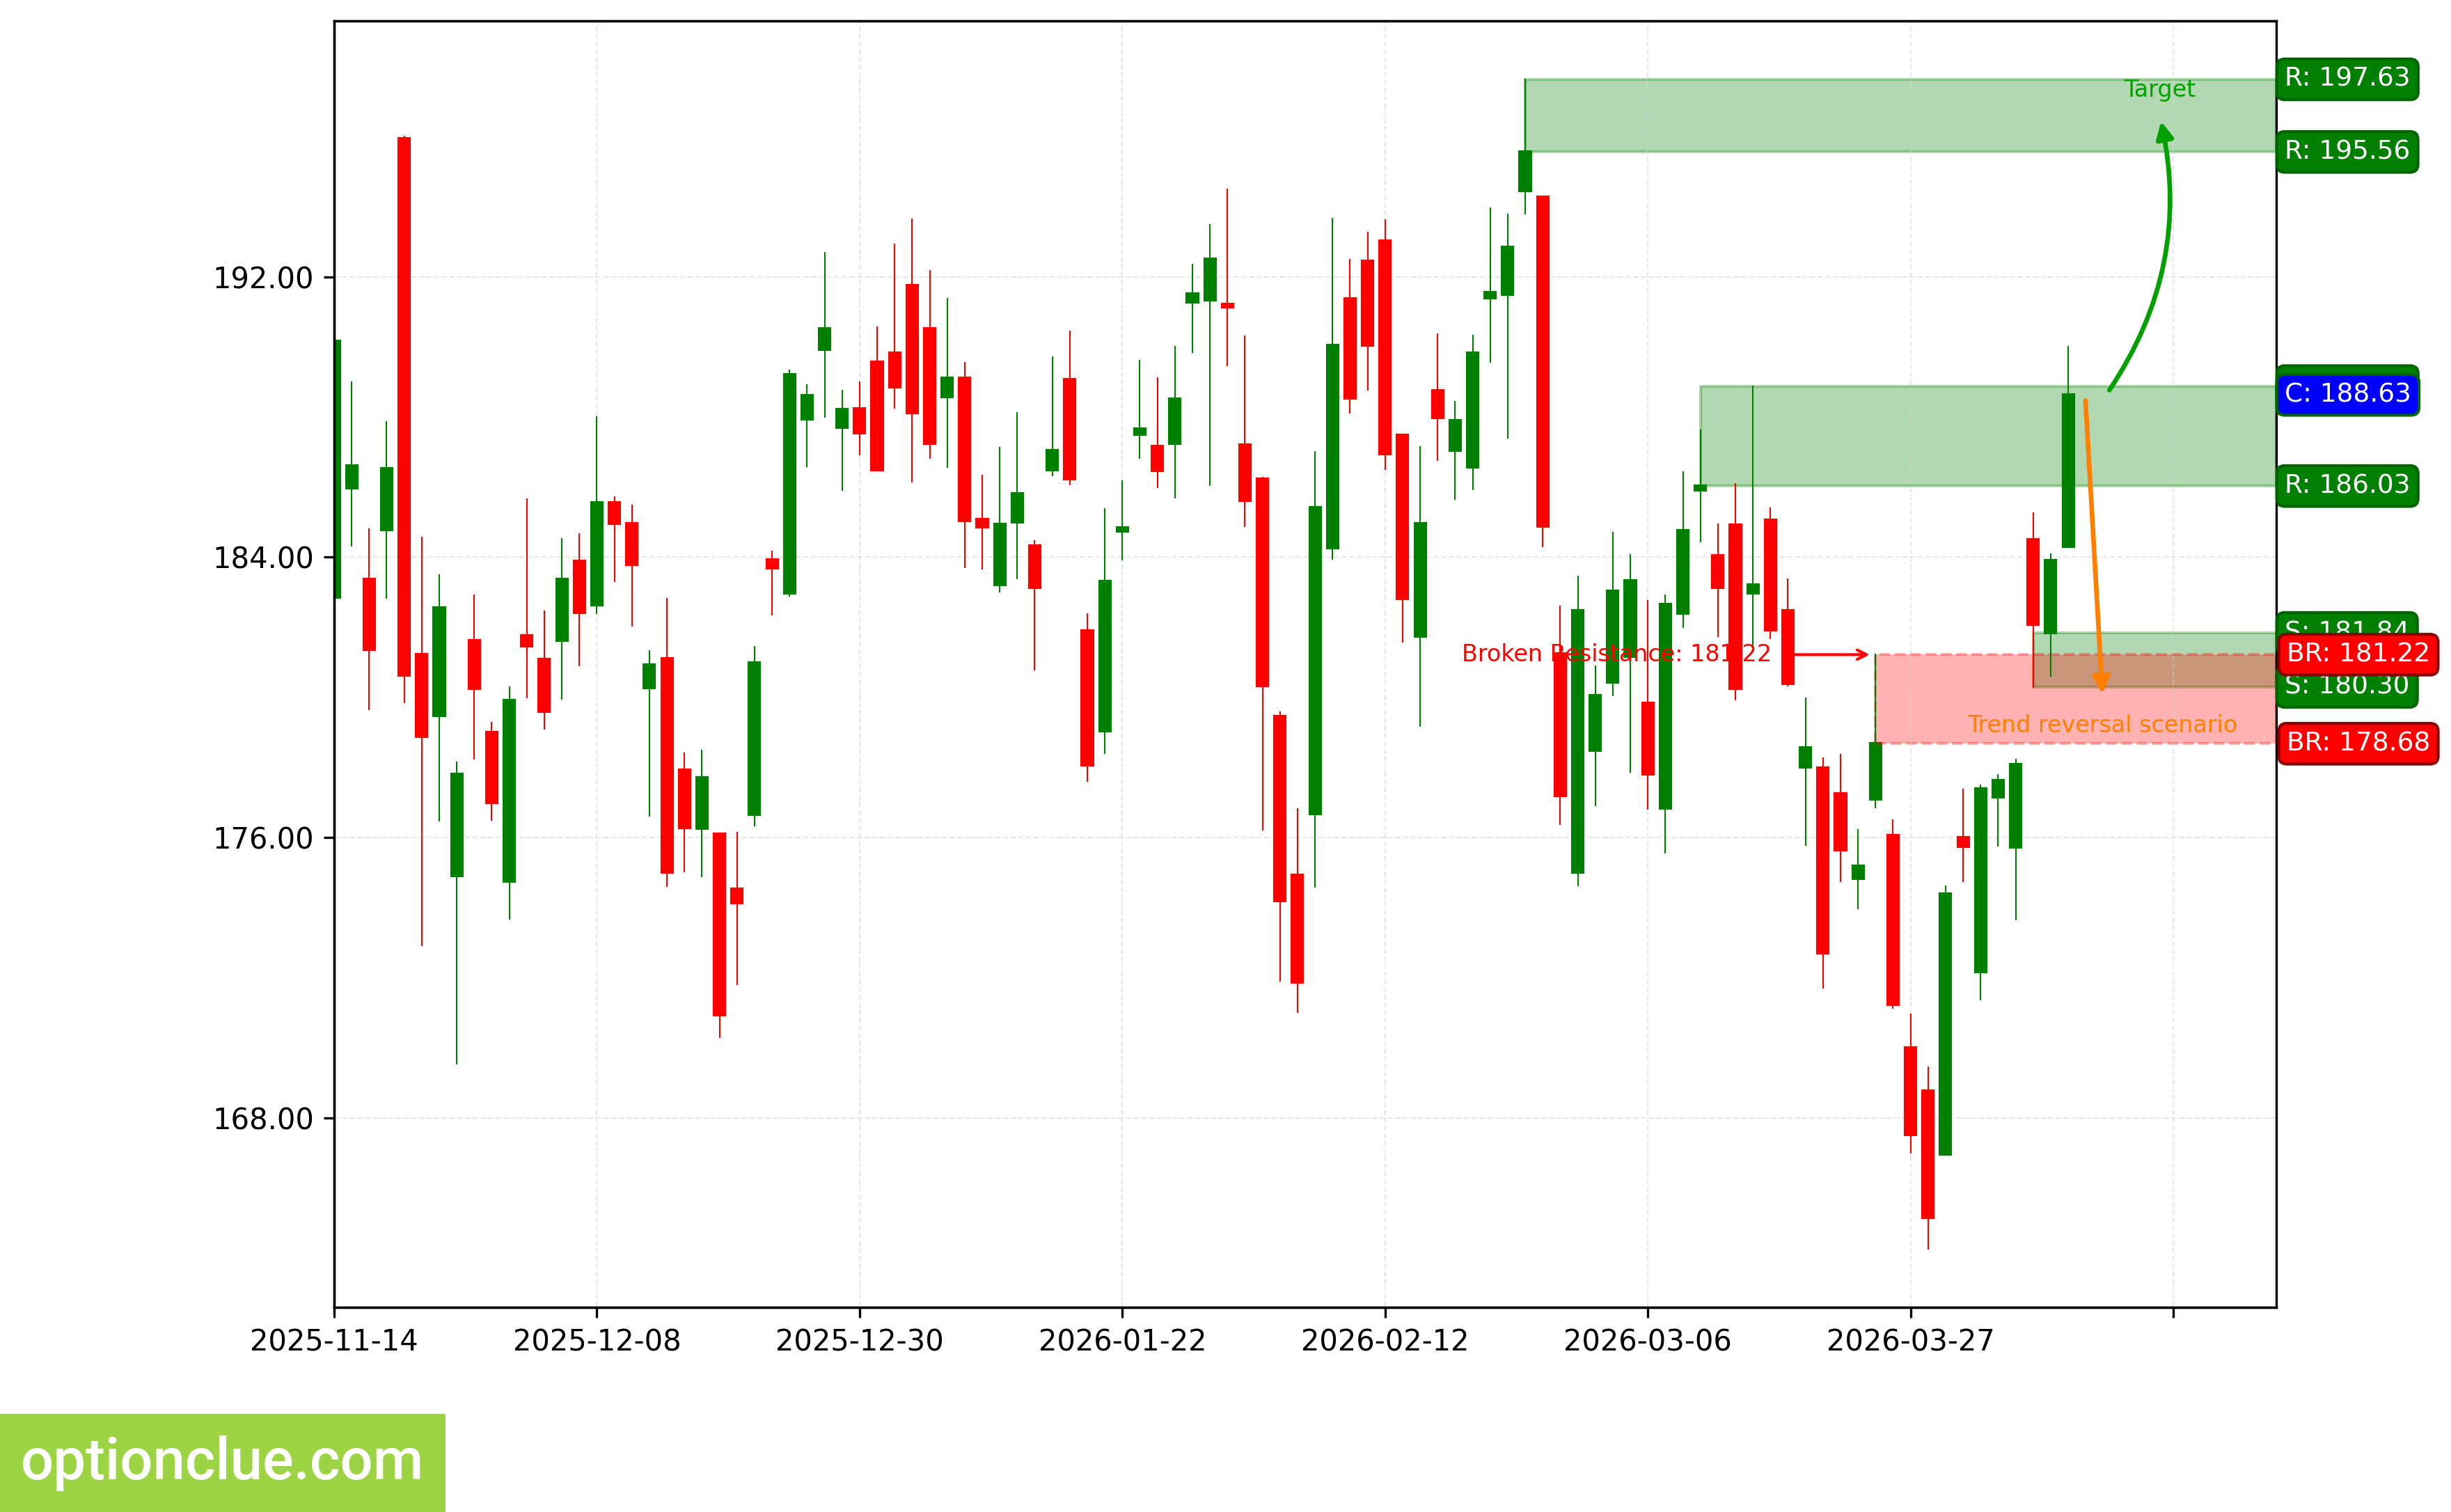
NVDA. Technical analysis. D1.
Tesla Inc (TSLA)
The bearish trend continues, a corrective wave is developing. An entry point for selling may form after the current correction completes. The last broken level is support (352.14 — 355.28). The breakout occurred 4 candlesticks ago.
The intermediate target for the downward movement is the support level with boundaries 337.25 — 343.15. If the trend develops successfully, the farther target will be at the support level with boundaries 300.41 — 305.30.
The potential profit/risk ratio from current prices when setting targets and fixing risks at daily timeframe levels may be small (around 0.1:1). Using the farther target — also small (approximately 0.9:1). If the new correction completes near the resistance level (381.26 — 383.14), the potential profit/risk ratio may be approximately 2.3:1. Using the farther target — around 4.6:1. If the correction completes near the last broken level (352.14 — 355.28), the potential profit/risk ratio may be small (around 0.2:1). For the farther target — around 1.1:1.
Short positions will remain relevant as long as the market remains below the nearest resistance level with boundaries 381.26 — 383.14. If the market successfully closes above this nearest resistance, the trend will reverse to the opposite (bullish).
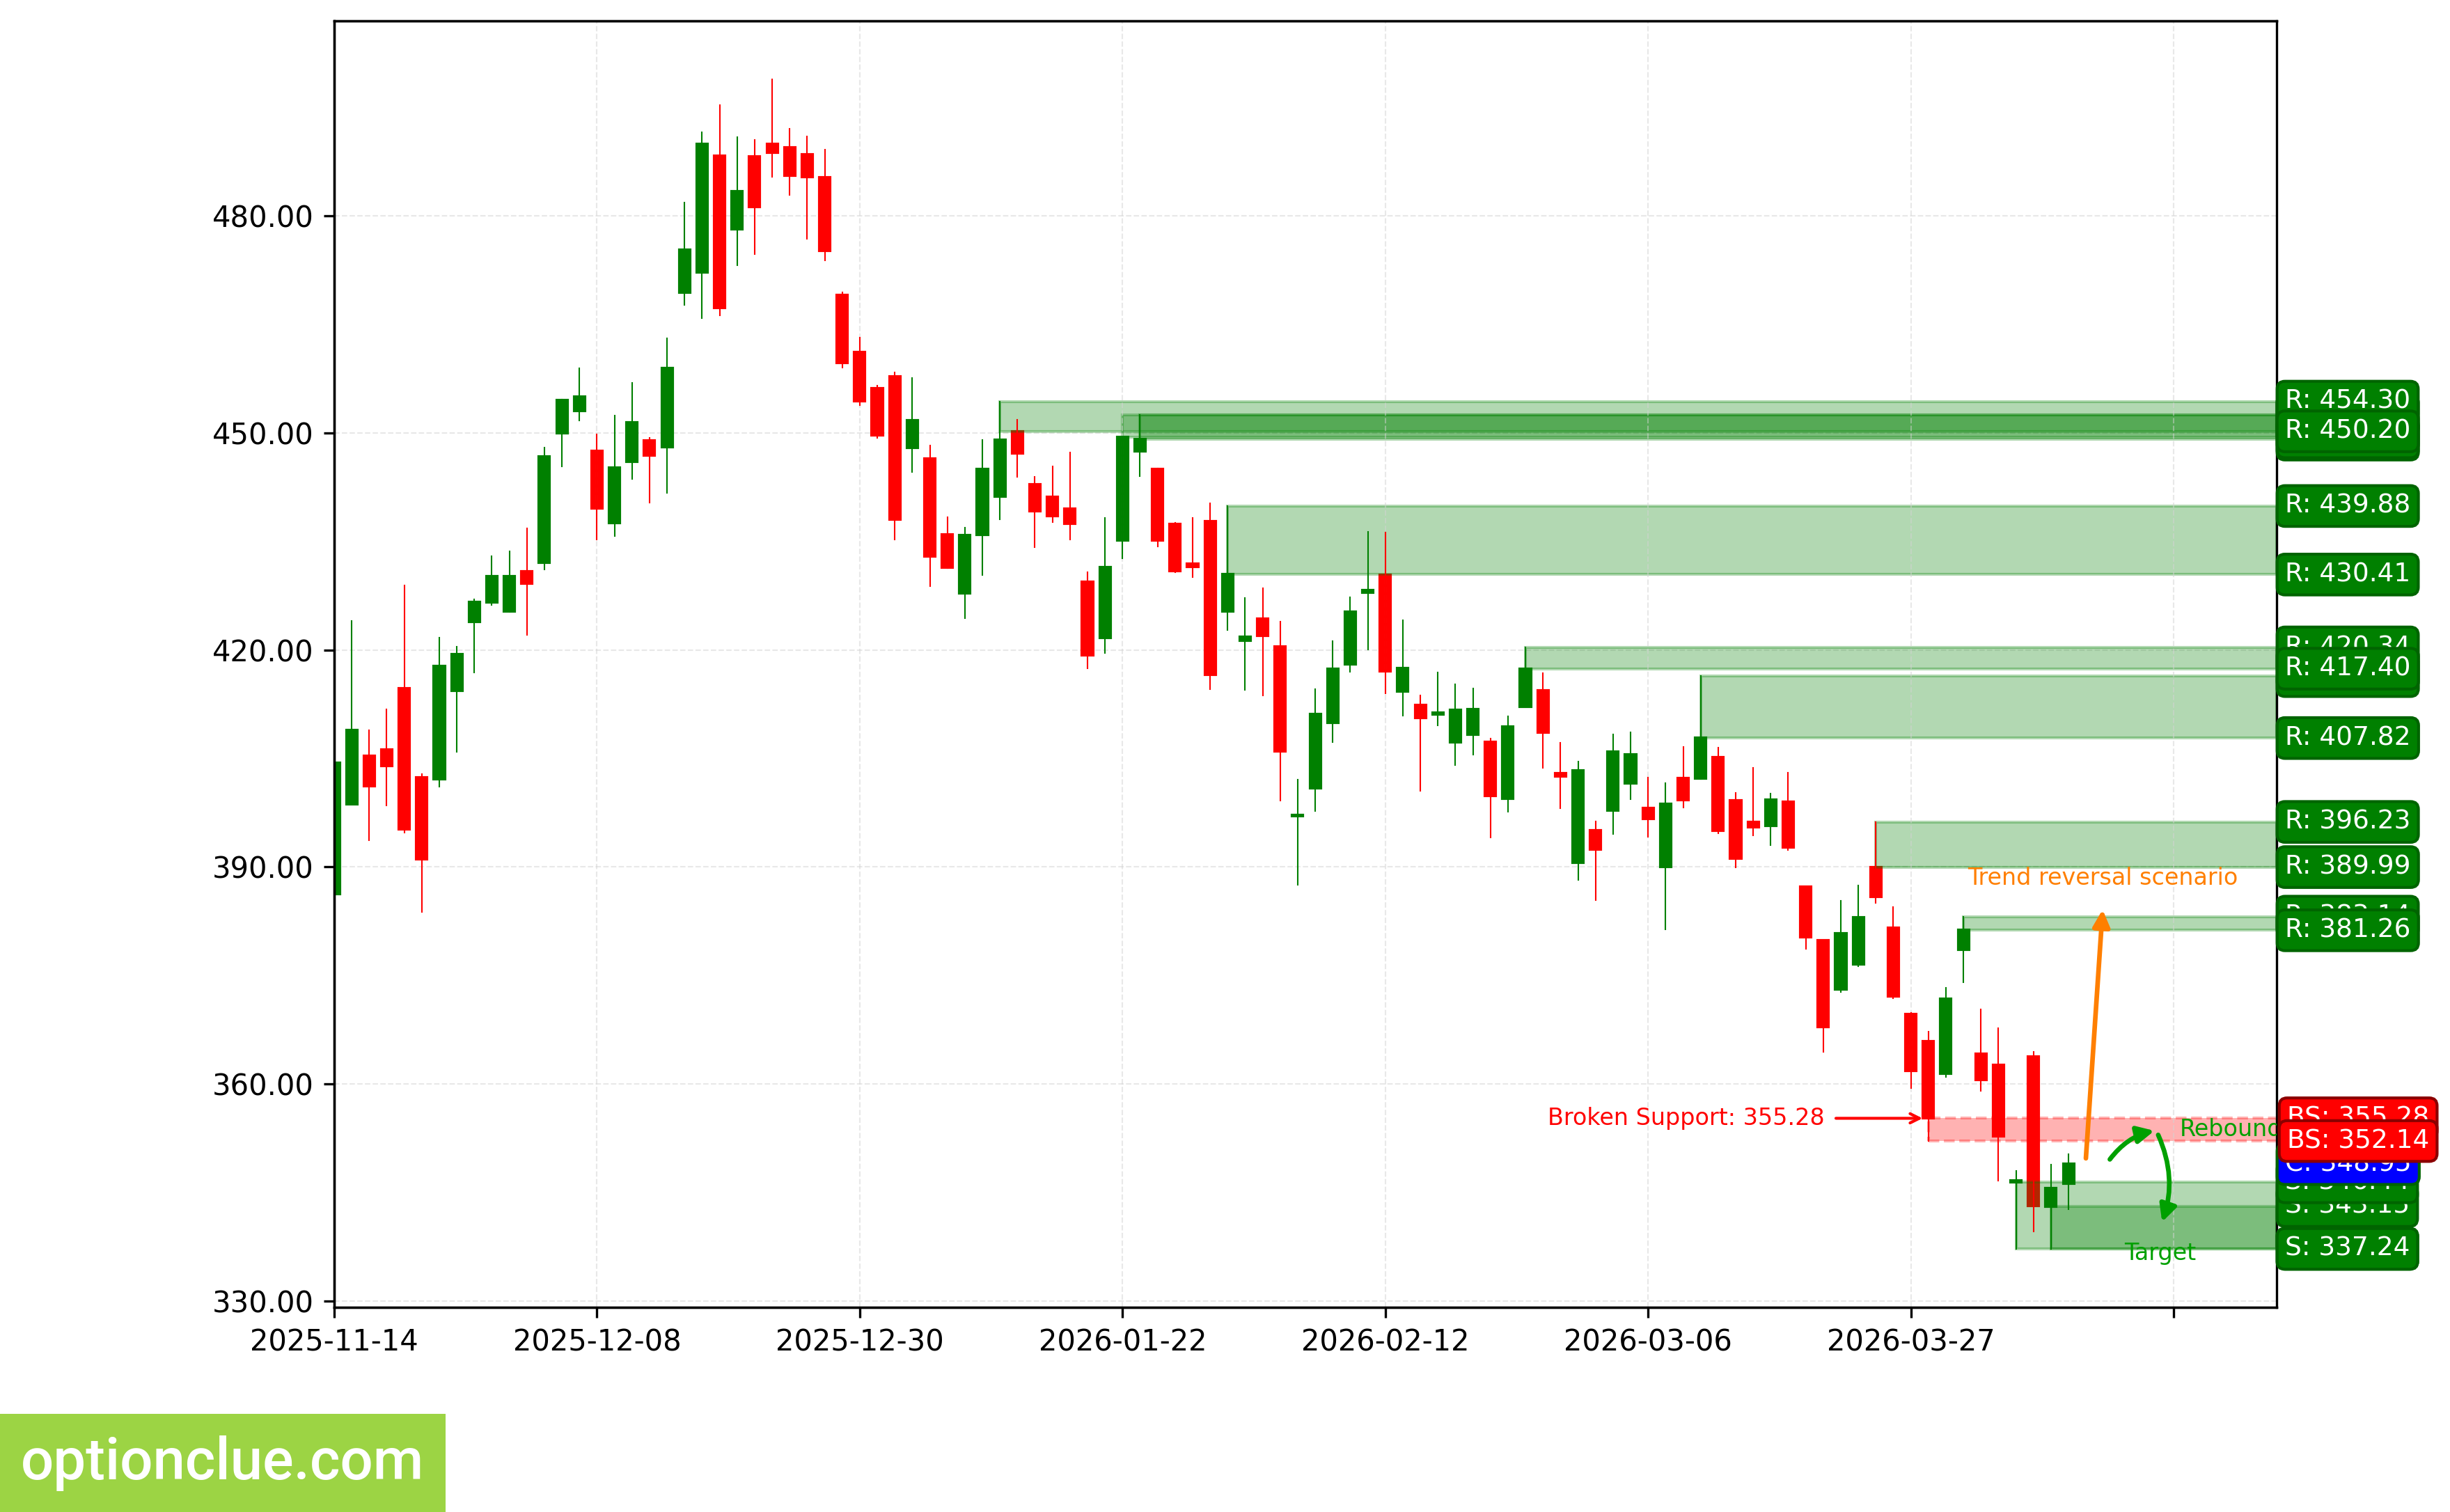
TSLA. Technical analysis. D1.
Summary
From a medium-term trading perspective, financial instruments with correction nearing completion on Daily and/or potentially the most promising profit-to-risk ratios include: ETH, USDCAD. Soon may be worth attention depending on the depth of market correction: AUDUSD, USDCHF, TSLA.
The remaining financial instruments on the trading list may also be interesting, but rebound signals on Daily are likely to appear no earlier than in a week.